Article

Multidimensional Seismic Response Analysis of Large-Scale Steel-Reinforced Concrete Frame-Bent Structures in CAP1400 Nuclear Power Plant

1
College of Civil Engineering, Henan University of Technology, Zhengzhou 450001, China
2
Henan Key Laboratory of Grain and Oil Storage Facility & Safety, Henan University of Technology, Zhengzhou 450001, China
3
College of Civil Engineering, Xi’an University of Architecture and Technology, Xi’an 710055, China
*
Authors to whom correspondence should be addressed.
Buildings 2024, 14(5), 1318; https://doi.org/10.3390/buildings14051318
Submission received: 30 March 2024 / Revised: 26 April 2024 / Accepted: 30 April 2024 / Published: 7 May 2024
(This article belongs to the Special Issue High-Performance Composite Construction: Materials and Components)

Abstract

:
Irregularity in the plane layout of a building structure and the vertical discontinuity of lateral resistance components could lead to torsion and result in the brittle failure of a structure. According to the characteristics of the conventional island main building of nuclear power plants, this paper focuses on the conventional island main building of the CAP1400 nuclear power plant (NPP) in Shidaowan as the research object. A prototype structure model of the main building was developed using ABAQUS software. The seismic response of the structure under multidimensional ground motion was studied by inputting the X-direction and Y-direction translational and torsional components of ground motion in ABAQUS. The results demonstrate that the overall transverse displacement of the structure under bidirectional ground motion was significantly higher than that under unidirectional earthquakes, which was about 20%. Under a multidimensional frequent earthquake, the transverse displacement of the structure increased by about 13% on average compared with that under a bidirectional earthquake; the longitudinal increase was the largest, at about 28%. Finally, the lateral displacement of each layer of the steel-reinforced concrete (SRC) frame-bent main building structure with few walls proposed in this article decreased by an average of about 17% compared to the traditional SRC frame-bent main building structure. The longitudinal displacement was reduced by about 14% compared to the traditional SRC frame-bent main building structure.

1. Introduction

Under the action of an earthquake, the collapse or damage of buildings often leads to huge casualties and economic losses. In particular, after earthquake damage, buildings such as nuclear power plants, thermal power plants and another important lifeline engineering buildings will cause urban function paralysis, leading to serious consequences such as social chaos.
The existing seismic damage experience and theoretical research show that the ground motion during earthquakes is a multidimensional and complex motion, including multiple components and combinations such as translation, vertical and torsion dimensions. The seismic torsion response of buildings is an important factor in seismic damage [1]. For some complex structures like nuclear power plants, large-span buildings, dams, towering structures or high-rise buildings, offshore platforms and spatial structures, it is far from enough to analyze the single-dimensional seismic action of the structure only in the seismic analysis and seismic design of the structure under multidimensional seismic action [2,3]. For irregular structures, the horizontal–torsional coupling response was shown to be particularly prominent under seismic action, that is, horizontal vibration along one of the principal axes of an irregular structure with torsional vibration around other axes under seismic action, presenting as coupled horizontal–torsional vibration [3]. This type of coupled seismic response is more severe under multi-dimensional ground motions.
Although the relevant domestic codes [4,5] consider the application scope, structural measures and design methods of a structure due to multidimensional seismic action, most of them refer to the relevant provisions in foreign codes [6], and there are many qualitative provisions which have poor operability. In this paper, due to the requirements of process and equipment operation, there were staggered floors and large-area floor openings in the large SRC frame-bent main building structure. The floor was prone to in-plane deformation under earthquake conditions. As a result, the longitudinal and transverse stiffness of the main plant was different, which made the torsion have a great influence on the seismic performance of the main plant.
Therefore, to comprehensively investigate the seismic response and torsional performance of the large SRC frame-bent structure under multidimensional ground motion, this paper took the engineering example of the main building of the conventional island of CAP1400 NPP in Shidaowan as the research object. Based on the substructure model test, the finite element model (FEM) of the prototype structure was established, and the seismic response of the prototype structure was studied by inputting multidimensional ground motions with different intensities.

2. Torsional Component of Ground Motion

Until now, the ground motions measured by seismic stations have been translational components in three orthogonal directions, with no direct measurements of torsional seismic waves. Nevertheless, real earthquake damage has revealed that while the ground motion produces three orthogonal translational components (u, v and w), it also produces three torsional components [7] (φgx, φgy and φgz, as shown in Figure 1). The seismic response of a structure is the result of the combined action of six related components.
At present, the methodology for selecting the torsional component of ground motion is mainly obtained by the elastic wave theory of ground motion and the two-point difference method [8,9]. It is theoretically reasonable to obtain the torsional component of ground motion through the elastic wave theory of ground motion, but the reliability needs to be verified by the actual torsional component records of ground motion.
Regarding the calculation method of the two-point difference method, if we obtain the observation values u b ( t ) and u a ( t ) of the adjacent two points, and the distance Δx between the two points is much smaller than the wavelength, the ground rotation angle can be obtained from Equation (1) as follows:
θ ( t ) = u b ( t ) u a ( t ) Δ x
In this way, the torsional component around the vertical axis can be obtained from the measured records between two points in the horizontal direction.
For example, if two or more accelerographs are installed in the same direction on a rigid foundation of a building, and these accelerographs record seismic wave information from different points during an earthquake, the torsional component of the seismic input can be obtained using the two-point difference method. Here, “rigid foundation” refers to a foundation where bending and shear deformation in the plane can be neglected. In this case, the torsional component of the seismic wave can be calculated according to Equation (2) as follows:
a θ ( t ) = a g 1 ( t ) a g 2 ( t ) d
where a g 1 ( t ) and a g 2 ( t ) are the acceleration records on two accelerographs in the same direction and d is the distance between the two points. If the unit of a g 1 ( t ) is cm/s2 and the unit of d is cm, then the unit of a θ ( t ) is rad/s2.
Through extensive research conducted by various scholars, significant progress has been made in understanding the torsional component of ground motion. For instance, Tso and Hsu [10] proposed a calculation method for calculating the torsional response of structures under the action of the rotational component of ground motion. The torsional component of ground motion could be estimated from the actual measured seismic acceleration records. Trifunac [11] pointed out that the torsional component of ground motion could be accurately derived from the incident wavelength, the horizontal or vertical Fourier amplitude spectrum or the incident angle of the body wave. Wang and Hu [12] discussed the finite difference method for the rotation component of ground motion and tested the accuracy of the traveling wave method with the finite difference method. Wang and Jiang [13] proposed two methods to obtain the torsional component of ground motion directly from the translational response spectrum. One was the “response spectrum definition method”, and the other was the “approximate response spectrum power spectrum conversion method”. According to the plane harmonic theory in elastic half-space, Sun and Chen [14] proposed a practical engineering method for recording translational components by using ground motion acceleration to artificially synthesize torsional components. Llera and Chopra [15] proposed two simplified methods, “accidental eccentricity” and “response spectrum”, to estimate the impact of torsional components of ground motion on structural seismic response. Li and Sun [16] studied the torsional components produced by Rayleigh waves and Love waves and pointed out the corresponding calculation methods and formulas. Shakib and Tohidi [17] explored the impact of torsional components on the accidental eccentricity of symmetric and asymmetric buildings by using the method of generating torsional components of ground motion with random programs. Moreover, Liu [18] obtained 12 torsional components of typical ground motions by using the two-point difference method and compared and analyzed the structural responses of structures with different natural vibration periods under the action of seismic waves containing torsional components.
It could be seen from the above studies that the torsional component of ground motion has a certain influence on the seismic response of uniform and symmetric structures, and the influence of seismic response is greater. Therefore, for structures with asymmetric, uneven mass and stiffness distribution, it is more necessary to consider the accidental effect of the torsional component of ground motion on the structure.

3. Calculation Program of Torsional Component of Ground Motion Based on MATLAB

Based on the above research, the MATLAB mathematical analysis software (version 9.4) was used to compile the calculation program of the torsional component of ground motion, and the artificially synthesized ground motion rocking component and torsional component acceleration could be obtained (the program is shown in Appendix A), and the specific synthesis steps were as follows:
(1)
According to the selected seismic records, the incident angle of the seismic wave was calculated, and the seismic wave velocity dispersion curve was obtained, and then, the seismic wave velocity C ( f ) was obtained.
(2)
Fourier transform was performed on the translational component w ¨ g ( t ) of ground motion acceleration time history to obtain the translational component Fourier spectrum w ¨ g ( ω ) .
(3)
The frequency amplitude curve w ¨ g ( ω ) and apparent velocity C ( f ) of the translational component were substituted into ϕ ( ω ) = i ω w g ( ω ) 2 C ( f ) to obtain the Fourier spectrum ϕ ¨ gz ( ω ) of the torsional component.
(4)
The Fourier inverse transform of the torsional component Fourier spectrum ϕ ¨ gz ( ω ) was carried out, and the acceleration time history curve ϕ ¨ gz ( t ) of the torsional component was obtained.
Then, taking the RSN578 ground motion record as an example, the acceleration time history curves of the three translational directions of RSN578 with peak accelerations of 196 gal, 166.6 gal, and 127.4 gal were adjusted according to the 8-degree fortification requirement, and the acceleration time history of its horizontal component was obtained, as shown in Figure 2. Finally, the calculated torsional component acceleration of the corresponding RSN578 seismic wave is shown in Figure 3.

4. General Introduction of Test

4.1. Substructure Model Design

In this paper, the steam turbine main building of the Shidaowan CAP1400 NPP was taken as the research object. The prototype structure of the main building was a 12-bay and three-span SRC frame-bent structure, with a length of 125 m, a width of 70 m and a height of 40.67 m. Among them, the T.A~T.E axis was the turbine building; the T.E~T.F axis was a deaerator room; the T.F~T.G axis was an auxiliary span. Considering constraints such as laboratory site conditions, construction difficulty, and budgetary limitations, T4~T6 three-bay and T.A~T.F two-span frame substructures in the prototype structure were selected for a dynamic characteristics test at a 1/7 scale ratio. The schematic diagram of the substructure model selection is shown in Figure 4, while the layout of the model structure in both the horizontal and vertical dimensions can be observed in Figure 5.
The roof type of the prototype structure was a steel truss roof. To simulate the roof system of the prototype structure, an H-shaped steel beam (HN350 × 175 × 7 × 11) was selected in the substructure model, and the height of the upper and lower chords after the reduction was 350 mm. The H-shaped steel beam and SRC column top embedded parts were hinged, as shown in Figure 6.
In the substructure model, the beam and column were both an SRC column and an SRC beam with built-in H-shaped steel, and the H-shaped steel was welded from the Q235 steel plate. The column longitudinal bars were HRB400 bars with diameters of 6 mm and 8 mm, and the stirrups were HPB300 bars with diameters of 6 mm. The detailed section information on each component of the model structure is shown in Table 1. The test results of the concrete and steel material properties are shown in Table 2 and Table 3.

4.2. Dynamic Characteristics Test

The dynamic characteristic test of the structure could analyze the response curve of the structure under natural vibration or resonance conditions and calculated the dynamic characteristics of the structure such as the natural vibration frequency (or natural vibration period), structural vibration mode and damping coefficient. After comparing and analyzing various existing dynamic characteristic excitation methods, the hammering method [19] was ultimately used in this test to evaluate the dynamic characteristics of the substructure model.
The principle of the hammering method was that the structure was excited by the hammer so that horizontal free vibration occurred. Then, the free vibration attenuation curve of the structure was obtained by data-processing software. Finally, the basic dynamic characteristics of the structure such as vibration mode, mode and damping ratio could be obtained by modal fitting. The test instrument used for the dynamic characteristic test in this article was the INV-306 intelligent signal acquisition processing analysis system (as shown in Figure 7), with a minimum sampling frequency of 0.001 Hz, a maximum sampling frequency of 100 kHz, a standard A/D 12-bit sampling accuracy, standard amplitude error of less than 0.1%, and frequency error of less than 0.01%. The DASP analysis software was used for data analysis in power characteristic testing; the 891-II-type horizontal velocity sensors with an effective frequency range of 0.001 Hz to 100 Hz were used for signal acquisition (as shown in Figure 8). The location of the hammering point and the arrangement of the vibration pickup of the substructure model in this paper are shown in Figure 9.

4.3. Test Results

After the structural dynamic characteristic test was completed, the transfer function was obtained from the analysis of random vibration theory [20,21], the modal fitting was carried out through DASP software and finally, the modal shape was edited to obtain the vibration modes of each order of the substructure, as shown in Figure 10. The measured values of the first three dynamic characteristics are shown in Table 4.
The test revealed that the first period of the structure was 0.269 s, characterized by horizontal vibration along the transverse direction with torsional vibration. The second period of the structure was 0.205 s, featuring longitudinal horizontal vibration coupled with torsional vibration. The third period of the structure was 0.195 s, showing torsional vibration around the Z-axis direction. The ratio of the first period of the structure dominated by torsion to the first period of translation was 0.72. Torsion had a great impact on the overall stress of the structure. Due to the special process restrictions of the SRC frame-bent main building, the structural form and load distribution were uneven. This disparity caused a notable discrepancy in the stiffness distribution between the transverse and longitudinal aspects of the structure, thereby intensifying its susceptibility to torsional effects.

5. Dynamic Elastic–Plastic Time History Analysis of SRC Frame-Bent Structure under Multidimensional Earthquake

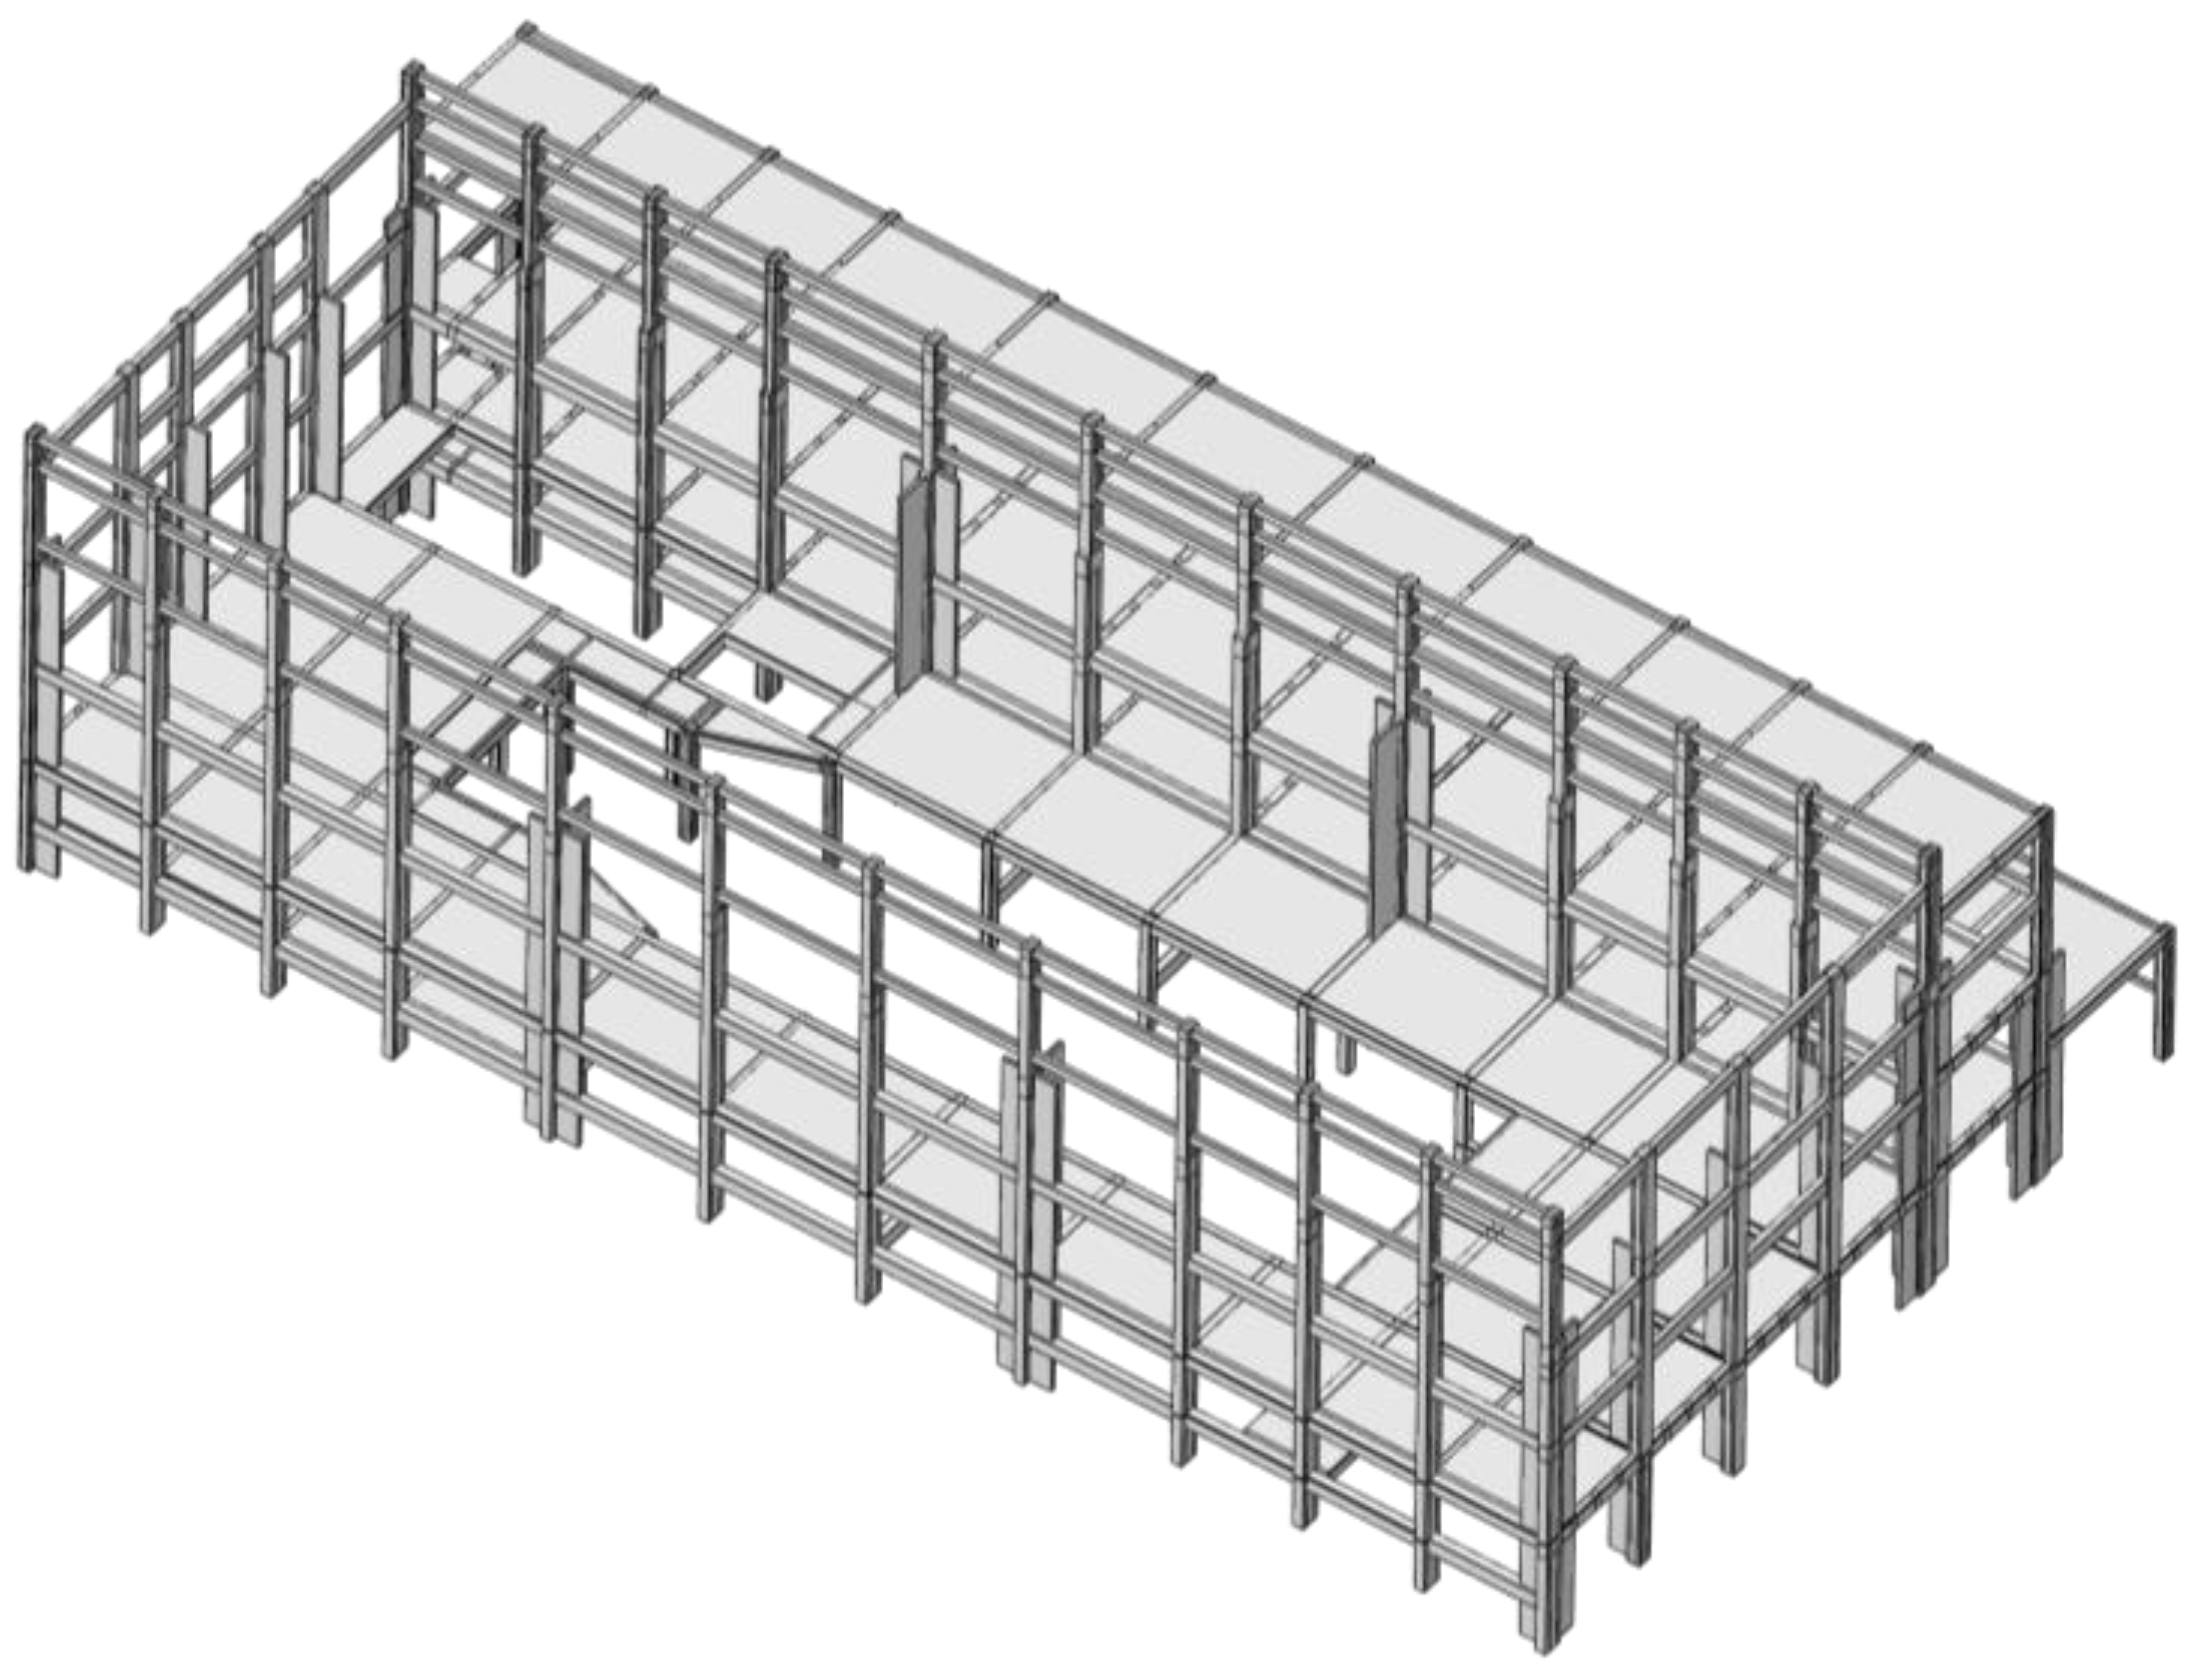
5.1. Finite Element Model of Main Building Structure

Based on the dynamic characteristics test of the substructure model of the SRC frame-bent main building in Section 4, the finite element model (FEM) of the main building structure was established by ABAQUS software, and the elastic–plastic time history analysis of the prototype structure was carried out. The plane column net layout of the SRC frame-bent main building structure is shown in Figure 4, and the section sizes of the main components are shown in Table 5.
Element Selection: A three-dimensional hexahedral linear reduced integral element (C3D8R) [22] was selected to simulate concrete. A three-dimensional truss element (T3D2) was used to simulate reinforcement. A shell element (S4R) was used to simulate section steel.
Material Constitutive Model: For steel, because the double-line elastic–plastic model [22] was relatively convenient, it was convenient to set parameters in the software according to the material property test results, and the calculation efficiency was high, so the double-line elastic–plastic model was adopted for the constitutive relationship of reinforcement and section steel in the FEM of the SRC frame-bent main building structure in this paper. The elastic modulus ratio of steel after yielding was set to 0.01, that is, the elastic modulus of the strengthening stage was 0.01Es, where Es was the elastic modulus of steel and Poisson’s ratio was 0.3.
The values in Table 2 and Table 3 are the engineering stress and strain values obtained from the test. However, the material model in ABAQUS needed to define the true stress and strain value of the material. Therefore, in this paper, the following formulas were used for the specific conversion formulas [23], as shown in Equations (3) and (4):
σ true = σ eng ( 1 + ε eng )
ε true = ln ( 1 + ε eng )
For concrete, for convenience, the concrete damage plasticity model (CDP) [24,25] was built in the material module of ABAQUS finite element software (version 2019), which is generally used in standard and explicit analyses. Based on this, the CDP model was selected to simulate the elastic–plastic behavior and damage evolution process of concrete under earthquake conditions. The average values of concrete compressive strength and tensile strength are shown in Table 4, and Poisson’s ratio was 0.2. The calculation method and value of parameters in the CDP constitutive model were as follows:
(i)
The compression stress–strain curve was defined as follows:
σ = ( 1 d c ) E c ε
d c = { 1 ρ c n / ( n 1 + x n ) 1 ρ c / [ α c ( x 1 ) 2 + x ] x 1 x > 1
ρ c = f c ( E c × ε c , r )
n = E c × ε c , r / ( E c × ε c , r f c , r )
x = ε / ε c , r
(ii)
The tensile stress–strain curve was defined as follows:
σ = ( 1 d t ) E c ε
d t = { 1 ρ t ( 1.2 0.2 x 5 ) 1 ρ t / [ α t ( x 1 ) 1.7 + x ] x 1 x > 1
ρ t = f t ( E c × ε t , r )
x = ε / ε t , r
(iii)
The concrete expansion angle was set to 30 degrees; the eccentricity was 0.1; the ultimate strength ratio of concrete under biaxial and uniaxial compression fb0/fc0 = 1.16; the ratio of normal stress of tension meridian to compression meridian K = 0.6667; the viscosity parameter was 0.005; the calculation method of damage coefficient Dk is shown in Equation (14) as follows:
D k = 1 1 d k   ( k = c , t )
Contact Property: During the test of the SRC frame-bent main building structure studied in this paper, no obvious relative slip between steel and concrete was observed, and in ABAQUS, reinforcement was generally embedded into concrete to simulate reinforced concrete. Therefore, the contact relationship between reinforcement and concrete and between section steel and concrete in the FEM established in this paper adopted the “embedded region” embedded constraint [23].
Boundary Conditions: The setting of boundary conditions was the same as that in the test. Initially, a foundation component was established to facilitate the input of seismic waves. All columns in the FEM showed tie connections on the ground and foundation components. Subsequently, three translational degrees of freedom and three rotational degrees of freedom on the bottom of the foundation component were constrained. The application of load was realized by binding mass blocks on the floor surface. The completed FEM representation of the SRC frame-bent main building structure is shown in Figure 11.

5.2. Model Validation

The calculation results of dynamic characteristics show that the period and frequency of the fourth and later high-order modes of the SRC frame-bent main building structure changed greatly, which were irregular vibration forms of local vibration. Consequently, the first three modes of the main building structure were mainly considered. Finally, the first three vibration modes of the SRC frame-bent main building substructure and the prototype structure were obtained by ABAQUS calculation, as illustrated in Figure 12 and Figure 13, respectively.
Table 6 shows the comparison results of the pseudo-dynamic test and the first three-order dynamic characteristics of the SRC frame-bent main workshop substructure. Table 7 shows the comparison results of the first three-order dynamic characteristics of the prototype structure (according to the pseudo-dynamic test of SRC frame-bent main building substructure, it is converted according to the scale relationship) and the finite element model.
By comparing the results of Figure 12 and Figure 13, as well as Table 6 and Table 7, the following conclusions were derived:
(1)
The transverse basic period of the SRC frame-bent main building substructure was 0.27, and the calculated value by finite element analysis was 0.28, with a deviation of about 4%. The first three frequencies of the prototype structure calculated from the test results of the main building substructure were larger than the finite element values. The main reasons were the scale effect of the substructure and the constitutive selection of the FEM material. The maximum difference between the two ratios was 12%. It could be considered that the FEM could truly reflect the dynamic characteristics of the prototype structure, offering validation for the model’s accuracy.
(2)
The first mode of the SRC frame-bent main building structure was longitudinal translational along the Y direction, the second mode was transverse translational along the X direction and accompanied by torsion and the third mode was in-plane torsion around the Z axis.
(3)
The ratio of the longitudinal and transverse period of the SRC frame-bent main building structure was 0.80, which shows that the longitudinal stiffness and transverse stiffness of the structure were quite different. The ratio of the third-order vibration mode (torsional) period to the first-order vibration mode (longitudinal translational) period of the structure was 0.63 and 0.73, indicating that the torsional stiffness of the structure was relatively large. The horizontal translational vibration modes of each order were mostly accompanied by torsion, and the overall torsional performance of the structure was poor. The torsional effect of the structure should be considered in the elastic–plastic time history analysis of the whole SRC frame-bent turbine main building structure.

5.3. Selection and Input of Ground Motion

The existing research [26] has proven that the uncertainty of ground motion input directly affects the seismic response of a structure. The selected ground motions were different, and the calculated seismic response of the structure was also very different. Article 5.1.2 of China’s Code for Seismic Design of Buildings (GB 50011-2010) [4] stipulates that “When using the time history analysis method, the actual strong earthquake records and artificial simulated acceleration time history curves should be selected according to the type of the building site and the grouping of design earthquakes, in which the number of actual strong earthquake records was not less than 2/3 of the total”. Therefore, the reasonable selection of ground motion is an important prerequisite to ensure the seismic response analysis of structures.
(1)
Selection of ground motion
This study primarily determined seismic parameters by considering the site conditions of the CAP1400 SRC frame-bent turbine main building, China’s Code for Seismic Design of Buildings and the corresponding U.S. standard site categories. The main design parameters selected for the seismic response spectrum of the SRC frame-bent main building structure under eight-degree fortification were as follows:
The design earthquake was divided into the first group, the seismic fortification intensity was eight degrees (the design basic seismic acceleration was 0.2 g); the site category was class III (Tg = 0.45 s), corresponding to class D and E of the site category in the United States Code [27]; the damping coefficient [28] was 0.04; the maximum value of the horizontal earthquake influence coefficient of frequent earthquakes αmax = 0.16; the period reduction factor was 0.9.
According to the above requirements of seismic response spectrum design parameters, 40 ground motions were selected from the Pacific Engineering Earthquake Research Center (PEER), combined with the ground motion selection method based on the design response spectrum given by Qu et al. [29]. The acceleration response spectrum was selected in the period of (0.1 s, Tg) and (T1 − ΔT1, T1 + ΔT2) ground motion with a small difference between the period near the first natural vibration period and the design response spectrum. Finally, eight natural ground motions (the error of their average response spectra in the above two periods was less than 10%) and one artificial wave were selected for elastoplastic time history analysis of the SRC frame-bent main building structure. The acceleration response spectra are shown in Figure 14.
From Figure 13, it is evident that the error between the average response spectrum and the design response spectrum in the double frequency bands of (0.1 s, Tg) and (T1 − 0.2 s, T1 + 0.5 s) was very small, within 10%, which proved that the selected ground motion was suitable for dynamic elastic–plastic time history analysis of the SRC frame-bent main building structure. Table 8 presents detailed information regarding the eight natural ground motions, while the maximum acceleration time history for these motions is outlined in Table 9.
(2)
Input of ground motion
In accordance with item 5.1.1 of the Code for Seismic Design of Buildings (GB 50011-2010) [4], “The torsion effect under bidirectional horizontal earthquake shall be included in the structure with obviously asymmetric mass and stiffness distribution”. In addition, Section 3.2.1 of the Code for Design of Conventional Islands for Nuclear Power Plant (GB/T 50958-2013) [30] prescribed that “For structures with asymmetric mass and stiffness distribution, translational and torsional coupling calculation models should be used”. This was combined with the SRC frame-bent main building structure studied in this paper due to the irregular distribution of shape, mass and stiffness. Therefore, when the time history analysis of ground motion was carried out for the structure, the input mode of ground motion was bidirectional translational component + torsional component. Among them, the maximum acceleration time history of the translational component of the vibration was adjusted according to the X direction (transverse)/Y direction (longitudinal)/Z direction (vertical) = 1:0.85:0.65, while the torsional component was synthesized artificially from the Z-direction translational component.

5.4. Seismic Response of Structures under Horizontal Earthquake

5.4.1. Seismic Response of Structures under Horizontal Unidirectional Earthquake

The overall deformation of the structure played a critical role in ensuring its normal usage and determining its safety and stability. In accordance with the seismic fortification intensity level 8 prescribed in the relevant codes of China [4,30], the elastic–plastic dynamic analysis was conducted on the SRC frame-bent main building structure, considering frequent earthquakes (70 gal), fortification earthquakes (196 gal) and rare earthquakes (400 gal). The transverse maximum deformation seismic response of the structure under unidirectional earthquakes with different intensities is shown in Figure 15.
In Figure 15, the elevations of prototype structures corresponding to each reference point are 10.21 m, 19.24 m, 34.03 m and 38.8 m. The following could be seen from the figure:
(1)
Under the action of a frequent earthquake, fortification earthquake and rare earthquake, the transverse displacement at the height of 38.8 m (top floor) of the structure was within the range of 139~160 mm, 369~434 mm and 784~941 mm, respectively. Among them, for frequent earthquakes with ground motion RSN888, the displacement of the top layer of the structure was the smallest, measuring 139 mm. Under the action of ground motion RSN1640, the maximum displacement of the top layer of the structure amounted to 160 mm. During a fortification earthquake with ground motion RSN1209, the displacement of the top layer of the structure was the smallest, measuring 369 mm. Under the action of ground motion RSN1640, the maximum displacement of the top layer of the structure was 434 mm. Under rare earthquake action, when ground motion RSN888 acted, the displacement at the top of the structure was the smallest, which was 784 mm. When ground motion RSN1640 acted, the displacement of the top layer of the structure peaked at 941 mm, bringing the structure close to collapse.
(2)
Under the action of the three-level earthquake, the transverse displacement of the structure increased with the increase in the structure height, and the deformation of the top floor was the largest. Compared with the displacement at the same height of the structure, it gradually increased with the increase in ground motion intensity. When the height of the structure exceeded 34.03 m, the transverse displacement of the structure increased significantly with the increase in height. The average value of the transverse displacement under the action of frequent earthquakes, fortified earthquakes and rare earthquakes was 150 mm, 398 mm and 842 mm, respectively. Among them, the transverse deformation of the column top (38.8 m) at the E-axis and T6-axis of the turbine room proved to be the most significant.

5.4.2. Seismic Response of Structure under Horizontal Bidirectional Earthquake
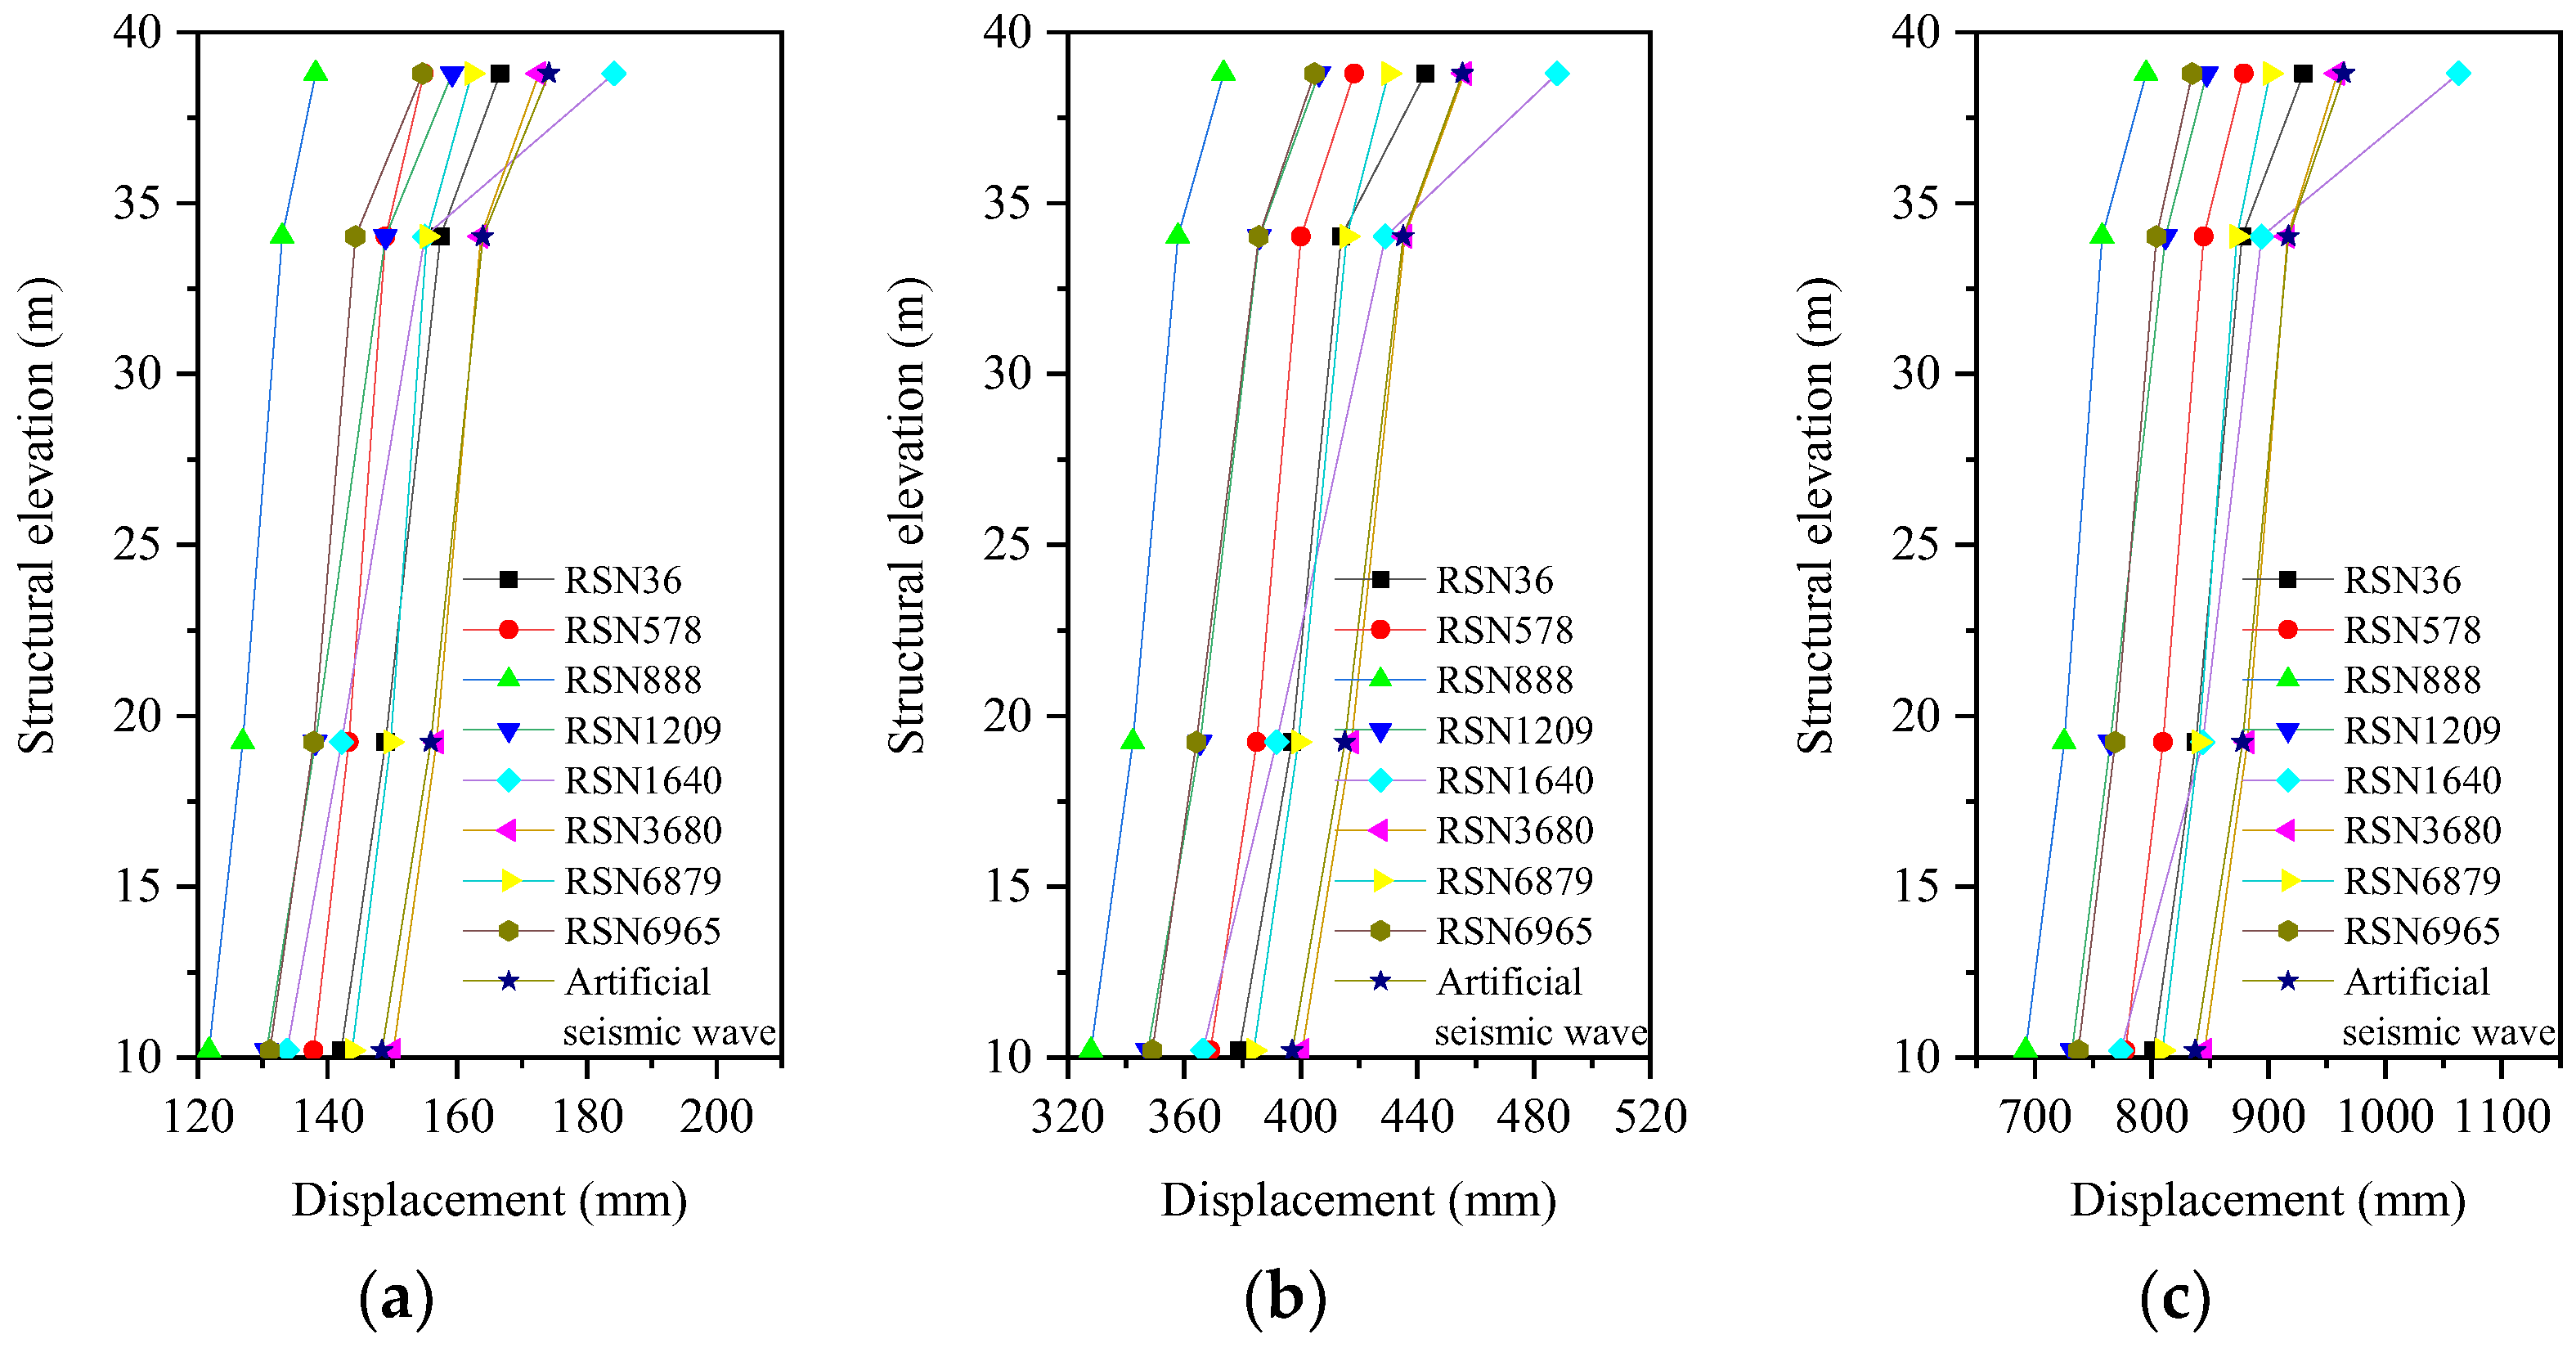
Simultaneously, the translational components of ground motion in the X and Y directions were input, and the peak ground acceleration (PGA) of ground motion in the Y direction was adjusted to 59.5 gal, 166.6 gal and 340 gal. The dynamic elastic–plastic analysis of the SRC frame-bent main building structure under an 8-degree frequent earthquake, an 8-degree fortification earthquake and an 8-degree rare earthquake was carried out.
Figure 16 and Figure 17 depict the overall deformation of the structure under bidirectional earthquakes with varying intensities.
The following could be seen from Figure 16 and Figure 17:
(1)
When subjected to bidirectional earthquakes of differing intensities, the transverse displacement of the structure at the height of 38.8 m was 138~184 mm, 373~488 mm and 795~1063 mm, respectively. The longitudinal displacement of the structure was 116~187 mm, 313~502 mm and 674~1064 mm. In the context of frequent earthquakes, the maximum transverse displacement of the top layer of the structure was 184 mm under ground motion RSN1640, while the minimum longitudinal displacement was 116 mm. Contrastingly, with ground motion RSN888, the top layer exhibited the least transverse displacement at 138 mm and the largest longitudinal displacement of 187 mm. During a fortification earthquake, when ground motion RSN1640 acted, the transverse displacement of the top layer of the structure was the largest, which was 488 mm. The minimum longitudinal displacement was 312 mm. Under the action of earthquake RSN888, the transverse displacement of the top layer of the structure was the smallest, 373 mm, and the longitudinal displacement was the largest, 502 mm. Under rare earthquakes, when ground motion RSN1640 acted, the transverse displacement of the top layer of the structure was the largest, which was 1063 mm, and the longitudinal displacement was the smallest, which was 674 mm. When ground motion RSN888 acted, the transverse displacement of the top layer of the structure was the smallest, which was 795 mm, and the longitudinal displacement was the largest, which was 1064 mm. Under rare earthquakes, when ground motion RSN1640 acted, the transverse displacement of the top layer of the structure was the largest, 1063 mm, and the longitudinal displacement was the smallest, 674 mm. Under the action of ground motion RSN888, the transverse displacement of the top layer of the structure was the smallest, which was 795 mm, and the longitudinal displacement was the largest, which was 1064 mm.
(2)
Considering the impact of a three-level earthquake, both the transverse displacement and longitudinal displacement of different floors of the structure increased with the increase in structural height, and the top deformation was the largest. Compared with the bidirectional seismic action, when the height of the structure exceeded 34.03 m, the lateral displacement deformation amplitude of the structure was significantly larger than the longitudinal displacement of the structure. Specifically, under the action of an 8-degree frequent earthquake, an 8-degree fortification earthquake and an 8-degree rare earthquake, the transverse displacement at the height of 38.8 m increased by about 7%, 6% and 6% compared with the displacement at 34.03 m (three layers), respectively, while the longitudinal displacement of the structure increased by about 5% compared with the three layers.

5.4.3. Comparative Analysis of Seismic Response of Structures under Unidirectional and Bidirectional Earthquakes

Figure 18 provides a comparison of the average overall deformation of the structure under unidirectional and bidirectional seismic fortification levels.
The analysis of Figure 18 revealed that the transverse displacement of the structure under bidirectional frequent earthquakes, fortification earthquakes and rare earthquakes exceeded that under unidirectional earthquakes. Moreover, as the ground motion intensity increased, the overall displacement of the structure showed a more substantial increase. The top-floor deformation of the structure was most pronounced under bidirectional earthquakes, and as seismic intensity rose, the lateral displacement gradually increased. Specifically, under bidirectional frequent earthquakes, fortification earthquakes and rare earthquakes, the maximum transverse displacement at the top floor of the structure was 163 mm, 430 mm and 908 mm, respectively. This demonstrated an increase of approximately 13 mm, 32 mm and 64 mm compared to the displacement under unidirectional earthquakes, with an average increase of about 8%. Additionally, as the ground motion intensity continued to escalate, the overall lateral deformation of the structure significantly exceeded that experienced under unidirectional earthquake conditions, demonstrating an increase of approximately 8%.

5.5. Comparative Analysis of Seismic Response of Structure under Multidimensional Earthquake

Eight natural ground motion records (RSN36, RSN578, RSN888, RSN1209, RSN1640, RSN3680, RSN6879 and RSN6965) were chosen to investigate the influence of the torsional component of ground motion on structural seismic response. At the same time, the X-direction translational component, Y-direction translational component and torsional component were input. The dynamic elastic–plastic analysis of the SRC frame-bent main building structure under an 8-degree frequent earthquake, an 8-degree fortification earthquake and an 8-degree rare earthquake was carried out. Figure 19 and Figure 20 depict the overall deformation of the structure under multidimensional earthquakes (comprising bidirectional translational components and torsional component) with varying intensities.
The following could be seen from Figure 19 and Figure 20:
(1)
When subjected to multidimensional earthquakes of varying intensities, the transverse displacements of the top layer of the structure were 157~205 mm, 439~543 mm and 879~1140 mm. The longitudinal displacements were 152~268 mm, 381~582 mm and 768~1259 mm. The maximum transverse displacement of the top floor was 205 mm under the action of the RSN1640 earthquake. The minimum longitudinal displacement was 152 mm. Conversely, when ground motion RSN888 occurred, the transverse displacement at the top layer of the structure was the smallest, measuring 157 mm, while the maximum longitudinal displacement was 268 mm. Under the action of a multidimensional fortification earthquake, when ground motion RSN1640 acted, the transverse displacement of the top layer of the structure was the largest, which was 543 mm. The minimum longitudinal displacement was 381 mm. When ground motion RSN888 occurred, the transverse displacement of the top layer of the structure was the smallest, which was 439 mm. The maximum longitudinal displacement was 582 mm. The maximum transverse displacement of the top floor of the structure was 1140 mm under the action of the RSN1640 earthquake, while the minimum longitudinal displacement measured 768 mm. When ground motion RSN888 occurred, the transverse displacement of the top layer of the structure was the smallest, which was 879 mm. The maximum longitudinal displacement was 1259 mm.
(2)
Under the action of the three-level earthquake, both the transverse and longitudinal displacement of each layer of the structure increased with the height of the structure, and the top deformation was the largest. When the height of the structure exceeded 34.03 m, the transverse displacement of the structure increased sharply at the top floor under the action of ground motion RSN1640, and the increase was about 15%, 15% and 12%, respectively, under the three levels. Under the action of ground motion RSN888, the increase in the longitudinal displacement of the structure under three levels was about 20%, 15% and 20%, respectively. When ground motion RSN1209 was applied, the longitudinal displacement of the top floor of the structure increased sharply under the fortification earthquake level, with an increase of about 25%. Under other ground motions, the mean increment in the transverse displacement of the top floor was about 4~8%, and the mean increment in the longitudinal displacement was about 8%. These observations highlight the variations in the seismic response of the structure when different ground motion records were chosen.
Figure 21 and Figure 22 present a comparison of the average values of the overall deformation of the structure under the simultaneous action of unidirectional, bidirectional and multidimensional ground motions with different intensities.
The following could be seen from Figure 21 and Figure 22:
(1)
Under multidimensional frequent earthquakes, the average transverse displacements at each layer of the structure were 145 mm, 158 mm, 167 mm and 177 mm, representing an increase of approximately 14%, 18%, 19% and 18% compared to unidirectional earthquakes. Under multidimensional fortification earthquakes, the average transverse displacement of each layer of the structure was 410 mm, 446 mm, 474 mm and 500 mm, demonstrating an increase of about 20%, 25%, 27%, and 26% compared to unidirectional earthquakes. Under the action of the multidimensional rare earthquake, the average transverse displacement of each layer of the structure was 827 mm, 900 mm, 960 mm and 1005 mm, signifying an increase of around 15%, 19%, 21% and 20% compared to unidirectional earthquakes.
(2)
For bidirectional frequent earthquakes, the average transverse displacement of each layer of the structure was 136 mm, 143 mm, 151 mm and 162 mm. The multidimensional ground motion increased by about 6%, 10%, 10% and 9% compared with the bidirectional earthquakes. Under the bidirectional fortification earthquake, the average transverse displacement of each layer of the structure was 365 mm, 383 mm, 403 mm and 427 mm. The multidimensional ground motion increased by about 12%, 17%, 18% and 17% compared with the bidirectional earthquakes. Under the bidirectional rare earthquake, the average transverse displacement of each layer of the structure was 771 mm, 809 mm, 847 mm and 901 mm. The multidimensional ground motion caused an increase of about 7%, 11%, 13% and 11% compared to bidirectional earthquakes.
(3)
Under multidimensional frequent earthquakes, the average longitudinal displacements of each layer of the structure were 158 mm, 175 mm, 184 mm and 202 mm, representing an increase of about 16%, 23%, 22% and 28% compared to bidirectional earthquakes. Under multidimensional fortification earthquakes, the average longitudinal displacement of each layer of the structure was 390 mm, 425 mm, 444 mm and 492 mm, which was about 7%, 11%, 10% and 17% higher than that under bidirectional earthquakes. The average longitudinal displacement of each layer of the structure under multidimensional rare earthquakes was 793 mm, 862 mm, 894 mm and 977 mm, respectively, displaying an increase of about 5%, 9%, 7% and 11% compared to bidirectional earthquakes.
(4)
Under multidimensional seismic action, under frequent earthquakes, fortification earthquakes and rare earthquakes, the overall transverse displacement of the structure increased by about 20% compared with that under unidirectional earthquakes. Compared with the bidirectional seismic action, the average increase was about 13%. Among them, the longitudinal increase in the structure under multidimensional frequent earthquakes was larger than that under bidirectional earthquakes, with a maximum increase of 28%.
The above analysis results showed that for structures with uneven mass and stiffness distribution, the torsional component of ground motion had a great influence on the seismic response of structures. For the large SRC frame-bent main building structure mentioned, which housed numerous types of power generation equipment on the second and third floors of the structure, along with large openings in the floors, the displacement of the middle layer of the structure was generally substantial under the influence of multi-level earthquakes.

6. Dynamic Elastic–Plastic Time History Analysis of Few-Wall SRC Frame-Bent Structure under Multidimensional Earthquake

6.1. Proposal of the Structural System for the SRC Frame-Bent Structure with Few Walls

Based on the analysis results from Section 5.4 and Section 5.5, it was evident that the SRC frame-bent main building structure had an obvious torsion effect under multidimensional earthquake action compared with unidirectional and bidirectional ground motion. Building upon the aforementioned research outcomes and existing studies [31], a novel structural system for the SRC frame-bent main building was proposed in this paper. By incorporating distributed shear walls within the structural system, these walls could be arranged according to the specific operation process and seismic performance requirements. Consequently, to distinguish this new system from the traditional SRC main building structure, it was referred to as the ‘few-wall SRC frame-bent main building structure’.
Figure 23 illustrates the plan layout of the few-wall SRC frame-bent main building structure, while Figure 24 showcases the structural effect diagram of the SRC frame-bent main building with few walls.
(1)
Plan layout
The longitudinal length of the structure was 120 m and the transverse width was 70 m. There were 12 main axes in the longitudinal direction of the plane column network, among which, the column spacing between the T.1 and T.4 and T.9 and T.12 axes was 10 m, and the column spacing between the T.4 and T.9 axes was 13 m. There were seven main axes in the transverse direction, among which, the distance between the T.A~T.B axes was 10.3 m, the distance between the T.B~T.D axes was 10.7 m, the distance between the T.D~T.E axes was 10.8 m, the distance between the T.E~T.F axes was 13 m and the distance between the T.F~T.G axes was 14.5 m. The shear walls were arranged at the intersection of the T.1, T.5, T.8 and T.12 axes and the T.A–T.F axes. The length of the shear walls was mostly set at 1.8 m, except for those on the T.5 axis between the T.A and T.E axes and the T.8 axis between the T.A and T.E axes, which were 2.6 m. The thickness of the shear walls was 300 mm.
(2)
Vertical arrangement
The total height of the structure was 40.67 m, the elevation of the top of the T.A and T.E axis was 38.8 m, and the elevation of the top of the T.F axis was 34.03 m. The total height of the shear wall arranged at the intersection of the T.A~T.E axis was 28.67 m, and the total height of the shear wall arranged at the intersection of the T.F axis was 19.31 m.

6.2. Analysis of Structural Deformation Performance of SRC Frame-Bent Structure with Few Walls
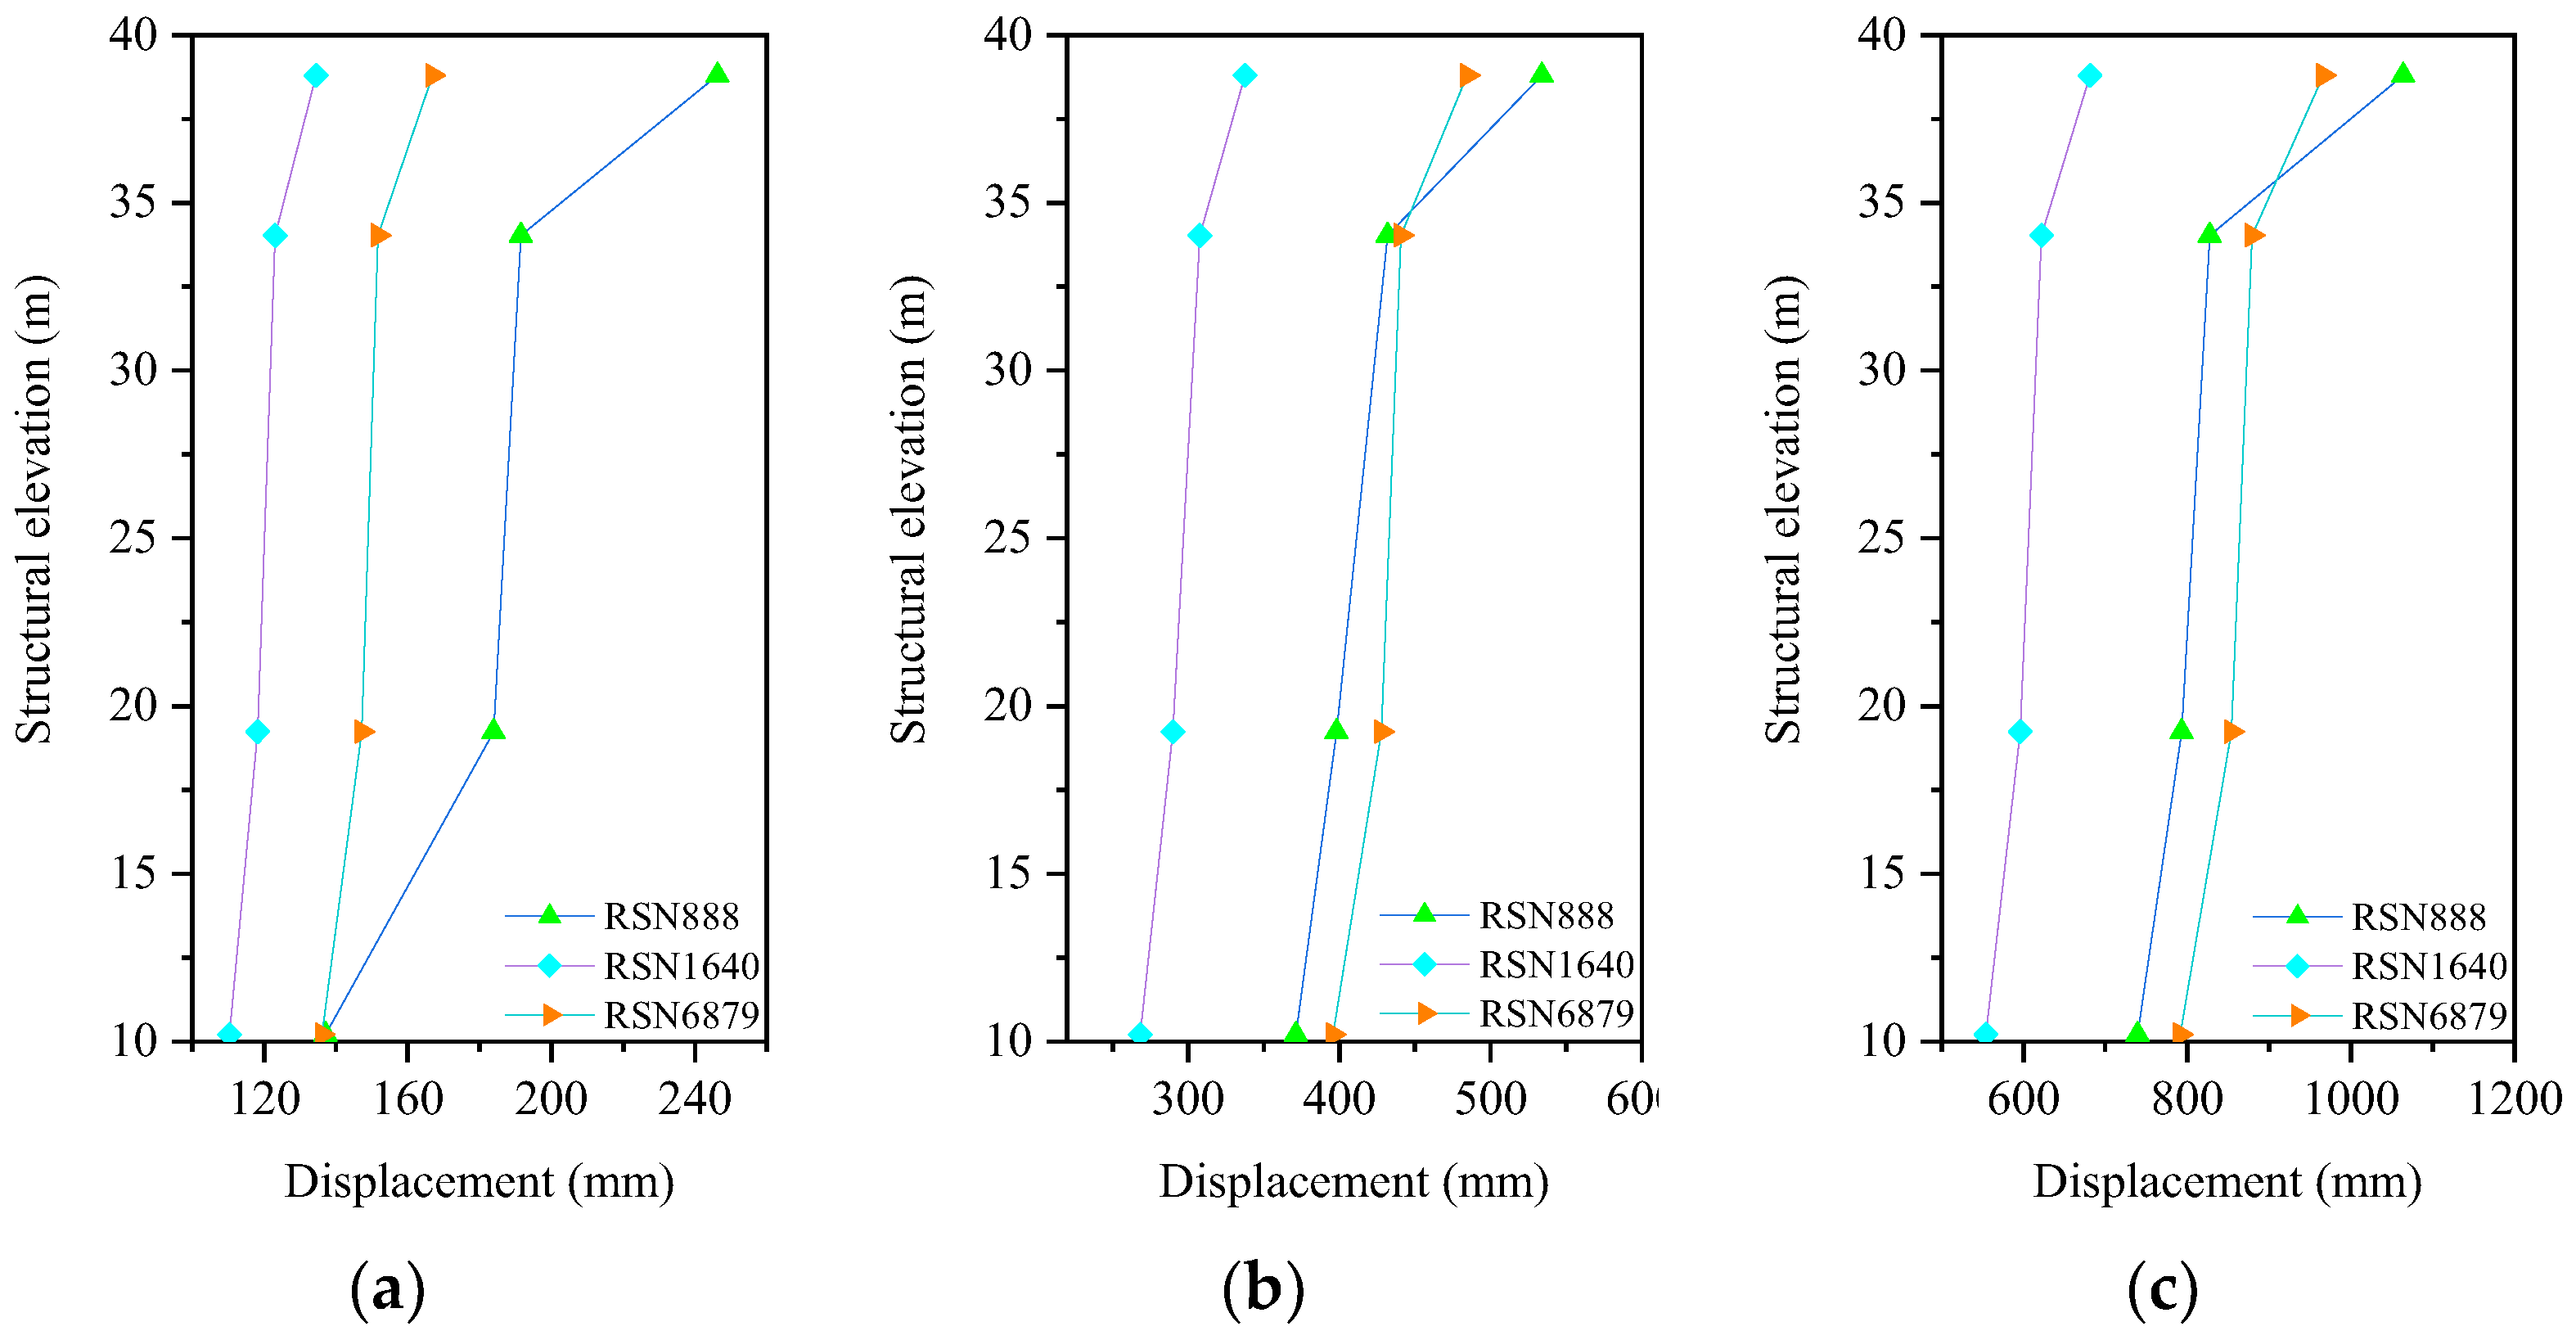
Based on the analysis results of the deformation performance of the SRC frame-bent main building structure in Section 5.4, and utilizing the concrete solid element model established in the ABAQUS software, it was found that the calculation time was too long. As a result, three representative natural ground motion records of RSN888, RSN1640 and RSN6879 were selected, and the X-direction and Y-direction translational components and torsional components of the ground motion were considered. The dynamic elastic–plastic analysis of the SRC frame-bent main building structure with few walls under an 8-degree frequent earthquake, an 8-degree fortification earthquake and an 8-degree rare earthquake was carried out. Finally, the overall deformation of the new main building structure under multidimensional different intensity ground motion was obtained, as shown in Figure 25 and Figure 26.
Figure 27 shows a comparison of the average overall deformation of the traditional SRC frame-bent main building structure and the few-wall SRC frame-bent main building structure under multidimensional ground motion with different intensities.
From Figure 25, Figure 26 and Figure 27, the following observations can be made:
(1)
Under the influence of multidimensional and different levels of earthquakes, the lateral displacement of the top layer of the few-wall SRC frame-bent main building structure was in the range of 135~176 mm, 379~485 mm and 759~976 mm. The longitudinal displacements of the top layer of the structure were 134~247 mm, 338~534 mm and 681~1064 mm.
(2)
Under the action of multidimensional frequent earthquakes, the average lateral displacements of each layer of the structure were 130 mm, 137 mm, 146 mm and 159 mm, which were about 15%, 19%, 18% and 16% lower than those of the traditional SRC frame-bent structure. Under the action of a multidimensional fortification earthquake, the average lateral displacement of each layer of the structure was 357 mm, 377 mm, 406 mm and 443 mm, which was approximately 16%, 19%, 18% and 17% lower than that of the traditional SRC frame-bent main building structure. Under the action of a multidimensional rare earthquake, the average lateral displacement of each layer of the structure was 731 mm, 771 mm, 833 mm and 902 mm, which was about 14%, 18%, 18% and 16% lower compared to the traditional SRC frame-bent main building structure.
(3)
The average longitudinal displacement of each layer of the few-wall SRC frame-bent main building structure under multidimensional frequent earthquakes was 128 mm, 150 mm, 155 mm and 183 mm. This resulted in a reduction of approximately 15%, 12%, 16%, and 11% compared to the traditional SRC frame-bent main building structure. Under the action of a multidimensional fortification earthquake, the average longitudinal displacement of each layer of the structure was 345 mm, 373 mm, 393 mm and 452 mm, which was reduced by about 14%, 15%, 15% and 11% compared to the traditional SRC frame-bent main building structure. Under the action of multidimensional rare earthquakes, the average longitudinal displacement of each layer of the structure was 695 mm, 748 mm, 776 mm and 904 mm, which was reduced by about 15%, 16%, 16% and 11% compared to the traditional SRC frame-bent main building structure.
In the few-wall SRC frame-bent main building structure, the frame columns of the turbine room and deaerator room adopted SRC columns, which could exert their superior ductility performance and energy dissipation capability. This effectively reduced the cross-sectional area of the columns, thereby increasing the effective utilization space inside the plant. In combination with the specific operation processes of the turbine room and deaerator room, flexibly dispersing and arranging shear walls not only effectively increased the overall lateral and transverse anti-side stiffness of the main building structure but also reduced the torsional effect of the structure under multi-dimensional ground motion. Additionally, as the first line of defense in the SRC frame-bent main building structure, shear walls significantly enhanced the seismic performance of the structure under ground motion. For the large-scale SRC frame-bent structures, the structural system of the few-wall SRC frame-bent main building structure proposed in this paper can significantly improve the seismic performance of this type of structure under multidimensional ground motion.

7. Summary and Conclusions

This study examined the seismic response of an SRC frame-bent main building structure under multidimensional earthquakes. In addition, a MATLAB program was developed to calculate the torsional component of ground motion. The specific conclusions were as follows:
  • When a unidirectional earthquake was input, under the action of the three-level earthquake, the transverse displacement of each floor of the structure increased with the increase in structural height, and the deformation of the top floor was the largest. Notably, once the structure’s height exceeded 34.03 m, the transverse displacement of the structure increased significantly with the increase in height.
  • Under bidirectional earthquakes, when the structure’s height exceeded 34.03 m, the transverse displacement deformation amplitude of the structure was significantly larger than the longitudinal displacement of the structure. Under the action of the 8-degree frequent earthquake, 8-degree fortification earthquake and 8-degree rare earthquake, the transverse displacement of the top layer of the structure increased by approximately 7%, 6% and 6%, respectively, compared to the three layers. In comparison to unidirectional earthquakes, bidirectional earthquakes resulted in a maximum lateral displacement at the top of the column at the E-axis and T6-axis about 8% higher than under unidirectional three-level earthquakes.
  • When the structure was subjected to multidimensional frequent, fortification and rare earthquakes, the overall transverse displacement of the structure significantly increased by about 20% compared to unidirectional earthquakes. The average increase compared to bidirectional seismic action was approximately 13%. Among them, the longitudinal increase in the structure under multidimensional frequent earthquakes was larger than that under bidirectional earthquakes, and the maximum was 28%.
  • Under the action of multidimensional frequent, fortification and rare earthquakes, the lateral displacement of each layer of the SRC frame-bent main building structure with few walls decreased by an average of about 17% compared to traditional structures. The longitudinal displacement was reduced by about 14% compared to the traditional SRC frame-bent structure. Adding a distributed shear wall in the appropriate position of a traditional SRC frame-bent main building structure can effectively reduce the influence of the torsional component of ground motion on the seismic response of the structure.
For future research, due to the coupling effect that occurs in unidirectional eccentric structures under multi-dimensional seismic actions, unidirectional horizontal and torsional responses interact, while bidirectional eccentric structures exhibit coupled effects in both the longitudinal–horizontal and transverse–horizontal directions. Therefore, further research should be conducted on the horizontal–torsional coupling response of the SRC frame-bent structure system used in industrial buildings such as nuclear power plants under multi-dimensional seismic actions.

Author Contributions

Conceptualization, Z.X. and G.B.; methodology, Z.X.; software, Z.X.; validation, Z.X., J.Z. and Y.D.; formal analysis, J.Z.; investigation, J.Z. and G.B.; resources, Z.X. and G.B.; data curation, Z.X. and G.B.; writing—original draft preparation, Z.X.; writing—review and editing, Z.X. and Y.D.; visualization, G.B.; supervision, J.Z. and Y.D.; project administration, G.B.; funding acquisition, Z.X. and G.B. All authors have read and agreed to the published version of the manuscript.

Funding

The research reported in this paper was supported by the National Natural Science Foundation of China (Project 51878544), the Technologies R & D Program of He’nan Province of China (242102321020) and Henan Key Laboratory of Grain and Oil Storage Facility & Safety (2023KF02). This financial support was gratefully acknowledged.

Data Availability Statement

Data available on request from the authors.

Conflicts of Interest

We declare that we do not have any commercial or associative interests that represent conflicts of interest in connection with the work submitted.

Appendix A. Calculation Program of Torsional Component of Ground Motion

Taking RSN578 ground motion as an example, the calculation program of the torsional component of ground motion was written by MATLAB mathematical analysis software (version 9.4) as follows:
str=‘RSN578’;
data=readmatrix([str’.xls’]);
u=data(:,4);
v=data(:,8);
w=data(:,12);
Nu=length(u);
Nv=length(v);
Nw=length(w);
N=min([Nu Nv Nw]);
Ts=0.05;
t=(0:Ts:Ts*(N-1));
u=u/100;
v=v/100;
w=w/100;
uf=fft(u);
vf=fft(v);
wf=fft(w);
NN=length(t);
f=(1/Ts.*(1:NN)/NN)’;
i=sqrt(-1);
omega=2.*pi.*f;
cf=(2.812+0.825.*log10(f)-0.101.*(log10(f).^2)).*10000;
itaf=1/3.*randn(NN,1);
c=cf.*(1+0.187.*itaf);
va=c.^2/real(c);
faifgx=i.*omega.*uf./(2.*va);
faifgy=i.*omega.*vf./(2.*va);
faifgz=i.*omega.*wf./(2.*va);
faigx=ifft(faifgx);
faigy=ifft(faifgy);
faigz=ifft(faifgz);
gx=real(faigx);
gy=real(faigy);
gz=real(faigz);
TF=sum(double(isnan(gx)));
gx=gx(:,col);
gy=gy(:,col);
gz=gz(:,col);
writematrix(gx,[str ‘-gx.xls’]);
writematrix(gy,[str ‘-gy.xls’]);
writematrix(gz,[str ‘-gz.xls’]);

References

  1. Liu, J. Structural response and torsional seismic effect of building structure under multidimensional ground motions. J. Harbin Instit. Technol. 1986, 2, 59–71. [Google Scholar]
  2. Gupta, V.K.; Trifunac, M.D. A note on contributions of ground torsion to seismic response of symmetric multistoried buildings. Earthq. Eng. Struct. Dyn. 1990, 10, 27–40. [Google Scholar]
  3. Heredia, Z.E.; Leyva, A. Torsional response of symmetric buildings to incoherent and phase-delayed earthquake ground motion. Earthq. Eng. Struct. Dyn. 2003, 32, 1021–1038. [Google Scholar] [CrossRef]
  4. GB 50011-2010; Code for Seismic Design of Building. China Architecture & Building Press: Beijing, China, 2016. (In Chinese)
  5. JGJ3-2019; Technical Specification for Concrete Structures of Tall Building. China Architecture & Building Press: Beijing, China, 2019. (In Chinese)
  6. International Conference of Building Officials (ICBO). Uniform Building Code (UBC); Structural Engineering Design Provisions, 2; International Conference of Building Officials: Wittier, CA, USA, 1997. [Google Scholar]
  7. Penzien, J.; Watabe, M. Characteristics of 3-dimensional earthquake ground motions. Earthq. Eng. Struct. Dyn. 1974, 3, 365–373. [Google Scholar] [CrossRef]
  8. Smeby, W.; Kiureghian, A.D. Modal combination rules for multicomponent earthquake excitation. Earthq. Eng. Struct. Dyn. 1985, 13, 1–12. [Google Scholar] [CrossRef]
  9. Li, H.N.; Sun, L.; Song, G. Modal combination method for earthquake-resistant design of tall structures to multidimensional excitations. Struct. Des. Tall Spec. Build. 2004, 13, 245–263. [Google Scholar] [CrossRef]
  10. Tso, W.K.; Hsu, T.I. Torsional spectrum for earthquake motions. Earthq. Eng. Struct. Dyn. 1978, 6, 375–382. [Google Scholar] [CrossRef]
  11. Trifunac, M.D. A note on rotational components of earthquake motions on ground surface for incident body waves. Int. J. Soil Dyn. Earthq. Eng. 1982, 1, 11–19. [Google Scholar] [CrossRef]
  12. Wang, J.J.; Hu, Y.X. A study on rotational components of surface ground motion. Earthq. Eng. Struct. Dyn. 1991, 11, 1–10. [Google Scholar]
  13. Wang, J.J.; Jiang, J.R. Estimation of response spectrum for rotational ground motions. Earthq. Eng. Struct. Dyn. 1993, 13, 7–16. [Google Scholar]
  14. Sun, S.J.; Chen, G.X. Synthesis method for estimation of rotational components of ground motion. Acta Seism. Sin. 1998, 1, 19–24. [Google Scholar]
  15. De la Llera, J.C.; Chopra, A.K. Accidental torsion in buildings due to base rotational excitation. Earthq. Eng. Struct. Dyn. 1994, 23, 1003–1021. [Google Scholar] [CrossRef]
  16. Li, H.N.; Sun, L.Y. Rotational components of earthquake ground motions derived from surface waves. Earthq. Eng. Struct. Dyn. 2001, 21, 15–23. [Google Scholar]
  17. Shakib, H.; Tohidi, R.Z. Evaluation of accidental eccentricity in buildings due to rotational component of earthquake. J. Earthq. Eng. 2002, 6, 431–445. [Google Scholar] [CrossRef]
  18. Liu, C. Study on Torsional Response of Eccentric Structures under Seismic Action. Doctoral Dissertation, Hunan University, Changsha, China, 2007. (In Chinese). [Google Scholar]
  19. Yao, Q.F.; Chen, P. Civil Engineering Structural Experiment; China Architecture & Building Press: Beijing, China, 2001. (In Chinese) [Google Scholar]
  20. Guan, D.H. Modal Analysis Technology; Tsinghua University Press: Beijing, China, 1996. (In Chinese) [Google Scholar]
  21. Nakashima, M.; Akazawa, T.; Igarashi, H. Pseudo-dynamic testing using conventional testing devices. Earthq. Eng. Struct. Dyn. 1995, 24, 1409–1422. [Google Scholar] [CrossRef]
  22. Wang, H.; Yang, B.; Zhou, X.H.; Kang, S.B. Numerical analyses on steel beams with fin-plate connections subjected to impact loads. J. Constr. Steel Res. 2016, 124, 101–112. [Google Scholar] [CrossRef]
  23. Zhuang, Z. Abaqus Finite Element Analysis and Application; Tsinghua University Press: Beijing, China, 2009. (In Chinese) [Google Scholar]
  24. Xu, Z.H.; Bai, G.L.; Zhao, J.Q.; Liu, B. Study on seismic performance of SRC special-shaped interior joints in NPP. Eng. Struct. 2021, 234, 111736. [Google Scholar] [CrossRef]
  25. Xu, Z.H.; Bai, G.L.; Zhao, J.Q. Shear mechanism and capacity calculation on SRC special-shaped joints. Eng. Struct. 2021, 247, 113080. [Google Scholar] [CrossRef]
  26. Lu, X.L.; Jiang, H.J. Structural Seismic Action and Seismic Conceptual Design; Wuhan University of Technology Press: Wuhan, China, 2004. (In Chinese) [Google Scholar]
  27. Zhou, J.; Li, X.J.; Li, Y.Q.; Kang, C.C. Comparative analysis and transformation relations between China and the US site classification systems in building seismic code provisions. Acta Seism. Sin. 2021, 43, 521–532+534. [Google Scholar]
  28. Wang, C.Q.; Wu, H.X.; Li, C.X. Hysteresis and damping properties of steel and polypropylene fiber reinforced recycled aggregate concrete under uniaxial low-cycle loadings. Constr. Build. Mater. 2022, 319, 126191. [Google Scholar] [CrossRef]
  29. Qu, Z.; Ye, L.P.; Pan, P. Comparative study on methods of selecting earthquake ground motions for nonlinear time history analyses of building structures. China Civ. Eng. J. 2011, 44, 10–21. [Google Scholar]
  30. GB/T 50958-2013; Code for Design of Conventional Islands for Nuclear Power Plant. China Planning Press: Beijing, China, 2014. (In Chinese)
  31. Qu, T.; Zeng, B.; Zhou, Z.; Huang, L.J.; Chang, D. Dynamic and uncertainty-based assessment of the progressive collapse probability of prestressed concrete frame structures with infill walls. Structures 2024, 61, 106105. [Google Scholar] [CrossRef]
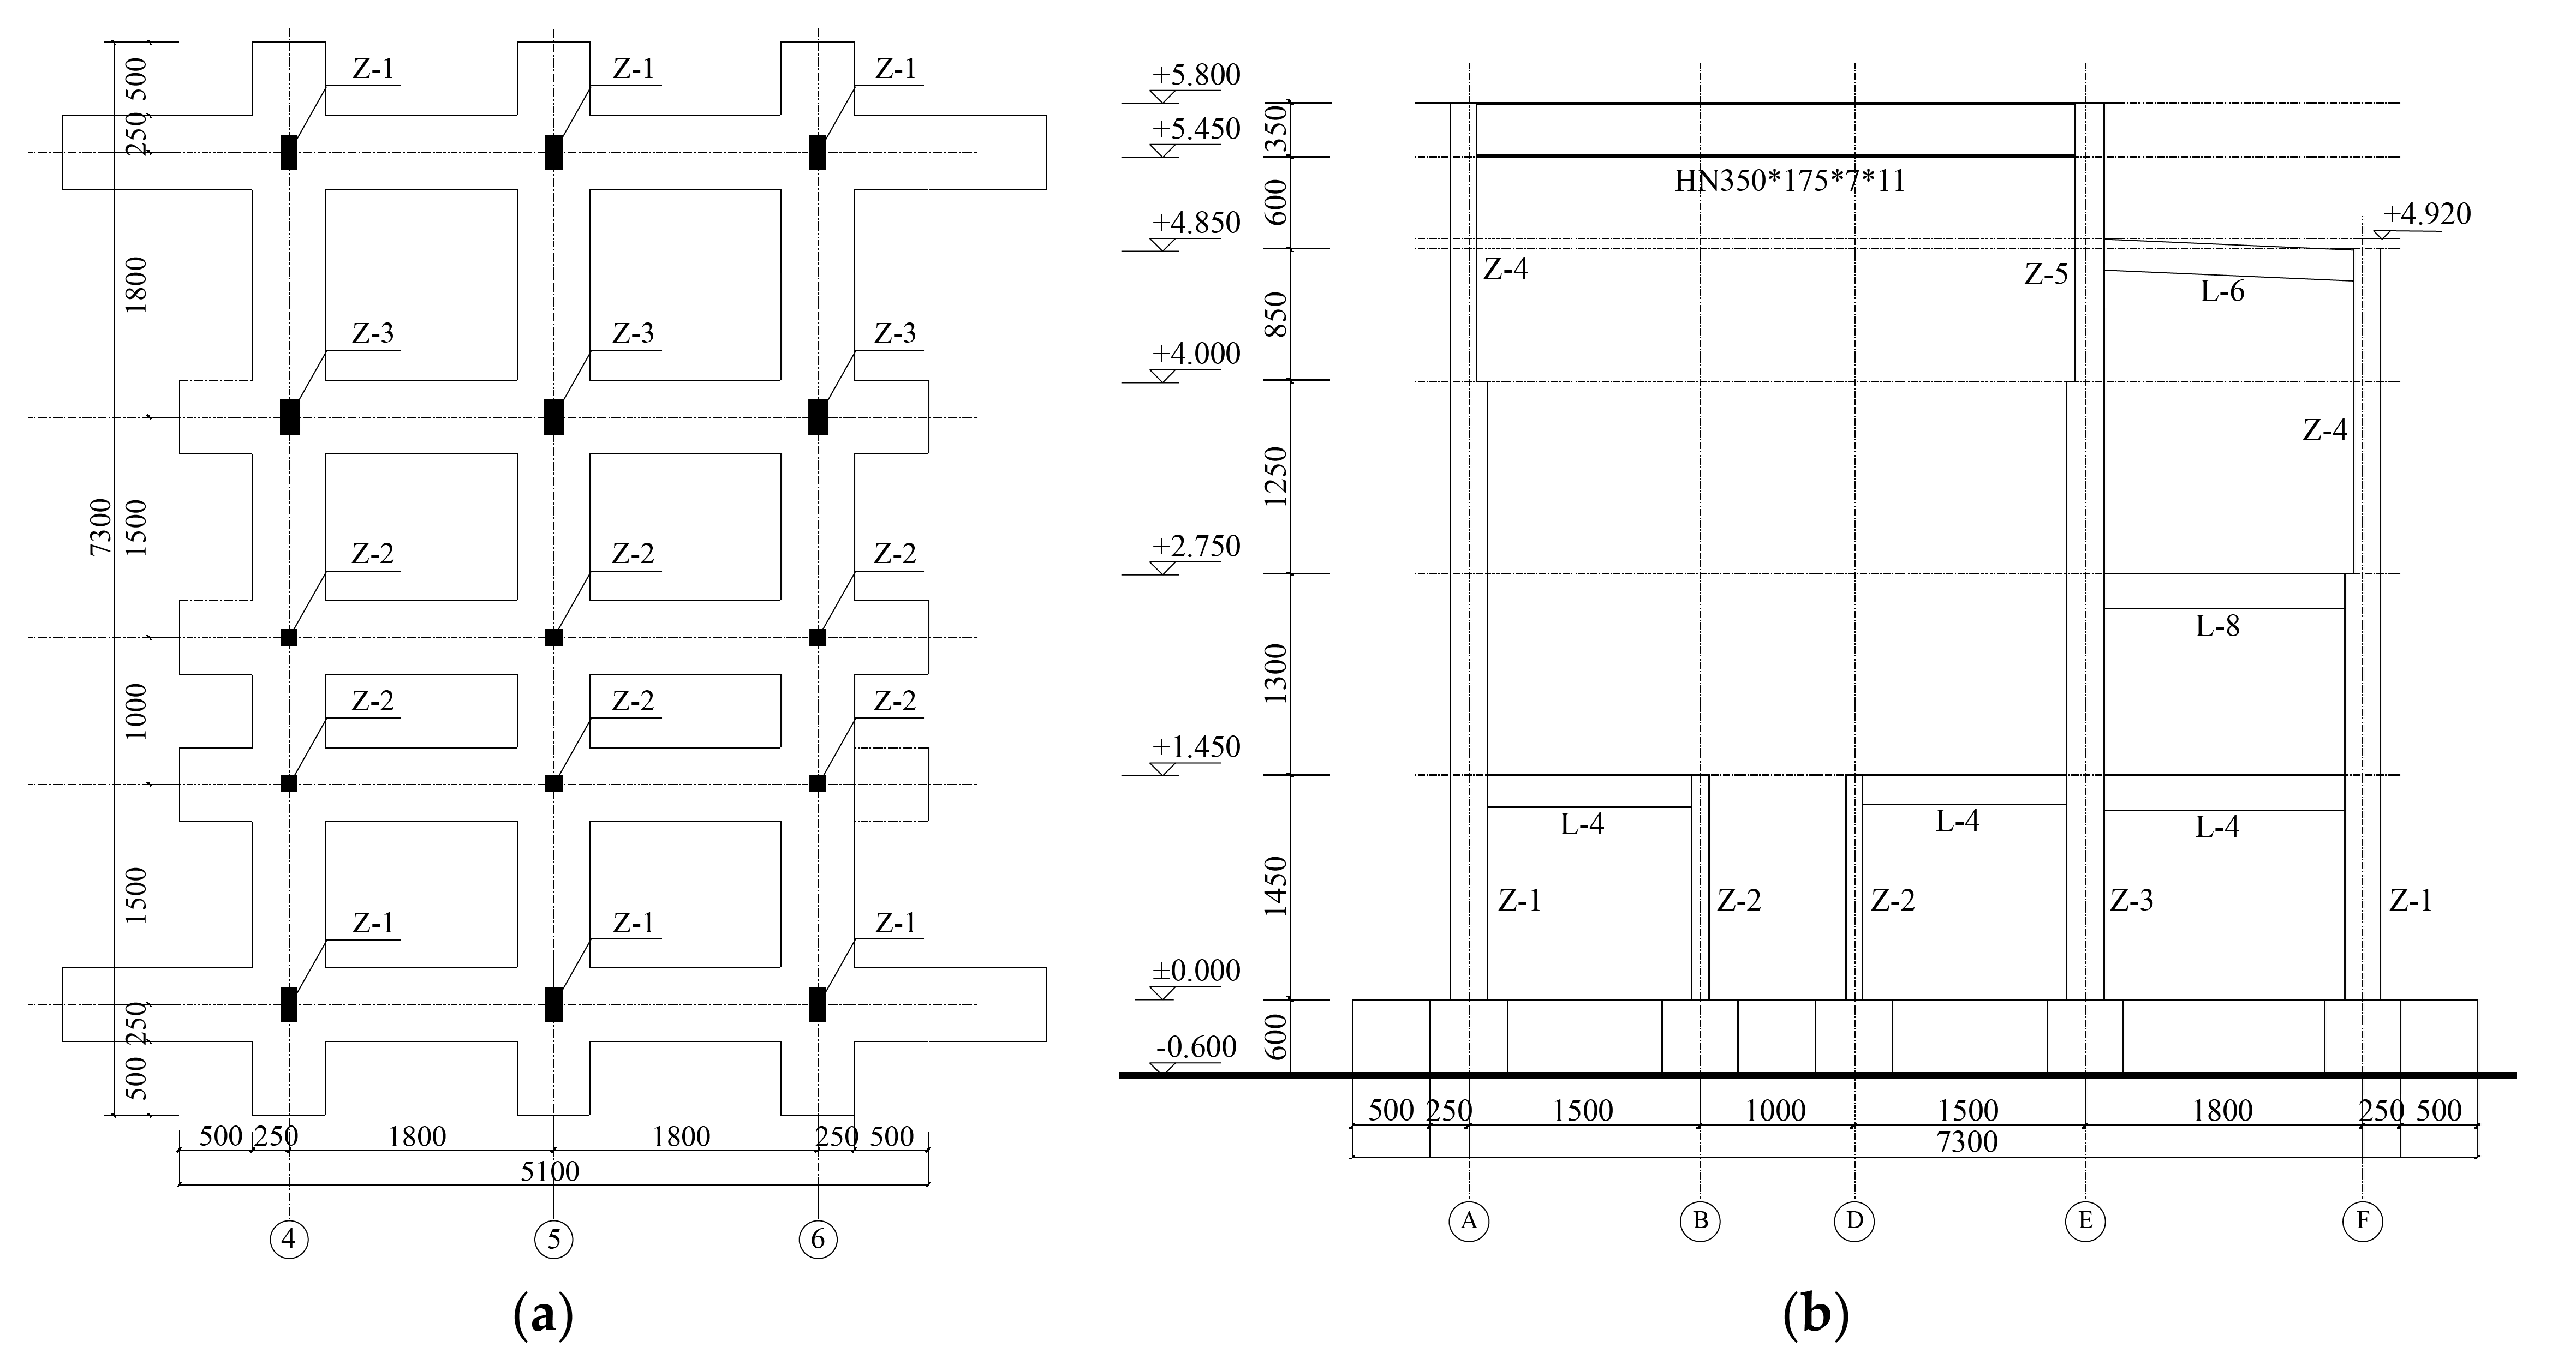
Figure 1. Six components of ground motion.
Buildings 14 01318 g001
Figure 2. Acceleration time history curve of the translational component of the RSN578 seismic wave. (a) The X-direction acceleration time history curve of the RSN578 seismic wave. (b) The Y-direction acceleration time history curve of the RSN578 seismic wave. (c) The Z-direction acceleration time history curve of the RSN578 seismic wave.
Buildings 14 01318 g002
Figure 3. Acceleration time history curve of rotational component of RSN578 seismic wave. (a) Time history curve of swing component 1 acceleration of RSN578 seismic wave. (b) Time history curve of swing component 2 acceleration of RSN578 seismic wave. (c) Acceleration time history curve of torsional component of RSN578 seismic wave.
Buildings 14 01318 g003
Figure 4. Substructure model selection schematic diagram.
Buildings 14 01318 g004
Figure 5. Plane layout and vertical layout of model structure. (a) ±0.00 planar graph of ground beam. (b) Six-axis elevation drawing.
Buildings 14 01318 g005
Figure 6. Making substructure model. (a) Connection between steel beam and connector. (b) Steel roof truss installation completed. (c) Integral counterweight.
Buildings 14 01318 g006
Figure 7. INV-306 intelligent signal acquisition processing analysis system.
Buildings 14 01318 g007
Figure 8. 891-II-type horizontal velocity sensors.
Buildings 14 01318 g008
Figure 9. The arrangement of vibration sensor. (a) The 4, 5, and 6-axis. (b) A-axis. (c) B-axis. (d) D-axis. (e) E-axis. (f) F-axis.
Buildings 14 01318 g009aBuildings 14 01318 g009b
Figure 10. The first three modes of substructure dynamic test. (a) First-order vibration mode. (b) Second-order vibration mode. (c) Third-order vibration mode.
Buildings 14 01318 g010
Figure 11. Finite element model of SRC frame-bent turbine main building. (a) Overall model. (b) Section steel and rebar skeleton model.
Buildings 14 01318 g011
Figure 12. The first three vibration modes of substructure FEM. (a) First-order vibration mode. (b) Second-order vibration mode. (c) Third-order vibration mode.
Buildings 14 01318 g012aBuildings 14 01318 g012b
Figure 13. The first three vibration modes of the FEM of SRC frame-bent steam turbine main building structure. (a) First-order vibration mode. (b) Second-order vibration mode. (c) Third-order vibration mode.
Buildings 14 01318 g013
Figure 14. Ground motion acceleration response spectrum.
Buildings 14 01318 g014
Figure 15. Maximum transverse deformation of structures under unidirectional earthquake with different intensities. (a) Frequent earthquakes. (b) Fortification earthquakes. (c) Rare earthquakes.
Buildings 14 01318 g015
Figure 16. Maximum transverse deformation of structure under bidirectional earthquake with different intensity. (a) Frequent earthquakes. (b) Fortification earthquakes. (c) Rare earthquakes.
Buildings 14 01318 g016
Figure 17. Maximum longitudinal deformation of structures under bidirectional earthquake with different intensities. (a) Frequent earthquakes. (b) Fortification earthquakes. (c) Rare earthquakes.
Buildings 14 01318 g017
Figure 18. Comparison of average transverse deformation of structure under unidirectional and bidirectional earthquakes.
Buildings 14 01318 g018
Figure 19. Maximum transverse deformation of structures under multidimensional earthquakes with different intensities. (a) Frequent earthquakes. (b) Fortification earthquakes. (c) Rare earthquakes.
Buildings 14 01318 g019
Figure 20. Maximum longitudinal deformation of structures under multidimensional earthquakes with different intensities. (a) Frequent earthquakes. (b) Fortification earthquakes. (c) Rare earthquakes.
Buildings 14 01318 g020
Figure 21. Comparison of average transverse deformation of structures under unidirectional and multidimensional earthquakes with different intensities.
Buildings 14 01318 g021
Figure 22. Comparison of average structural deformation under bidirectional and multidimensional earthquakes with different intensities. (a) Comparison of average value of transverse deformation of structure. (b) Comparison of average value of longitudinal deformation of structure.
Buildings 14 01318 g022
Figure 23. The plane layout of the main building structure of the few-wall SRC frame-bent structure.
Buildings 14 01318 g023
Figure 24. The structural effect diagram of the main building structure of the few-wall SRC frame-bent structure.
Buildings 14 01318 g024
Figure 25. Maximum transverse deformation of the SRC frame-bent structure with few walls under multidimensional earthquake with different intensities. (a) Frequent earthquakes. (b) Fortification earthquakes. (c) Rare earthquakes.
Buildings 14 01318 g025
Figure 26. Maximum longitudinal deformation of the SRC frame-bent structure with few walls under multidimensional earthquake with different intensities. (a) Frequent earthquakes. (b) Fortification earthquakes. (c) Rare earthquakes.
Buildings 14 01318 g026
Figure 27. Comparison of average structural deformation of the traditional and few-wall SRC frame-bent main building structure under multidimensional different-intensity ground motion. (a) Comparison of average value of transverse deformation of structure. (b) Comparison of average value of longitudinal deformation of structure.
Buildings 14 01318 g027
Table 1. The details of all specimens.
TypeNumberMember Section (mm)Section of Steel (mm)Steel Content (%)Reinforcement Ratio (%)Hoop Ratio (%)
(Encrypted/Unencrypted Area)
ColumnZ-1110 × 230H170 × 70 × 2.9 × 4.34.231.020.84/0.56
Z-2110 × 110H70 × 70 × 2.9 × 4.36.450.931.20/0.80
Z-3130 × 240H185 × 85 × 2.9 × 4.33.980.830.71/0.47
Z-4110 × 170H130 × 70 × 2.9 × 4.35.100.910.94/0.63
Z-5130 × 190H130 × 85 × 2.9 × 4.34.381.040.78/0.52
BeamL-1110 × 170--1.380.94
L-290 × 140--1.251.24
L-3110 × 190--1.500.90
L-4100 × 230H170 × 65 × 2.3 × 3.53.280.880.93/0.62
L-570 × 210H160 × 40 × 2.3 × 3.54.300.781.47/0.98
L-6100 × 190H130 × 65 × 2.3 × 3.53.880.600.99/0.66
L-7110 × 160--1.470.97
L-870 × 200H140 × 40 × 2.3 × 3.54.182.341.49/0.99
L-960 × 140--2.402.04
L-1060 × 110--2.392.20
Plate-50 × 1000--0.64 (Transverse)
---0.80 (Longitudinal)
Table 2. Mechanical properties of concrete.
Material Locationfcu,m (MPa)fcu,k (MPa)fck (MPa)ftk (MPa)Ec (MPa)
1.45 m, A- and B-axis column59.8848.0636.012.973.42 × 104
1.45 m, D-axis column60.4448.5136.352.983.43 × 104
1.45 m, E- and F-axis column60.0548.2036.122.973.42 × 104
2.75 m, column58.3646.8435.102.933.40 × 104
4.00 m, beam and column52.1341.8431.352.753.30 × 104
4.95 m, beam, E- and F-axis column57.4346.0934.542.903.39 × 104
5.80 m, beam and A-axis column49.4639.7029.752.673.39 × 104
1.45 m, beam57.0045.7534.282.893.25 × 104
2.75 m, beam42.8934.4225.792.473.38 × 104
1.45 m, plate45.3336.3827.262.553.12 × 104
2.75 m, plate44.7035.8826.892.533.17 × 104
4.85 m, plate59.8848.0636.012.973.16 × 104
Table 3. Mechanical properties of steel plates and steel bars.
Material TypeMaterial Specifications (mm)fy (MPa)fu (MPa)εy (10−6)Es (MPa)
Steel bars (diameter)A631743214502.1 × 105
C640560020252.0 × 105
C848372524132.0 × 105
C1046365323132.0 × 105
C1245467622702.0 × 105
Steel plates (thickness)2.526637612952.1 × 105
3.033837616462.1 × 105
3.532846415982.1 × 105
4.033746016442.1 × 105
4.529842114542.1 × 105
Table 4. Measured values of first three orders of dynamic characteristics of the substructure.
Order NumberFrequency/HzPeriod/sDamping/%Vibration Mode
13.7220.2692.219Transverse horizontal torsional coupled
24.8670.2053.195Longitudinal horizontal torsional coupled
35.1390.1953.097Torsion
Table 5. Sections of main components of SRC frame-bent steam turbine main building structure.
TypeLocationElevation/AxisComponent Section (mm)Section of Section Steel (mm)Component Type
ColumnT.A-axis columnUnder 28.6 m800 × 1600H1200 × 500 × 20 × 30SRC component
Above 28.6 m800 × 1200H900 × 500 × 20 × 30
T.B- and T.D-axis columnT.1 and T.12-axis1000 × 1200H800 × 500 × 20 × 30
T.2~T.11-axis800 × 800H500 × 500 × 20 × 30
1/T.B- and 1/T.C-axis columnT.12-axis1000 × 1200H800 × 500 × 20 × 30
T.10 and T.11-axis800 × 800H500 × 500 × 20 × 30
T.C-axis columnT.1-axis1000 × 1200H800 × 500 × 20 × 30
T.2 and T.3-axis800 × 800H500 × 500 × 20 × 30
T.E-axis columnUnder 28.6 m900 × 1700H1300 × 600 × 20 × 30
Above 28.6 m900 × 1300H900 × 600 × 20 × 30
T.F-axis columnUnder 19.24 m800 × 1600H1200 × 500 × 20 × 30
Above 19.24 m800 × 1200H900 × 500 × 20 × 30
T.G-axis column0~11.75 m800 × 1000RC component
Beam--500 × 1300H900 × 300 × 16 × 25SRC component
500 × 1400H1000 × 300 × 16 × 25
700 × 1300H900 × 450 × 16 × 25
500 × 1500H1100 × 300 × 16 × 25
700 × 1600H1200 × 450 × 16 × 25
300 × 800/500 × 1000
/500 × 1200/500 × 1300
RC component
Roof truss-38.1~40.6 m60 × 4/89 × 7/102 × 6/180 × 6/219 × 10/219 × 12/245 × 7/351 × 12Circular steel tube
Chord beamsHW400 × 400 × 20 × 20H-beam
Table 6. Comparison of the dynamic characteristics between substructure test and FEM results (Hz).
Type1st-Order Frequency2nd-Order Frequency3rd-Order Frequency
Substructure test3.724.875.14
Finite element3.564.865.64
Ratio1.041.000.91
Table 7. Comparison of the dynamic characteristics between prototype structure and FEM results (Hz).
Type1st-Order Frequency2nd-Order Frequency3rd-Order Frequency
Test results of substructure conversion prototype structure0.630.820.87
Finite element0.590.730.80
Ratio1.071.121.09
Table 8. Basic information regarding ground motion.
Order NumberGround Motion NumberName of Ground MotionGround Motion RecordsMagnitude
Mw/M
Fault Distance
(R/km)
Vs,30 (m/s)PGA
/g
PGV (cm/s)
GM1RSN36Borrego MtnEl Centro Array #96.6345.66213.440.1319.86
GM2RSN578Taiwan SMART1(45)SMART1 O027.357.1320.900.1619.72
GM3RSN888LandersSan Bernardino E & Hospitality7.2879.7638.600.0818.40
GM4RSN1209Chi-Chi TaiwanCHY0477.6224.1334.900.1826.63
GM5RSN1640Manjil IranTonekabun7.3793.6225.900.068.44
GM6RSN3680Taiwan SMART1(45)SMART1 M127.35723.400.1226.78
GM7RSN6879Darfield New ZealandADCS731.4134.100.1111.08
GM8RSN6965SBRC724.3420.300.1520.29
GM9Artificial wave-------
Table 9. Maximum value of seismic acceleration time history used in time history analysis (cm/s2).
Earthquake Effect6-Degree7-Degree8-Degree9-Degree
Frequent earthquakes1835 (55)70 (110)140
Fortification earthquakes4998 (147)196 (294)392
Rare earthquakes125220 (310)400 (510)620
Disclaimer/Publisher’s Note: The statements, opinions and data contained in all publications are solely those of the individual author(s) and contributor(s) and not of MDPI and/or the editor(s). MDPI and/or the editor(s) disclaim responsibility for any injury to people or property resulting from any ideas, methods, instructions or products referred to in the content.

