Article

Flexural Performance of Reinforced Concrete Beams Strengthened with a Novel High-Strength and High-Toughness Epoxy Mortar Thin Layer

School of Civil and Architectural Engineering, Guangxi University of Science and Technology, Liuzhou 545006, China
*
Author to whom correspondence should be addressed.
Appl. Sci. 2024, 14(10), 3999; https://doi.org/10.3390/app14103999
Submission received: 10 April 2024 / Revised: 2 May 2024 / Accepted: 4 May 2024 / Published: 8 May 2024

Abstract

:
The flexural performance of RC beams strengthened with a novel high-strength and high-toughness epoxy mortar thin layer was investigated through four-point flexural tests on two contrast beams and two strengthened beams. The effects of this strengthening method on the failure modes, crack distribution, load–deflection curves, and bearing capacity of the RC beams with two reinforcement ratios were studied. The experimental results revealed that the contrast beams exhibited the typical bending failure modes where the failure mode of the reinforced beam is the yielding of the tensile reinforcement of the original beam and then fracture damage of the new epoxy mortar-reinforced thin layer. No debonding phenomenon was observed between the reinforced thin layer and the original concrete, and no visible cracks appeared before the tensile failure occurred in the thin layer. The cracks in the reinforced beams developed slowly, increased in number, and decreased significantly in width and spacing. The stiffness of the strengthened beam increased significantly, while its deformation ductility coefficient noticeably decreased. Compared to the corresponding contrast beams, the cracking load for strengthened beams A1 and B1 increased by 14% and 23%, respectively; the yield load increased by 32% and 40%, respectively; and the peak load increased by 18% and 17%, respectively. Finally, a calculation method for the flexural bearing capacity of RC beams strengthened with the novel epoxy mortar thin layer based on the flat section assumption was proposed. The calculated values showed a good agreement with the experimental values (with errors at −11.73% and 4.14%, respectively), providing a valuable reference for further research and application related to this kind of reinforcement method.

1. Introduction

Concrete materials are the most widely used building material, because they have the advantages of being low-cost and having a high plasticity and durability and a good fire resistance [1]. The concrete structure is affected by various environmental factors, and, in the process of being used, the performance of the material itself continues to deteriorate, resulting in a reduction in its bearing capacity and durability, affecting the safety of the structure. As a result, it is very necessary to reinforce and strengthen the concrete structure [2,3].
In the common method of reinforcing concrete structures, the reinforcement material mainly bears the tensile stress, and, as a result, a fibrous bar [4,5,6,7,8], wire mesh [9,10], fiber grid [11,12,13], and wire rope [14,15] are used. Such reinforcement materials with excellent tensile properties are widely used in concrete structure reinforcement engineering, but the reinforcement materials usually require cement-based mortar to be used as bonding materials [16,17]. However, the tensile strength and ultimate strain of ordinary cement-based mortar are low, which leads to the premature cracking of the layer reinforced with mortar, which affects the synergistic effect of the mortar and the reinforced material [18]. In addition, these cracks can also significantly reduce the durability of the reinforced material. In order to improve the crack resistance and toughness of the above mortar, some scholars improve the tensile strength and deformation ability of the mortar by adding fiber, rubber particles, and polymer modifications [19,20,21,22,23,24,25,26].
Polymer mortar has gradually become applied in reinforcement engineering because of its characteristics of rapid curing, strength in the early stages, and good bonding properties. The most commonly used polymer mortar in engineering mainly includes epoxy resin mortar and polyurethane mortar. Epoxy resin mortar has been widely used in the reinforcement project, but the toughness of the current commonly used epoxy resin mortar is insufficient, and its ultimate tensile strain is generally below 1500 με [27], which is lower than the design value of the yield strain (2000 με) and the ultimate tensile strain (10,000 με) of ordinary steel bars in a concrete structure. Before the tensile reinforcement of the original structure yields, the epoxy mortar has cracked and is withdrawn from work. For the existing epoxy resin whose toughness is insufficient, existing research mainly considers how the macro epoxy resin mortar joins iron filings, fibers, high-strength steel wire mesh, and other reinforcing materials that include physical toughening methods [28,29,30] where the epoxy mortar is essentially used as a bonding material. The epoxy mortar will still crack before the original structural tensile reinforcement yields.
Based on the epoxy resin mortar’s characteristics of having a high strength and a stable performance in the early stages, this study develops a new type of high-strength and high-toughness epoxy mortar by adding chemical toughening materials to the resin substrate to improve the brittleness of the resin substrate by forming an interpenetrating network structure on a microscopic level, in response to the problem of its lack of toughness. The material has a high tensile strength (19.4 MPa) and ultimate tensile strain (10,100 με). As a result, it will not prematurely crack and result in the stopping of the work due to the lack of toughness in the reinforced concrete structure. The reinforcement material participates in the structure of the whole process of stress to effectively improve the structural load bearing capacity and to inhibit any structural cracking.
This paper carries out a four-point bending test on two comparative beams and two reinforced beams; studies the influence of the new mortar-reinforced thin layer on the failure form, crack distribution, load–deflection curve, and bearing capacity of the material, and obtains the calculation formula of the bending bearing capacity of the new mortar thin layer reinforced RC beam based on the experimental research results.

2. Experimental Program

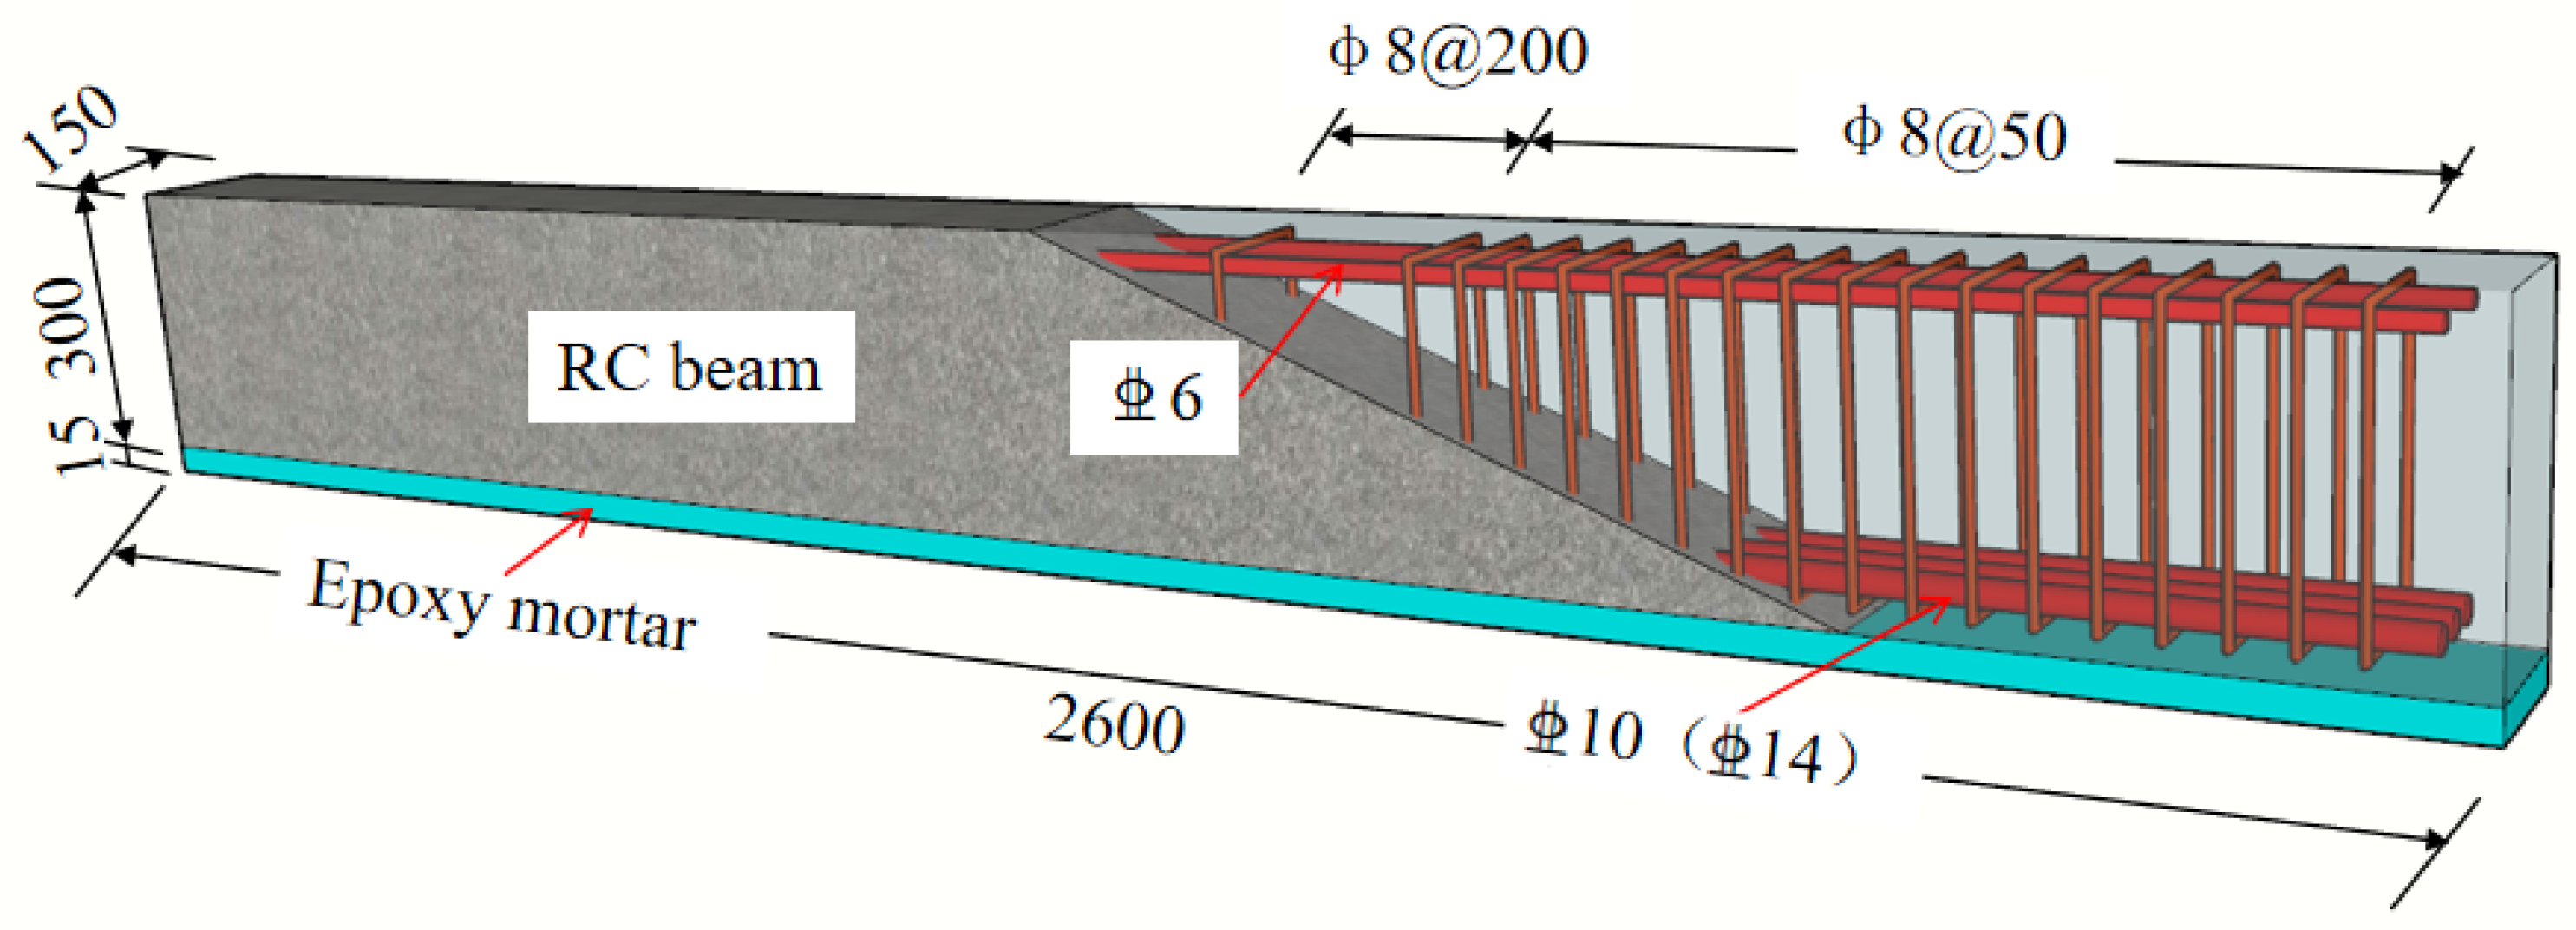
2.1. Specimen Design and Production

In order to study the bending performance of the new epoxy mortar thin layer reinforced RC beams, four test beams were designed and fabricated. The section size of the contrast beam was 150 mm × 300 mm. The reinforced beams were reinforced with thin layers in the tensile area, and the thickness of the reinforced layer was 15 mm. The design strength grade of concrete was C40. The type of tensile rebar and erection bar was HRB400, and the stirrup was HRB300. The longitudinal reinforcement ratio was divided into 0.60% and 1.18%. The corresponding tensile rebar diameters were 10 mm and 14 mm, and the erection bar diameter was 6 mm. The stirrup in the pure bending section was Φ8@200 mm and within the shear-to-span area was Φ8@50 mm. The design parameters of each test beam are shown in Table 1. Figure 1 shows the schematic diagram of the test beam structure. The section dimensions and reinforcement drawing of the test beam are shown in Figure 2.
After 28 days of maintenance of the original beam, its tensile zone was chiseled and flushed, and a new epoxy mortar thin layer was then poured for reinforcement. The steps were as follows: (1) The bottom side of the beam was turned up, then chiseled and scoured. (2) The lateral formwork was installed on both the sides and ends of the beam and fixed with fixture to keep the edge and the upper edge of the beam equal. The top edge of the formwork was 15 mm higher than the bottom of the beam. (3) The epoxy mortar was poured, and the surface of the mortar was smoothed. The control surface thickness was 15 mm. (4) The material was cured for 14 days. A reinforced beam without initial stress can be obtained by the above steps.

2.2. Material Properties
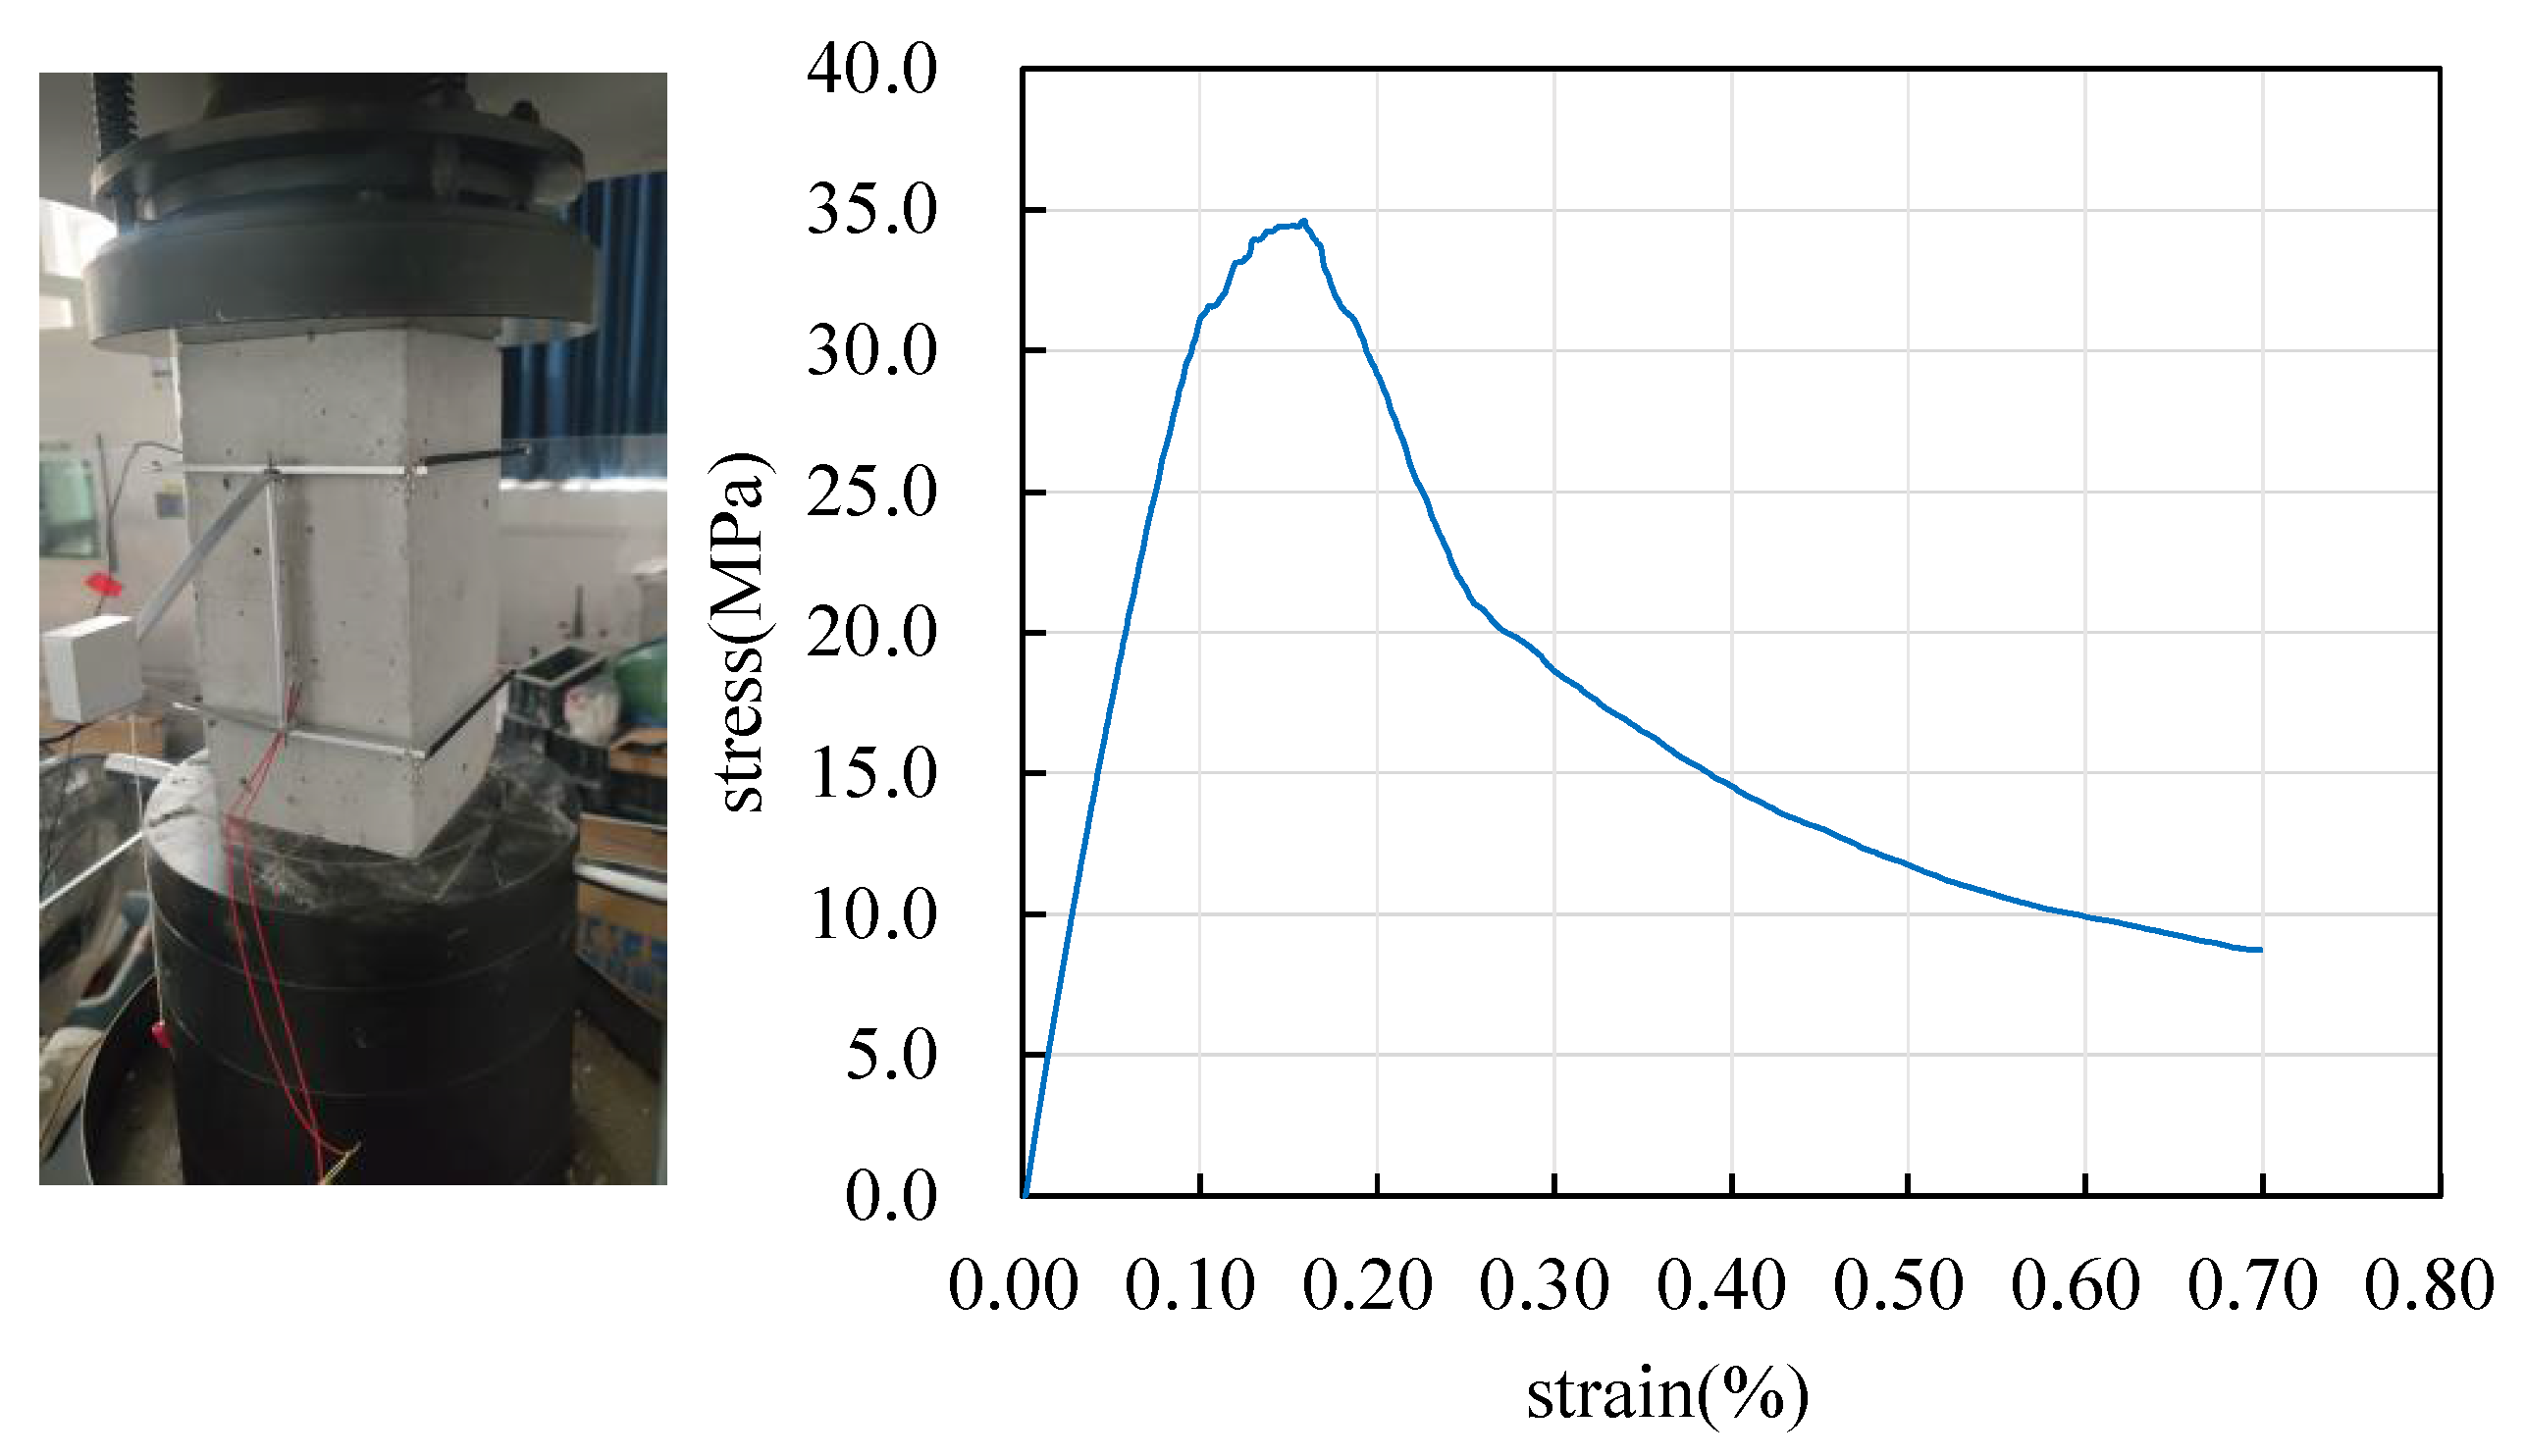
2.2.1. Concrete

A 300 t press was used in the displacement control mode to test the axial compression mechanical parameters of the 150 mm × 150 mm × 300 mm prism specimen. The loading rate was 0.2 mm/s. The axial compression stress–strain curve is shown in Figure 3.

2.2.2. Longitudinal Steel Bar

A 30 t universal tester was used with the displacement control mode, and a unidirectional tensile experiment of the HRB400 reinforcement was conducted. The loading rate was 2 mm/min. The stress–strain curve of the two diameter steel bars is shown in Figure 4. From Figure 4a,b, the Applsci 14 03999 i00110 steel bar used in this test has no obvious yield stage and the Applsci 14 03999 i00114 steel bar has an obvious yield stage.

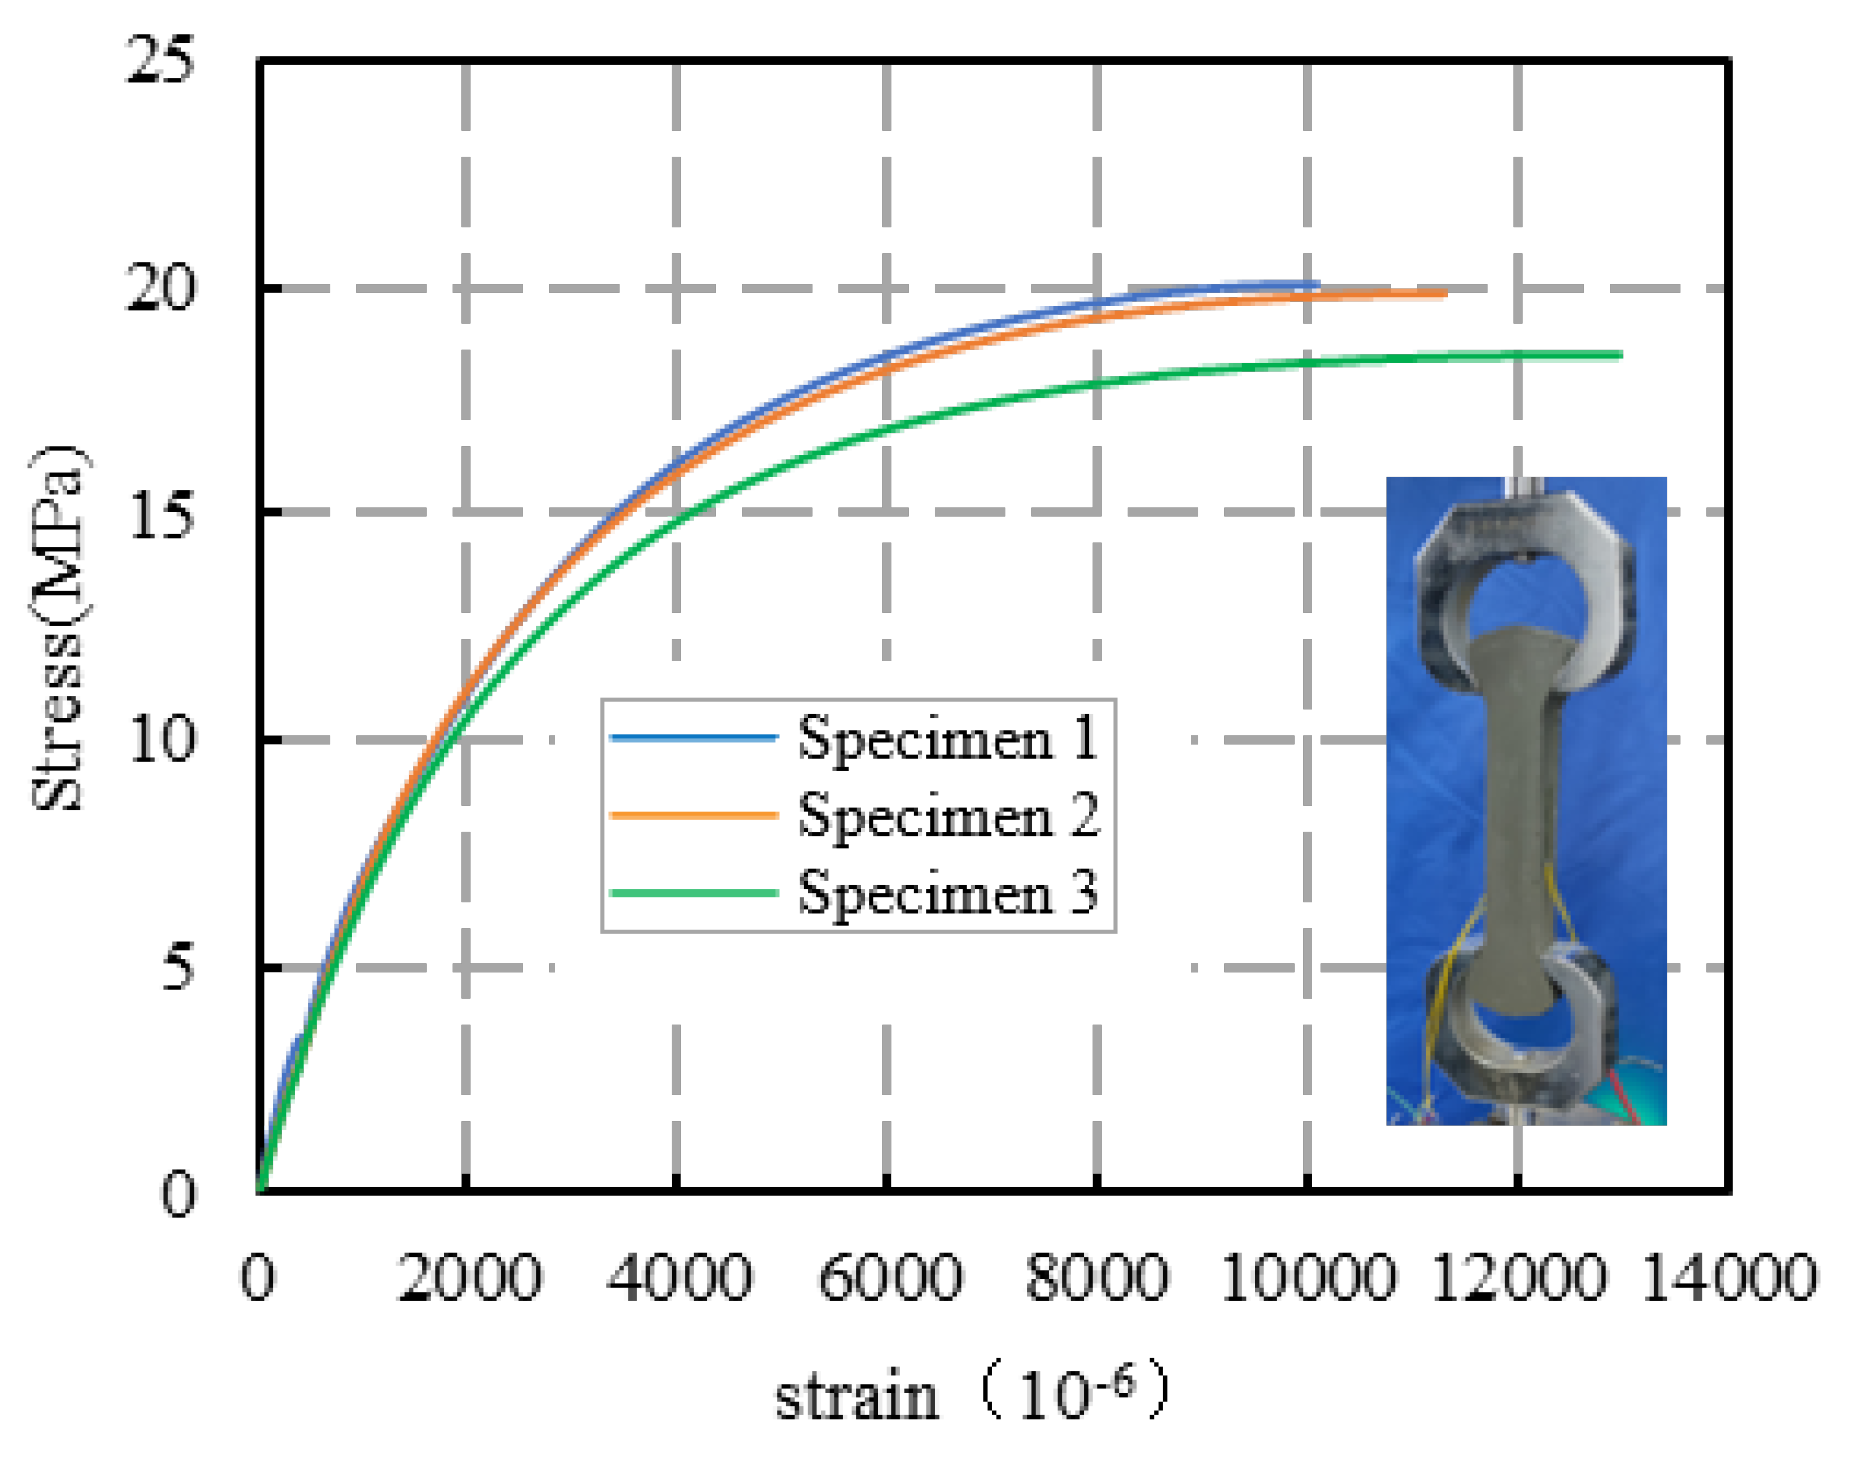
2.2.3. New Epoxy Mortar

The reinforcement material used in this study was the new epoxy resin mortar with a high strength and high toughness developed by our research group. It consisted of epoxy resin, an active diluent, a flexible curing agent, a toughening agent, a coupling agent, a defoamer, fly ash, and quartz sand mixed in a certain proportion. The epoxy mortar mixing ratios are shown in Table 2.
During the pouring process of the thin layer of reinforcement, three dumbbell-shaped tensile specimens were reserved according to the “Technical Regulations for Epoxy Resin Mortar” (DL/T 5193-2021) [31], and a tensile performance test was carried out after 14 days of curing. The stress–strain curve that was obtained is in Figure 5, and Figure 6 shows the average stress–strain curve diagram of the specimen.

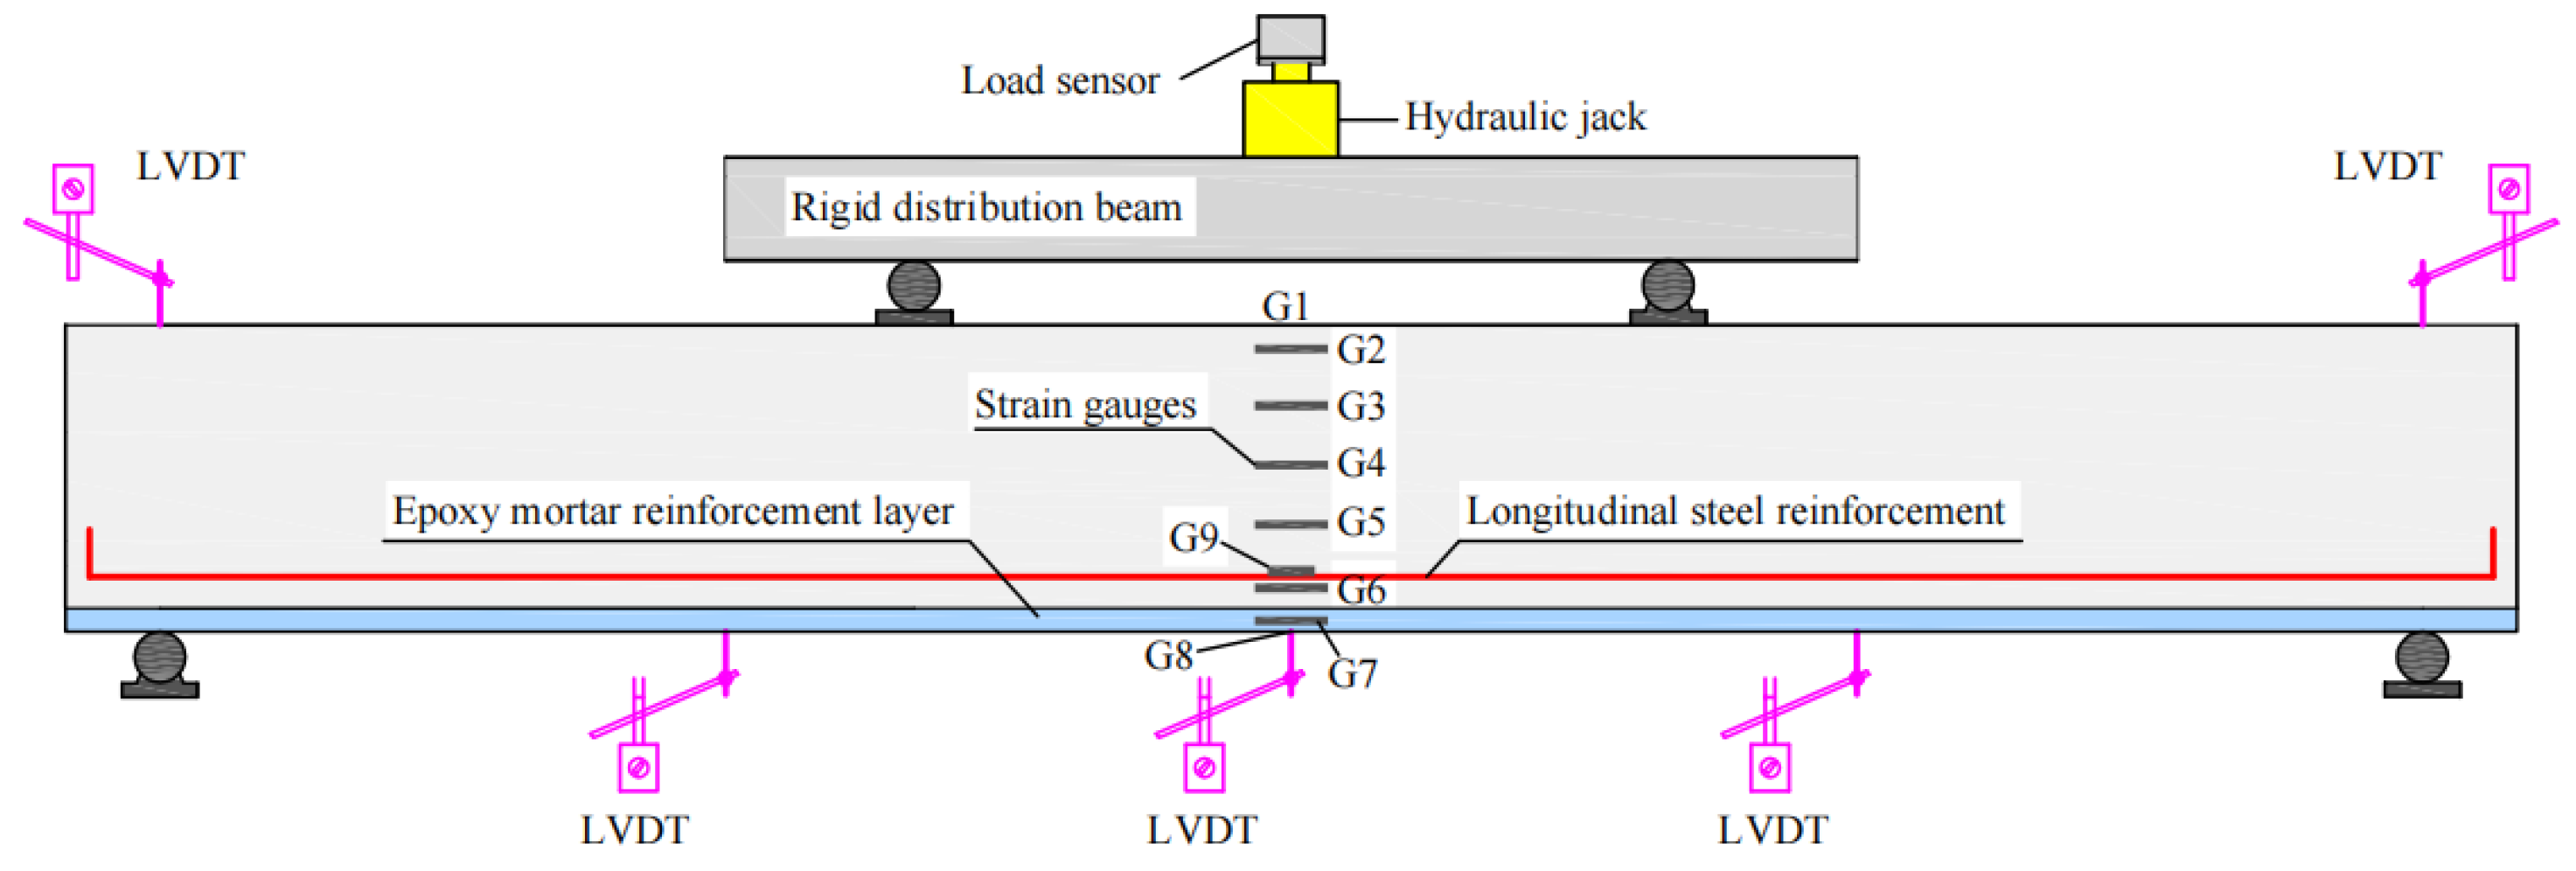
2.3. Test Device and Instrumentation

The test used an oil pressure jack. The loading method adopted graded loading before the test beam cracked. The loading rate was 5 kN per level. After the test beam entered the yielding stage, the loading method was changed to control by the deflection deformation in the span. The loading rate was 1 mm per level.
In order to measure the concrete strain, the surface strain of the test beam was measured by placing a resistance strain gauge uniformly along the height direction in the middle section of the test beam span. The strain of the longitudinally stretched steel bars was measured by the embedded resistance strain gauge in the middle of the test beam span. The strain gauge was arranged at the bottom of the middle section of the reinforced beam span to measure the strain of the reinforced layer. Displacement sensors were installed at the mid-span, the loading point, and the fulcrum position to measure the deformation of the test beams. Figure 7 is a typical photo of the test loading process, and Figure 8 shows the layout of the bending test loading device and measuring point.

3. Test Results and Analysis

3.1. Test Phenomenon and Failure Modes

The failure pattern of each test beam is shown in Figure 9, and the crack distribution is shown in Figure 10. The parameter Pm was introduced to represent the peak load of the specimen, and the specific damage process of each test beam is as follows.

3.1.1. Contrast Beam A0

The contrast beam A0 was in the elastic stage during the initial loading. When the load increased to 26.06 kN (18% Pm), the first vertical crack appeared in the tensile area near the middle. With the increase in the load, the number of vertical cracks gradually increased, and the width of the cracks constantly increased and extended upward. The load was loaded to 89.96 kN (63% Pm). An oblique crack began to appear in the curved shear section. When loaded to 119.39 kN (83% Pm), the longitudinal tensile steel bar yielded. When the loading continued, the crack width and specimen deflection increased rapidly. When loaded to 143.29 kN, the peak load was reached and the concrete in the pressure area was crushed. The load dropped sharply to 99.76 kN (70% Pm), and the test was stopped. The distribution of the cracks is shown in Figure 10a.

3.1.2. Contrast Beam B0

The contrast beam B0 was in the elastic stage during the initial loading. When the load increased to 19.70 kN (23% Pm), the first vertical crack appeared in the tensile area near the middle. When loaded to 64.22 kN (74% Pm), the longitudinal tensile steel bar yielded. When the loading continued, the crack width and specimen deflection increased rapidly. When loaded to 86.77 kN, the peak load was reached and the concrete in the pressure area was crushed. The load dropped sharply to 74.25 kN (85% Pm), and the test was stopped. The crack distribution is shown in Figure 10b. The longitudinal reinforcement ratio of specimen B0 is smaller, and its crack spacing and crack width are larger than that of specimen A0.

3.1.3. Strengthened Beam A1

The reinforced beam A1 was in the elastic stage during the initial loading. When the load was increased to 29.72 kN (18% Pm), the first vertical crack appeared in the concrete layer in the tensile area of the pure curved section. As the load increased, the number of concrete cracks gradually increased, and the crack distribution was fine and dense. When loaded to 120.00 kN (71% Pm), concrete cracks in the tensile area appeared at the bottom. When loaded to 139.09 kN (82% Pm), the longitudinal tendons reached the yield load. When the loading continued, the specimen deflection increased rapidly to 160.00 kN (95% Pm) and the concrete in the tensile area in the protection layer of the longitudinal horizontal cracked. When loaded to 168.72 kN, the peak load was reached and the reinforced thin layer of epoxy mortar broke near the left loading point. The load dropped sharply to 129.67 kN (77% Pm). As the load increased slowly, the deflection increased rapidly. The load continued to increase to 138.10 kN (82% Pm) when the concrete in the pressure area was crushed. The load dropped sharply to 92.41 kN (55% Pm), and the test was stopped. The distribution of the cracks is shown in Figure 10c.

3.1.4. Strengthened Beam B1

The reinforced beam B1 was in the elastic stage during the initial loading. When the load was increased to 24.26 kN (24% Pm), the first vertical crack appeared in the concrete layer in the tensile area of the pure bend section. With the increase in the load, the number of the B1 beam concrete cracks gradually increased and the crack distribution was fine and dense. When loaded to 90.28 kN (89% Pm), the longitudinal reinforcement reached the yield load, the concrete cracks in the tensile area bifurcated at the bottom, and longitudinal cracks appeared on the concrete side within the scope of the protective layer. When the loading continued, the deflection increased rapidly. When the loading reached 101.61 kN, the peak load was reached. The thin layer of epoxy mortar reinforcement broke near the middle of the span, and the load dropped to 82.44 kN (81% Pm). As the load first slowly increased and then gradually decreased, the deflection continued to increase rapidly. The load dropped to 80.51 kN (79% Pm), and the concrete in the pressure area was crushed. The load dropped sharply to 69.29 kN (68% Pm), and the test was stopped. The distribution of the cracks is shown in Figure 10d.

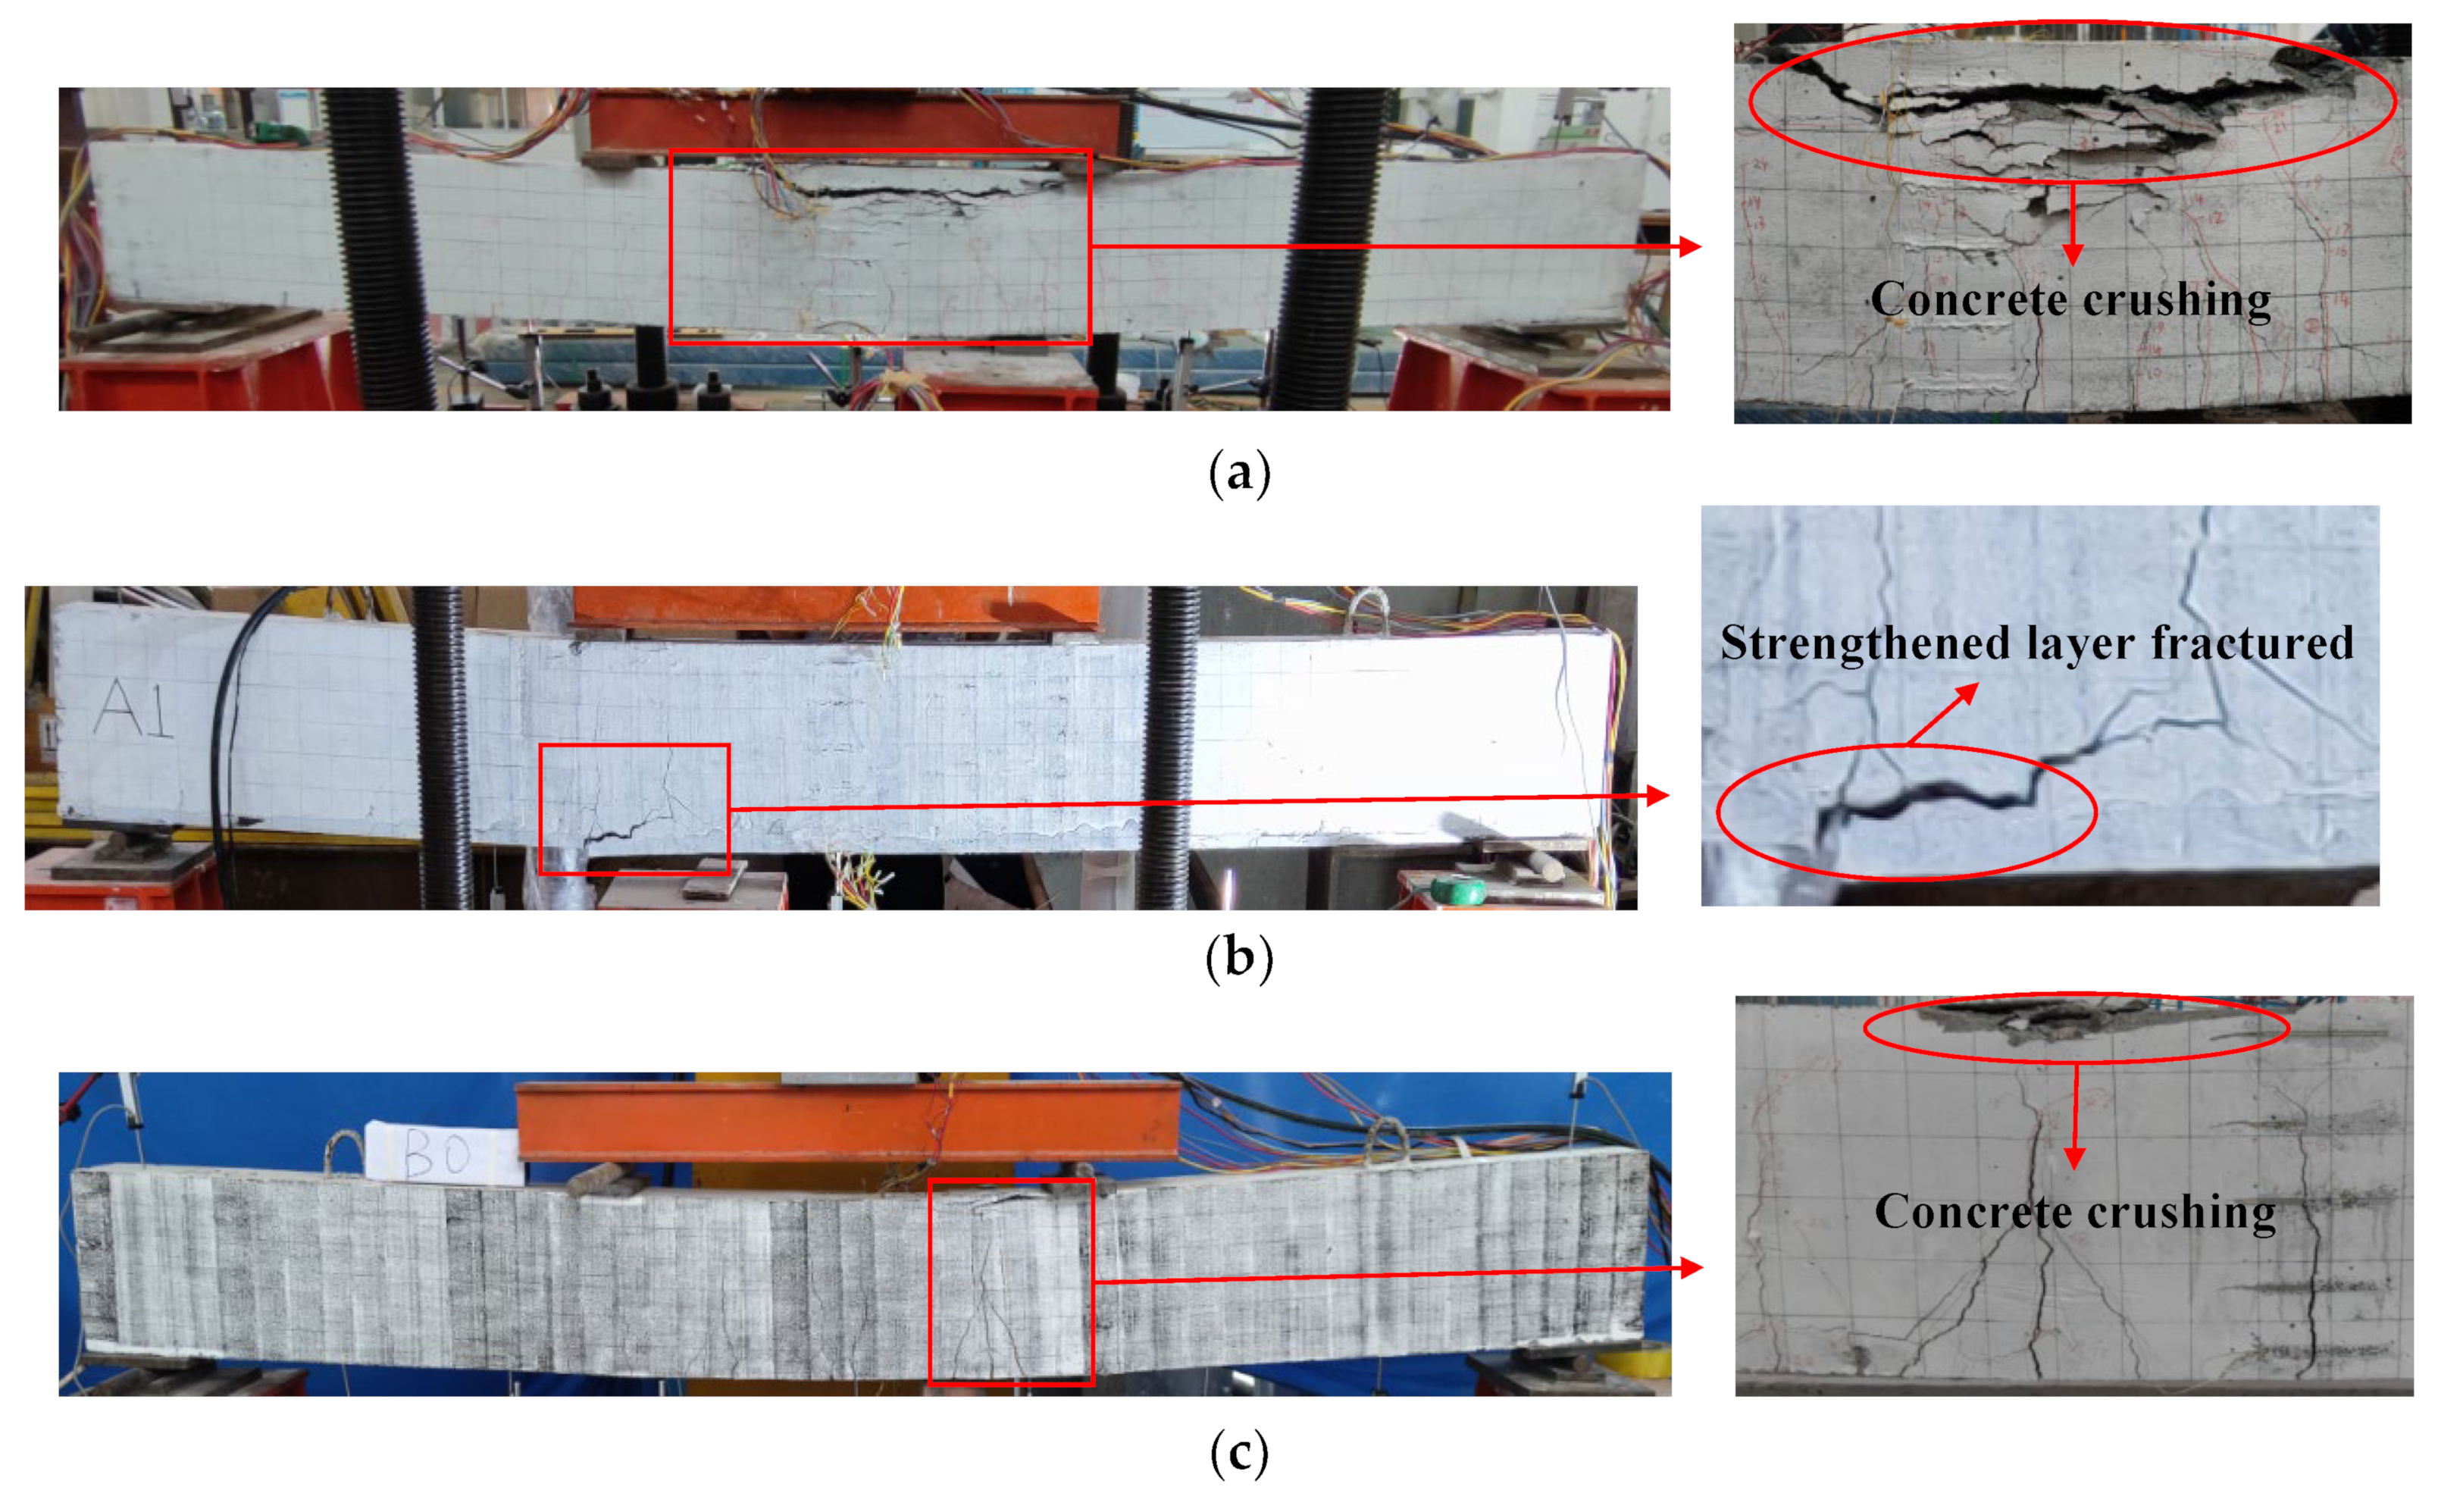
3.1.5. Analysis of the Destruction Morphology

The contrast beams exhibited the typical modes of bending failure. The failure modes of the reinforced beams A1 and B1 were both characterized by the fracture of the thin layer of epoxy mortar after the yielding of the longitudinal reinforcement.
The concrete in the tensile area of the reinforced beam was stripped along the longitudinal reinforcement, and no debonding phenomenon was seen at the interface between the thin layer and the original beam (Figure 11). No visible cracks were found in the epoxy mortar of the reinforcement layer before the pull failure. Compared to the unreinforced comparison beams, the cracks in the reinforced beams developed more slowly, the number of cracks increased, and the spacing and width of the cracks decreased. The reason is that the epoxy mortar-reinforced thin layer was effectively involved in the structural forces before pulling off, restraining the development of concrete cracks in the original beam.

3.2. Load–Deflection Curve

Figure 12 shows the load–deflection curves of the mid-span section of the test beams, and the symbol on the curve indicates the yield point. from which it can be seen that the loading process of all the test beams can be divided into the elastic stage, the crack development stage, and the failure stage.
Before the crack of the test beam, the load–deflection curve is straight. With the increase in the load, the concrete in the tension area cracked, the load–deflection curve takes the first turn, and the test beam entered the crack development stage. With the continuous occurrence and development of cracks, the stiffness of the test beam gradually decreased.
For the unreinforced contrast beam under continued loading, the reinforcement entered the yield stage and the load across the middle deflection curve appears at the second turn; then, as the load changed slowly, the deflection increased rapidly, the concrete in the pressure area was crushed, and the specimen was finally destroyed.
For the reinforcement beam A1, the load could still grow rapidly after entering the yield stage, until the epoxy mortar was pulled off and the load dropped to 77% of the peak load. After the pull failure of the reinforced layer, the specimen showed a similar damage process to that of the unreinforced beam A0. The load increased slowly, the deflection increased rapidly, the concrete in the pressure area was crushed, the load dropped to 55% of the peak load, and the specimen was finally destroyed.
For the reinforcement beam B1, after the reinforcement entered the yield stage, the load increased slowly, the epoxy mortar was pulled off, and the load dropped sharply to 81% of the peak load. After the pull failure of the reinforced layer, the specimen showed a similar damage process to that of the unreinforced beam B0. The load changed slowly, the deflection increased rapidly, the concrete in the pressure area was crushed, the load dropped to 68% of the peak load, and the specimen was finally destroyed.
Compared with the unreinforced beams A0 and B0, the yield load, peak load, and structural stiffness of the reinforced beams A1 and B1 were significantly increased because the thin layer reinforced by the epoxy mortar effectively participates in the structural force before the tensile break.
The test values of the cracking load Pcr, longitudinal rib yield load Py, peak load Pm, ultimate load Pu, and corresponding mid-span deflection fcr, fy, fm, and fu of each specimen are summarized in Table 3. The limit point is the point at which the load drops to 85% Pm; Pm,0 represents the peak load of the unreinforced contrast beams A0 and B0; and μ is the displacement ductility coefficient. Failure form A represents the typical bending failure modes, and failure form B represents the tensile failure of the reinforcement layer.

3.3. Bearing Capacity Analysis

Compared with the unreinforced beams A0 and B0, the cracking load of the reinforced beams A1 and B1 was increased by 14% and 23%, respectively. The main reasons are as follows: (1) the section height of the reinforced beam increases by 5%; (2) the thin layer of epoxy mortar participates in the cooperative force of the original beam; (3) the thin layer of epoxy mortar effectively limits the concrete cracking in the tensile area.
The yield load of the reinforcement beams A1 and B1 was increased by 32% and 40%, respectively. Under the same thickness of the thin layer of epoxy mortar, the increase in the yield load was related to the reinforcement rate of the original beam. The smaller the longitudinal reinforcement rate of the original beam, the greater the effect of the thin layer and the greater the increase in the yield load.
The peak load of the reinforcement beams A1 and B1 increased by 18% and 17% respectively. The increase in the peak load was not obviously affected by the ratio of the longitudinal reinforcement of the original beam. The main reason is that the tensile steel of the A-series test beam has a yield step, and the increase in the tensile steel load of the A1 test beam mainly depends on strengthening the thin layer. While the reinforced bars of the B-series test beam have no yield step, the reinforcement of the B1 test beam after yielding is still caused by the joint action of the reinforced bars and the reinforced thin layer. The contribution degree of the reinforced thin layer to the peak load therefore decreases.

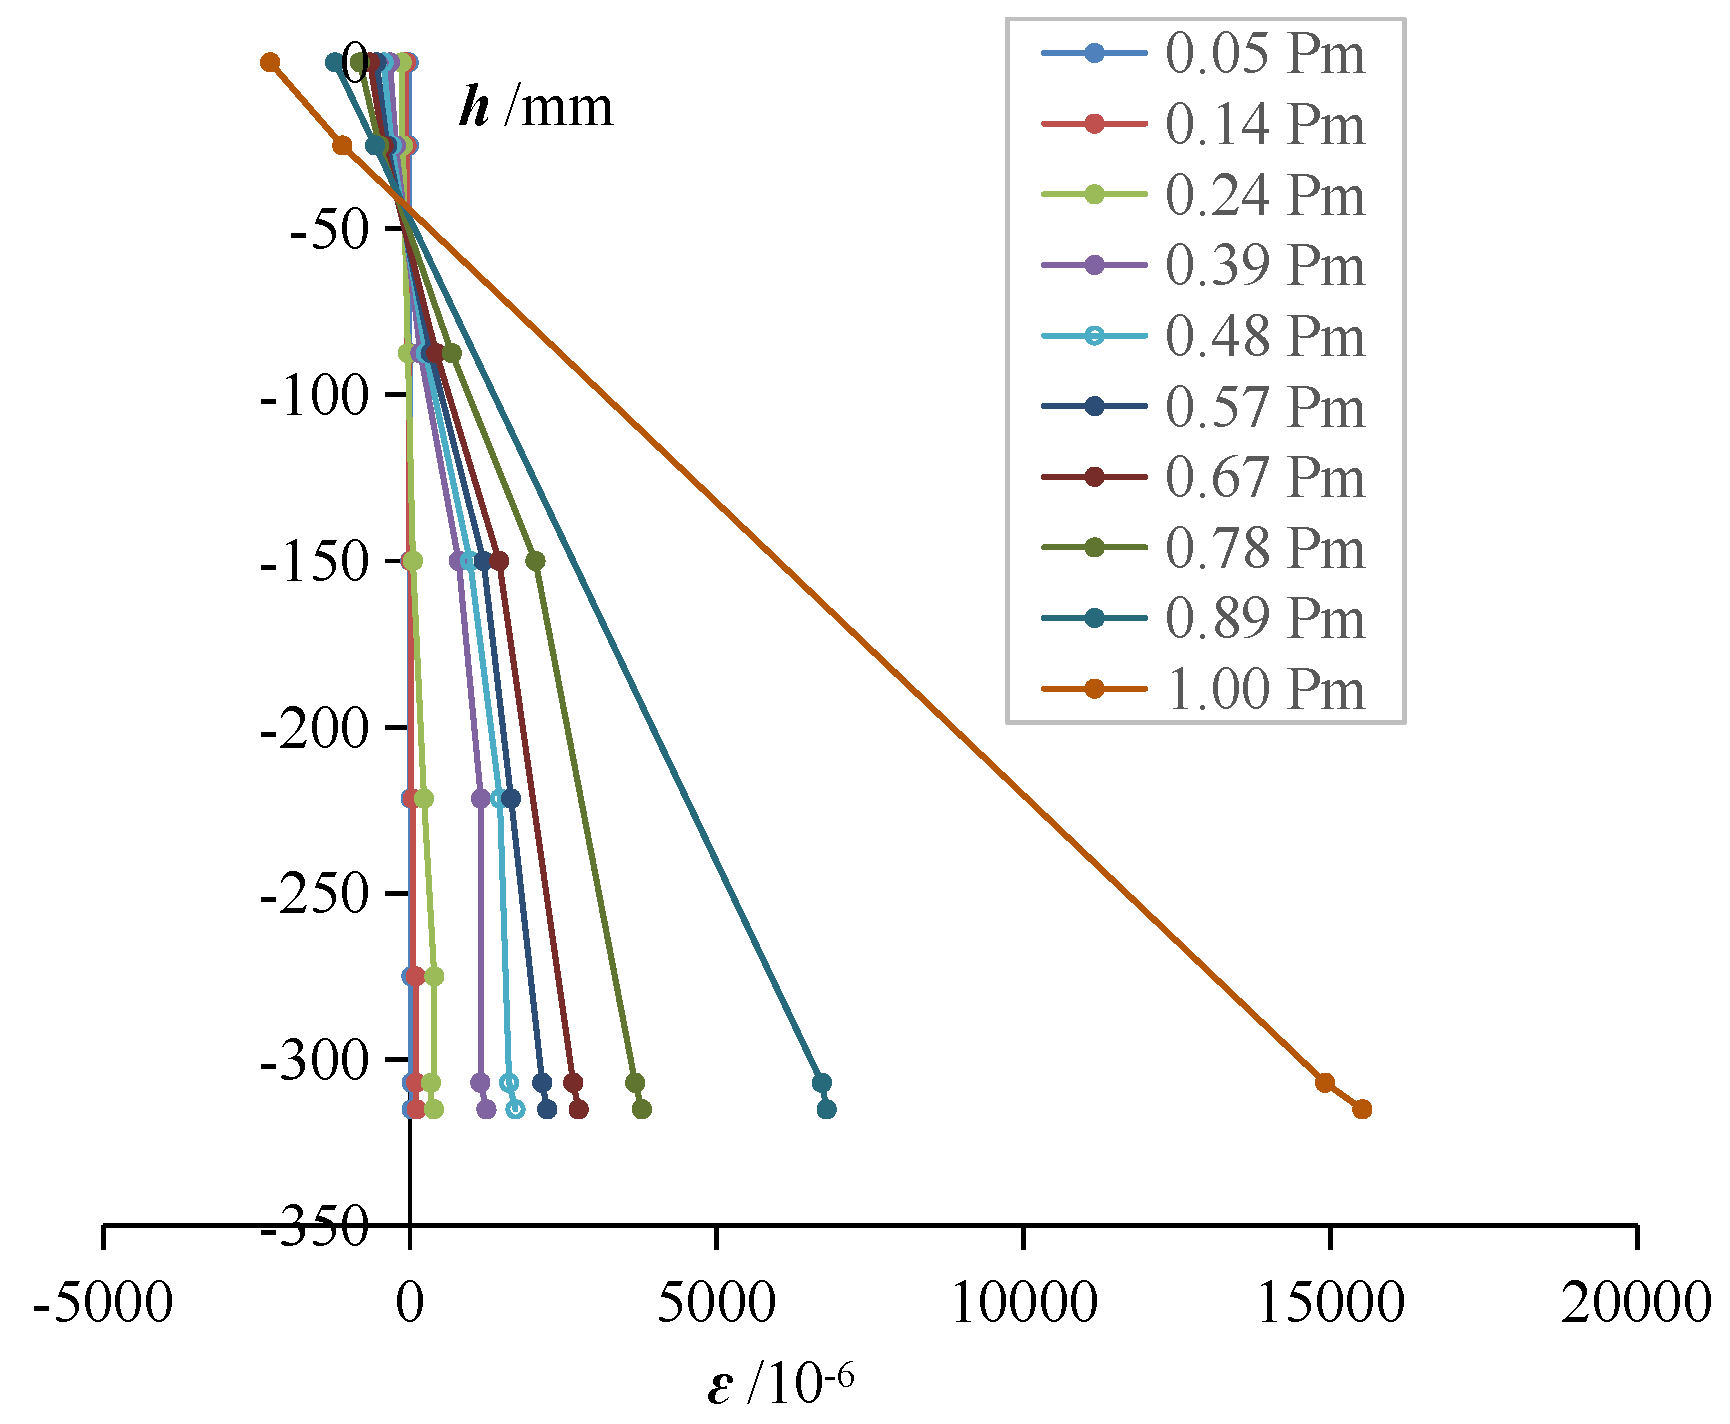
3.4. Deformation Analysis

The displacement ductility coefficient μ is defined as the ratio of the corresponding displacement to the limit point of the beam body. It is generally used to measure the deformation ability of the component. The greater the displacement ductility coefficient, the stronger the deformation ability of the component. The unreinforced contrast beams A0 and B0 had a good plastic deformation ability, and the displacement ductility coefficient was 3.81 and 7.29, respectively. The peak deflection and ductility coefficient of the reinforcement beams A1 and B1 were greatly reduced, and the corresponding ductility coefficient was 1.84 and 3.90, respectively. The ductility coefficient of the test beam was significantly reduced after strengthening the thin layer of epoxy mortar, mainly due to the sudden fracture of the reinforced thin layer after reaching the peak load.
Therefore, in order to strengthen the beam in a subsequent study, we can consider adding fiber fabric or high-strength wire mesh to the reinforced thin layer.

4. Calculation of the Bending Bearing Capacity

4.1. Fundamental Assumption

(1) Before and after deformation, the strain of the concrete, the reinforcement, and the reinforcement material is distributed linearly along the section height, that is, it meets the flat section assumption; (2) the concrete in the tensile area is not considered; (3) there is no relative slip between the concrete, the reinforcement, and the reinforcement materials.
Taking the reinforced beam B1 as an example, the distribution of the cross section strain along the beam height is shown in Figure 13.

4.2. Material Constitutive Model

4.2.1. Concrete

The compressive stress–strain constitutive relationship of the concrete is selected according to the Code for Design of Concrete Structures (GB 50010-2010) [27], and it consists of a parabolic rising segment and a horizontal segment, as shown in Figure 14.
The expression is as follows:
σ c = f cd 1 1 ε c ε c 0 n 0 < ε c ε c 0 f cd ε c 0 < ε c ε cu
where σc is the compressive stress of the concrete; εc is the compressive strain of the concrete; fcd is the compressive strength of the concrete; εc0 is the peak compressive strain of the concrete; εcu is the ultimate compressive strain of the concrete, and n is the coefficient.
According to the material performance test results in Section 2.2, the values of concrete material parameters in this study are shown in Table 4.

4.2.2. Longitudinal Steel Bar

According to the measured curve of the steel stress and strain (Figure 4), the Applsci 14 03999 i001
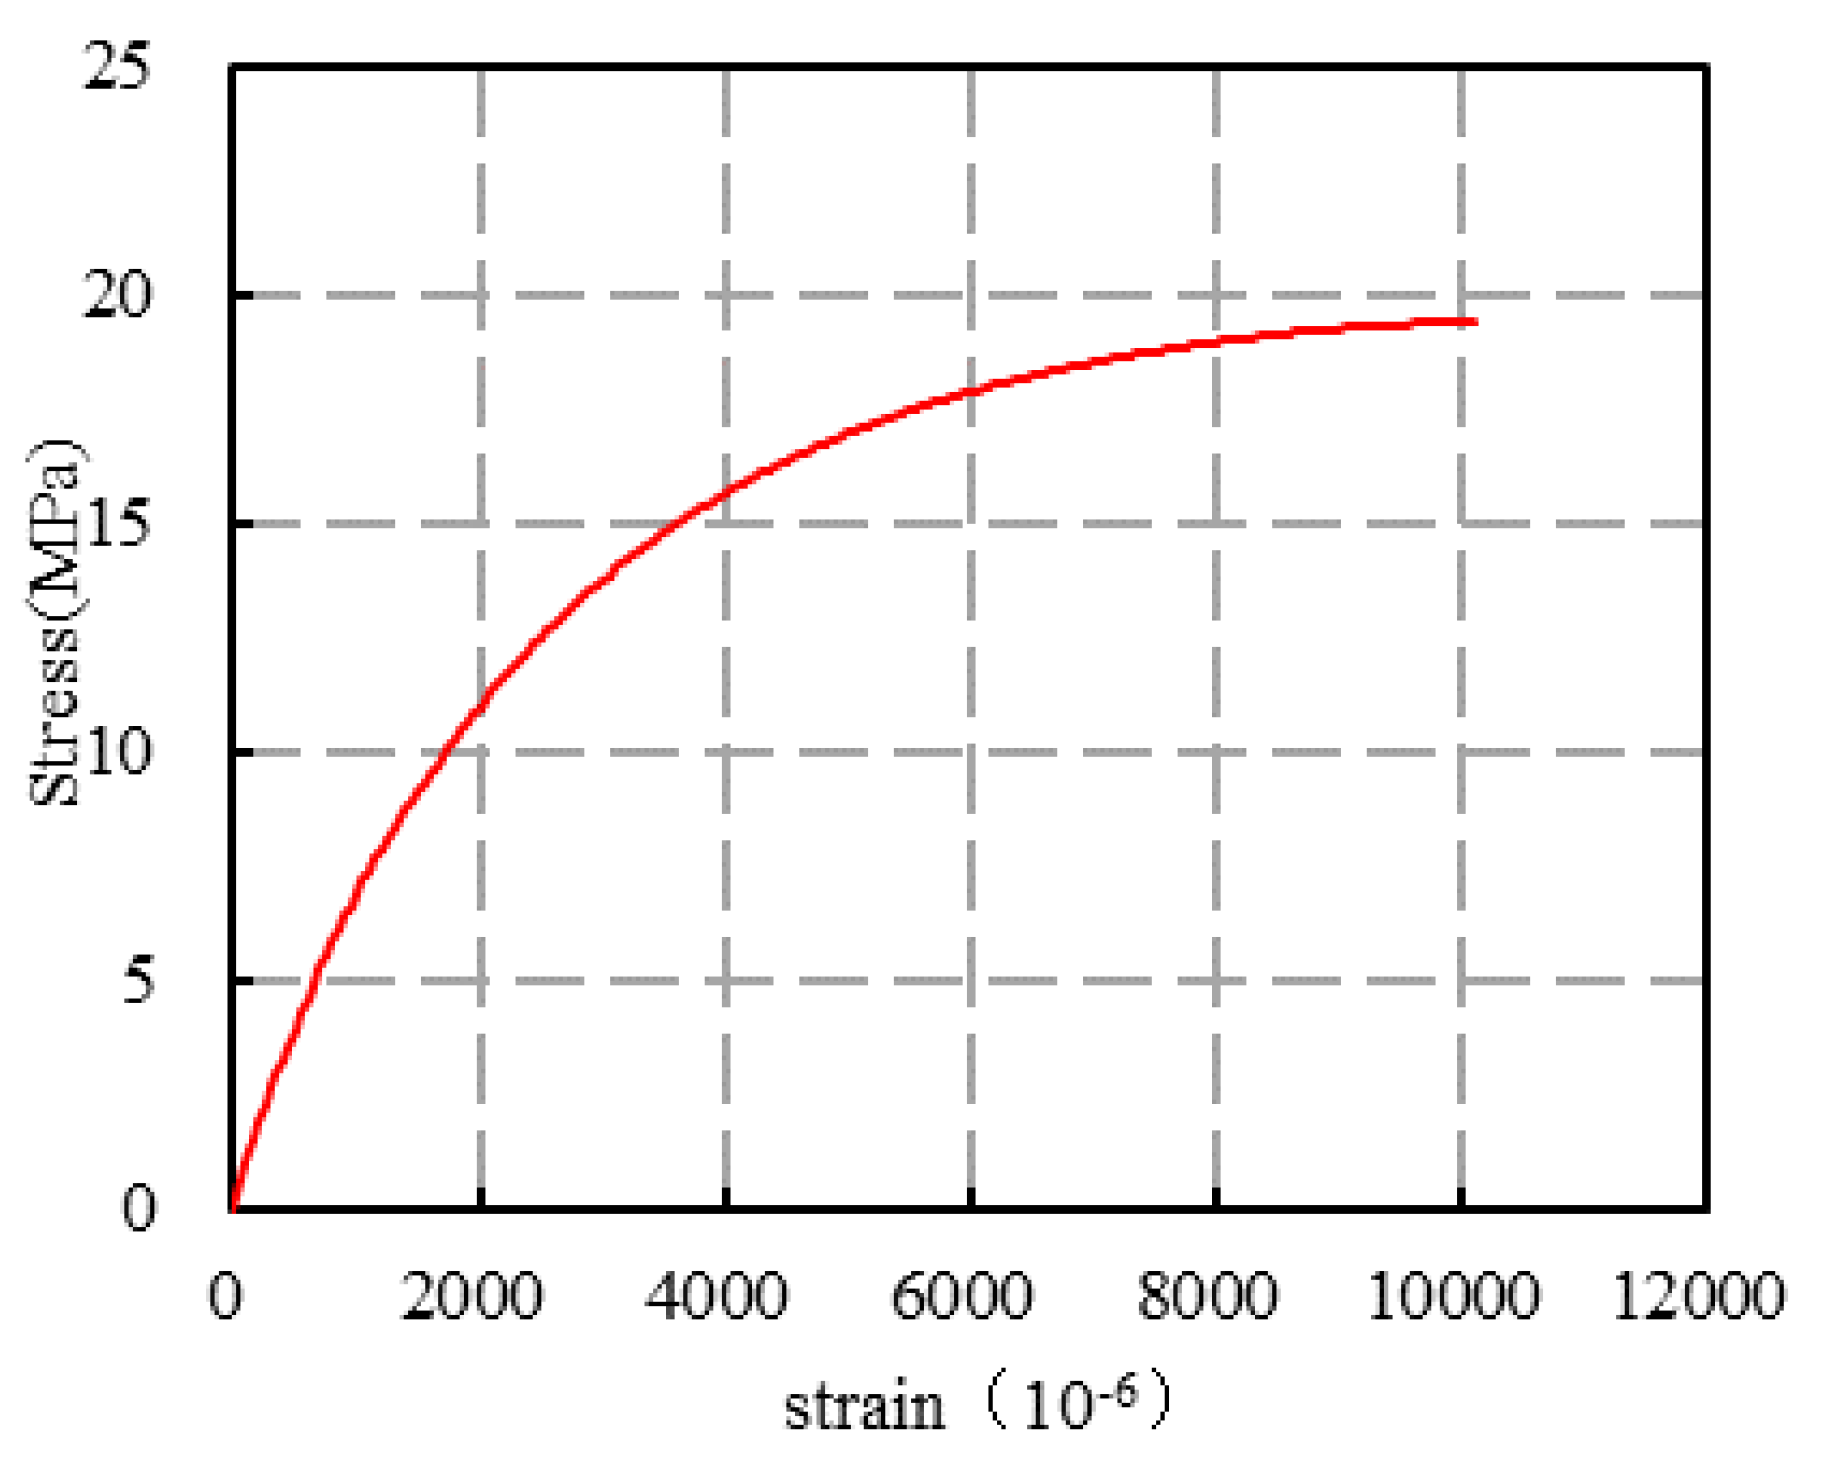
14 used in this study should adopt a double line model (Figure 15a) and the Applsci 14 03999 i00110 a double line reinforcement model (Figure 15b). The expression is as follows:
σ s 1 = E 1 ε s 0 < ε s ε y f y ε y < ε s ε su
σ s 2 = E 1 ε s 0 < ε s ε y f y + E 2 ε s ε y ε y < ε s ε su
where E1 is the elastic modulus of the reinforcement; εy is the yield strain of the reinforcement; εsu is the peak strain of the reinforcement, where the peak strain of the steel bar takes 0.01 when its value is greater than 0.01; fy is the yield strength of the reinforcement; and E2 is the slope of the reinforcement section.
By comparing Formulae (2) and (3), it can be seen that Formula (2) is a special case when E2 is 0 in Formula (3). The subsequent theoretical derivation of the steel bar material expression is mainly based on Formula (3).
According to the material test results in Section 2.2, the values of steel bar material parameters in this study are shown in Table 5.

4.2.3. New Epoxy Mortar

The measured average stress–strain curve of the new epoxy mortar in Section 2.2 was fitted with the three-fold line model, and the tensile constitutive model of the new epoxy mortar was obtained, as shown in Figure 16.
According to the test results, the material parameter values of epoxy mortar in this study are shown in Table 6.

4.3. Calculation Formula of Bearing Capacity

In the bending reinforcement of the reinforced concrete beam, in order to make the structure have sufficient ductility, it is necessary to ensure that the stressed reinforcement of the original beam reaches the yield state before failure. The above test results show that the failure state of the RC beam reinforced by the thin layer of epoxy mortar is the yield of the original beam until the thin layer reinforced by the new epoxy mortar is broken. The concrete in the compression area is not crushed. Figure 17 shows the strain distribution and the calculation of the bearing capacity.
When the concrete in the compression zone is not crushed, it can be divided into two cases: 0 < εc < εc0 and εc0 < εc < εcu, corresponding to the following two calculation formulae:
(1) When 0 < εc < εc0, the resultant force of the concrete compressive stress is as follows:
F c = 0 x c f c [ 1 ( 1 ε c ε c 0 y x c ) 2 ] b d y = f c b x c ε c ε c 0 ( 1 ε c 3 ε c 0 )
Let β c = ε c ε c 0 , then
F c = f c b x c β c ( 1 β c 3 )
where βc is the proportional coefficient of the compressive strain of the concrete in the compression zone; εc is the compressive strain value of the concrete compression zone; and εc0 is the compressive strain value corresponding to the peak stress of the concrete.
The distance yc between the application point of the compressive stress force Fc and the edge of the compressive zone of concrete is as follows:
y c = x c 1 0.25 β c 3 β c
The deformation coordination condition is as follows:
ε c ε E M u = x c h + t E M x c
ε c = x c h + t E M x c ε E M u
β c = ε c ε c 0 = ε c ε E M u ε E M u ε c 0 = x c h + t E M x c ε E M u ε c 0
ε s ε E M u = h 0 x c h + t E M x c
ε s = h 0 x c h + t E M x c ε E M u
The equilibrium equation in the direction of the horizontal force is as follows:
f c b x c β c ( 1 β c 3 ) = f y + E 2 ( ε s ε y ) A s + E E M ε E M u A E M
where xc is found by Formulae (7), (10), and (12), and then we solve for Fc, yc. The moment at the center of the reinforcement layer is as follows:
M d u = f c b x c β c ( 1 β c 3 ) ( h + t E M 2 y c ) f y + E 2 ( ε s ε y ) A s ( a s + t E M 2 )
The distance of the concrete force in the compression zone is as follows:
M d u = f y + E 2 ( ε s ε y ) A s ( h 0 y c ) + E E M ε E M u A E M ( h + t E M 2 y c )
(2) When εc0 < εc < εcu, the resultant force of the concrete compressive stress is as follows:
F c = 0 y 0 f c [ 1 ( 1 ε c ε c 0 y x ) 2 ] b d y + y 0 x c f c b d y = f c b x c ( 1 ε c 0 3 ε c )
Let β c = ε c ε c 0 , then
F c = f c b x c ( 1 1 3 β c )
The distance yc between the application point of the compressive stress force Fc and the edge of the compressive zone of the concrete is as follows:
y c = x c 1 1.5 β c 2 0.25 3 β c 2 β c
The equilibrium equation in the direction of the horizontal force is as follows:
f c b x c ( 1 1 3 β c ) = f y + E 2 ( ε s ε y ) A s + E E M ε E M u A E M
where xc is found by Formulae (7), (10), and (18), and then we solve for Fc, yc. The center of the reinforcement layer is as follows:
M d u = f c b x c ( 1 1 3 β c ) ( h + t E M 2 y c ) f y + E 2 ( ε s ε y ) A s ( a s + t E M 2 )
Or the distance of the concrete force in the compression zone is as follows:
M d u = f y + E 2 ( ε s ε y ) A s ( h 0 y c ) + E E M ε E M u A E M ( h + t E M 2 y c )
When the above formula is applied, it can be calculated as 0 < εc < εc0 first. If the obtained βc < 1 in the middle calculation, it is assumed that the calculation continues; otherwise, it is calculated as εc0 < εc < εcu.

4.4. Formula Verification

Using the above formula, the bearing capacities of the reinforcement beams A1 and B1 are calculated and verified, and the calculation results are shown in Table 7 below. From the table, it can be seen that the errors between the theoretical calculation results and the test results are −11.73% and 4.14%, respectively, and the calculated values are in good agreement with the test values, which indicates that the theoretical formulae derived in this paper can be used for predicting the ultimate load carrying capacity of the new type of high-strength and high-toughness epoxy resin mortar-reinforced RC beams and provide theoretical references for the practical reinforcing applications.

5. Conclusions

In this paper, the bending performance of reinforced RC beams with a new type of high-strength and high-toughness epoxy mortar thin layer was studied with the bending test, and the feasibility and effect of the reinforced material were verified. Based on the flat section assumption, the bending capacity of the reinforced RC beams was calculated. The main conclusions are as follows:
(1)
The contrast beams exhibited the typical bending failure modes. The failure mode of the reinforced beam was the yielding of the tensile reinforcement of the original beam and then fracture damage of the new epoxy mortar-reinforced thin layer.
(2)
No debonding phenomenon was observed between the reinforced thin layer and the original concrete, and no visible cracks appeared before the tensile failure occurred in the thin layer.
(3)
Compared with the corresponding contrast beams, the cracking load of the reinforcement beams A1 and B1 increased by 14% and 23% respectively, the yield load by 32% and 40%, respectively, and the peak load by 18% and 17%, respectively; the number of cracks developed slowly, but the crack width and spacing decreased significantly.
(4)
The stiffness of the reinforced beam, especially after cracking, was significantly higher than that of the unreinforced contrast beams, but the deformation ductility coefficient was significantly reduced.
(5)
For the calculation method of the epoxy mortar thin layer reinforcement RC beam proposed in this study, the calculated values showed a good agreement with the experimental values, with errors at −11.73% and 4.14%, respectively, which can provide support for related research on such reinforcement methods.
(6)
In this study, only two-point flexural tests were carried out on beams without initial stress, and the influence of load holding or immediate damage on the reinforcement effect was not considered. The follow-up plan is to carry out the relevant experimental research to provide a basis for the practical engineering application of the new epoxy mortar thin layer reinforced RC beam.

Author Contributions

Methodology, W.L.; Writing—original draft, X.H.; Writing—review & editing, T.W., L.L., X.L. and C.J. All authors have read and agreed to the published version of the manuscript.

Funding

This study was funded by Guangxi Science and Technology Planning Project (GuikeAD21159010), Doctoral Foundation of Guangxi University of Science and Technology (No: 21Z26) and Guangxi University young and middle-aged teachers research basic ability improvement project (No: 2020KY08021).

Data Availability Statement

The raw data supporting the conclusions of this article will be made available by the authors on request.

Conflicts of Interest

The authors declare no conflict of interest.

References

  1. Ferdosian, I.; Camoes, A. Mechanical performance and post-cracking behavior of self-compacting steel-fiber reinforced eco-efficient ultra-high performance concrete. Cem. Concr. Compos. 2021, 121, 104050. [Google Scholar] [CrossRef]
  2. Song, S.; Deng, M.; Zhang, M.; Guo, L.; Dong, Z.; Li, P. Flexural strengthening of reinforced concrete beams using textile-reinforced mortar improved with short PVA fibers. Structures 2023, 56, 104824. [Google Scholar] [CrossRef]
  3. Assad, M.; Hawileh, R.A.; Abdalla, J.A. Flexural strengthening of reinforced concrete beams with CFRP laminates and spike anchors. Compos. Part C Open Access 2024, 13, 100443. [Google Scholar] [CrossRef]
  4. Qasim, M.; Lee, C.K.; Zhang, Y.X. Flexural strengthening of reinforced concrete beams using hybrid fibre reinforced engineered cementitious composite. Eng. Struct. 2023, 284, 115992. [Google Scholar] [CrossRef]
  5. Sun, Y.; Fu, W.; Chen, X.; Zhang, Z.; Yu, W.; Li, S. Theoretical and experimental investigations into flexural behavior of existing reinforced concrete beams strengthened by CFRP bars. J. Build. Eng. 2023, 77, 107528. [Google Scholar] [CrossRef]
  6. Aljidda, O.; Alnahhal, W.; El Refai, A. Flexural strengthening of one-way reinforced concrete slabs using near surface-mounted BFRP bars. Eng. Struct. 2024, 303, 117507. [Google Scholar] [CrossRef]
  7. Gudonis, E.; Timinskas, E.; Gribniak, V.; Kaklauskas, G.; Arnautov, A.K.; Tamulėnas, V. FRP reinforcement for concrete structures: State-of-the-art review of application and design. Eng. Struct. Technol. 2014, 5, 147–158. [Google Scholar] [CrossRef]
  8. Wei, B.; He, X.; Zhou, M.; Wang, H.; He, J. Experimental study on flexural behaviors of FRP and steel bars hybrid reinforced concrete beams. Case Stud. Constr. Mater. 2024, 20, e02759. [Google Scholar] [CrossRef]
  9. Zhang, X.; Liu, G.; Shen, Z.; Gao, Y.; Zhou, H.; Wang, Z. A comprehensive study on the effect of reinforcing methods on the flexural behaviour of Concrete-RUHTCC composite beams. Eng. Struct. 2023, 292, 116524. [Google Scholar] [CrossRef]
  10. Li, Y.; Zhao, S.-M.; Yao, Z.-A.; Huang, X. Flexural behavior of reinforced concrete beams strengthened using recycled industrial steel-wire mesh high-performance mortar. Case Stud. Constr. Mater. 2023, 19, e02472. [Google Scholar] [CrossRef]
  11. Wang, W.W.; Zheng, Y.Z. Flexural strengthing RC beams using a composite reinforcement layer FRP grid and ECC. In Proceedings of the 12th International Symposium on Fiber Reinforced Polymers for Reinforced Concrete Structures&the 5th Asia-Pacific Conference on Fiber Reinforced Polymers in Structures (FRPRCS-12/APFIS-2015), Nanjing, China, 14–16 December 2015; pp. 140–146. [Google Scholar]
  12. Liu, D.; Qin, F.; Di, J.; Zhang, Z. Flexural behavior of reinforced concrete (RC) beams strengthened with carbon fiber reinforced polymer(CFRP)and ECC. Case Stud. Constr. Mater. 2023, 19, e02270. [Google Scholar] [CrossRef]
  13. Zheng, Y.Z.; Wang, W.W.; Brigham, J.C. Flexural behaviour of reinforced concrete beams strengthened with a composite reinforcement layer: BFRP grid and ECC. Constr. Build. Mater. 2016, 115, 424–437. [Google Scholar] [CrossRef]
  14. Zhang, K.; Shen, X.; Liu, J.; Teng, F.; Zhang, G.; Wang, J. Flexural strengthening of reinforced concrete T-beams using a composite of prestressed steel wire ropes embedded in polyurethane cement (PSWR-PUC): Theoretical analysis. Structures 2022, 44, 1278–1287. [Google Scholar] [CrossRef]
  15. Zhang, K.; Qi, T.; Zhu, Z.; Xue, X.; Shen, X. Strengthening of a Reinforced Concrete Bridge with a Composite of Prestressed Steel Wire Ropes Embedded in Polyurethane Cement. J. Perform. Constr. Facil. 2021, 35, 04021063. [Google Scholar] [CrossRef]
  16. Du, Y.X.; Shao, X.; Chu, S.H.; Zhou, F.; Su, R.K.L. Strengthening of preloaded RC beams using prestressed carbon textile reinforced mortar plates. Structures 2021, 30, 735–744. [Google Scholar] [CrossRef]
  17. Moy, C.K.S.; Revanna, N. Experimental and DIC Study of Reinforced Concrete Beams Strengthened by Basalt and Carbon Textile Reinforced Mortars in Flexure. Buildings 2023, 13, 1765. [Google Scholar] [CrossRef]
  18. Wang, W.; Zhu, Z.; Du, J.; Huan, S.; Cao, X. Flexural mechanical behavior of RC beams strengthening with BFRP grid and modified MMA resin concrete. J. Nanchang Univ. (Eng. Technol.) 2019, 41, 127–132. (In Chinese) [Google Scholar] [CrossRef]
  19. Li, Z.; Shen, A.; Zeng, G.; Chen, Z.; Guo, Y. Research progress on properties of basalt fiber-reinforced cement concrete. Mater. Today Commun. 2022, 33, 104824. [Google Scholar] [CrossRef]
  20. Yahye, M.A.; Liu, L.; Wu, H.; Sun, Y.; Sun, H.; Ma, J.; Zhang, L. Experimental research on mechanical properties of Fiber-Reinforced Polyurethane Elastic Concrete (FRPEC). Constr. Build. Mater. 2022, 328, 126929. [Google Scholar]
  21. Lokuge, W.; Aravinthan, T. Effect of fly ash on the behaviour of polymer concrete with different types of resin. Mater. Des. 2013, 51, 175–181. [Google Scholar] [CrossRef]
  22. Jiang, J.; Sui, K. Experimental study of compression performance of concrete cylinder strengthened by textile reinforced engineering cement composites. Acta Mater. Compos. Sin. 2019, 36, 1957–1967. (In Chinese) [Google Scholar]
  23. Luo, H.; Yang, D.; Zhou, X.; Shan, C.; Liu, X.; Zhao, F. Mechanical properties of polypropylene fiber reinforced concrete with different aspect ratios. Acta Mater. Compos. Sin. 2019, 36, 1935–1948. (In Chinese) [Google Scholar]
  24. Cheng, Z.; Yang, K.; Tang, Z.; Ge, F.; Zhou, X.; Zeng, X.; Ma, K.; Long, G. Experimental investigation on flexural and compressive toughness of mortar and concrete with hybrid toughening materials. Structures 2022, 43, 1592–1599. [Google Scholar] [CrossRef]
  25. Zhang, W.; Deng, M.; Han, Y.; Li, R.; Yang, S. Uniaxial tensile performance of high ductile fiber-reinforced concrete with built-in basalt textile grids. Constr. Build. Mater. 2022, 315, 125716. [Google Scholar] [CrossRef]
  26. Popa, M.-M.; Leuteritz, A.; Stommel, M.; Kühnert, I.; Mechtcherine, V.; Scheffler, C. Micromechanical study on polypropylene-bicomponent fibers to improve mechanical interlocking for application in strain-hardening cement-based composites. Cem. Concr. Compos. 2023, 142, 105181. [Google Scholar] [CrossRef]
  27. Ministry of Housing and Urban-Rural Development of the People’s Republic of China. GB/T 50010—2010; Code for Design of Concrete Structures. China Architecture & Building Press: Beijing, China, 2010. (In Chinese)
  28. Lv, X.; Huang, Y.; Zhang, B.; Peng, G.; Huo, H.; Qu, X.; Guo, H.; Liu, Y. Electrospun poly (arylene ether nitrile) fibers for interlaminar toughening of carbon fiber epoxy composites. Polym. Test. 2024, 130, 108299. [Google Scholar] [CrossRef]
  29. Meng, Y. Research on Strengthening Theory of Super High Toughness Resin Steel Wire Mesh Concrete and Prestressed Simple Supported Beam Bridge; Southwest Jiaotong University: Chengdu, China, 2021. (In Chinese) [Google Scholar]
  30. Zhang, K.; Sun, Q. The use of Wire Mesh-Polyurethane Cement (WM-PUC) composite to strengthen RC T-beams under flexure. J. Build. Eng. 2018, 15, 122–136. [Google Scholar] [CrossRef]
  31. DL/T 5193-2021; Technical Specification of Epoxy Resin Mortar. National Energy Board: Technical Committee on Standardization of Hydropower Construction in Electric Power Industry (DL/TC 29): Beijing, China, 2021.
Figure 1. Schematic diagram of beam construction (dimensions in mm).
Applsci 14 03999 g001
Figure 2. Dimensions and section of beams (dimensions in mm).
Applsci 14 03999 g002
Figure 3. Axial compression test and stress–strain curve.
Applsci 14 03999 g003
Figure 4. Tensile stress–strain curve of the reinforcement: (a) Applsci 14 03999 i00110; and (b) Applsci 14 03999 i00114.
Applsci 14 03999 g004
Figure 5. Tensile stress-strain curve of epoxy mortar.
Applsci 14 03999 g005
Figure 6. Mean stress-strain curve.
Applsci 14 03999 g006
Figure 7. Test beam loading photo.
Applsci 14 03999 g007
Figure 8. Loading device and measuring point layout.
Applsci 14 03999 g008
Figure 9. Failure mode of beams: (a) contrast beam A0; (b) strengthened beam A1; (c) contrast beam B0; and (d) strengthened beam B1.
Applsci 14 03999 g009aApplsci 14 03999 g009b
Figure 10. Test beam crack diagram: (a) contrast beam A0; (b) strengthened beam A1; (c) contrast beam B0; and (d) strengthened beam B1.
Applsci 14 03999 g010
Figure 11. The concrete protective layer is detached from the longitudinal steel bar interface.
Applsci 14 03999 g011
Figure 12. Load–mid-span deflection curve of beams.
Applsci 14 03999 g012
Figure 13. Strain distribution of strengthened beam B1 section.
Applsci 14 03999 g013
Figure 14. Concrete constitutive model curve.
Applsci 14 03999 g014
Figure 15. Reinforcement constitutive model curve: (a) containing yield phase; (b) no yield phase.
Applsci 14 03999 g015
Figure 16. Epoxy mortar constitutive model curve.
Applsci 14 03999 g016
Figure 17. Strain distribution and bearing capacity calculation diagram of the strengthened beam section: h, tEM, and h0—the section height of the original beam, the thickness of the reinforcement layer, and the distance from the top of the beam to the center of the tension bar; As and AEM—the section area of the tensile steel bar and the section area of the reinforcement layer; xc—the height of the concrete compression zone; and Fs and FEM—the resultant force of the tensile longitudinal bar and reinforcing layer.
Applsci 14 03999 g017
Table 1. Basic parameters of test beam.
Beam IDLongitudinal Steel BarLongitudinal Reinforcement RatioReinforcement Thickness/mm
A03Applsci 14 03999 i00114 0.6%0
A13Applsci 14 03999 i001140.6%15
B03Applsci 14 03999 i001101.18%0
B13Applsci 14 03999 i001101.18%15
Table 2. Mass ratio of each component of the novel epoxy resin mortar (Unit: g).
Epoxy ResinDiluentFlexibilizerDefoamerCuring AgentSilane Coupling AgentFly AshQuartz Sand
10010101.5333246369
Table 3. Results of experiments and analyses.
Beam IDCracking PointYield PointPeak PointLimiting Point P m P m , 0 μDestruction Mode
Pcr/kNfcr/mmPy/kNfy/mmPm/kNfm/mmPu/kNfu/mm
A026.060.58119.397.98143.2928.03121.8030.383.81A
A129.720.60158.229.53168.7216.45143.4117.551.181.84B
B019.700.3864.226.8686.7749.8473.7550.017.29A
B124.260.5990.277.17101.6126.3086.3727.971.173.90B
Table 4. Values of concrete material parameters.
Material Parameterfcd/MPaεc0/10−6εcu/10−6n
value34.6160025042
Table 5. Values of steel bar parameters.
MaterialsE1/MPaE2/MPaεy/10−6fy/MPaεcu/10−6
Applsci 14 03999 i00110200,0004915250050010,000
Applsci 14 03999 i00114200,0000225845210,000
Table 6. Values of epoxy mortar material parameters.
Material Parameterσmax/MPaε1/10−6ε2/10−6ε3/10−6
value19.401650460010,100
Table 7. Comparison of experimental and theoretical values of flexural capacity.
Beam IDExperimental Value/kNCalculated Value/kNDeviation/%
A1168.72151.00−11.73
B1101.61106.004.14
Disclaimer/Publisher’s Note: The statements, opinions and data contained in all publications are solely those of the individual author(s) and contributor(s) and not of MDPI and/or the editor(s). MDPI and/or the editor(s) disclaim responsibility for any injury to people or property resulting from any ideas, methods, instructions or products referred to in the content.

