
The Effect of Brain Anodal and Cathodal Transcranial Direct Current Stimulation on Psychological Refractory Period at Different Stimulus-Onset Asynchrony in Non-Fatigue and Mental Fatigue Conditions

Abstract
:1. Introduction
2. Materials and Methods
2.1. Participants
2.2. Study Design
2.3. Apparatus
2.4. Procedure
3. Results
3.1. RT2 Findings
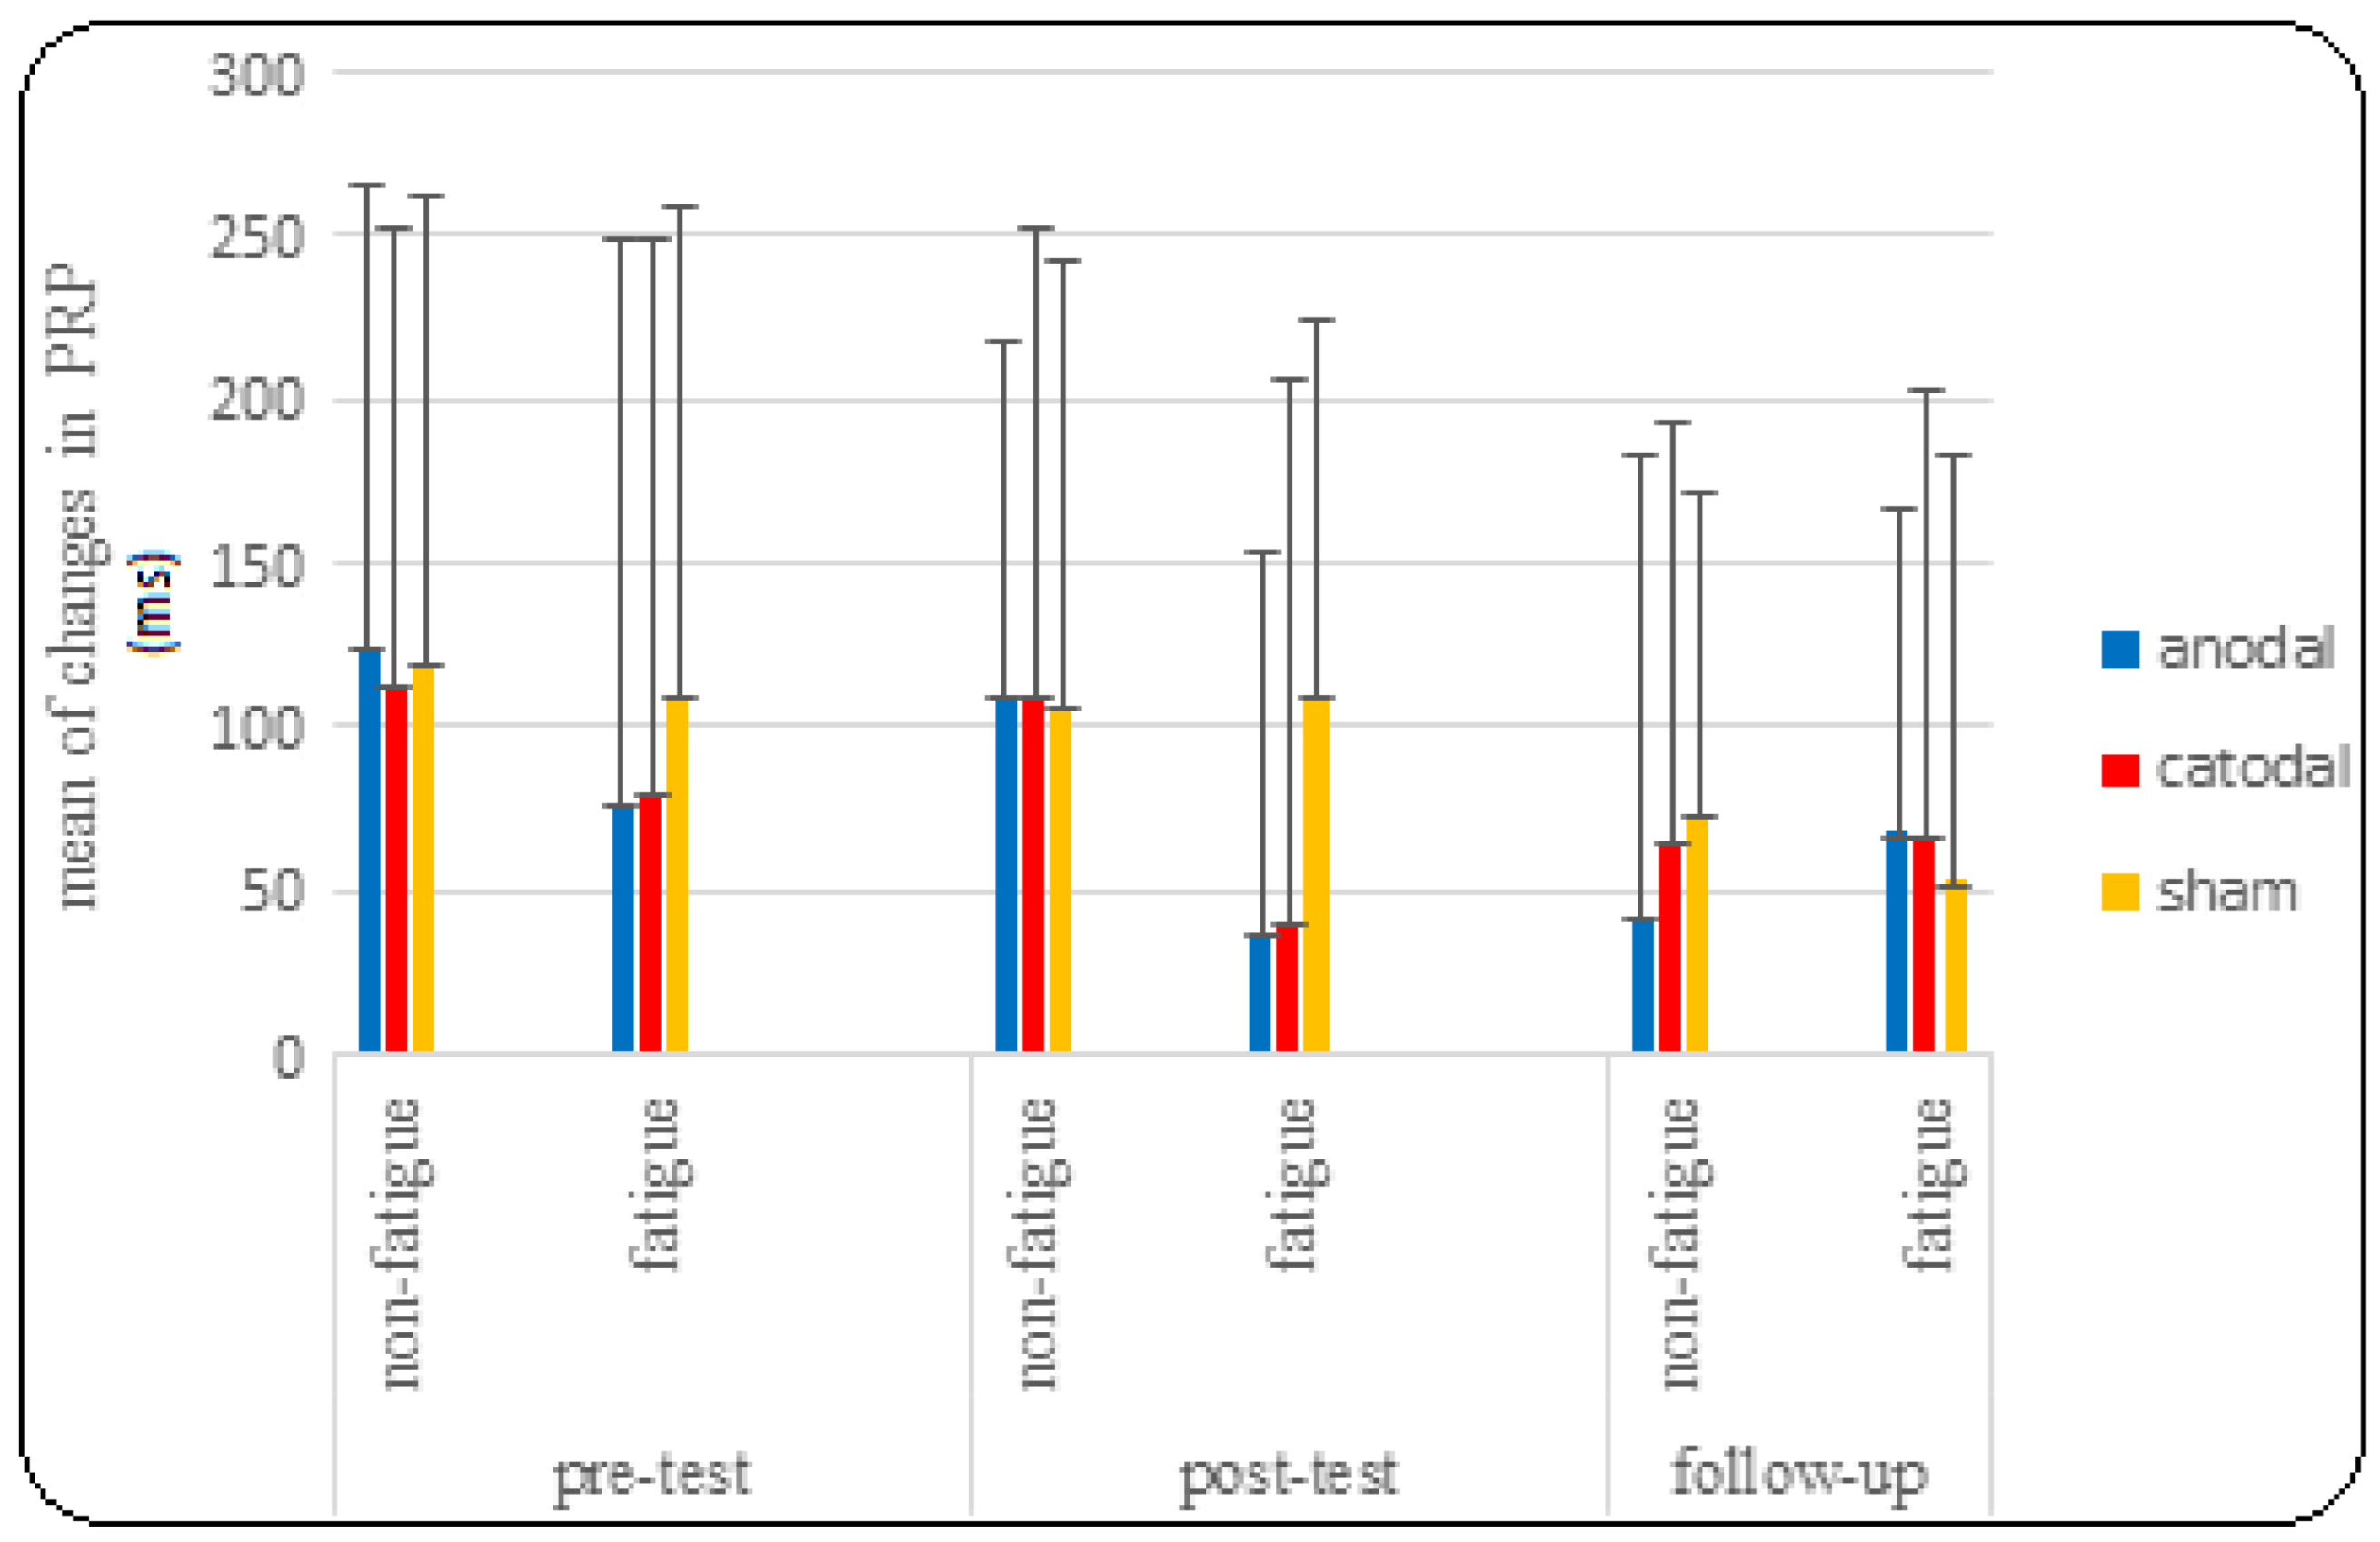
3.2. PRP Findings
4. Discussion
5. Conclusions
Author Contributions
Funding
Institutional Review Board Statement
Informed Consent Statement
Data Availability Statement
Acknowledgments
Conflicts of Interest
References
- Royal, K.A.; Farrow, D.; Mujika, I.; Halson, S.L.; Pyne, D.; Abernethy, B. The effects of fatigue on decision making and shooting skill performance in water polo players. J. Sports Sci. 2006, 24, 807–815. [Google Scholar] [CrossRef] [PubMed]
- Schmidt, R.A.; Wrisberg, C.A. Motor Learning and Performance, 2nd ed.; Human Kinetics: Champaign, IL, USA, 2000. [Google Scholar]
- Kunde, W.; Skirde, S.; Weigelt, M. Trust my face: Cognitive factors of head fakes in sports. J. Exp. Psychol. Appl. 2011, 17, 110. [Google Scholar] [CrossRef] [PubMed]
- Weigelt, M.; Güldenpenning, I.; Steggemann-Weinrich, Y.; Alhaj Ahmad Alaboud, M.; Kunde, W. Control over the processing of the opponent’s gaze direction in basketball experts. Psychon. Bull. Rev. 2017, 24, 828–834. [Google Scholar] [CrossRef] [PubMed]
- Henry, G.; Dawson, B.; Lay, B.; Young, W. Effects of a feint on reactive agility performance. J. Sports Sci. 2012, 30, 787–795. [Google Scholar] [CrossRef] [PubMed]
- Strobach, T.; Schütz, A.; Schubert, T. On the importance of Task 1 and error performance measures in PRP dual-task studies. Front. Psychol. 2015, 6, 123458. [Google Scholar] [CrossRef]
- Schmidt, R.A.; Lee, T.D. Motor Control and Learning: A Behavioral Emphasis, 4th ed.; Human Kinetics: Champaign, IL, USA, 2005. [Google Scholar]
- Pashler, H. Dual-task interference in simple tasks: Data and theory. Psychol. Bull. 1994, 116, 220. [Google Scholar] [CrossRef]
- Welford, A.T. The psychological refractory period and the timing of high-speed performance-a review and a theory. Br. J. Psychol. 1952, 43, 2. [Google Scholar] [CrossRef]
- Rau, P.L.; Zheng, J. Cross-modal psychological refractory period in vision, audition, and haptics. Atten. Percept. Psychophys. 2020, 82, 1573–1585. [Google Scholar] [CrossRef]
- Hoffmann, M.A.; Pieczykolan, A.; Koch, I.; Huestegge, L. Two sources of task prioritization: The interplay of effector-based and task order-based capacity allocation in the PRP paradigm. Atten. Percept. Psychophys. 2020, 82, 3402–3414. [Google Scholar] [CrossRef]
- Baurès, R.; DeLucia, P.R.; Olson, M.; Oberfeld, D. Asymmetric interference in concurrent time-to-contact estimation: Cousin or twin of the psychological refractory period effect? Atten. Percept. Psychophys. 2017, 79, 698–711. [Google Scholar] [CrossRef]
- Koch, I.; Poljac, E.; Müller, H.; Kiesel, A. Cognitive structure, flexibility, and plasticity in human multitasking—An integrative review of dual-task and task-switching research. Psychol. Bull. 2018, 144, 557. [Google Scholar] [CrossRef] [PubMed]
- Pieczykolan, A.; Huestegge, L. Action scheduling in multitasking: A multi-phase framework of response-order control. Atten. Percept. Psychophys. 2019, 81, 1464–1487. [Google Scholar] [CrossRef] [PubMed]
- Hommel, B. Automatic stimulus–response translation in dual-task performance. J. Exp. Psychol. Hum. Percept. Perform. 1998, 24, 1368. [Google Scholar] [CrossRef] [PubMed]
- Pieczykolan, A.; Huestegge, L. Cross-modal action complexity: Action-and rule-related memory retrieval in dual-response control. Front. Psychol. 2017, 8, 250608. [Google Scholar] [CrossRef] [PubMed]
- Eder, A.B.; Pfister, R.; Dignath, D.; Hommel, B. Anticipatory affect during action preparation: Evidence from backward compatibility in dual-task performance. Cogn. Emot. 2017, 31, 1211–1224. [Google Scholar] [CrossRef]
- Tombu, M.; Jolicœur, P. A central capacity sharing model of dual-task performance. J. Exp. Psychol. Hum. Percept. Perform. 2003, 29, 3. [Google Scholar] [CrossRef] [PubMed]
- Tombu, M.; Jolicœur, P. Testing the predictions of the central capacity sharing model. J. Exp. Psychol. Hum. Percept. Perform. 2005, 31, 790. [Google Scholar] [CrossRef] [PubMed]
- Dux, P.E.; Ivanoff, J.; Asplund, C.L.; Marois, R. Isolation of a central bottleneck of information processing with time-resolved fMRI. Neuron 2006, 52, 1109–1120. [Google Scholar] [CrossRef]
- Sigman, M.; Dehaene, S. Brain mechanisms of serial and parallel processing during dual-task performance. J. Neurosci. 2008, 28, 7585–7598. [Google Scholar] [CrossRef]
- Ivanoff, J.; Branning, P.; Marois, R. Mapping the pathways of information processing from sensation to action in four distinct sensorimotor tasks. Hum. Brain Mapp. 2009, 30, 4167–4186. [Google Scholar] [CrossRef]
- Hesselmann, G.; Flandin, G.; Dehaene, S. Probing the cortical network underlying the psychological refractory period: A combined EEG–fMRI study. Neuroimage 2011, 56, 1608–1621. [Google Scholar] [CrossRef] [PubMed]
- Brass, M.; Derrfuss, J.; Forstmann, B.; von Cramon, D.Y. The role of the inferior frontal junction area in cognitive control. Trends Cogn. Sci. 2005, 9, 314–316. [Google Scholar] [CrossRef] [PubMed]
- Diamond, A. Bootstrapping conceptual deduction using physical connection: Rethinking frontal cortex. Trends Cogn. Sci. 2006, 10, 212–218. [Google Scholar] [CrossRef] [PubMed]
- Filmer, H.L.; Mattingley, J.B.; Dux, P.E. Improved multitasking following prefrontal tDCS. Cortex 2013, 49, 2845–2852. [Google Scholar] [CrossRef] [PubMed]
- Volle, E.; Kinkingnéhun, S.; Pochon, J.B.; Mondon, K.; Thiebaut de Schotten, M.; Seassau, M.; Duffau, H.; Samson, Y.; Dubois, B.; Levy, R. The functional architecture of the left posterior and lateral prefrontal cortex in humans. Cereb. Cortex 2008, 18, 2460–2469. [Google Scholar] [CrossRef] [PubMed]
- Chase, H.W.; Boudewyn, M.A.; Carter, C.S.; Phillips, M.L. Transcranial direct current stimulation: A roadmap for research, from mechanism of action to clinical implementation. Mol. Psychiatry 2020, 25, 397–407. [Google Scholar] [CrossRef] [PubMed]
- DaSilva, A.F.; Volz, M.S.; Bikson, M.; Fregni, F. Electrode positioning and montage in transcranial direct current stimulation. JoVE (J. Vis. Exp.) 2011, 51, e2744. [Google Scholar]
- Machado, D.G.; Unal, G.; Andrade, S.M.; Moreira, A.; Altimari, L.R.; Brunoni, A.R.; Perrey, S.; Mauger, A.R.; Bikson, M.; Okano, A.H. Effect of transcranial direct current stimulation on exercise performance: A systematic review and meta-analysis. Brain Stimul. 2019, 12, 593–605. [Google Scholar] [CrossRef] [PubMed]
- Mutz, J.; Edgcumbe, D.R.; Brunoni, A.R.; Fu, C.H. Efficacy and acceptability of non-invasive brain stimulation for the treatment of adult unipolar and bipolar depression: A systematic review and meta-analysis of randomised sham-controlled trials. Neurosci. Biobehav. Rev. 2018, 92, 291–303. [Google Scholar] [CrossRef]
- Ehrhardt, S.E.; Filmer, H.L.; Wards, Y.; Mattingley, J.B.; Dux, P.E. The influence of tDCS intensity on decision-making training and transfer outcomes. J. Neurophysiol. 2021, 125, 385–397. [Google Scholar] [CrossRef]
- Rothwell, J.; Antal, A.; Burke, D.; Carlsen, A.; Georgiev, D.; Jahanshahi, M.; Sternad, D.; Valls-Solé, J.; Ziemann, U. Central nervous system physiology. Clin. Neurophysiol. 2021, 132, 3043–3083. [Google Scholar] [CrossRef] [PubMed]
- Radman, T.; Ramos, R.L.; Brumberg, J.C.; Bikson, M. Role of cortical cell type and morphology in subthreshold and suprathreshold uniform electric field stimulation in vitro. Brain Stimul. 2009, 2, 215–228. [Google Scholar] [CrossRef] [PubMed]
- Thair, H.; Holloway, A.L.; Newport, R.; Smith, A.D. Transcranial direct current stimulation (tDCS): A beginner’s guide for design and implementation. Front. Neurosci. 2017, 11, 276151. [Google Scholar] [CrossRef] [PubMed]
- Nitsche, M.A.; Cohen, L.G.; Wassermann, E.M.; Priori, A.; Lang, N.; Antal, A.; Paulus, W.; Hummel, F.; Boggio, P.S.; Fregni, F.; et al. Transcranial direct current stimulation: State of the art 2008. Brain Stimul. 2008, 1, 206–223. [Google Scholar] [CrossRef]
- Abedanzadeh, R.; Alboghebish, S.; Barati, P. The effect of transcranial direct current stimulation of dorsolateral prefrontal cortex on performing a sequential dual task: A randomized experimental study. Psicol. Reflexão Crítica 2021, 34, 30. [Google Scholar] [CrossRef] [PubMed]
- Gálvez, V.; Alonzo, A.; Martin, D.; Loo, C.K. Transcranial direct current stimulation treatment protocols: Should stimulus intensity be constant or incremental over multiple sessions? Int. J. Neuropsychopharmacol. 2013, 16, 13–21. [Google Scholar] [CrossRef] [PubMed]
- Nitsche, M.A.; Schauenburg, A.; Lang, N.; Liebetanz, D.; Exner, C.; Paulus, W.; Tergau, F. Facilitation of implicit motor learning by weak transcranial direct current stimulation of the primary motor cortex in the human. J. Cogn. Neurosci. 2003, 15, 619–626. [Google Scholar] [CrossRef] [PubMed]
- Nitsche, M.A.; Paulus, W. Transcranial direct current stimulation–update 2011. Restor. Neurol. Neurosci. 2011, 29, 463–492. [Google Scholar] [CrossRef] [PubMed]
- Monte-Silva, K.; Kuo, M.F.; Liebetanz, D.; Paulus, W.; Nitsche, M.A. Shaping the optimal repetition interval for cathodal transcranial direct current stimulation (tDCS). J. Neurophysiol. 2010, 103, 1735–1740. [Google Scholar] [CrossRef]
- Alonzo, A.; Brassil, J.; Taylor, J.L.; Martin, D.; Loo, C.K. Daily transcranial direct current stimulation (tDCS) leads to greater increases in cortical excitability than second daily transcranial direct current stimulation. Brain Stimul. 2012, 5, 208–213. [Google Scholar] [CrossRef]
- Filmer, H.L.; Varghese, E.; Hawkins, G.E.; Mattingley, J.B.; Dux, P.E. Improvements in attention and decision-making following combined behavioral training and brain stimulation. Cereb. Cortex 2017, 27, 3675–3682. [Google Scholar] [CrossRef] [PubMed]
- Dux, P.E.; Tombu, M.N.; Harrison, S.; Rogers, B.P.; Tong, F.; Marois, R. Training improves multitasking performance by increasing the speed of information processing in human prefrontal cortex. Neuron 2009, 63, 127–138. [Google Scholar] [CrossRef] [PubMed]
- Filmer, H.L.; Mattingley, J.B.; Marois, R.; Dux, P.E. Disrupting prefrontal cortex prevents performance gains from sensory-motor training. J. Neurosci. 2013, 33, 18654–18660. [Google Scholar] [CrossRef] [PubMed]
- Molero-Chamizo, A.; Alameda Bailén, J.R.; Garrido Béjar, T.; García López, M.; Jaén Rodríguez, I.; Gutiérrez Lérida, C.; Pérez Panal, S.; González Ángel, G.; Lemus Corchero, L.; Ruiz Vega, M.J.; et al. Poststimulation time interval-dependent effects of motor cortex anodal tDCS on reaction-time task performance. Cogn. Affect. Behav. Neurosci. 2018, 18, 167–175. [Google Scholar] [CrossRef] [PubMed]
- Drummond, N.M.; Hayduk-Costa, G.; Leguerrier, A.; Carlsen, A.N. Effector-independent reduction in choice reaction time following bi-hemispheric transcranial direct current stimulation over motor cortex. PLoS ONE 2017, 12, e0172714. [Google Scholar] [CrossRef] [PubMed]
- Möckel, T.; Beste, C.; Wascher, E. The effects of time on task in response selection-an ERP study of mental fatigue. Sci. Rep. 2015, 5, 10113. [Google Scholar] [CrossRef] [PubMed]
- Trecroci, A.; Boccolini, G.; Duca, M.; Formenti, D.; Alberti, G. Mental fatigue impairs physical activity, technical and decision-making performance during small-sided games. PLoS ONE 2020, 15, e0238461. [Google Scholar] [CrossRef] [PubMed]
- Sun, H.; Soh, K.G.; Roslan, S.; Wazir, M.R.; Soh, K.L. Does mental fatigue affect skilled performance in athletes? A systematic review. PLoS ONE 2021, 16, e0258307. [Google Scholar] [CrossRef] [PubMed]
- Pavelka, R.; Třebický, V.; Třebická Fialová, J.; Zdobinský, A.; Coufalová, K.; Havlíček, J.; Tufano, J.J. Acute fatigue affects reaction times and reaction consistency in Mixed Martial Arts fighters. PLoS ONE 2020, 15, e0227675. [Google Scholar] [CrossRef]
- Lim, J.; Wu, W.C.; Wang, J.; Detre, J.A.; Dinges, D.F.; Rao, H. Imaging brain fatigue from sustained mental workload: An ASL perfusion study of the time-on-task effect. Neuroimage 2010, 49, 3426–3435. [Google Scholar] [CrossRef]
- Müller, T.; Apps, M.A. Motivational fatigue: A neurocognitive framework for the impact of effortful exertion on subsequent motivation. Neuropsychologia 2019, 123, 141–151. [Google Scholar] [CrossRef] [PubMed]
- Weissman, D.H.; Giesbrecht, B.; Song, A.W.; Mangun, G.R.; Woldorff, M.G. Conflict monitoring in the human anterior cingulate cortex during selective attention to global and local object features. Neuroimage 2003, 19, 1361–1368. [Google Scholar] [CrossRef] [PubMed]
- Nikooharf Salehi, E.; Jaydari Fard, S.; Jaberzadeh, S.; Zoghi, M. Transcranial direct current stimulation reduces the negative impact of mental fatigue on swimming performance. J. Mot. Behav. 2022, 54, 327–336. [Google Scholar] [CrossRef] [PubMed]
- Devanathan, D.; Madhavan, S. Effects of anodal tDCS of the lower limb M1 on ankle reaction time in young adults. Exp. Brain Res. 2016, 234, 377–385. [Google Scholar] [CrossRef] [PubMed]
- Vince, M.A. Rapid response sequences and the psychological refractory period. Br. J. Psychol. 1949, 40, 23. [Google Scholar]
- Allen, P.A.; Smith, A.F.; Vires-Collins, H.; Sperry, S. The psychological refractory period: Evidence for age differences in attentional time-sharing. Psychol. Aging 1998, 13, 218. [Google Scholar] [CrossRef] [PubMed]
- Oldfield, R.C. The assessment and analysis of handedness: The Edinburgh inventory. Neuropsychologia 1971, 9, 97–113. [Google Scholar] [CrossRef] [PubMed]
- Nouri, K.; Shetab Booshehri, S.N.; Doustan, M. The Effect Foreperiod and Time Intervals between Stimuli on the Psychological Refractory Period: Evidence for Preparation. J. Sports Mot. Dev. Learn. 2021, 13, 73–90. [Google Scholar]
- Tanaka, M.; Shigihara, Y.; Ishii, A.; Funakura, M.; Kanai, E.; Watanabe, Y. Effect of mental fatigue on the central nervous system: An electroencephalography study. Behav. Brain Funct. 2012, 8, 48. [Google Scholar] [CrossRef]
- Bahrami, A.; Moradi, J.; Etaati, Z. The Effects of Transcranial Direct Current Stimulation (TDCS) on Mental Fatigue and performance of Basketball Player. Sport Psychol. Stud. 2021, 10, 167–186. [Google Scholar]
- Lee, K.A.; Hicks, G.; Nino-Murcia, G. Validity and reliability of a scale to assess fatigue. Psychiatry Res. 1991, 36, 291–298. [Google Scholar] [CrossRef] [PubMed]
- Manuel, A.L.; David, A.W.; Bikson, M.; Schnider, A. Frontal tDCS modulates orbitofrontal reality filtering. Neuroscience 2014, 265, 21–27. [Google Scholar] [CrossRef] [PubMed]
- Strobach, T.; Antonenko, D.; Abbarin, M.; Escher, M.; Flöel, A.; Schubert, T. Modulation of dual-task control with right prefrontal transcranial direct current stimulation (tDCS). Exp. Brain Res. 2018, 236, 227–241. [Google Scholar] [CrossRef]
- Woods, A.J.; Antal, A.; Bikson, M.; Boggio, P.S.; Brunoni, A.R.; Celnik, P.; Cohen, L.G.; Fregni, F.; Herrmann, C.S.; Kappenman, E.S.; et al. A technical guide to tDCS, and related non-invasive brain stimulation tools. Clin. Neurophysiol. 2016, 127, 1031–1048. [Google Scholar] [CrossRef]
- Paulus, W.; Nitsche, M.A.; Antal, A. Application of transcranial electric stimulation (tDCS, tACS, tRNS). European Psychologist. 2016, 21, 4–14. [Google Scholar] [CrossRef]
- Boggio, P.S.; Rigonatti, S.P.; Ribeiro, R.B.; Myczkowski, M.L.; Nitsche, M.A.; Pascual-Leone, A.; Fregni, F. A randomized, double-blind clinical trial on the efficacy of cortical direct current stimulation for the treatment of major depression. Int. J. Neuropsychopharmacol. 2008, 11, 249–254. [Google Scholar] [CrossRef]
- Brunoni, A.R.; Amadera, J.; Berbel, B.; Volz, M.S.; Rizzerio, B.G.; Fregni, F. A systematic review on reporting and assessment of adverse effects associated with transcranial direct current stimulation. Int. J. Neuropsychopharmacol. 2011, 14, 1133–1145. [Google Scholar] [CrossRef]
- Moffa, A.H.; Brunoni, A.R.; Fregni, F.; Palm, U.; Padberg, F.; Blumberger, D.M.; Daskalakis, Z.J.; Bennabi, D.; Haffen, E.; Alonzo, A.; et al. Safety and acceptability of transcranial direct current stimulation for the acute treatment of major depressive episodes: Analysis of individual patient data. J. Affect. Disord. 2017, 221, 1–5. [Google Scholar] [CrossRef]
- Aparício, L.V.; Guarienti, F.; Razza, L.B.; Carvalho, A.F.; Fregni, F.; Brunoni, A.R. A systematic review on the acceptability and tolerability of transcranial direct current stimulation treatment in neuropsychiatry trials. Brain Stimul. 2016, 9, 671–681. [Google Scholar] [CrossRef]
- Loo, C.K.; Alonzo, A.; Martin, D.; Mitchell, P.; Galvez, V.; Sachdev, P. A three-week, randomized, sham-controlled trial of transcranial direct current stimulation in depression. Br. J. Psychiatry 2012, 200, 1–8. [Google Scholar] [CrossRef]
- Abedanzadeh, R.; Alboghobish, S. The effect of transcranial direct current stimulus on selective attention in dual task paradigm. J. Appl. Psychol. Res. 2017, 8, 1–14. [Google Scholar] [CrossRef]
- Pashler, H.; Johnston, J.C. Chronometric evidence for central postponement in temporally overlapping tasks. Q. J. Exp. Psychol. 1989, 41, 19–45. [Google Scholar] [CrossRef]
- Le Mansec, Y. Réaction D. Is reaction time altered by mental or physical exertion? Conséquences de la Fatigue sur la Performance en Tennis de Table. Ph.D. Thesis, Universite de Nantes, Nantes, France, 13 October 2017; p. 173. [Google Scholar]
- Xiao, Y.; Ma, F.; Lv, Y.; Cai, G.; Teng, P.; Xu, F.; Chen, S. Sustained attention is associated with error processing impairment: Evidence from mental fatigue study in four-choice reaction time task. PLoS ONE 2015, 10, e0117837. [Google Scholar] [CrossRef] [PubMed]
- Schubert, T. Processing differences between simple and choice reactions affect bottleneck localization in overlapping tasks. J. Exp. Psychol. Hum. Percept. Perform. 1999, 25, 408. [Google Scholar] [CrossRef]
- Jacobson, L.; Koslowsky, M.; Lavidor, M. tDCS polarity effects in motor and cognitive domains: A meta-analytical review. Exp. Brain Res. 2012, 216, 1–10. [Google Scholar] [CrossRef] [PubMed]
- Berryhill, M.E.; Martin, D. Cognitive effects of transcranial direct current stimulation in healthy and clinical populations: An overview. J. ECT 2018, 34, e25–e35. [Google Scholar] [CrossRef] [PubMed]
- Schroeder, P.A.; Plewnia, C. Beneficial effects of cathodal transcranial direct current stimulation (tDCS) on cognitive performance. J. Cogn. Enhanc. 2017, 1, 5–9. [Google Scholar] [CrossRef]
- Friehs, M.A.; Frings, C. Cathodal tDCS increases stop-signal reaction time. Cogn. Affect. Behav. Neurosci. 2019, 19, 1129–1142. [Google Scholar] [CrossRef]
- Moliadze, V.; Schmanke, T.; Andreas, S.; Lyzhko, E.; Freitag, C.M.; Siniatchkin, M. Stimulation intensities of transcranial direct current stimulation have to be adjusted in children and adolescents. Clin. Neurophysiol. 2015, 126, 1392–1399. [Google Scholar] [CrossRef]
- Samani, M.M.; Agboada, D.; Jamil, A.; Kuo, M.F.; Nitsche, M.A. Titrating the neuroplastic effects of cathodal transcranial direct current stimulation (tDCS) over the primary motor cortex. Cortex 2019, 119, 350–361. [Google Scholar] [CrossRef]
- Stagg, C.J.; Jayaram, G.; Pastor, D.; Kincses, Z.T.; Matthews, P.M.; Johansen-Berg, H. Polarity and timing-dependent effects of transcranial direct current stimulation in explicit motor learning. Neuropsychologia 2011, 49, 800–804. [Google Scholar] [CrossRef]
- Horvath, J.C.; Carter, O.; Forte, J.D. No significant effect of transcranial direct current stimulation (tDCS) found on simple motor reaction time comparing 15 different simulation protocols. Neuropsychologia 2016, 91, 544–552. [Google Scholar] [CrossRef]
- Rabipour, S.; Vidjen, P.S.; Remaud, A.; Davidson, P.S.; Tremblay, F. Examining the interactions between expectations and tDCS effects on motor and cognitive performance. Front. Neurosci. 2019, 12, 999. [Google Scholar] [CrossRef]
- Kimura, T.; Kaneko, F.; Nagamine, T. The effects of transcranial direct current stimulation on dual-task interference depend on the dual-task content. Front. Hum. Neurosci. 2021, 15, 653713. [Google Scholar] [CrossRef]
- Sevilla-Sanchez, M.; Hortobágyi, T.; Carballeira, E.; Fogelson, N.; Fernandez-del-Olmo, M. A lack of timing-dependent effects of transcranial direct current stimulation (tDCS) on the performance of a choice reaction time task. Neurosci. Lett. 2022, 782, 136691. [Google Scholar] [CrossRef]


| PRP | RT2 | |||||
|---|---|---|---|---|---|---|
| Source | Partial Eta Squared | Sig | F | Partial Eta Squared | Sig | F |
| TEST | 0.136 | 0.005 * | 5.655 | 0.620 | 0.0001 * | 58.801 |
| TEST * group | 0.021 | 0.819 | 0.385 | 0.067 | 0.288 | 1.284 |
| FATIGUE | 0.120 | 0.033 * | 4.908 | 0.002 | 0.781 | 0.78 |
| FATIGUE * group | 0.026 | 0.621 | 0.482 | 0.043 | 0.457 | 0.801 |
| SOA | 0.694 | 0.0001 * | 81.812 | 0.694 | 0.0001 * | 81.812 |
| SOA * group | 0.052 | 0.454 | 0.979 | 0.052 | 0.454 | 0.979 |
| TEST * FATIGUE | 0.051 | 0.153 | 1.930 | 0.045 | 0.187 | 1.715 |
| TEST * FATIGUE * group | 0.060 | 0.343 | 1.144 | 0.090 | 0.143 | 1.776 |
| TEST * SOA | 0.048 | 0.057 | 1.798 | 0.048 | 0.057 * | 1.798 |
| TEST * SOA * group | 0.071 | 0.131 | 1.369 | 0.071 | 0.131 | 1.396 |
| FATIGUE * SOA | 0.019 | 0.676 | 0.684 | 0.019 | 0.676 | 0.684 |
| FATIGUE * SOA * group | 0.049 | 0.517 | 0.936 | 0.049 | 0.517 | 0.936 |
| TEST * FATIGUE * SOA | 0.031 | 0.317 | 1.163 | 0.031 | 0.317 | 1.163 |
| TEST * FATIGUE * SOA * group | 0.045 | 0.643 | 0.852 | 0.045 | 0.643 | 0.852 |
Disclaimer/Publisher’s Note: The statements, opinions and data contained in all publications are solely those of the individual author(s) and contributor(s) and not of MDPI and/or the editor(s). MDPI and/or the editor(s) disclaim responsibility for any injury to people or property resulting from any ideas, methods, instructions or products referred to in the content. |
© 2024 by the authors. Licensee MDPI, Basel, Switzerland. This article is an open access article distributed under the terms and conditions of the Creative Commons Attribution (CC BY) license (https://creativecommons.org/licenses/by/4.0/).
Share and Cite
Hafezi, S.; Doustan, M.; Saemi, E. The Effect of Brain Anodal and Cathodal Transcranial Direct Current Stimulation on Psychological Refractory Period at Different Stimulus-Onset Asynchrony in Non-Fatigue and Mental Fatigue Conditions. Brain Sci. 2024, 14, 477. https://doi.org/10.3390/brainsci14050477
Hafezi S, Doustan M, Saemi E. The Effect of Brain Anodal and Cathodal Transcranial Direct Current Stimulation on Psychological Refractory Period at Different Stimulus-Onset Asynchrony in Non-Fatigue and Mental Fatigue Conditions. Brain Sciences. 2024; 14(5):477. https://doi.org/10.3390/brainsci14050477
Chicago/Turabian StyleHafezi, Somayeh, Mohammadreza Doustan, and Esmaeel Saemi. 2024. "The Effect of Brain Anodal and Cathodal Transcranial Direct Current Stimulation on Psychological Refractory Period at Different Stimulus-Onset Asynchrony in Non-Fatigue and Mental Fatigue Conditions" Brain Sciences 14, no. 5: 477. https://doi.org/10.3390/brainsci14050477