
A Multi-Objective Scheduling Strategy for a Hybrid Energy System for Antarctic Coastal Research Stations


1
College of Electrical and Power Engineering, Taiyuan University of Technology, Taiyuan 030024, China
2
Shanxi Energy Internet Research Institute, Taiyuan 030032, China
3
Ocean Research Center of Zhoushan, Zhejiang University, Zhoushan 316021, China
*
Author to whom correspondence should be addressed.
J. Mar. Sci. Eng. 2024, 12(5), 781; https://doi.org/10.3390/jmse12050781
Submission received: 21 March 2024
/
Revised: 25 April 2024
/
Accepted: 5 May 2024
/
Published: 7 May 2024
(This article belongs to the Section Ocean Engineering)
Abstract
:A large number of research stations have been established to provide members of Antarctic expeditions with logistical support. A previous study confirmed that the wind and solar energy resources of the Chinese Zhongshan Station, a coastal station located in an area of Lassmann Hills in East Antarctica, are highly synergetic and complementary. Considering the demand for a renewable energy power supply in Zhongshan Station, this paper introduces a hybrid energy system with wind–solar–diesel–battery co-generation used as a power supply scheme. Based on the 2015 climate data for Zhongshan Station, the wind–solar resources, conventional energy system, and annual diesel consumption of the station area were analyzed. The annual electrical load demand of each building in the station area was quantitatively expounded. Compared with the original power supply system, and combined with the analysis results of the thermal load and electrical load demands of the station, an objective function based on the requirements of economy, reliability, and environmental protection was presented. According to the constraint conditions of the heat energy and electrical energy load balance in the station area, a multi-objective scheduling strategy for the system was designed. Finally, the effects of this scheduling strategy were analyzed under three different application scenarios. The results indicated that the annual load demand was significantly lower than before the scheduling, and that a 50% reduction in diesel consumption could be achieved, demonstrating that the multi-objective scheduling strategy proposed in this paper could achieve optimal energy scheduling and management of the renewable hybrid energy system.
1. Introduction
Antarctica plays an important role in the current climate system, stores crucial information about the past climate, and contains about 26.5 million km3 of frozen water [1,2]. A large number of research stations have been established to provide members of Antarctic expeditions with logistical support such as accommodation and scientific research conditions, especially for coastal research stations [3], to meet the requirements for monitoring environmental conditions and the impacts of human activities in Antarctica for participating countries according to the Antarctic Treaty System (ATS).
China has also established four research stations in Antarctica, namely, the Great Wall Station, Zhongshan Station, Kunlun Station, Taishan Station, and Qinlin Station [4,5]. Zhongshan Station, Great Wall Station and Qinlin Station are coastal stations, while Kunlun and Taishan are inland stations. Zhongshan Station is by far the largest Chinese research station in Antarctica, is close to the sea, and is also the base camp for the Chinese National Antarctica Research Expedition (CHINARE). Thus, Zhongshan Station, located in East Antarctica, has the inherent meteorological, regional and other environmental characteristics of the harbour, and it can be regarded as a port in order to conduct research for power supply system applications. At present, diesel, as the main source of electricity at Zhongshan Station, increases environmental pollution. It is also costly to transport diesel over long distances via the Xuelong and Xuelong II icebreakers. For research stations, electricity needs to be provided to meet energy demands for room heating, lighting, water purification, science equipment, and the disposal of waste. In view of this, the sustainable initiatives of the ATS are driving development and design of renewable energy systems to use green, sustainable energy for meeting the electricity loads of research stations.
Currently, Antarctic research stations, especially the coastal stations, that use renewable energy (RE) include Germany’s Georg von Neumayer Station, where a 20 kW prototype vertical-axis wind turbine has been built [6]. Scott Base has constructed wind farms on Ross Island to provide energy for the normal operation of the station [7]. Princess Elisabeth Station of Belgium has built a wind farm with nine 6 kW wind turbines, which can meet 65% of the station’s annual electricity demand [8]. A procedure to evaluate the feasibility of utilizing wind power for SANAE IV Station was proposed and the technical and economic aspects, such as low temperatures, ice and snow, transportation distances, and environmental issues, were analyzed [9]. Flat-plate solar thermal collectors have potential applications in Antarctica, as the snow smelter and PV modules could feasibly be used to meet the electrical demand of SANAE IV Station [10]. The technical facilities and technologies used at the Johann Gregor Mendel Station and the main components of the energy system were reported in detail in [11]. A distribution model of a hybrid energy system for the power network of Syowa Station and the use of an exhaust heat pump to maintain the load factor of the engine generator at a high level during periods of green energy fluctuations were proposed [12,13,14]. Wasa Station developed a system of 48 solar panels to meet most of its operational power needs of [15]. The design of a photovoltaic–wind power system for the Concordia Antarctic Base was presented, and the possible contribution of RE during different seasons was simulated and estimated [16]. A hydrogen vector system for effective energy storage in cold regions at high latitudes was proposed [17]. A demand-side management method based on the combination of activity plans for Antarctic research stations was designed and proposed to improve the load factor of the generators and reduce maintenance costs [18,19].
As a coastal research station with a harbor, the application of RE at Zhongshan Station can be conceptualized as a harbor wind–solar hybrid energy system. In recent years, coastal and port hybrid RE systems have been studied in conventional environments, and the energy scheduling and optimization design of such systems were also thoroughly explored [20,21]. A hybrid wind and rainwater energy harvesting system for applications in sea-crossing bridges was designed and was shown to have excellent performance in generating energy under different conditions [22]. A method for optimizing the installation capacity and operational strategy of a hybrid RE system with offshore wind energy for a green container terminal was proposed that used a container terminal in Northeast China as an example [23]. A decision support model for optimizing the operation and maintenance strategies of an offshore RE farm, taking into account reliability data from simulated equipment and estimates of the energy produced, was established, resulting in a range of results in terms of the wind farm’s availability and maintainability. The generated information can support operational and strategic decisions regarding offshore farms [24].
Furthermore, some scholars have carried out the design and optimization of an offshore wind–solar–storage hybrid energy system, and have carried out optimization scheduling research on a system based on the multi-objective group algorithm [25]. This included optimization using a simulated annealing algorithm of a hybrid system for RE including: battery and hydrogen storage [26]; optimal sizing of a hybrid PV–diesel–battery ship power system using HOMER [27,28,29]; modeling to achieve multi-objective optimized operations based on the demand-side grid and approximation-based fuzzy multi-objective models with expected objectives and chance constraints [30]; and determining the optimal allocation and sizing of a hybrid energy system for minimizing its life cycle cost, carbon emissions, and dump energy [31,32,33,34]. For energy scheduling, a profit allocation strategy for distributed energy based on game theory was proposed [35]. Smart microgrid energy and reserve scheduling with demand–response using stochastic optimization have been widely used, almost all of which achieved the optimization of stochastic energy and reserve scheduling for a microgrid (MG) [36], a decrease in total operation costs considering various types of demand–response (DR) programs for an MG [37], and more efficient use of energy-centering in DR programs. A novel multi-objective planning framework was proposed, which provided flexibility to decision makers in selecting the best available alternative for BESS (among different types) to minimize mismatches between the forecasted generation schedule and the actual generation of OWF, while taking into account economical and operational reliability issues [38]. An optimization framework with two levels to simultaneously decide the layout and operation of a wind farm (WF) and battery energy storage (BES) was put forward. The model consists of determining the WF/BES capacities, the WF configuration, and the connection buses using a mixed-discrete particle swarm optimization algorithm and a genetic algorithm [39]. A multi-objective optimization approach was provided that combines multi-objective particle swarm optimization and a rule-based energy management strategy for an on-gird offshore wind–hydrogen–battery system to simultaneously address economic (Eco), qualified rate of smoothing offshore wind power fluctuations (QRS), and the rate of offshore wind power curtailment (ROC) [40]. A two-step multi-objective optimization framework for renewable energy planning was proposed for Turkey, and a state-of-the-art metaheuristic competitive multi-objective particle swarm optimizer (CMOPSO) was used [41].
To sum up, in order to take full advantage of RE and meet the needs of ecological environmental protection in Antarctica, it is vital to study the technical and economic feasibility of utilizing RE and the optimal design and scheduling strategy of an RE system for Antarctic research stations. The existing research on coastal renewable hybrid energy systems mainly focuses on their optimal operation and design, but less on energy system scheduling. In addition, the research on system scheduling is mostly limited to applications in conventional environments, and the research on coastal power supply system scheduling under extreme environments, such as extremely low temperatures and strong winds, is relatively sparse. In this paper, a multi-objective optimization scheduling strategy for a hybrid energy system in a coastal station in the extreme Antarctic environment of the Chinese Zhongshan Station is proposed and analyzed in detail. The study will contribute towards the comprehensive study of renewable hybrid energy system scheduling in coastal and island application scenarios and multi-meteorological environmental conditions.
In this study, a multi-objective scheduling strategy for a hybrid energy system at Chinese Zhongshan Station is proposed. The strategy fully considers the different wind and solar resources and electric load conditions of Zhongshan Station in Antarctica. The influence of polar environmental conditions on the energy generated by the wind and solar systems is considered as a key factor in the establishment of the objective function, which makes the objective function more specific to the polar scenario. Considering the unstable speed of wind turbines under the cold conditions of Antarctica and under the strong wind conditions, the electrical performance of photovoltaic panels under the snow and ice coverage is reduced. As the demand–response of the electrical load and thermal load on the output of each generator set is different than the influence of various factors in a traditional environment, influencing factors should be considered to restrict the demand–response and balance of the electric heating. In Section 2, the climate conditions and conventional energy system of Zhongshan Station are presented. The description of the hybrid energy system of Chinese Zhongshan Station is presented in Section 3. In Section 4, the objective function and design constraints, such as power demand and supply balance, thermal power balance, electrical network constraints and heating network constraints, are discussed and explained in detail. The results of case studies are implemented in Section 4. Finally, the paper is concluded in Section 5.
2. Climate Conditions and Conventional Energy System of Zhongshan Station
2.1. Climate Conditions of Zhongshan Station
The meteorological data used in this study were obtained from an automatic weather station in Zhongshan Station, which is located on the Larsemann Hills along the southeastern coast of Prydz Bay. As shown in Figure 1, the meteorological data that were obtained from the automatic weather station include the air temperature, wind speed, wind direction, air pressure and relative humidity from December 2014 to November 2015. The sampling interval of the automatic weather station is 1 h. During this period, the mean air temperature was −11.2 °C with a negative anomaly of 1.6 °C compared with the mean air temperature in 2006 (−9.6 °C). The lowest air temperature was −39.9 °C on 8 July; the highest was 8.3 °C on 21 December. The lowest monthly mean air temperature occurred in July (−21.9 °C) and the highest in January (0.76 °C).
Figure 2 shows the wind speed and air pressure at Zhongshan Station from December 2014 to November 2015. The mean wind speed in this period was 6.3 m/s from December 2014 to November 2015. The lowest and highest wind speeds were 0 m/s and 26.3 m/s, respectively. The lowest monthly mean wind speed occurred in January (4.6 m/s) and the highest in June (9.25 m/s). The lowest air pressure was 942.3 hPa on 10 April and the highest was 1013.3 hPa, on 18 July. The mean air pressure was 982.4 hPa. The lowest monthly mean air pressure occurred in September (941.3 hPa) and the highest in October (1022.8 hPa). The wind speed and air pressure show a negative correlation, with a correlation coefficient of −0.21. Increased cyclone activity led to higher wind speeds, and the air pressure was therefore reduced.
Figure 3 shows the relative humidity at Zhongshan Station from December 2014 to November 2015. The average relative humidity was 59.6%. The lowest relative humidity was 26% on 24 October and the highest was 96% on 24 November. The lowest monthly mean relative humidity occurred in October (51.5%) and the highest occurred in September (72.3%).
In the region of Zhongshan Station, polar day occurs from late November to early February, and polar night occurs from late May to late July. The solar radiation data used in this study were obtained from the ERA reanalysis data, in which solar radiation reanalysis was verified at different temporal and spatial scales based on ground station observation data. The solar radiation at Zhongshan Station, from December 2014 to November 2015, is shown in Figure 4. The lowest and highest solar radiation values were 0 W/m2 and 1035 W/m2, respectively.
The long-term liquid water content data for Zhongshan Station were also obtained from the ERA reanalysis data. By decomposing the data on the liquid water content in ERA-Interim products, the annual distribution of the liquid water content at Zhongshan Station can be obtained. The time resolution of the liquid water content data is 1 h. The liquid water content at Zhongshan Station from December 2014 to November 2015 is shown in Figure 5.
During this period, the distribution of liquid water content of Zhongshan Station showed a seasonal difference. The average annual liquid water content of Zhongshan Station in Antarctica is 0.021 kg/m3. The highest liquid water content was between December 2014 and March 2015, which was in polar day.
2.2. Conventional Energy System of Zhongshan Station
Although Zhongshan Station has undergone several renovations, the scene in our study includes the main components of Zhongshan Station. There are about 17 main buildings such as power buildings, accommodation buildings, various antennas, oil storage tanks and warehouses in Zhongshan Station. The arrangement of the buildings and configuration of the conventional electric power and heating networks of Zhongshan Station are shown in Figure 6. The basic information of the main buildings of Zhongshan Station is shown in Table 1. ZS-1 is an office building for overwintering, which is the largest building in Zhongshan Station. ZS-2 is a residence building for overwintering. ZS-3 is a residence building for over-summering, which can only maintain low power consumption in winter. ZS-4 and ZS-5 are two power generation buildings and generators are placed in power generation buildings. ZS-6 is an observation building for the polar upper atmosphere and overwintering members carry out observation work during the polar night. ZS-7 is a meteorological observation building. ZS-8, ZS-9, ZS-11, ZS-12, ZS-13, and ZS-14 are warehouses of Zhongshan Station. ZS-10 is a garage for the maintenance of all vehicles in Zhongshan Station. ZS-15 are antennas in Zhongshan Station. ZS-16 are oil storage tanks in Zhongshan Station. The main power supply of Zhongshan Station is the central power supply, which consists of three diesel generators (DGs). The central power supply is linked to all buildings at Zhongshan Station through a power line. Heating for each building is currently supplied from the boilers. Heat consumption is mainly through heating and hot water. Table 2 shows the monthly fuel consumption of Zhongshan Station. The fuel demand of Zhongshan Station is closely related to local climate conditions. There is a good correlation between the variation trend of monthly fuel consumption and the variation of air temperature of Zhongshan Station. The peak of fuel consumption coincides with the period of lower monthly air temperatures (May, June, July and August).
3. Hybrid Energy System of Zhongshan Station
3.1. Design of the Hybrid Energy System
As can be seen from the former section, Zhongshan Station has rich wind and solar resources, and there is a high degree of synergy and complementarity between them. In view of this, this study aims at proposing a wind–solar–DG–battery hybrid energy system of Zhongshan Station to reduce the use of fossil fuels. Figure 7 shows the structural schematic diagram of the proposed hybrid energy system It contains an array of PV modules, wind turbines, diesel generator sets, battery units, heat storage banks, a converter (DC/AC), and thermal–electrical loads. As a coastal research station, Zhongshan Station has abundant wind energy, which means that the load power can be supplied directly by electricity produced by a wind turbine. Meanwhile, electricity produced from an array of PV modules, as well as the excess energy from the wind turbine, will be sent to the battery unit, i.e., used for charging, which plays an important role in balancing the non-uniformity between production and demand, thereby mitigating the intermittency of RE resources. Wind and solar power generation and charging or discharging of the battery unit will all transform electrical power to meet the thermal–electrical load demand for living and for scientific expeditions at Zhongshan Station by a DC/AC converter. During periods of low wind energy, electric power produced by wind energy is insufficient to meet the load demand; charging the control station will add solar energy to meet the required demand. Furthermore, if there is still an energy deficiency at peak load times, discharging of the battery unit will start, considering the minimum state of charge (SOC), until the energy needs are met. Similarly, cyclic charging and discharging of the battery unit, depending on the availability of RE sources, will take place; this system can guarantee a sustainable power supply for 24 h a day if the system’s capacity is sufficient. During the excess energy periods, when the battery unit is charged to 100%, the excess energy will be put to better use, either by being used to clean drinking water for members of the research station or to supply electricity for the water heater and other thermal loads.
Power generated by PV panels, wind turbines, battery units and diesel engine generators is linked to an electrical network composed of DC and AC bus to meet the power demand of each building in Zhongshan Station. The heating demand can be satisfied by the electric heaters, exhaust heat from DGs and auxiliary boilers as backup. Heat supply is an important challenge faced by various research stations in Antarctica. The buildings in the station area need to maintain a state of heating throughout the year. During the polar night, heating becomes the most important factor in maintaining the safety of the members of the research stations. Usually, each building in Zhongshan Station can be heated safely through electric heaters.
In this study, the heating energy produced by the DGs can be shared and exchanged between the buildings in Zhongshan Station by means of heating pipelines; the exhaust excess heat can be stored in the thermal storage tank to be transferred to other buildings. The DGs are placed in the power generation buildings as part of the conventional energy system of Zhongshan Station. The main control room of the electricity building can operate the DGs, and carry out power adjustments, network frequency operations, and voltage measurements.
3.2. Energy Management Strategy
The energy flow of the hybrid energy system of Zhongshan Station is shown in Figure 8. The main process of energy flow can be described as follows:
Case 1: During the actual operation of the hybrid energy system, the system first absorbs RE to generate electrical energy. An electric heater is the main heat source; its power consumption is included in the load demand of Zhongshan station (process 6 and process 7). If the RE can meet the load demand of the hybrid system, it is assumed that the heat energy demand will also be met immediately. The diesel generator and battery do not provide energy during this operation.
Case 2: If the RE cannot meet the load demand of the station (process 1 and process 2), it must be first determined whether the SOC of the battery unit can supplement to meet the remaining load demand and produce two possible scheduling methods. If the SOC still cannot meet the remaining load demand, a diesel generator is set to start operating (process 3). When the SOC and RE can meet the full load demand of Zhongshan Station (process 4), the diesel generator stops working. At this time, the electric heater serves as the main heat source.
Case 3: If the RE and battery unit combined cannot meet the load demand of Zhongshan Station, the diesel generator starts operating (process 3). The three DGs are matched according to the size of the remaining load (the total load excluding the RE and battery discharge), and the excess electric energy can charge the battery (process 5). Meanwhile, a large amount of waste heat is generated during this process, which can affect the energy scheduling at the next point in time. Waste heat is replenished into various buildings through pipelines and other facilities (process 9), and the operation status of the electric heater is changed at the next stage (process 10). Therefore, changes in the load demand of Zhongshan Station cause changes in the energy flow results (process 11).
For the heat supply, the thermal energy demand of Zhongshan Station is constant, considering the effects of the diesel generator starting up to generate power for the electric heater, which gives rise to a change in the electric energy demand of the station according to the change in electric heater power. In addition, the auxiliary boiler serves as a final guarantee for the thermal energy of Zhongshan Station.
Based on the above three cases, the energy management strategy is designed to conduct the hourly balancing of the generated energy to cope with the load demand and store the excess energy for later use, as shown in Figure 9. When power generated by the wind turbines and PVs is insufficient to cope with the load demand, batteries supply the deficit power. when the Wind turbine and PV system cannot cope with the load demand and the battery state of charge (SOC) is equal to or less than 60% of SOCmax, the diesel generator is eventually used to ensure the energy demand of the scientific research station area and store the excess power into batteries for later use. The time, t is considered from 1 to hour 8760.
4. Mathematical Formulation
4.1. Objective Function
In this study, the scheduling strategy was determined based on a trade-off between three conflicting aspects: technical reliability, economy, and the degree of environmental friendliness. Therefore, the objective function is the minimum weighted sum of the loss of power supply probability (LPSP), cost of energy (COE) and carbon dioxide emissions (ECO2) during the dispatch period of Zhongshan Station. The objective function of the scheduling strategy is formulated as follows:
where α, β and δ are the weighting factors and the sum of them should be equal to 1, meaning that the values of the three weighting factors can be flexible. In the objective function, the absolute values of COE and ECO2 are divided by the corresponding single criteria values so as to convert to the same magnitude as that of the LPSP [42].
where LPSi,t is the power loss of the RE combination within time t; Pload,i,t is the load power of the hybrid energy system; and Δt is the step size.
The cost of energy can be described as follows [42]:
where COEi is the cost of energy under the i-th schedule; CRFi(d,n) is the capital recovery factor of the i-th schedule; d is the annual discount rate (%); and n is the life of the hybrid energy system of Zhongshan Station.
where Cinv,i is the investment cost of the hybrid energy system of Zhongshan Station, mainly including installation costs, maintenance and replacement costs; Cop,i is the operating cost; Cfuel,i is the cost of fuel consumption; Cbat,i is the total cost of the energy storage battery; and Csalv,i is the salvage value of the hybrid energy system of Zhongshan Station.
The investment cost of the hybrid energy system of Zhongshan Station can be expressed as follows [43]:
where j is the time; UCPV,i,j is the unit cost of the photovoltaic array of the hybrid energy system of Zhongshan Station; CPV,i,j is the capacity of the photovoltaic array (kW); UCWT,i,j is the unit cost of wind turbines; CWT,i,j is the capacity of wind turbines (kW); UCDG,i,j is the unit cost of DGs; CDG,i,j is the capacity of the diesel generator (kW); UCEH,i,j is the unit cost of the electric heaters; CEH,i,j is the power of the electric heaters (kW); UCPipe,i,j is the unit cost of the heat pipe of the hybrid energy system of Zhongshan Station; Disi,j is the length of the heat pipe; UCBoil,i,j is the unit cost of the backup boiler; CBoil,i,j is the power of the backup boiler (kW); and , are the selection factors of the heat pipe and backup boiler, respectively.
The operating cost of the hybrid energy system of Zhongshan Station can be expressed as follows [44]:
where , , , , and are the fixed costs of each component of the hybrid energy system of Zhongshan Station, respectively; , , , , and are the unfixed costs of each component, respectively; TPV,i,j,k, TWT,i,j,k, TDG,i,j,k and Tbat,i,j,k are the operation time of each component; and , , and are the output power of each component.
where HDG,i,j,k is the waste heat of diesel generator (kW); ηDG-h is the conversion efficiency of waste heat; HBoil,i,j,k is the heat energy (kW) provided by the backup boiler; ηBoil-h is the efficiency of the backup boiler; and Pfuel is the price of fuel used in Antarctica ($/kWh).
where UCbat,i,j is the unit cost of the energy storage battery; is the capacity of the energy storage battery.
Equation (10) is the discount factor, where d is the annual discount rate (%); and N is the life span of the hybrid energy system of Zhongshan Station.
where CIF is the carbon emission per unit of electrical energy; ηDG-h is the waste heat conversion efficiency; HBoil,i,j,k is the heat energy provided by the standby boiler; and ηBoil-h is the efficiency of the backup boiler.
4.2. Design Constraints
Design constraints of the hybrid energy system of Zhongshan Station will be introduced in detail, as follows. The mathematical model for individual components of the hybrid system of Zhongshan Station is proposed in Appendix A and simulated wind and solar power can be used in this section, which is commonly used in the research of hybrid energy systems [45,46,47,48].
4.2.1. Power Demand and Supply Balance
The power demand and supply balance of the hybrid energy system can be expressed as follows:
The energy outputs of the hybrid energy system must be equal to the power demand of Zhongshan Station during every time period. For each node, the power demand and supply balance can be described as shown in Equation (12). The left side represents the electricity output of each power item, and the right side refers to the electricity input item. , and are the power outputs of each component of the hybrid energy system. Ebat,i,j,k is the power of the energy storage battery, which is related to the direction of the electric energy transmission; is the electricity output from the PV arrays; is the electricity output from the wind turbines; is the electricity output from the DGs; is the total load of Zhongshan Station; is the energy loss; is the electric heater power; is the load power without the electric heaters; and k is the number of components.
4.2.2. Thermal Demand and Supply Balance
For each node, a thermal power balance is introduced into the heat energy of the neighboring buildings by heat pipes. The left side of Equation (14) is the heat output, and the right side is the heat load and heat loss for every time period. Heat energy generated by DGs can reduce the operation time of the electric heaters.
where represents the heat energy output by the electric heaters; represents the effectively transmitted waste heat energy; represents the heat energy transmitted by the backup boiler; and HLoad,i,j,k and Hloss,i,j,k are the heat energy required by the Zhongshan Station and the heat energy loss, respectively.
4.2.3. Electrical Network Constraints
The electrical energy output from the hybrid energy system composed of photovoltaic arrays and wind turbines can be represented by ERe,i,j,k. If the output power of the hybrid energy system is equal to the load demand of Zhongshan Station, the power supply can be provided by RE. This process can be described by the following formula:
(1) Case 1:
If ERe,i,j,k is positive, it indicates that the output power of the hybrid energy system can meet the load demand of Zhongshan Station. In this scenario, the entire power demand of the station will be provided by RE, and the battery will be charged with excess energy.
(2) Case 2:
If ERe,i,j,k is negative, it indicates that the output power of the hybrid energy system cannot satisfy the current load demand of Zhongshan Station. At this time, the battery will contribute energy in order to meet the remaining load demand.
For Case 1, if the current capacity of the battery is not 100%, the energy ERe,i,j,k is used to charge the battery; if the battery is fully charged, the excess energy will be transferred to the unloading process. The battery capacity state can be described as follows:
ΔC represents the current state of the battery, which is the difference between the current capacity and the maximum capacity; DOD is the depth of discharge.
If ERe,i,j,k is positive, the state of the energy storage battery can be described as follows.
When ΔC is greater than 0, the current capacity of the battery is not fully charged. In this scenario, if ERe,i,j,k is less than ΔC, the charging capacity is ERe,i,j,k and is the charging efficiency; If ERe,i,j,k is greater than ΔC, the final capacity of the battery pack is , and the battery is finally fully charged. If ΔC = 0, the battery capacity keeps the maximum capacity .
If ERe,i,j,k is negative, the state of the energy storage battery can be described as follows:
If the battery pack’s discharging capacity Ebat,i,j,k is greater than ERe,i,j,k, the battery can provide power to the load together with RE. is the battery pack discharge efficiency. If Ebat,i,j,k is less than ERe,i,j,k, this means that the battery cannot provide power to the load together with RE. In this scenario, the DGs will start to power the load of Zhongshan Station.
4.2.4. Heating Network Constraints
The heating network constraints in this study can be described as follows: Equations (24) and (25) are expressions for thermal storage efficiency and thermal output power, respectively; Equations (26) and (27) are descriptions of the terms in the expressions; Equations (28)–(31) constrain the thermal output power to not exceed the total heat storage capacity and constrain the upper and lower states of the heat storage tank and the backup heat storage capacity, respectively; and Equations (32) and (33) are expressions for the selection of heat flow lines between buildings that include the backup heat capacity.
where ηDG-HST is the efficiency of the conversion of waste heat to the heat storage tank; THST,i,j,k is the operation time of the heat storage tank; HHST,i,j,k is the output power of the heat storage tank (kW); ηHST-h is the efficiency of heat storage tank; and is the heat loss of the heat storage tank.
where TEH,i,j,k is the operation time of the electric heater; CEH,i,j is the rated output thermal power of the electric heater (kW); HLoad,i,j,k is the heat demand of Zhongshan Station; and is the total heat loss of Zhongshan Station.
where is the heat loss of the standby boiler.
where and are the input and output heat of a heat storage tank in a building.
where CHST,i,j are the capacity of the heat storage tank.
where and are the upper and lower limits of the heat storage tank capacity, respectively.
where CBoil,i,j is the backup boiler capacity.
where and are boiler the upper and lower limits of capacity, respectively.
where is the selection factor for the heat pipe from building a to building b; and is the selection factor for the heat pipe from building b to building a.
where is the selection factor for the heat energy of the backup boiler from building a to building b; and is the selection factor for the heat energy of the backup boiler from building b to building a.
4.3. Numerical Study
As mentioned above, there are 17 main buildings in Zhongshan Station. Although Zhongshan Station has undergone several alterations and expansions since its establishment, the main buildings in the station area in this study can guarantee the implementation of scientific research activities. The buildings in Zhongshan Station can share the thermal energy through heat pipelines.
4.3.1. The Energy Demand Characteristics of Zhongshan Station
The monthly average load can be calculated from historical data of Zhongshan Station. The annual average power load of each building in Zhongshan Station can be deduced based on function of the building and is shown in Table 3. Due to the long-term low-temperature climatic conditions in Antarctica, there are several demands for thermal energy in different seasons. Winter and autumn need more energy demand compared to spring and summer. In order to overwinter, ZS-1 has a larger energy demand because it is the largest building. ZS-3 can only maintain low power consumption in winter, thus the seasonal changes in energy demand are obvious. Observation buildings ZS-6 and ZS-7 have higher energy consumption because they must be maintained in winter. The garage ZS-10 will maintain year-round operations in Zhongshan Station. Oil storage tanks ZS-16 do not need power supply in this study.
The monthly power load of Zhongshan Station is based on the previous data. In this study, a predictive model was introduced to simulate load power with a smaller time scale and considered the influence of temperature. Hourly average load power of each building in Zhongshan Station is shown in Figure 10.
4.3.2. The Heat Demand Characteristics of Zhongshan Station
Monthly averages for the heat demand of each building in Zhongshan Station are shown in Table 4. In this study, it is assumed that the warehouses only require thermal energy and that the antenna arrays and the oil tanks do not need thermal energy. The DGs are located in the power generation building of Zhongshan Station. Except for the observation building of the polar upper atmosphere, the other buildings can share heat energy with each other via heating pipes. The distances between the buildings are shown in Table 5a,b.
4.3.3. Technical Assumptions Regarding Zhongshan Station
The technical assumptions made in this study regarding Zhongshan Station considered in this study, including the diesel generator, boiler, pipeline, PV, wind turbine, electric heater, and battery, are presented in Table 6 and Table 7. All the technical assumptions of all components of Zhongshan Station are assumed to be constant to maintain consistency in the scheduling process. In this study, the importance of technical reliability holds priority over the economy and degree of environmental friendliness. The importance of the economy and degree of environmental friendliness are considered to be equal. Therefore, the weighting factors α, β, and δ are assumed to be 0.4, 0.3, and 0.3, respectively.
- (1)
- The losses in thermal storage occupy 10% of the stored energy, and the average heat losses during the heating distribution are 5% of the total distributed heat;
- (2)
- The maximum installation area of the solar thermal collector is 1000 m2 in each building and is limited by the roof area, while the maximum capacities of the boiler and heat storage facility are set as 2000 kW and 2500 kWh, respectively;
- (3)
- The power grid and gas networks already exist among the building clusters;
- (4)
- The carbon intensities of natural gas and grid electricity are assumed to be 0.22 kg-CO2/kWh and 0.88 kg-CO2/kWh, respectively;
- (5)
- The interest rate is assumed to be 6%; and based on this, the CRF of the equipment can be calculated according to Equation (3);
- (6)
- The base simulation emphasizes the importance of the economic and environmental aspects equally; thus, both of the corresponding weighting coefficients a and b (referring to the objective function introduced in Section 3) are assumed to be 0.5.
Meanwhile, in reality, the efficiency of energy generation always depends on the capacity, ambient temperature, and partial load factor. This assumption is widely adopted in the literature, and the error that is caused by it is acceptable for this type of high-level optimization model [18].
4.4. Results and Discussion
4.4.1. Scheduling Results
The historical meteorological data of Zhongshan Station in Antarctica were used as inputs in the RE calculation, and the wind power generation was modified by combining it with the ice growth and ablation model of wind turbine blades under extreme weather conditions. The model scheduling results are compared with the historical results. Table 8 shows the main calculation results of the hybrid energy power supply system of Zhongshan Station after adopting multi-objective optimal scheduling. Table 8 shows the minimum results of the power loss rate LPSP, energy cost COE, and carbon dioxide emission ECO2 after optimized dispatching. The COE of Zhongshan Station’s hybrid energy power supply system is less than the COE of the 100% RE power supply system established in Antarctica compared with other countries. During the operation period, cumulative carbon dioxide emissions are 277.73 ton, which are generated from the operation of the DGs. During the simulation dispatching period (one year) of Zhongshan Station, the diesel generator runs 4578 h in total, accounting for 52.3% of the total dispatching time.
In this study, the load demand results of Zhongshan Station, after adopting multi-objective optimal scheduling, are shown in Figure 11. In Figure 11a,b, the difference between the original load and the load demand after optimizing the scheduling requirements and ensuring that the change trend is consistent is shown. It can be seen that the scheduling optimized load is lower than the original demand, and is in line with the scheduling model for basic expectations. After the introduction of waste heat usage, the DGs reduce the power demand of the electric heater, as shown in Figure 11c. When the load demand is high, the added electric energy (Figure 11c) is also at a high value. Figure 12 shows the monthly average load demand results of Zhongshan Station after multi-objective optimal scheduling. In the simulation run of the whole year, the actual load demand of the hybrid system of Zhongshan Station is lower than the original load of that month after scheduling; the change of the load after scheduling is consistent with the original load demand. Table 9 shows the monthly average historical data of Zhongshan Station and the results of the optimized scheduling. After optimization, the annual fuel consumption is reduced from 241.33 ton to 104.9 ton, and the monthly average fuel consumption is reduced from 22.11 ton to 8.7 ton. The annual load demand after optimal scheduling is reduced from 870,193.38 kW to 824,248.80 kW, which is about 45,944.60 kW, accounting for 66.8% of the monthly average load demand after scheduling. The monthly average load demand decreased from 72,516.11 kW to 68,697.40 kW, a decrease of about 3828.72 kW.
Figure 13 shows the thermal energy supply results of China’s Antarctic Zhongshan Station after optimized dispatching. As can be seen from Figure 13, except for the observation building ZS-6, which is far away from the main station area and uses an electric heater for heating, other buildings adopt the complementary heating mode of the electric heater and waste heat. The thermal energy generated by the diesel generator can be utilized effectively. Combined with electric heating, the heating demand of all buildings in the station area can be covered all year round. Figure 14 shows the calculation results of the annual heat sources for each building. As can be seen from Figure 14, electric heater heating occupies a large proportion of the annual heat demand. In the actual operation of Zhongshan Station, electric heaters can provide relatively stable heat energy, so the dispatch result is reasonable. The waste heat utilization ratio of ZS-4 and ZS-5 power generation blocks exceeds that of the electric heaters, which account for 48.4% and 51.6%, respectively. In addition, buildings with high waste heat utilization rates, such as ZS-1 and ZS-2, are close to the power generation building, which has a great advantage in in terms of waste heat utilization, indicating that optimal scheduling can provide reasonable resource allocation.
4.4.2. Typical Scenario Analysis
In order to further analyze the comparison results of dispatching models, the operation results of Zhongshan Station’s hybrid energy power supply system in three typical scenarios are selected for comparative study. The three representative scenarios are as follows: (1) Scenario 1 is the daily operation results of the hybrid system of Zhongshan Station when both wind and solar are energy outputs; (2) Scenario 2 is the daily operation results of the hybrid system when solar power output and wind power outputs are not used; (3) Scenario 3 is the daily operation results of the hybrid system with no RE output. Figure 15 shows scenario 1 of Zhongshan Station’s hybrid energy power supply system. As can be seen from Figure 15a, this day was in a period of extreme daylight, thus solar energy generation remained at a high level during the day while wind power showed a trend of fluctuations. From 0:00 to 6:00 on that day, the wind generator had no output, and diesel generation (DG) was used to supplement the energy. From 18:00 to 23:00 on that day, the wind generator had no output, and diesel power generation was used to supplement the energy. For the rest of the day, renewable sources provided the majority of the electricity. As can be seen from Figure 15b, the introduction of waste heat utilization of DGs effectively reduces the load demand, and the load reduction occurs when the DGs are running. The battery discharges at 3:00, 6:00, 21:00, and 22:00, remaining at maximum capacity. For scenario 1, the scheduling results meet the expected setting, and the comprehensive and effective utilization of hybrid energy can be realized.
Figure 16 shows scenario 2 of Zhongshan Station’s hybrid energy power supply system. As can be seen from Figure 16a, this day was in extreme daylight, but the wind speed could not meet the rated parameters of the wind generator. Therefore, solar power generation was the same as that in scenario 1, remaining at a high level during the day. However wind power generation had no outputs all day. The diesel generator’s outputs totaled 14 h, including continuous work to provide power between 2:00 to 11:00; Compared with scenario 1, it can be concluded that, after the loss of wind power generation, diesel power generation must bear more load demands, and the running time exceeds the output of the diesel generator in scenario 1 by 7 h. As can be seen from Figure 16b, in scenario 2, when the diesel generator continues to output, the load requirement is significantly reduced. The battery was discharged for 7 h (2:00, 13:00, 15:00, 18:00, 21:00, 22:00, and 23:00), which exceeded the simulation run of scenario 1, indicating that the diesel generator was also responsible for some of the power supply pressure after the RE output was reduced.
Figure 17 shows scenario 3 of Zhongshan Station’s hybrid energy power supply system. As can be seen from Figure 17a, this day belongs to the polar night period, thus the intra-day solar energy generation was 0. When the wind speed is low, the wind power is basically 0 all day, and there was no output of RE on that day. Only DGs and batteries can guarantee the load demand of Zhongshan Station. The diesel generator runs all day long and outputs full loads at 4:00, 9:00, 14:00, and 18:00. As can be seen from Figure 17b, the load demand is the same as the original load at only 6 times throughout the day. Compared with scenario 1 and scenario 2, the continuous operation of the DGs further reduces the load demand. As the diesel generator runs all day long, the battery only discharges at 0:00, 4:00 and 22:00, and maintains maximum capacity at other times, indicating that although the battery and the diesel generator are used as electric energy output together, the discharge frequency of the battery will decrease with the increase in the output power of the diesel generator.
In conclusion, three typical scenarios are put forward in this chapter that can be used with the multi-objective scheduling method to obtain the optimizing results in accordance with the actual running situation in October. The scenarios suggest that Antarctic scheduling is a great challenge. In this extreme environment, the annual and monthly distribution of RE is different than conventional environments, and during polar days and nights, the diesel generator and battery tend to shoulder some of the pressure. However, the increase in the running time of the diesel generator reduces the preset load demand of Zhongshan Station, and the scheduled load is basically lower than the original value of the same period. The battery discharge time also decreases with the increase in the output of the diesel generator.
There are some difficulties and risks involved in on-site verification when considering the operational safety of the Antarctic research station. The content, ideas, and results of the analysis methods studied in the current paper can be regarded as common research methods. For example, in the literature, refs. [39,40] analyzed different case scenarios after obtaining simulation results. On-site verification work will also be a focus in our future research, whether from the perspective of the safe and reliable operation of the new energy system on the site of the Antarctic research station or the installed capacity, on which more detailed work will be carried out.
5. Conclusions and the Future Work
In this study, a new hybrid energy system for the Chinese Zhongshan Station was proposed and its superiority was analyzed. The structure of the system was also designed, mainly including a PV panel, wind turbine, battery unit, power electronics transform circuit, diesel, heat load, power load and AC/DC bus. The scheduling strategy was designed based on technical reliability, economy, and degree of environmental friendliness; the objective function was established with LPSP, COE and ECO2 as indicators. According to the characteristic electricity and heat demand of each building in the station, combined with the energy supply scheme and technical hypothesis, the multi-objective scheduling strategy for the hybrid energy system was proposed. The results of the scheduling strategy for the hybrid energy system demonstrate that the system load after dispatching was reduced from 870,193.38 kW to 824,248.80 kW, which is about 45,944.60 kW, accounting for 66.8% of the average monthly load demand after scheduling. Annual fuel consumption was reduced from 241.33 ton to 104.9 ton, and the average monthly fuel consumption was reduced from 22.11 ton to 8.7 ton. The average monthly load demand decreased from 72,516.11 kW to 68,697.40 kW, a decrease of about 3828.72 kW. In addition, through the analysis of three different application scenarios, it was verified that the load after dispatching was lower overall than the original period value, and that the battery discharge time also decreased with the increases in the diesel generator’s output.
The hybrid energy system described in this paper has been put into trial use at Zhongshan Station in Antarctica and has successfully generated the first green electricity. The system can provide a reliable power supply for the “space physical observation station”, including a diesel engine, photoelectric, energy storage battery, unloader, and a control cabinet. It also provides electric energy for meteorological sensing units, such as wind speed, wind direction, temperature, and humidity, installed in the observatory body to obtain meteorological data of the local installation location and transmit the data back to China through the Iridium satellite. The power generation unit is highly consistent with the research described in this paper, and the energy scheduling was carried out according to the actual meteorological data of the installation location. The results show that the space physics observation station can obtain a reliable and stable source of electric energy. In future work, a more in-depth sensitivity analysis is one of the most important research priorities. In the 41st Chinese Antarctic expedition to be carried out in 2024, the reconstruction of China’s Antarctic Zhongshan Station is expected to realize the verification of the station area.
Author Contributions
Conceptualization, G.Z. and J.W.; methodology, Y.D.; software, G.Z. and J.W.; validation, Y.D.; formal analysis, G.Z.; investigation, B.Y.; writing—original draft preparation, G.Z.; visualization, L.K.; project administration, L.K.; funding acquisition, G.Z. All authors have read and agreed to the published version of the manuscript.
Funding
This research was funded by the National Key Research and Development Program of China, grant number 2021YFC2803300, 2021YFC2803304, the National Natural Science Foundation of China, grant number 42306260, U23A20649, the China Postdoctoral Science Foundation, grant number 2023M733042, the Applied Basic Research Project of Shanxi Province, grant number 20210302124318, the Scientific and Technological Innovation Programs of Higher Education Institutions in Shanxi, grant number 2021L025, and the Shanxi Provincial Key Research and Development Project, grant number 202102060301020.
Institutional Review Board Statement
Not applicable.
Informed Consent Statement
Not applicable.
Data Availability Statement
The data that support the findings of this study are available from the corresponding authors upon reasonable request.
Acknowledgments
The authors thank the Polar Research Institute of China for supporting the field data collection.
Conflicts of Interest
The authors declare no conflicts of interest.
Appendix A
In this study, wind turbine power can be described as follows:
where PWT,i,t is the output of wind power (kW); PWT,R is the rated electrical power (10 kW); vin is the cut-in wind speed (3 m/s); vrat is the rated wind speed (10 m/s); voff is the cut-off wind speed (40 m/s); v′t is the wind speed.
PV output power can be obtained from the following equation:
where PPV,i,t is the output of solar power (kW); PPV,R is the rated power under standard test conditions (256 W); ηPV,loss is the dimensionless overall loss coefficient (0.8); Gref refers to the standard intensity of incident radiation, which is 1000 W/m2; Gt is the intensity of solar radiation, is the total solar radiation on the tilted PV array hourly (W/m2), and A is the surface area of the PV array(m2) [49].
References
- Fretwell, P.; Pritchard, H.D.; Vaughan, D.G.; Bamber, J.L.; Barrand, N.E.; Bell, R.; Bianchi, C.; Bingham, R.G.; Blankenship, D.D.; Casassa, G.; et al. Bedmap2: Improved ice bed, surface and thickness datasets for Antarctica. Cryosphere 2013, 7, 375–393. [Google Scholar] [CrossRef]
- Otosaka, I.; Horwath, M.; Mottram, R.; Nowicki, S. Mass Balances of the Antarctic and Greenland Ice Sheets Monitored from Space. Surv. Geophys. 2023, 44, 1615–1652. [Google Scholar] [CrossRef]
- Prošek, P.; Barták, M.; Láska, K.; Suchánek, A.; Hájek, J.; Kapler, P. Facilities of J. G. Mendel Antarctic station: Technical and technological solutions with a special respect to energy sources. Czech Polar Rep. 2013, 3, 38–57. [Google Scholar] [CrossRef]
- Dou, Y.; Zuo, G.; Chang, X.; Chen, Y. A Study of a Standalone Renewable Energy System of the Chinese Zhongshan Station in Antarctica. Appl. Sci. 2019, 9, 1968. [Google Scholar] [CrossRef]
- Zuo, G.; Dou, Y.; Chang, X.; Chen, Y. Design and Application of a Standalone Hybrid Wind–Solar System for Automatic Observation Systems Used in the Polar Region. Appl. Sci. 2018, 8, 2376. [Google Scholar] [CrossRef]
- Schavan, A. Germany’s energy research plan. Science 2010, 330, 295. [Google Scholar] [CrossRef]
- Brown, C.I. Renewable Energy Systems for the Australian Antarctic Stations. Ph.D. Thesis, University of Tasmania, Hobart Tasmania, Australia, 1998. [Google Scholar]
- Pattyn, F. Construction and Operation of the New Belgian Research Station. Dronning Maud Land, Antarctica; Final Comprehensive Environmental Evaluation (CEE); Belgian Federal Public Planning Service Science Policy: Brussels, Belgium, 2007.
- Teetz, H.W.; Harms, T.M.; Backström, T.W. Assessment of the wind power potential at SANAE IV base, Antarctica: A technical and economic feasibility study. Renew. Energy 2003, 28, 2037–2061. [Google Scholar] [CrossRef]
- Olivier, J.R.; Harms, T.M.; Esterhuyse, D.J. Technical and economic evaluation of the utilization of solar energy at South Africa’s SANAE IV base in Antarctica. Renew. Energy 2008, 33, 1073–1084. [Google Scholar] [CrossRef]
- Wolf, P. Solar energy utilization in overall energy budget of the Johann Gregor Mendel Antarctic station during austral summer season. Czech Polar Rep. 2015, 5, 1–11. [Google Scholar] [CrossRef]
- Obara, S.; Morizaneet, Y.; Morel, J. A study of small-scale energy networks of the Japanese Syowa Base in Antarctica by distributed engine generators. Appl. Energy 2013, 111, 113–128. [Google Scholar] [CrossRef]
- Obara, S.; Kanai, T.; Ishizawa, K.; Morel, J. Investigation of fuel reduction effect of the Antarctic Syowa Base microgrid by introduction of local-supply-and-local-consumption energy. J. Therm. Sci. Tech 2014, 9, JTST0013. [Google Scholar] [CrossRef]
- Obara, S.; Hamanaka, R.; El-Sayed, A.G. Design methods for microgrids to address seasonal energy availability-A case study of proposed Showa Antarctic Station retrofits. Appl. Energy 2019, 236, 711–727. [Google Scholar] [CrossRef]
- Tin, T.; Sovacool, B.K.; Blake, D.; Magill, P.; El Naggar, S.; Lidstrom, S.; Ishizawa, K.; Berte, J. Energy efficiency and renewable energy under extreme conditions: Case studies from Antarctica. Renew. Energy 2010, 35, 1715–1723. [Google Scholar] [CrossRef]
- Boccaletti, C.; Di Felice, P.; Santini, E. Integration of renewable power systems in an Antarctic Research Station. Renew. Energy 2014, 62, 582–591. [Google Scholar] [CrossRef]
- Cabezas, M.D.; Wolfram, E.A.; Franco, J.I.; Fasoli, H.J. Hydrogen vector for using PV energy obtained at Esperanza Base, Antarctica. Int. J. Hydrogen. Energy 2017, 42, 23455–23463. [Google Scholar] [CrossRef]
- Christo, T.M.; Perron, S.; Fardin, J.F.; Simonetti, D.S.; Alvarez, C.E. Demand-side energy management by cooperative combination of plans: A multi-objective method applicable to isolated communities. Appl. Energy 2019, 240, 453–472. [Google Scholar] [CrossRef]
- de Christo, M.T.; Fardin, J.F. Design and analysis of hybrid energy systems: The Brazilian Antarctic Station case. Renew. Energy 2016, 88, 236–246. [Google Scholar] [CrossRef]
- Melikoglu, M. Current status and future of ocean energy sources: A global review. Ocean. Eng. 2018, 148, 563–573. [Google Scholar] [CrossRef]
- Zhang, G.; Khan, I.A.; Daraz, A.; Basit, A.; Khan, M.I. Load Frequency Control of Marine Microgrid System Integrated with Renewable Energy Sources. J. Mar. Sci. Eng. 2023, 11, 844. [Google Scholar] [CrossRef]
- Cao, H.; Zeng, X.H.; Wu, X.P.; Zhang, Z.T. A hybrid wind and rainwater energy harvesting system for applications in sea-crossing bridges. Ocean. Eng. 2021, 234, 109267. [Google Scholar] [CrossRef]
- Li, X.D.; Peng, Y.; Wang, W.Y.; Huang, J.; Liu, H.K.; Song, X.Q. A method for optimizing installation capacity and operation strategy of a hybrid renewable energy system with offshore wind energy for a green container terminal. Ocean. Eng. 2019, 186, 106125. [Google Scholar] [CrossRef]
- Rinaldi, G.; Thies, P.R.; Walker, R.; Johanning, L. A decision support model to optimise the operation and maintenance strategies of an offshore renewable energy farm. Ocean. Eng. 2017, 145, 250–262. [Google Scholar] [CrossRef]
- Tang, R.L.; Li, X.; Lai, J.G. A novel optimal energy-management strategy for a maritime hybrid energy system based on large-scale global optimization. Appl. Energy 2018, 228, 254–264. [Google Scholar] [CrossRef]
- Zhang, W.P.; Maleki, A.; Rosen, M.A.; Liu, J.Q. Optimization with a simulated annealing algorithm of a hybrid system for renewable energy including battery and hydrogen storage. Energy 2018, 163, 191–207. [Google Scholar] [CrossRef]
- Gonzalez, A.; Riba, J.R.; Rius, A.; Puig, R. Optimal sizing of a hybrid grid-connected photovoltaic and wind power system. Appl. Energy 2015, 154, 752–762. [Google Scholar] [CrossRef]
- Lan, H.; Wen, S.L.; Hong, Y.Y.; Yu, D.C.; Zhang, L.J. Optimal sizing of hybrid PV/diesel/battery in ship power system. Appl. Energy 2015, 158, 26–34. [Google Scholar] [CrossRef]
- Bahramara, S.; Moghaddam, M.P.; Haghifam, M.R. Optimal planning of hybrid renewable energy systems using HOMER: A review. Renew. Sustain. Energy Rev. 2016, 62, 609–620. [Google Scholar] [CrossRef]
- Xu, J.P.; Zhou, X.Y. Approximation based fuzzy multi-objective models with expected objectives and chance constraints: Application to earth-rock work allocation. Inf. Sci. 2013, 238, 75–95. [Google Scholar] [CrossRef]
- Bemal-Agustfn, J.L.; Dufb-Lopez, R. Multi-objective design and control of hybrid systems minimizing costs and unmet load. Electr. Power Syst. Res. 2009, 79, 170–180. [Google Scholar]
- Ogunjuyigbe, A.S.; Ayodele, T.R.; Akinola, O.A. Optimal allocation and sizing of PV/Wind/Split-diesel/Battery hybrid energy system for minimizing life cycle cost, carbon emission and dump energy of remote residential building. Appl. Energy 2016, 171, 153–171. [Google Scholar]
- Shin, J.; Lee, J.H.; Realff, M.J. Operational planning and optimal sizing of microgrid considering multi-scale wind uncertainty. Appl. Energy 2017, 195, 616–633. [Google Scholar] [CrossRef]
- Zubo, R.H.; Mokryani, G.; Abd-Alhameed, R. Optimal operation of distribution networks with high penetration of wind and solar power within a joint active and reactive distribution market environment. Appl. Energy 2018, 220, 713–722. [Google Scholar] [CrossRef]
- Wu, Q.; Ren, H.B.; Gao, W.J.; Ren, J.X. Multi-objective optimization of a distributed energy network integrated with heating interchange. Energy 2016, 109, 353–364. [Google Scholar] [CrossRef]
- Ishraque, M.F.; Shezan, S.A.; Ali, M.M.; Rashid, M.M. Optimization of load dispatch strategies for an islanded microgrid connected with renewable energy sources. Appl. Energy 2021, 292, 116879. [Google Scholar] [CrossRef]
- Zakariazadeh, A.; Jadid, S.; Siano, P. Smart microgrid energy and reserve scheduling with demand response using stochastic optimization. Int. J. Electr. Power Energy Syst. 2014, 63, 523–533. [Google Scholar] [CrossRef]
- Paul, S.; Nath, A.P.; Rather, Z.H. A Multi-Objective Planning Framework for Coordinated Generation From Offshore Wind Farm and Battery Energy Storage System. IEEE Trans. Sustain. Energy 2020, 11, 2087–2097. [Google Scholar] [CrossRef]
- Tao, S.; Zhang, C.; Feijóo-Lorenzo, A.E.; Kim, V. Optimal design and operation of a wind farm/battery energy storage considering demand side management. IET Renew. Power Gener. 2024, 1, 1–11. [Google Scholar] [CrossRef]
- Tian, T.; Ma, Z.; Cui, Q.; Shu, J.; Tan, L.; Wang, H. Multi-objective Optimization of a Hydrogen-Battery Hybrid Storage System for Offshore Wind Farm Using MOPSO. J. Electr. Eng. Technol. 2023, 18, 4091–4103. [Google Scholar] [CrossRef]
- Deveci, K.; Güler, Ö. A CMOPSO based-multi-objective optimization of renewable energy planning: Case of Turkey. Renew. Energy 2020, 155, 578–590. [Google Scholar] [CrossRef]
- Bhayo, B.A.; Al-Kayiem, H.H.; Gilani, S.I.; Khan, N.; Kumar, D. Energy management strategy of hybrid solar-hydro system with various probabilities of power supply loss. Solar Energy 2022, 233, 230–245. [Google Scholar] [CrossRef]
- Liu, X.Z.; Wu, J.Z.; Jenkins, N.; Bagdanavicius, A. Combined analysis of electricity and heat networks. Appl. Energy 2016, 162, 1238–1250. [Google Scholar] [CrossRef]
- Omu, A.; Choudhary, R.; Boies, A. Distributed energy resource system optimisation using mixed integer linear programming. Energy Policy 2013, 61, 249–266. [Google Scholar] [CrossRef]
- Ma, T.; Yang, H.X.; Lu, L. Performance evaluation of a stand-alone photovoltaic system on an isolated island in Hong Kong. Appl. Energy 2013, 112, 663–672. [Google Scholar] [CrossRef]
- Ma, T.; Yang, H.X.; Lu, L.; Peng, J.Q. Technical feasibility study on a standalone hybrid solar-wind system with pumped hydro storage for a remote island in Hong Kong. Renew. Energy 2014, 69, 7–15. [Google Scholar] [CrossRef]
- Wu, Q.; Ren, H.B.; Gao, W.J.; Ren, J.X. Benefit allocation for distributed energy network participants applying game theory based solutions. Energy 2017, 119, 384–391. [Google Scholar] [CrossRef]
- Wang, J.; Dou, Y.K.; Zuo, G.Y.; Lan, M.S.; Chang, X.M.; Yang, B.; Du, Z.H.; Yu, M.Y.; Mao, Q.Y. Application and effect analysis of renewable energy in a small standalone automatic observation system deployed in the polar regions. AIP Adv. 2022, 12, 125218. [Google Scholar]
- Veenus Kansal, J.S. Dhillon. Ameliorated artificial hummingbird algorithm for coordinated wind-solar-thermal generation scheduling problem in multiobjective framework. Appl. Energy 2022, 326, 120031. [Google Scholar] [CrossRef]
Figure 1.
Air temperature of Zhongshan Station from December 2014 to November 2015.

Figure 2.
(a) Wind speed; and (b) air pressure at Zhongshan Station.

Figure 3.
Relative humidity of Zhongshan Station from December 2014 to November 2015.

Figure 4.
Solar radiation at Zhongshan Station from December 2014 to November 2015.

Figure 5.
Liquid water content of Zhongshan Station from December 2014 to November 2015.

Figure 6.
The arrangement of the buildings and configuration of the conventional electric power and heating networks of Zhongshan Station.
Figure 6.
The arrangement of the buildings and configuration of the conventional electric power and heating networks of Zhongshan Station.

Figure 7.
Schematic of the wind–solar–DG–battery hybrid system of Zhongshan Station.

Figure 8.
Energy flow of wind–solar–diesel generator–battery hybrid system in Zhongshan Station.

Figure 9.
Energy management strategy flow chart.
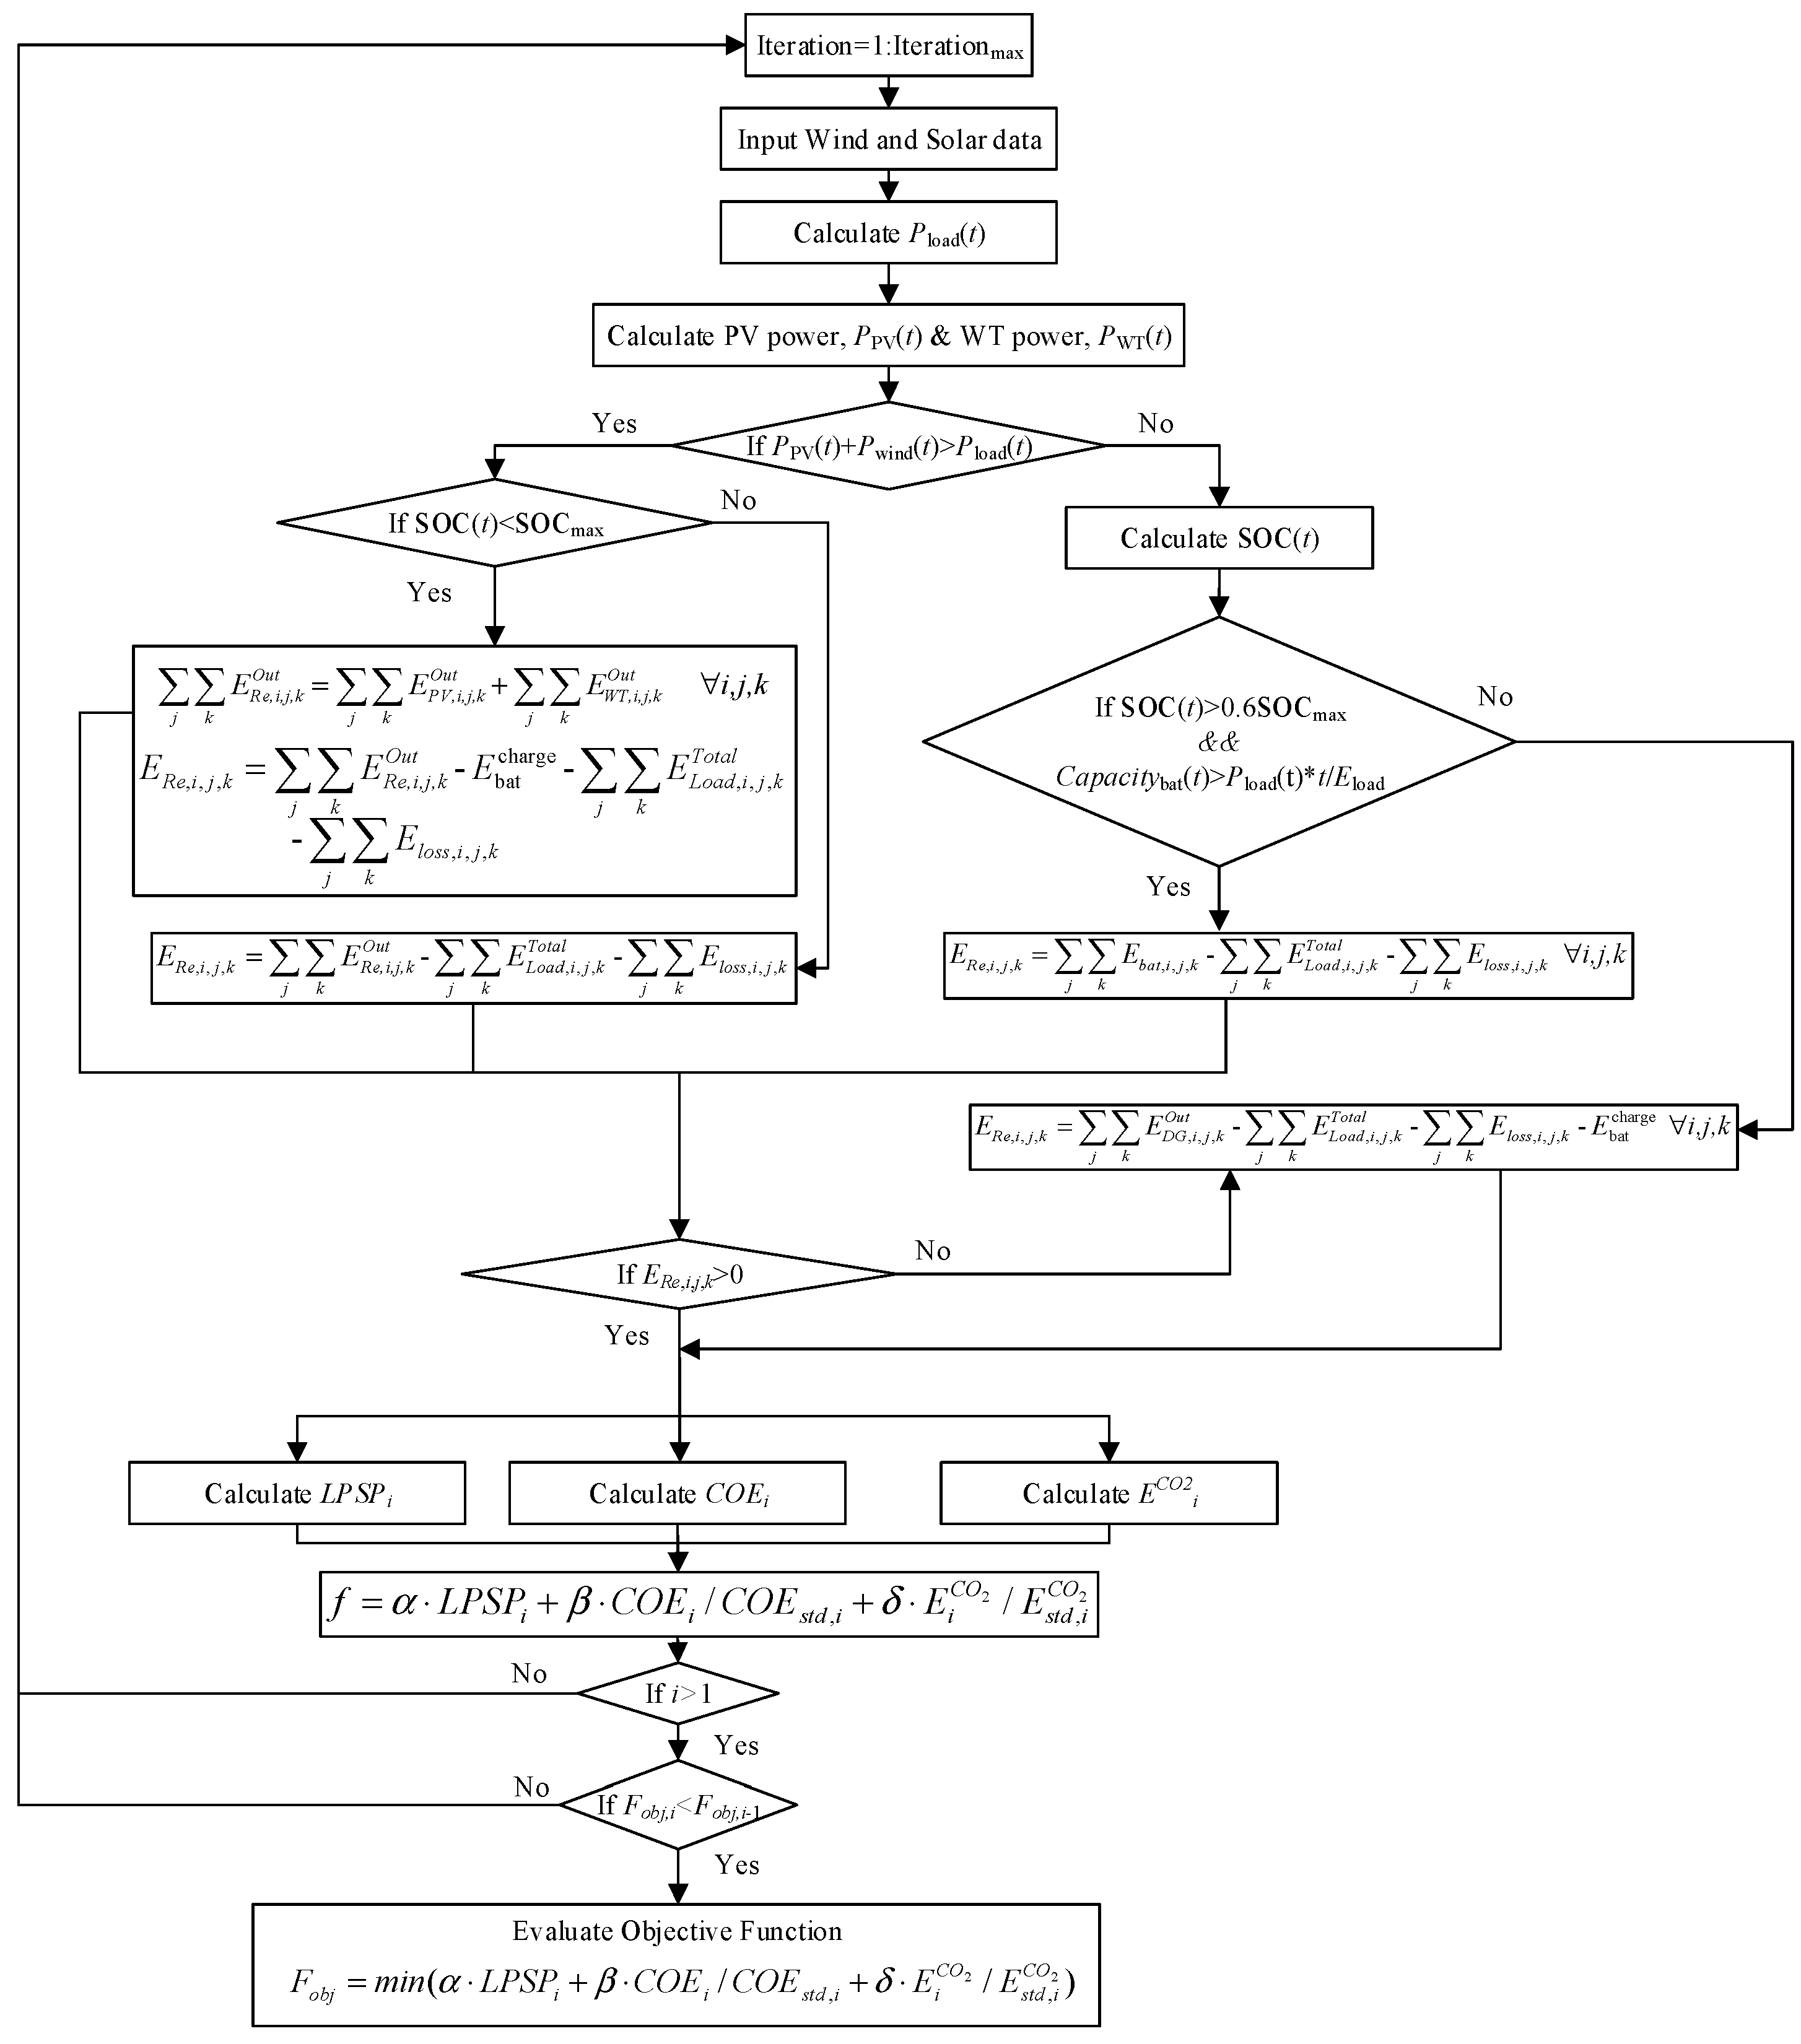
Figure 10.
Hourly average load power of Chinese Zhongshan Station.

Figure 11.
(a) Initial load; (b) load after multi-objective optimization dispatching; and (c) load power difference.
Figure 11.
(a) Initial load; (b) load after multi-objective optimization dispatching; and (c) load power difference.
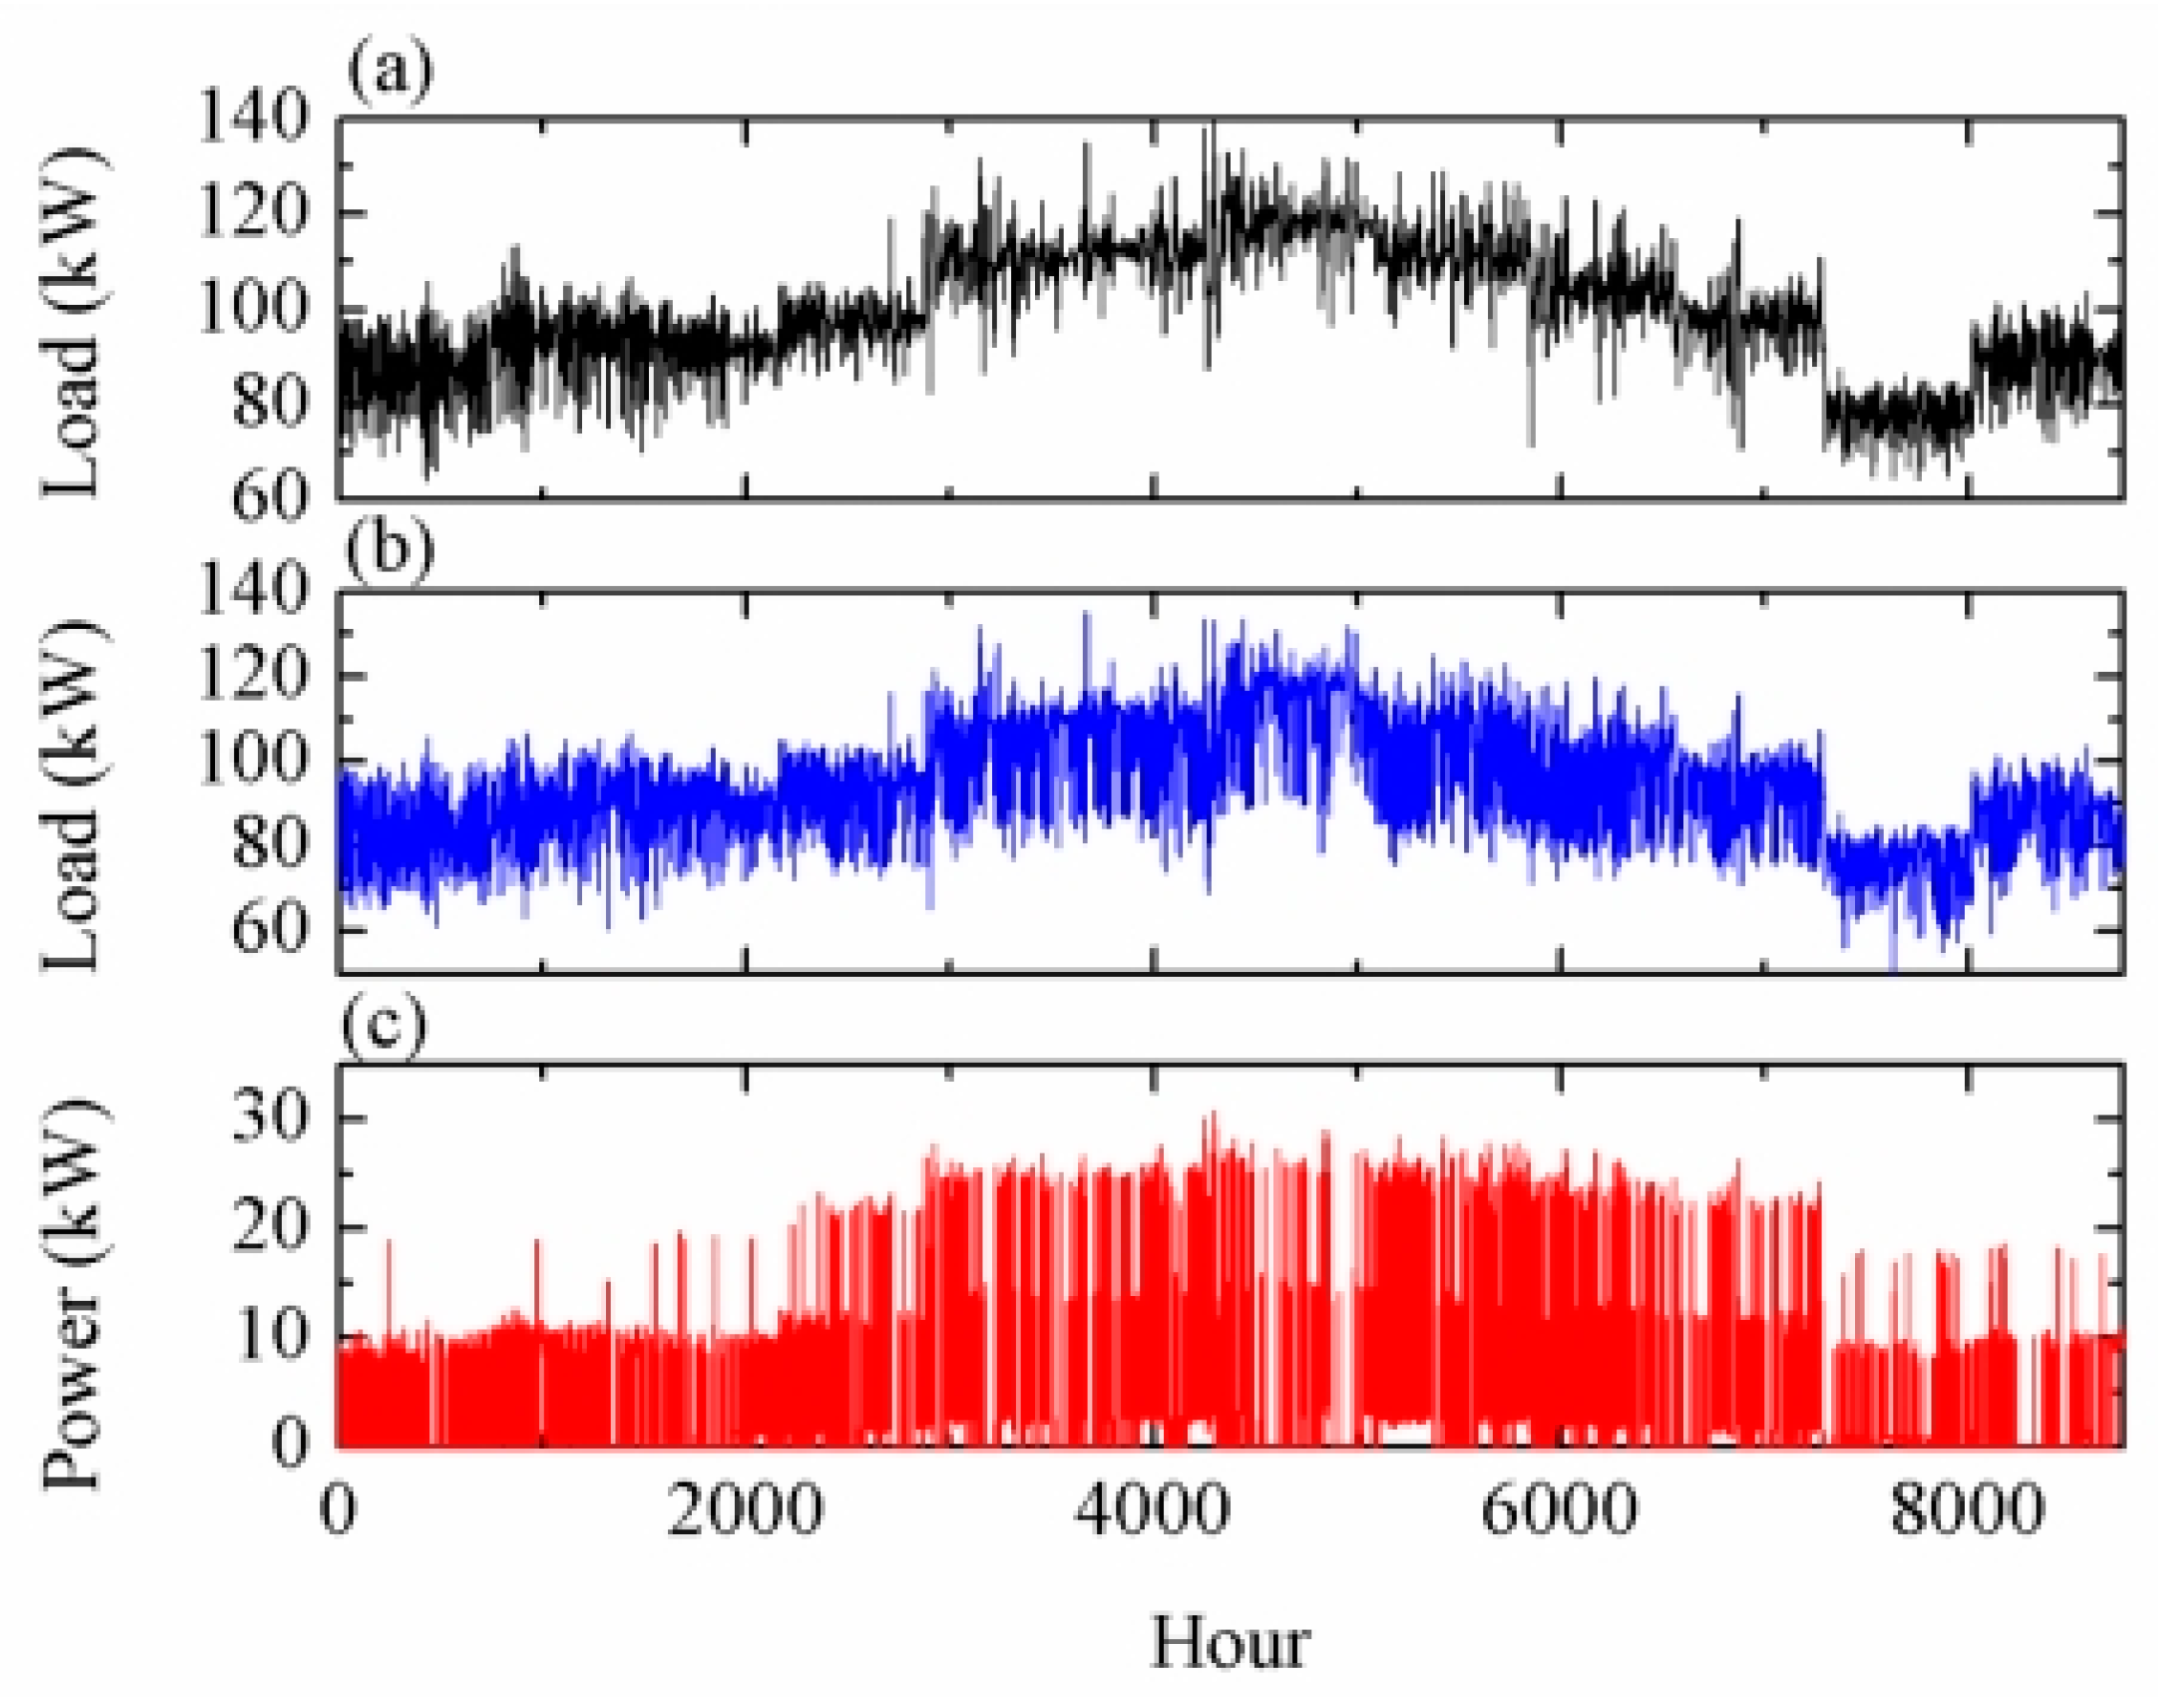
Figure 12.
Monthly average load demand of Zhongshan Station after multi-objective optimized dispatching.
Figure 12.
Monthly average load demand of Zhongshan Station after multi-objective optimized dispatching.
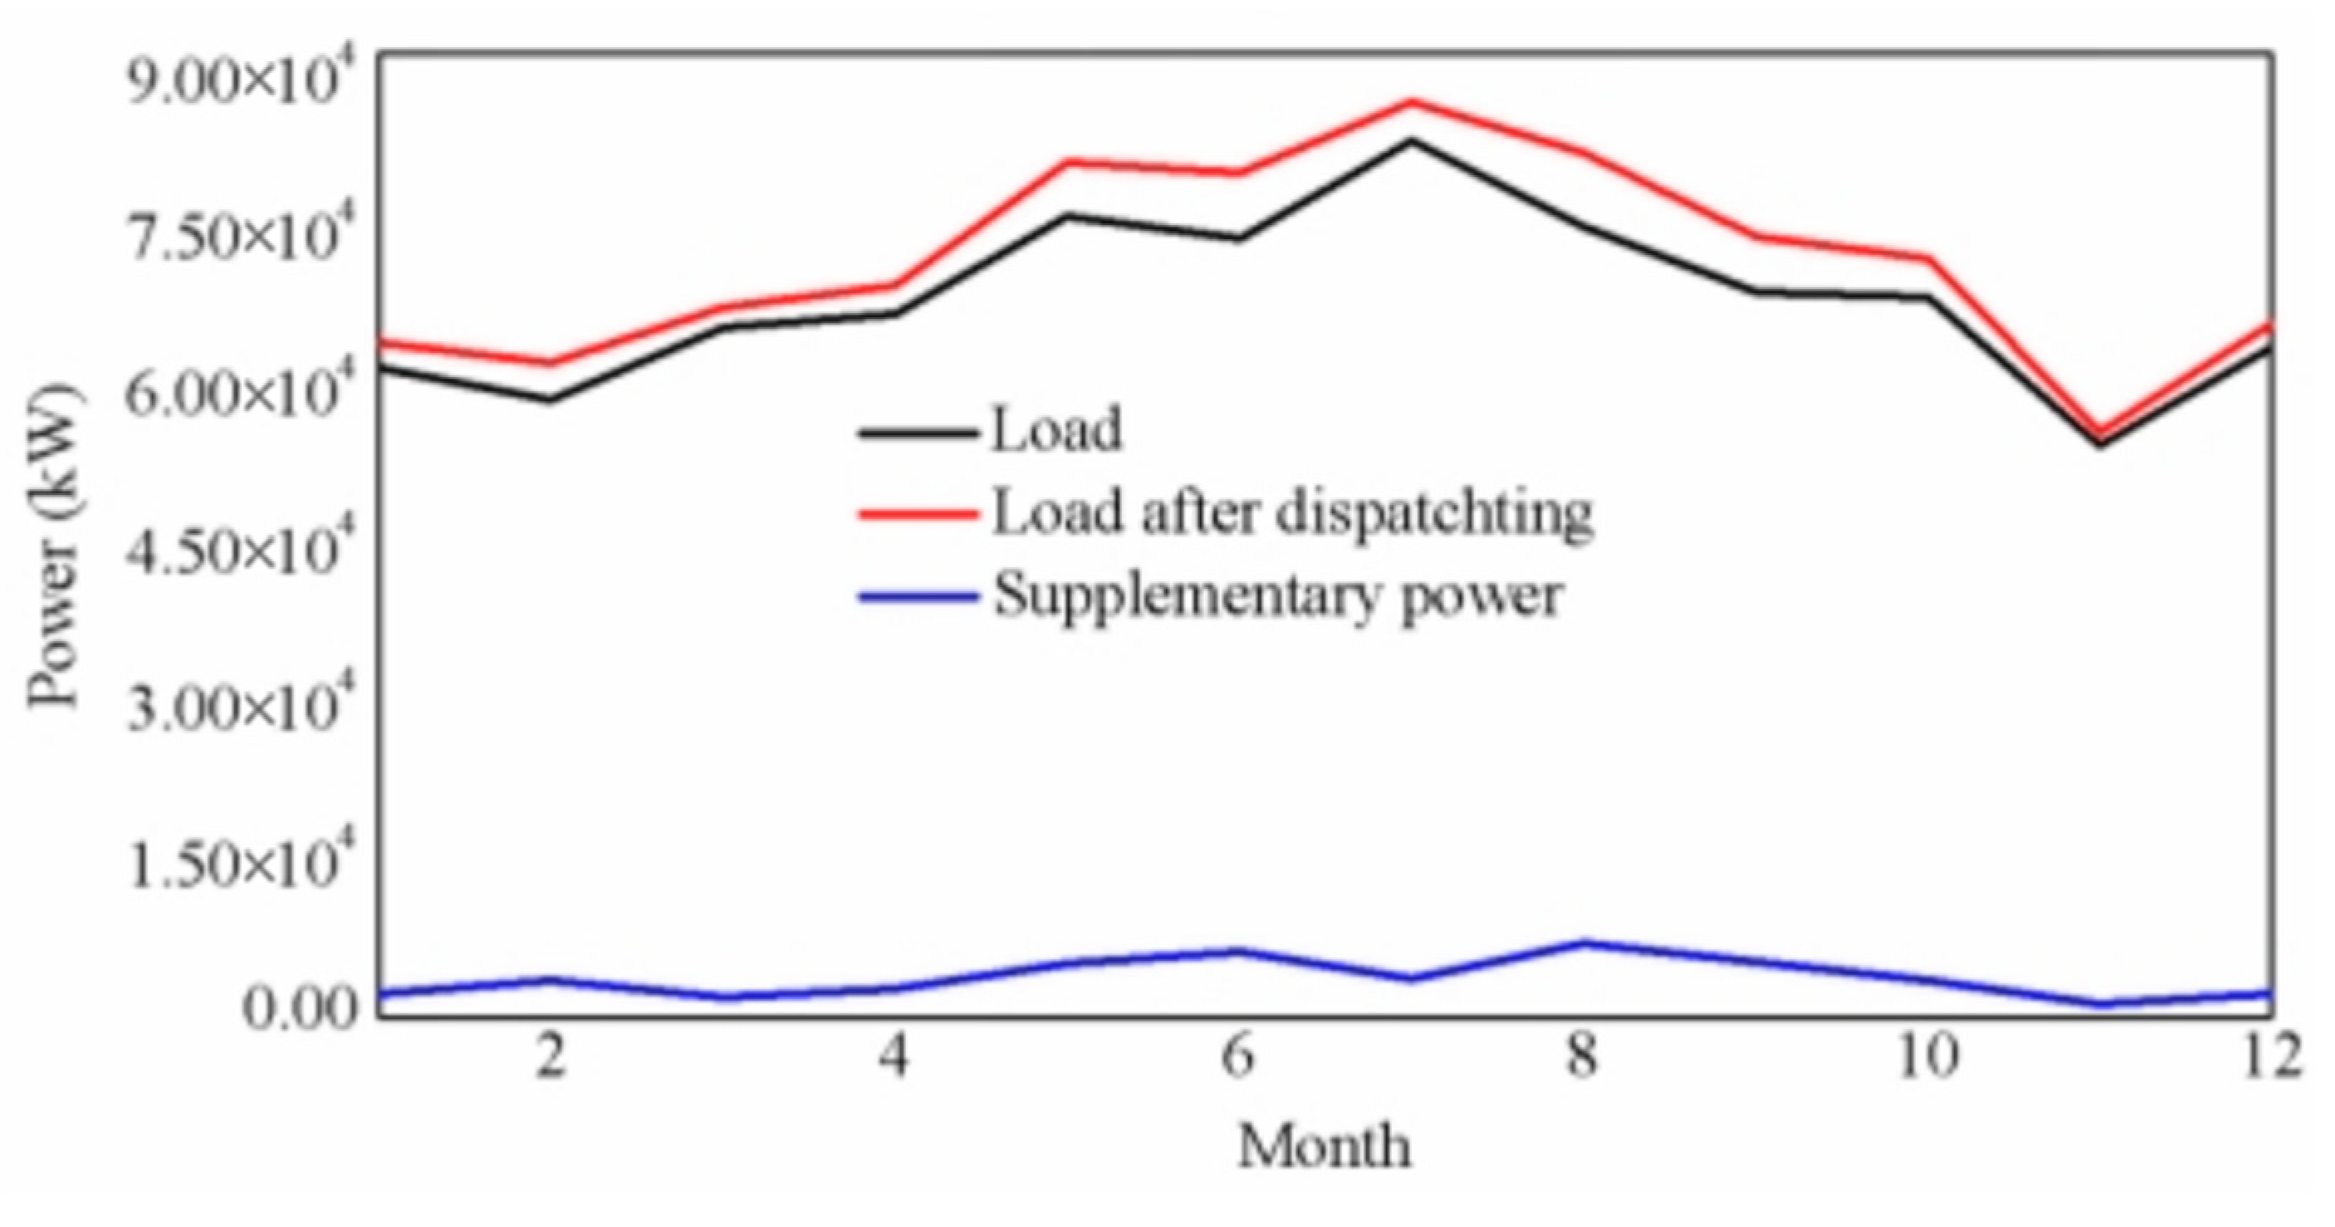
Figure 13.
Thermal energy supply after optimized dispatch at Zhongshan Station, Antarctica.

Figure 14.
Calculation results of annual heat source for each building.

Figure 15.
Results of scenario 1 of hybrid energy system of Zhongshan Station: (a) output of wind–solar–DG hybrid energy power; and (b) results after dispatching.
Figure 15.
Results of scenario 1 of hybrid energy system of Zhongshan Station: (a) output of wind–solar–DG hybrid energy power; and (b) results after dispatching.
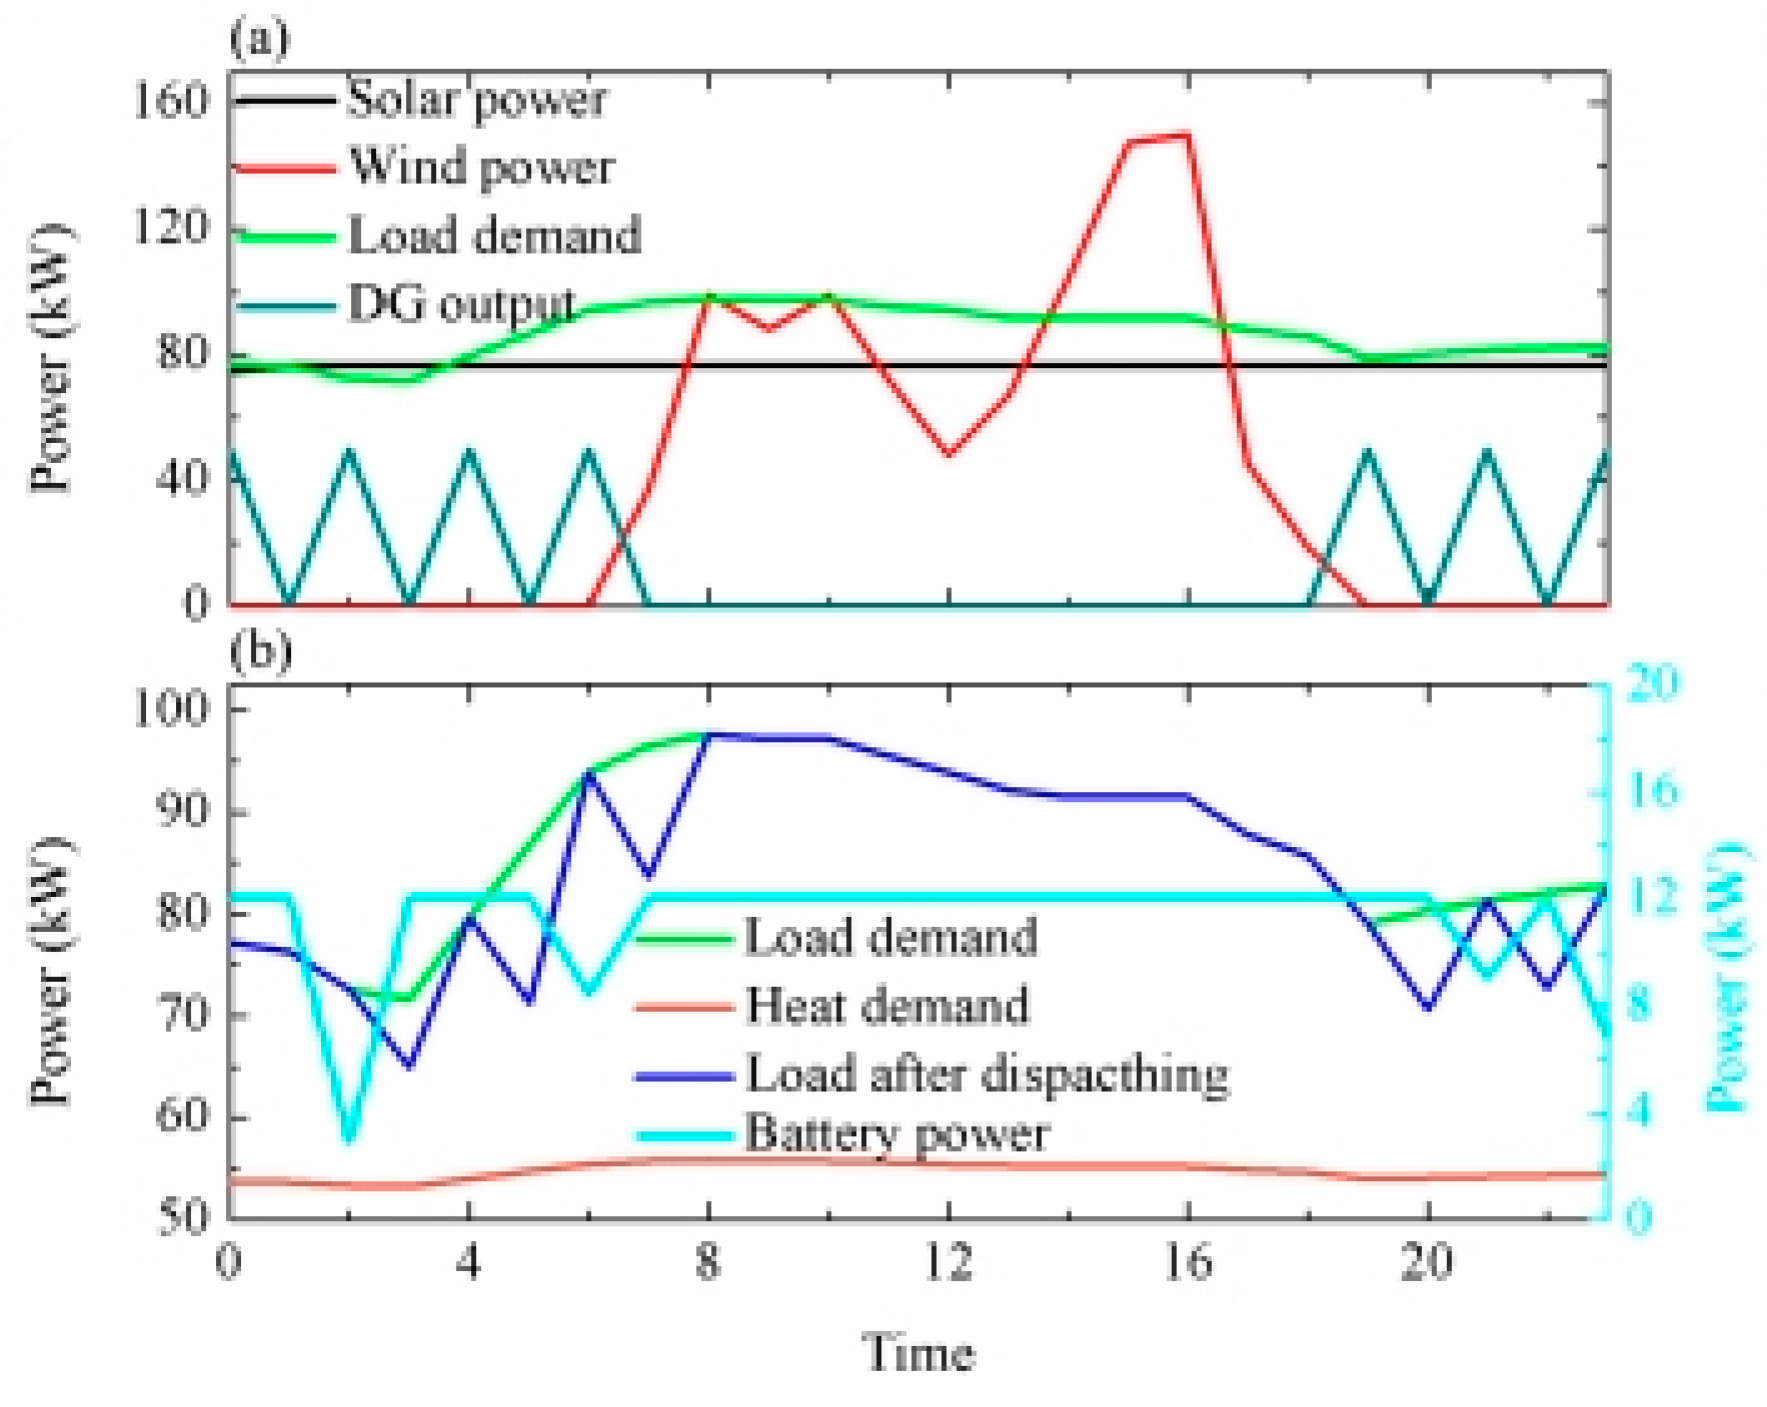
Figure 16.
Results of scenario 2 of the hybrid energy system of Zhongshan Station: (a) output of wind–solar–DG hybrid energy power; and (b) results after dispatching.
Figure 16.
Results of scenario 2 of the hybrid energy system of Zhongshan Station: (a) output of wind–solar–DG hybrid energy power; and (b) results after dispatching.

Figure 17.
Results of scenario 3 of the hybrid energy system of Zhongshan Station: (a) output of wind–solar–DG hybrid energy power; and (b) results after dispatching.
Figure 17.
Results of scenario 3 of the hybrid energy system of Zhongshan Station: (a) output of wind–solar–DG hybrid energy power; and (b) results after dispatching.


Table 1.
Basic information for the buildings in Zhongshan Station, Antarctica.
| Item | Description | Item | Description |
|---|---|---|---|
| ZS-1 | Office building | ZS-9 | Warehouse |
| ZS-2 | Residence building | ZS-10 | Garage |
| ZS-3 | Residence building | ZS-11 | Warehouse |
| ZS-4 | Electricity building | ZS-12 | Warehouse |
| ZS-5 | Electricity building | ZS-13 | Warehouse |
| ZS-6 | Observation building | ZS-14 | Warehouse |
| ZS-7 | Observation building | ZS-15 | Antenna |
| ZS-8 | Warehouse | ZS-16 | Oil tank |
Table 2.
Monthly average diesel consumption of Zhongshan Station.
| Month | 1 | 2 | 3 | 4 | 5 | 6 | 7 | 8 | 9 | 10 | 11 | 12 |
|---|---|---|---|---|---|---|---|---|---|---|---|---|
| Consumption (ton) | 18.7 | 18.4 | 19.31 | 19.81 | 21.7 | 21.5 | 22.5 | 21.83 | 20.46 | 20.12 | 17.9 | 19.1 |
Table 3.
Annual average load power of Chinese Zhongshan Station.
| Item | Annual Average Load Power (kW) | Item | Annual Average Load Power (kW) |
|---|---|---|---|
| ZS-1 | 238,739.2 | ZS-9 | 3256.7 |
| ZS-2 | 29,991.8 | ZS-10 | 155,100.6 |
| ZS-3 | 10,368.1 | ZS-11 | 3256.7 |
| ZS-4 | 6981.4 | ZS-12 | 3256.7 |
| ZS-5 | 6981.4 | ZS-13 | 1628.4 |
| ZS-6 | 42,761.2 | ZS-14 | 1628.4 |
| ZS-7 | 42,761.2 | ZS-15 | 14,101.6 |
| ZS-8 | 3256.7 | ZS-16 | 0 |
Table 4.
Monthly average heat power of Chinese Zhongshan Station, Antarctica.
| Item | Annual Average Heat Power (kW) | Item | Annual Average Heat Power (kW) |
|---|---|---|---|
| ZS-1 | 187,235.3 | ZS-9 | 3256.7 |
| ZS-2 | 32,566.6 | ZS-10 | 3256.7 |
| ZS-3 | 21,191.1 | ZS-11 | 3256.7 |
| ZS-4 | 16,283.3 | ZS-12 | 3256.7 |
| ZS-5 | 16,283.3 | ZS-13 | 1628.4 |
| ZS-6 | 16,283.3 | ZS-14 | 1628.4 |
| ZS-7 | 3256.7 | ZS-15 | 0 |
| ZS-8 | 3256.7 | ZS-16 | 0 |
Table 5.
Basic information of heat transfer pipeline in Zhongshan Station, Antarctica (a); and basic information of heat transfer pipeline in Zhongshan Station, Antarctica (b).
Table 5.
Basic information of heat transfer pipeline in Zhongshan Station, Antarctica (a); and basic information of heat transfer pipeline in Zhongshan Station, Antarctica (b).
| (a) | ||||||
|---|---|---|---|---|---|---|
| Node | ZS-1—ZS-5 | ZS-1—ZS-2 | ZS-2—ZS-12 | ZS-2—ZS-13 | ZS-3—ZS-5 | ZS-3—ZS-11 |
| Distance (m) | 200 | 25 | 26 | 35 | 250 | 25 |
| (b) | ||||||
| Node | ZS-5—ZS-7 | ZS-5—ZS-8 | ZS-5—ZS-9 | ZS-9—ZS-10 | ZS-13—ZS-14 | - |
| Distance (m) | 340 | 250 | 750 | 20 | 15 | - |
Table 6.
Key parameters of the hybrid energy system at Zhongshan Station, Antarctica.
| Type | UC | Fixed COP | Unfixed COP | C |
|---|---|---|---|---|
| Diesel generator | 133.3 $/kW | 12 $/kW | 0.18 $/kW | 150 kW |
| Boiler | 120 $/kW | 100 $/kW | - | 10 kW |
| Pipeline | 850 $/m | - | - | - |
| PV | 860 $/kW | 11 $/kW | 0.20 $/kW | 102.4 kW |
| Wind turbine | 1280 $/kW [16] | 5 $/kW | 0.21 $/kW | 250 kW |
| Electric heater | 2.5 $/kW | 1 $/kW | 0.20 $/kW | 52 kW |
| Battery | 4000 $/kAh | 3 $/kW | - | 1 kAh |
Table 7.
Key parameters of the dispatching model.
| Item | Value | Unit |
|---|---|---|
| α | 0.4 | - |
| β | 0.3 | - |
| δ | 0.3 | - |
| DOD | 20 | % |
| Pfuel | 0.83 | $/kW |
| CIF | 0.88 | kg-CO2/kWh |
| d | 6 | % |
| n | 25 | Year |
Table 8.
Main results after multi-objective optimization dispatching.
| Item | Value | Unit |
|---|---|---|
| Min(LPSP) | 0 | % |
| Min(COE) | 0.09 | $/kWh |
| Min(ECO2) | 277.73 | ton-CO2/Year |
| TDG | 4578 | hour |
Table 9.
Monthly average data of Zhongshan Station and results after optimized dispatching.
| Month | Initial Load (kW) | Load after Dispatching (kW) | Load Power Difference (kW) | Original Fuel Consumption (ton) | Fuel Consumption after Dispatching (ton) |
|---|---|---|---|---|---|
| 1 | 64,763.00 | 62,364.25 | 2371.75 | 18.7 | 3.4 |
| 2 | 62,788.00 | 59,203.19 | 3584.81 | 18.4 | 3.5 |
| 3 | 68,177.00 | 66,109.24 | 2067.77 | 19.31 | 5.6 |
| 4 | 70,246.01 | 67,450.56 | 2795.44 | 19.81 | 8.3 |
| 5 | 82,049.01 | 76,849.52 | 5199.49 | 21.7 | 12.3 |
| 6 | 81,036.00 | 74,703.88 | 6332.12 | 21.5 | 13.8 |
| 7 | 87,743.02 | 84,021.35 | 3721.67 | 22.5 | 7.0 |
| 8 | 82,938.00 | 75,766.18 | 7171.82 | 21.83 | 16.7 |
| 9 | 74,981.02 | 69,606.64 | 5374.37 | 20.46 | 12.2 |
| 10 | 72,745.33 | 69,068.03 | 3677.30 | 20.12 | 10.3 |
| 11 | 56,175.00 | 54,820.21 | 1354.79 | 17.9 | 7.1 |
| 12 | 66,579.00 | 64,285.73 | 2293.27 | 19.1 | 4.7 |
| Mean | 72,516.11 | 68,697.40 | 3828.72 | 20.11 | 8.7 |
| Sum | 870,193.38 | 824,248.80 | 45,944.60 | 241.33 | 104.9 |
Disclaimer/Publisher’s Note: The statements, opinions and data contained in all publications are solely those of the individual author(s) and contributor(s) and not of MDPI and/or the editor(s). MDPI and/or the editor(s) disclaim responsibility for any injury to people or property resulting from any ideas, methods, instructions or products referred to in the content. |
© 2024 by the authors. Licensee MDPI, Basel, Switzerland. This article is an open access article distributed under the terms and conditions of the Creative Commons Attribution (CC BY) license (https://creativecommons.org/licenses/by/4.0/).
Share and Cite
MDPI and ACS Style
Zuo, G.; Dou, Y.; Wang, J.; Yang, B.; Kou, L. A Multi-Objective Scheduling Strategy for a Hybrid Energy System for Antarctic Coastal Research Stations. J. Mar. Sci. Eng. 2024, 12, 781. https://doi.org/10.3390/jmse12050781
AMA Style
Zuo G, Dou Y, Wang J, Yang B, Kou L. A Multi-Objective Scheduling Strategy for a Hybrid Energy System for Antarctic Coastal Research Stations. Journal of Marine Science and Engineering. 2024; 12(5):781. https://doi.org/10.3390/jmse12050781
Chicago/Turabian StyleZuo, Guangyu, Yinke Dou, Jin Wang, Bo Yang, and Liwei Kou. 2024. "A Multi-Objective Scheduling Strategy for a Hybrid Energy System for Antarctic Coastal Research Stations" Journal of Marine Science and Engineering 12, no. 5: 781. https://doi.org/10.3390/jmse12050781
Note that from the first issue of 2016, this journal uses article numbers instead of page numbers. See further details here.