
Shaping of the Frequency Response of Photoacoustic Cells with Multi-Cavity Structures

Institute of Electronic Systems, Faculty of Electronics and Information Technology, Warsaw University of Technology, Nowowiejska 15/19, 00-665 Warsaw, Poland
*
Author to whom correspondence should be addressed.
Electronics 2024, 13(9), 1786; https://doi.org/10.3390/electronics13091786
Submission received: 3 April 2024
/
Revised: 27 April 2024
/
Accepted: 4 May 2024
/
Published: 6 May 2024
(This article belongs to the Special Issue Innovations in Digital and Analog Electronic Systems for Next-Generation Devices)
Abstract
:In the great majority of cases, the design of resonant photoacoustic cells is based on the use of resonators excited at the frequencies of their main resonances. This work presents a solution in which the use of a multi-cavity structure with the appropriate selection of the mechanical parameters of the cavities and the interconnecting ducts allows for the shaping of the frequency response of the cell. Such solutions may be particularly useful when the purpose of the designed cells is operation at multiple frequencies, e.g., in applications with the simultaneous detection of multiple gaseous compounds. The concept is tested with cells made using 3D printing technology. The measured frequency responses of the tested cells show very good agreement with the simulation results. This allows for an approach in which the development of a cell with the desired frequency response can be initially based on modeling, without the need for the time-consuming and expensive process of manufacturing and measuring numerous modifications of the cell.
1. Introduction
The photoacoustic phenomenon, which can be briefly described as the production of an acoustic response to the periodic light stimulation of the investigated sample, was discovered in the 19th century by Bell during his work on the photophone. However, the dynamic development of photoacoustics began only in the 1970s, and this happened mainly due to the wider availability of highly sensitive acoustic wave transducers (microphones and piezoelectric detectors) and lasers.
Initially, the main area of application of photoacoustics was spectroscopic research. Significant advantages of photoacoustic technology in such applications are high sensitivity and accuracy. These result directly from the mechanism of the photoacoustic phenomenon, in which the amplitude of the excited acoustic response is directly proportional to the absorbed photon energy. For comparison, absorption spectrophotometry is based on measuring the ratio of light intensity before and after passing through the investigated substance. In the case of weak absorption, it comes down to measuring two large values that differ very little from each other, which causes significant measurement errors and consequently limits the maximum sensitivity of the measurements.
As already mentioned, photoacoustics is a technique that can be used in numerous applications, but probably the most common are photoacoustic spectroscopy and trace gas detection [1,2,3]. A typical photoacoustic setup for the detection of trace amounts of a gas requires the use of a light source, the wavelength of which is selected according to the absorption lines of the gas. The investigated gas sample is usually placed in a container (photoacoustic cell). If the sample is irradiated with a modulated light beam, a photoacoustic signal is produced. The amplitude and phase of such a signal are then measured with a microphone or a piezoelectric transducer that converts the pressure changes into an electric waveform that is finally processed with a lock-in amplifier (Figure 1). In the majority of photoacoustic applications, but particularly in the case of trace gas detection, one of the priorities is the possibility of detecting the lowest possible concentration of the investigated compounds, i.e., the highest possible sensitivity of the setup.
The amplitude of the photoacoustic signal amplitude depends on several factors [4]:
where
- P0—the power of the light used to excite the photoacoustic effect;
- β—the absorption coefficient;
- η—the efficiency of the detector (e.g., microphone);
- Q—the quality factor of the cell (assuming that the modulation frequency of the light beam is identical to the acoustic resonance frequency of the cell);
- V—the volume of the photoacoustic cell;
- f—the frequency of the light beam modulation.
The above formula clearly indicates that the properties of the cell strongly affect the sensitivity of the setup and that an increase in the photoacoustic signal can be obtained by using the resonance PA cell with possibly a high Q-factor, developing the cell in such a way that its volume V is kept small or working with a relatively low modulation frequency f. That is why one of the most common approaches in the development of photoacoustic cells is the use of the Helmholtz resonance [5,6,7,8,9,10,11,12,13,14,15,16,17,18]. Although such acoustic structures have a relatively low Q, they allow for obtaining a very low volume and reasonable dimensions simultaneously with relatively low resonance frequencies. Photoacoustic cells with standing wave resonances [5,6,7,8,9] usually have a relatively high resonance frequency due to the fact that the length λ of the acoustic wave directly depends on the frequency:
where
- v—the speed of sound propagation in the gas filling the cell;
- f—the frequency of the acoustic wave.
Taking into consideration that the speed of sound propagation in the air at room temperature is about 340 m/s, a cell designed for operation with a light beam modulation frequency of 340 Hz, used to measure trace amounts of certain substances in the air, would produce an acoustic wavelength of about 1 m. As such a cell size is unpractical, resonant cells with a standing wave resonance usually work with light beam modulation frequencies at the level of several kHz.
The basic form of a photoacoustic Helmholtz cell comprises two cavities connected with a narrow channel (Figure 1). A modulated light beam is passed through a window and induces the photoacoustic effect in the investigated gas sample. Due to the Helmholtz resonance, the PA signal is amplified. As the amplitude of the signal at the resonance frequency is identical in both cavities, the microphone that converts pressure changes into an electric signal is typically placed in the other cavity, which has a strong advantage of separating the microphone from the light beam, thus reducing the possibility of generating a parasitic PA signal resulting from the absorption of light by the microphone [5,6,16,17,18]. A very important feature of Helmholtz resonators is that their resonance frequency f0 does not depend on a single dimension but rather is given by the following formula [5,6,19]:
where
- v—the speed of sound propagation in the gas filling the cell;
- φ—the diameter of the duct connecting the cavities;
- l—the length of the duct connecting the cavities;
- V1 and V2—the cavity volumes.
The frequency response of such a cell is presented in Figure 2 (red solid line) and compared with the frequency response of a non-resonant cell of equivalent volume (black dashed line).
As already mentioned, one of the typical applications of photoacoustics is the detection of a given gaseous compound, in particular a toxic, flammable, or even explosive gaseous compound. In such a case, very often we wish to detect not a single compound but several potentially harmful substances.
The composition of the investigated substance together with a quantitative analysis can, of course, be determined based on the measured absorption spectrum of the investigated substance. For this purpose, it is possible to use a light source with a tunable wavelength and record an absorption spectrum by performing numerous measurements at different wavelengths (with a point-by-point method, i.e., setting a given wavelength, measuring absorption, changing the wavelength by a small step, measuring absorption, and so on). Unfortunately, such a solution requires the use of an expensive tunable light source, and the spectrum recording is relatively slow due to the need for numerous measurements. Another approach is to use the FTIR PAS method, i.e., measure the spectrum using the Fourier technique. The main advantage of this method is the simultaneous measurement of all wavelength components, which shortens the measurement time. Its disadvantages include the complexity of the optical system (significant size, high cost, and sensitivity to mechanical stress) and errors resulting from the calculation of the Fourier transform itself, i.e., the blurring of the absorption lines. Another problem is that, in the rapid-scan Fourier photoacoustic technique, the modulation covers a wide range of acoustic frequencies. For this reason, the measurement cell should have as linear a frequency response as possible (that is why non-resonant cells are usually used for this purpose), and the photoacoustic signal amplifier must have a wide passband. This means that the amplification of the photoacoustic signal using resonant cells and narrowband filtering, which allow for the improvement of the signal-to-noise ratio, is then practically impossible.
Measurements aimed at detecting specific compounds can also be carried out with the use of a few fixed-wavelength light sources (which are much less expensive than tunable ones) and can be implemented in at least several ways. The simplest method is to sequentially perform measurements at selected light wavelengths that are in the absorption spectra of the compounds being sought. This technique can be used if the composition of the sample is relatively well known and if the only information being sought is the concentrations of selected compounds. With the appropriate selection of wavelengths (such that the wavelengths used are relatively strongly absorbed by the compounds sought, with the lowest possible absorption by the remaining compounds present in the investigated samples), the concentrations of individual compounds can be determined relatively easily. However, the significant disadvantages of this method are as follows:
- (1)
- The N-fold extension of the measurement time in comparison to the duration of a single measurement (for one compound) if N compounds are being detected;
- (2)
- The possibility of changes in the measurement conditions, e.g., the temperature of the sample; the pressure in the cell; or, in extreme cases, even the concentrations of the investigated substances over time. Such changes will usually not be taken into account, resulting in an increase in the errors of the measurement results.
Taking into consideration that, usually, we are looking for a relatively fast reaction of such a gas sensor, we would preferably implement the simultaneous (on the contrary to sequential) detection of multiple compounds. If we use several light wavelengths simultaneously, they must be modulated with different frequencies; thus, we would need a cell with a few resonance frequencies. In the case of cells with standing wave resonances, a solution is to use several longitudinal resonators connected in parallel [1,20]. But, so far, no reports about the use of multi-cavity Helmholtz resonators with more than two fundamental resonances have been presented. The aims of this work were to investigate the properties of such multi-cavity structures applied for the shaping of the frequency response of photoacoustic cells and to develop a multi-resonance PA cell with a least three resonance peaks.
2. Theoretical Considerations
A multi-cavity Helmholtz cell is a cell consisting of more than two cavities connected with ducts. The simplest case is a triple-cavity cell. Such structures were investigated primarily by Egerev et al. [21] (Figure 3a). He used triple-cavity structures with the aim of implementing differential measurements with the separation of both microphones from the sample cavity (to avoid a parasitic PA signal from the absorption of light by the microphones). Further investigations of triple-cavity Helmholtz cells, but in slightly different configurations (Figure 3b), were carried out by Starecki [22], who then focused on the use of multi-cavity Helmholtz cells in the development of open photoacoustic Helmholtz cells [23,24]. It should be noted that very limited research has been performed on the use of multi-cavity structures with the aim of shaping the frequency response of photoacoustic cells [4,22].
From previous works [4,22], it was known that the use of an additional cavity adds one more resonance in comparison to a simple Helmholtz cell. For this reason, we decided to investigate the properties of four-cavity star-formed structures, as shown in Figure 4. The cell was designed in such a way that the middle cavity was used as a sample cavity (in which the photoacoustic effect was induced), while all the side cavities were equipped with microphones.
The first step of the development of the cells was based on simulations of their frequency responses. For this purpose, we used the acousto-electrical analogy method, in which each acoustic element of the cell structure is replaced with a corresponding electrical component [4,25,26,27,28]. In such a case, excitation resulting from the photoacoustic effect induced in the cavity containing the irradiated sample is modeled with a current source, while all the cavities are simulated with capacitors calculated from the following formula [25,26,27,28]:
where
- Vi—the volume of the i-th cavity (i = 1–4);
- ρ—the gas density;
- v—the speed of sound propagation in the gas filling the cell.
In the simplest case, the ducts can be represented by lossy inductances [25,26,27,28], but it is known from previous works that, even in the case of a basic (two-cavity) Helmholtz cell, such an approach results in substantial modeling errors [4,29]. Much better results can be obtained if the ducts are represented with transmission lines [4,28,29,30], which can be further replaced with equivalent T-sections (Figure 5).
Regarding the transmission line used for the modeling of the duct, the characteristic impedance and the propagation constant are defined as follows:
where [31]
In the above formulas, the symbol a is the radius of the duct, and κ is the adiabatic coefficient of the gas filling the cell (κ = cp/cv, where cp is the heat capacity at constant pressure, and cv is the heat capacity at constant volume).
Function F is defined as
where J0 and J1 are complex zero- and first-order Bessel functions, and subscripts v and t in Equations (6) and (7) indicate whether the variable is rv or rt.
should be used for the substitution of the symbol rv, t used in Equation (8). In Equation (9), η is the gas viscosity.
The transmission line can be converted to a T-section (Figure 5c), in which the impedances Z3, Z4, and Z5 should be calculated from [32]
where l represents the length of the channel.
In comparison to the lumped component models, the transmission line duct model gives better results in the photoacoustic Helmholtz cell simulations. However, the experimental results show that, in the case of a PA cell with small cavities, even the transmission line duct model does not reflect all the losses and leads to overestimated Q-factor values. For this reason, a duct model with corrections was developed [31]. In order to introduce additional losses in the transmission duct model, the serial resistance in the modeling of duct properties was increased by adding an Rloss component to the real parts of the Z3 and Z4 impedances. As the equivalent circuit diagram of the duct should be symmetrical, the increase in both Z3 and Z4 impedances should be identical so that Rloss can be expressed as a function of the Z3 and Z4 impedances:
Taking into consideration that γ is not a constant value and shows a slightly non-linear relationship versus duct diameter , it can be defined with a parabolic approximation:
in which
and
where V1 and V2 are volumes of the cavities connected with the modeled duct, and l corresponds to the length of the duct (in the above expressions, standard SI units should be used). It should be noted that Equation (13) is valid only if the duct is shorter than 12.5 cm (in the case of longer ducts, A should be substituted with zero). A circuit diagram used for the purpose of modeling the investigated cells is presented in Figure 6. As the cell was stimulated with the modulated light beam illuminating the central cavity, the current source I is connected to the C0 capacitor. Pressure in the cavities is represented by the voltage across capacitors.
At first, we performed numerous simulations with different duct sizes (lengths and diameters) to observe the influence of these parameters on the frequency responses of the cells. In the simulations of the cells performed in this work, we used the transmission line duct model in two versions: with and without corrections. Below, we discuss two examples of the investigated cells, the mechanical properties of which are given in Table 1. The obtained simulation results are shown in Figure 7.
3. Experimental Results
The obtained simulations presented in Figure 7 were verified with measurements. The cells used for the purpose of experimental verification were produced with 3D printing technology. The cell bodies were made of PLA (Fiberlogy Easy PLA filament [33]) with a Prusa MK3S+ printer [34]. The printing code was generated with PrusaSlicer with the following settings: a layer height of 0.2 mm and 100% infill. The printer operated with a nozzle temperature of 215 °C and a bed temperature of 60 °C. An example of a cell printed in such a way is shown in Figure 8.
The simulation results were verified with measurements performed in the system presented in Figure 9. The measuring setup was controlled from a PC, which was also used for data recording and preliminary data processing. A two-channel function generator (DG 1022Z Rigol [35]) was used to produce a signal, which was applied to a precise homemade voltage-to-current converter. The voltage-to-current converter drove an IR LED (OSRAM SFH4550 [36]) emitting infrared light (with a center wavelength of 860 nm) with a very high radiant intensity (over 1 W/sr) and a very small half-angle (±3°). The diode was positioned right above the cell window, with a very narrow spacing (1–2 mm) preventing the mechanical stress of the LED package (resulting from the current flow) from being transmitted to the window or body of the cell. The modulated light flux was absorbed by a sample (in order to obtain a high level of the photoacoustic signal, black Musou Black paint was used for absorbing the light), inducing a photoacoustic effect. The produced photoacoustic signal was detected by means of a high-sensitivity (60 mV/Pa) 1/4 inch microphone (B&K 4961 [37]). The signal from the microphone was amplified in a B&K 1704 [38] signal conditioner and then supplied to a digital lock-in amplifier (Stanford Research Systems SRS 860 [39]). Frequency responses were measured sequentially; i.e., we used a single microphone placed in one of the microphone cavities, while the microphone holes in the remaining microphone cavities were closed with dummy plugs. Once a whole frequency response was recorded, the microphone was transferred to another microphone cavity, and the procedure was repeated until the frequency responses of all the microphone cavities were measured.
4. Discussion
The simulation results presented in Figure 7 lead to at least two important conclusions: firstly, that multi-cavity photoacoustic Helmholtz structures allow for obtaining multi-resonance characteristics and that, secondly, depending on our needs, we can obtain resonance peaks close to each other (as in the case of cell #1; Figure 7a) or substantially spaced (as in the case of cell #2; Figure 7b). A comparison of the measurement results (Figure 10 and Figure 11) with the simulations shows very good agreement. It should be noted that, at lower frequencies (below 2 kHz), the model with corrections gives a nearly perfect match with the measurements. The lower measured response at low frequencies (below 50 Hz) results mainly from the limited bandwidth of the microphone (lower corner frequency of 5 Hz [37]) and preamplifier (lower corner frequency of 2.2 Hz [38]). The slight shift toward lower frequencies of the measured frequency responses in comparison to the simulations may be caused by slightly smaller diameters or the ducts (the accuracy of 3D printing technology is limited), but the shape of the frequency response curve is very well preserved. However, the shape of the frequency responses above 2 kHz is much better approximated by the model without corrections. The difference is particularly strong at resonances in the 4 to 8 kHz range. It should be noted that the model with corrections is based on some experimental results [30] and that the range of frequencies and mechanical dimensions at which it is applicable is limited. Thus, if both models give similar results, it can be safely assumed that the model with corrections will result in a better approximation, while in the case of significant discrepancies between simulations obtained from the corrected and non-corrected models, the model without corrections should be assumed as more reliable. This is quite important information because, based on the range of frequencies that we intend to use for the cell for operation, we can pick the more accurate model.
5. Conclusions
According to the obtained simulation and experimental results, we can state that the use of a multi-cavity structure as a photoacoustic cell with Helmholtz resonances allows for the convenient shaping of the frequency response and for obtaining multiple resonances that can be particularly useful when the designed cell will operate at multiple frequencies, e.g., in applications with the simultaneous detection of multiple gaseous compounds. Depending on our needs, it is possible to obtain a frequency response with resonances that are close to each other or substantially spaced. The properties of the cell can be quite accurately estimated with modeling based on the acousto-electrical analogy method. It should also be mentioned that both models described in this paper can be implemented quite easily, even on machines with very limited numerical power, and even in such a case, simulations that require performing calculations of the frequency response at several thousands of frequency points are obtained immediately. This is quite important because it means that such simulations can be used as a very efficient way of performing a preliminary evaluation of the cell properties. Furthermore, 3D printing technology is suitable for the fast and inexpensive prototyping of the photoacoustic cells or even for the production of the cells (if the material used for the cell printing is acceptable for the target applications of the cell).
Author Contributions
Conceptualization, T.S. and W.P., simulations, W.P., hardware development, W.P., experimental data acquisition, W.P., writing—original draft preparation, T.S. and W.P., writing —review and editing, T.S. and W.P. All authors have read and agreed to the published version of the manuscript.
Funding
This research received no external funding.
Data Availability Statement
The datasets analyzed during the current study are available from the corresponding author upon reasonable request.
Conflicts of Interest
The authors declare no conflicts of interest.
References
- Li, T.; Sima, C.; Ai, Y.; Tong, C.; Zhao, J.; Zhao, Z.; Lu, P. Photoacoustic spectroscopy-based ppb-level multi-gas sensor using symmetric multi-resonant cavity photoacoustic cell. Photoacoustics 2023, 32, 100526. [Google Scholar] [CrossRef] [PubMed]
- Fan, E.; Liu, H.; Wang, C.; Ma, J.; Guan, B.O. Compact optical fiber photoacoustic gas sensor with integrated multi-pass cell. Photoacoustics 2023, 32, 100524. [Google Scholar] [CrossRef] [PubMed]
- Li, B.; Menduni, G.; Giglio, M.; Patimisco, P.; Sampaolo, A.; Zifarelli, A.; Wu, H.; Wei, T.; Spagnolo, V.; Dong, L. Quartz-enhanced photoacoustic spectroscopy (QEPAS) and Beat Frequency-QEPAS techniques for air pollutants detection: A comparison in terms of sensitivity and acquisition time. Photoacoustics 2023, 31, 100479. [Google Scholar] [CrossRef]
- Starecki, T. Wybrane Aspekty Optymalizacji Przyrządów Fotoakustycznych (Selected Apects of Photoacoustic Instruments Optimization); BTC: Legionowo, Poland, 2009. [Google Scholar] [CrossRef]
- Miklós, A.; Hess, P.; Bozóki, Z. Application of acoustic resonators in photoacoustic trace gas analysis and metrology. Rev. Sci. Instrum. 2001, 72, 1937–1955. [Google Scholar] [CrossRef]
- Wang, F.; Cheng, Y.; Xue, Q.; Wang, Q.; Liang, R.; Wu, J.; Sun, J.; Zhu, C.; Li, Q. Techniques to enhance the photoacoustic signal for trace gas sensing: A review. Sens. Actuators A Phys. 2022, 345, 113807. [Google Scholar] [CrossRef]
- Zhang, M.; Zhang, B.; Chen, K.; Guo, M.; Liu, S.; Chen, Y.; Gong, Z.; Yu, Q.; Chen, Z.; Liao, M. Miniaturized multi-pass cell based photoacoustic gas sensor for parts-per-billion level acetylene detection. Sens. Actuators A Phys. 2020, 308, 112013. [Google Scholar] [CrossRef]
- Zhang, M.; Gao, G.; Jiang, Y.; Wang, X.; Long, F.; Cai, T. A sensor based on high-sensitivity multi-pass resonant photoacoustic spectroscopy for detection of hydrogen sulfide. Opt. Laser Technol. 2023, 159, 108884. [Google Scholar] [CrossRef]
- Li, C.; Chen, K.; Zhao, J.; Qi, H.; Zhao, X.; Ma, F.; Han, X.; Guo, M.; An, R. High-sensitivity dynamic analysis of dissolved gas in oil based on differential photoacoustic cell. Opt. Lasers Eng. 2023, 161, 107394. [Google Scholar] [CrossRef]
- Case, J.A.; Smith, R.W. Photoacoustic measurement of the optical absorption of aerosols. In Proceedings of the Meetings on Acoustics, Acoustical Society of America, Denver, CO, USA, 23–27 May 2022; AIP Publishing: Melville, NY, USA, 2022; Volume 46, p. 045003. [Google Scholar] [CrossRef]
- Wu, Z.; Shi, Y.; Han, Y. Methane, Ethylene, and Ethane Detection by Differential Helmholtz Resonance Spectroscopy Using a 3345nm Mid-Infrared Tunable Diode Laser Source. Appl. Sci. 2023, 13, 3169. [Google Scholar] [CrossRef]
- Li, Z.; Liu, J.; Si, G.; Ning, Z.; Fang, Y. Design of a high-sensitivity differential Helmholtz photoacoustic cell and its application in methane detection. Opt. Express 2022, 30, 28984. [Google Scholar] [CrossRef]
- Li, Z.; Liu, J.; Si, G.; Ning, Z.; Fang, Y. Active noise reduction for a differential Helmholtz photoacoustic sensor excited by an intensity-modulated light source. Opt. Express 2023, 31, 1154. [Google Scholar] [CrossRef]
- Ma, Q.; Li, L.; Gao, Z.; Tian, S.; Yu, J.; Du, X.; Qiao, Y.; Shan, C. Near-infrared sensitive differential Helmholtz-based hydrogen sulfide photoacoustic sensors. Opt. Express 2023, 31, 14851. [Google Scholar] [CrossRef] [PubMed]
- Wei, Q.; Li, B.; Zhao, B.; Yang, P. EC-QCL based photoacoustic spectroscopy for detection of SF6 decomposition components. Sens. Actuators B Chem. 2022, 369, 132351. [Google Scholar] [CrossRef]
- Quimby, R.S.; Selzer, P.M.; Yen, W.M. Photoacoustic cell design: Resonant enhancement and background signals. Appl. Opt. 1977, 16, 2630. [Google Scholar] [CrossRef] [PubMed]
- Fernelius, N.C. Helmholtz resonance effect in photoacoustic cells. Appl. Opt. 1979, 18, 1784. [Google Scholar] [CrossRef] [PubMed]
- Nordhaus, O.; Pelzl, J. Frequency dependence of resonant photoacoustic cells: The extended Helmholtz resonator. Appl. Phys. 1981, 25, 221–229. [Google Scholar] [CrossRef]
- Monahan, E.M.; Nolle, A.W. Quantitative study of a photoacoustic system for powdered samples. J. Appl. Phys. 1977, 48, 3519–3523. [Google Scholar] [CrossRef]
- Besson, J.P.; Schilt, S.; Thévenaz, L. Sub-ppm multi-gas photoacoustic sensor. Spectrochim. Acta Part A Mol. Biomol. Spectrosc. 2006, 63, 899–904. [Google Scholar] [CrossRef] [PubMed]
- Egerev, S.V.; Fokin, A.V.; Pashin, A.E. Time-domain photoacoustic measurements of absolute optical absorption coefficient using three-chamber cell. Rev. Sci. Instrum. 1996, 67, 2691–2697. [Google Scholar] [CrossRef]
- Starecki, T.; Opalska, K.; Burd, A.; Misiaszek, S.; Ramotowski, M. Analysis of some basic properties of multicavity photoacoustic Helmholtz cells. In Proceedings of the Photonics Applications in Industry and Research IV, Warsaw, Poland, 8 October 2005; Romaniuk, R.S., Simrock, S., Lutkovski, V.M., Eds.; International Society for Optics and Photonics (SPIE): Bellingham, WA, USA, 2005; Volume 5948, p. 59481M. [Google Scholar] [CrossRef]
- Starecki, T.; Geras, A. Differential Open Photoacoustic Helmholtz Cell. Int. J. Thermophys. 2014, 35, 2259–2268. [Google Scholar] [CrossRef]
- Geras, A.; Starecki, T. Parametric Analysis of a Differential Photoacoustic Helmholtz Cell. Int. J. Thermophys. 2014, 35, 2269–2278. [Google Scholar] [CrossRef]
- Morse, P.M. Vibration and Sound; McGraw-Hill: New York, NY, USA, 1948; Available online: https://archive.org/details/dli.ernet.475034/page/n19/mode/2up (accessed on 8 July 2023).
- Blitz, J. Elements of Acoustics; Butterworths: London, UK, 1964. [Google Scholar]
- Chrobak, Ł.B.; Mali’nski, M.A. Comparison of the CRLC Models Describing the Helmholtz Type Cells for the Nondestructive Photoacoustic Spectroscopy. Metrol. Meas. Syst. 2014, 21, 545–552. [Google Scholar] [CrossRef]
- Liu, X.; Wu, H.; Dong, L. Methodology and applications of acousto-electric analogy in photoacoustic cell design for trace gas analysis. Photoacoustics 2023, 30, 100475. [Google Scholar] [CrossRef] [PubMed]
- Starecki, T. Comparative Analysis of the Helmholtz Cell Models Applied in PA Instruments (In Polish). Ph.D. Thesis, Warsaw University of Technology, Warsaw, Poland, 1994. [Google Scholar]
- Starecki, T. Loss-improved electroacoustical modeling of small Helmholtz resonators. J. Acoust. Soc. Am. 2007, 122, 2118–2123. [Google Scholar] [CrossRef] [PubMed]
- Benade, A.H. On the Propagation of Sound Waves in a Cylindrical Conduit. J. Acoust. Soc. Am. 1968, 44, 616–623. [Google Scholar] [CrossRef]
- Daniels, F.B. On the Propagation of Sound Waves in a Cylindrical Conduit. J. Acoust. Soc. Am. 1950, 22, 563–564. [Google Scholar] [CrossRef]
- Filament Easy PLA. Available online: https://fiberlogy.com/en/fiberlogy-filaments/filament-easy-pla/ (accessed on 16 December 2023).
- Original Prusa i3 MK3S+ 3D Printer. Available online: https://www.prusa3d.com/product/original-prusa-i3-mk3s-3d-printer-3/ (accessed on 16 December 2023).
- Function Generator DG1022Z. Available online: https://rigolshop.eu/products/waveform-generators/dg1000z/dg1022z.html (accessed on 16 December 2023).
- OSRAM SFH 4550 Datasheet. Available online: https://media.osram.info/media/resource/hires/osram-dam-5580407/SFH+4550_EN.pdf (accessed on 16 December 2023).
- Product Data: Multi-Field Microphone Type 4961. Available online: https://www.bksv.com/media/doc/bp2220.pdf (accessed on 16 December 2023).
- Product Data: 2-Channel CCLD Signal Conditioner for Production Testing Type 1704-C-102. Available online: https://www.bksv.com/media/doc/bp2384.pdf (accessed on 16 December 2023).
- Operation Manual: SR860 500 kHz DSP Lock-in Amplifier. Available online: https://www.thinksrs.com/downloads/pdfs/manuals/SR860m.pdf (accessed on 16 December 2023).
Figure 1.
Structure of a simple photoacoustic Helmholtz cell.

Figure 2.
Frequency response of a photoacoustic Helmholtz cell with the structure presented in Figure 1.
Figure 2.
Frequency response of a photoacoustic Helmholtz cell with the structure presented in Figure 1.

Figure 3.
Triple-cavity Helmholtz cells: (a) with differential signal detection [21], (b) with a side cavity [22].
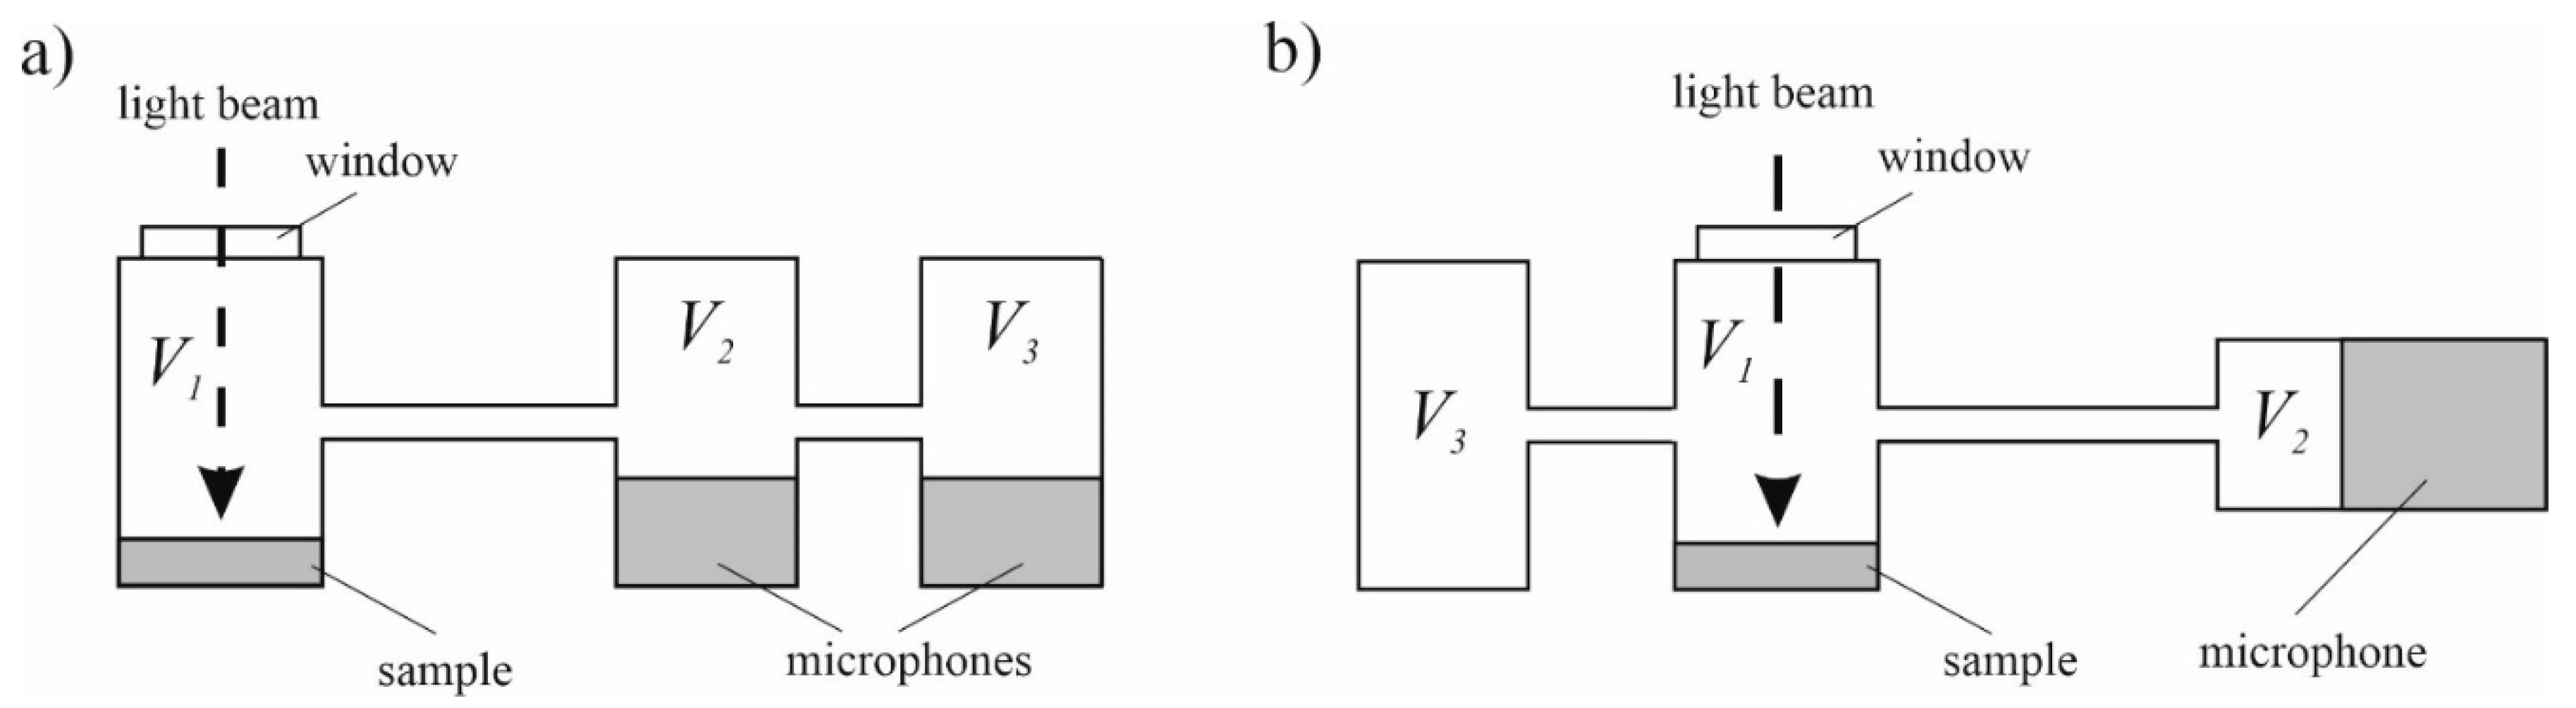
Figure 4.
Concept of four-cavity star-formed photoacoustic cells: (a) upper view, (b) cross-section view.
Figure 4.
Concept of four-cavity star-formed photoacoustic cells: (a) upper view, (b) cross-section view.

Figure 5.
Electric models of a simple, two-cavity photoacoustic Helmholtz cell, with different representations of the duct connecting the cavities: (a) duct modeled with lossy inductance; (b) duct modeled with a transmission line; (c) model with the transmission line substituted with an equivalent T-section with lumped impedances.

Figure 6.
Electric models of the four-cavity star-formed photoacoustic Helmholtz cells, with the central cavity used for photoacoustic excitation.
Figure 6.
Electric models of the four-cavity star-formed photoacoustic Helmholtz cells, with the central cavity used for photoacoustic excitation.

Figure 7.
Simulations of the frequency responses of the multi-cavity photoacoustic Helmholtz cells, the mechanical properties of which are given in Table 1: (a) cell #1; (b) cell #2.
Figure 7.
Simulations of the frequency responses of the multi-cavity photoacoustic Helmholtz cells, the mechanical properties of which are given in Table 1: (a) cell #1; (b) cell #2.

Figure 8.
Photo of a cell produced with 3D printing technology and used for experimental verification of the obtained simulation results. The photo also shows an LED driver PCB mounted over the central cavity, a microphone installed on the left side cavity, and dummy plugs filling the microphone holes in the remaining two microphone cavities.

Figure 9.
Experimental setup used for measurements of the cell properties: (a) block diagram; (b) photo of the system.
Figure 9.
Experimental setup used for measurements of the cell properties: (a) block diagram; (b) photo of the system.


Figure 10.
Measurement results of cell #1 compared with simulations: (a) frequency responses in cavity C1; (b) frequency responses in cavity C2; (c) frequency responses in cavity C3.
Figure 10.
Measurement results of cell #1 compared with simulations: (a) frequency responses in cavity C1; (b) frequency responses in cavity C2; (c) frequency responses in cavity C3.

Figure 11.
Measurement results of cell #2 compared with simulations: (a) frequency responses in cavity C1; (b) frequency responses in cavity C2; (c) frequency responses in cavity C3.
Figure 11.
Measurement results of cell #2 compared with simulations: (a) frequency responses in cavity C1; (b) frequency responses in cavity C2; (c) frequency responses in cavity C3.


Table 1.
Mechanical properties of the investigated cells.
| Cavity | Volume [cm3] | Duct | Length [mm] | Diameter [mm] | |
|---|---|---|---|---|---|
| C0 | 1.5 | ||||
| C1 | 1.5 | ||||
| C2 | 1.5 | ||||
| Cell #1 | C3 | 1.5 | |||
| D1 | 35 | 3.0 | |||
| D2 | 35 | 3.2 | |||
| D3 | 35 | 3.4 | |||
| C0 | 1.5 | ||||
| C1 | 1.5 | ||||
| C2 | 1.5 | ||||
| Cell #2 | C3 | 1.5 | |||
| D1 | 50 | 3.0 | |||
| D2 | 33 | 3.4 | |||
| D3 | 25 | 4.4 |
Disclaimer/Publisher’s Note: The statements, opinions and data contained in all publications are solely those of the individual author(s) and contributor(s) and not of MDPI and/or the editor(s). MDPI and/or the editor(s) disclaim responsibility for any injury to people or property resulting from any ideas, methods, instructions or products referred to in the content. |
© 2024 by the authors. Licensee MDPI, Basel, Switzerland. This article is an open access article distributed under the terms and conditions of the Creative Commons Attribution (CC BY) license (https://creativecommons.org/licenses/by/4.0/).
Share and Cite
MDPI and ACS Style
Porakowski, W.; Starecki, T. Shaping of the Frequency Response of Photoacoustic Cells with Multi-Cavity Structures. Electronics 2024, 13, 1786. https://doi.org/10.3390/electronics13091786
AMA Style
Porakowski W, Starecki T. Shaping of the Frequency Response of Photoacoustic Cells with Multi-Cavity Structures. Electronics. 2024; 13(9):1786. https://doi.org/10.3390/electronics13091786
Chicago/Turabian StylePorakowski, Wiktor, and Tomasz Starecki. 2024. "Shaping of the Frequency Response of Photoacoustic Cells with Multi-Cavity Structures" Electronics 13, no. 9: 1786. https://doi.org/10.3390/electronics13091786
Note that from the first issue of 2016, this journal uses article numbers instead of page numbers. See further details here.