
In Vivo and In Vitro Metabolic Fate and Urinary Detectability of Five Deschloroketamine Derivatives Studied by Means of Hyphenated Mass Spectrometry
 , ,
, ,
Abstract
:1. Introduction
2. Materials and Methods
2.1. Rat Urine Samples
2.2. Sample Preparations
2.2.1. Urine Conjugate Cleavage for the Identification of Phase I Metabolites by LC-HRMS/MS
2.2.2. Urine LLE for the Identification of Phase I Metabolites by LC-HRMS/MS
2.2.3. Urine SPE for the Identification of Phase I Metabolites by LC-HRMS/MS
2.2.4. Urine Precipitation for the Identification of Phase II Metabolites by LC-HRMS/MS
2.2.5. Urine SPE for the Identification of Phase II Metabolites by LC-HRMS/MS
2.2.6. Urine Sample Preparation Prior to GC-MS
2.3. Human In Vitro Incubations for the Conformation of In Vivo Rat Phase I Metabolites
2.4. LOI
2.4.1. LOI for Analysis by LC-HRMS/MS
2.4.2. LOI for Analysis by GC-MS
2.5. Detectability in Rat Urine Using SUSA
2.6. Human Urine Sample
2.7. LC-HRMS/MS Apparatus
2.8. GC-MS Apparatus
3. Results
3.1. Identification of In Vivo Phase I Metabolites Using LC-HRMS/MS
3.1.1. Higher-Energy Collisional Dissociation (HCD) Fragmentation Patterns of 2-Oxo-PCcP and Its Phase I Metabolites
3.1.2. HCD Fragmentation Patterns of 2-Oxo-PCE and Its Phase I Metabolites
3.1.3. HCD Fragmentation Patterns of 2-Oxo-PCiP and Its Phase I Metabolites
3.1.4. HCD Fragmentation Patterns of 2-Oxo-PCMe and Its Phase I Metabolites
3.1.5. HCD Fragmentation Patterns of 2-Oxo-PCPr and Its Phase I Metabolites
3.2. Identification of In Vivo Phase II Metabolites Using LC-HRMS/MS
3.2.1. HCD Fragmentation Patterns of Common Phase II Metabolites
3.2.2. HCD Fragmentation Patterns of 2-Oxo-PCiP Phase II Metabolites
3.2.3. HCD Fragmentation Patterns of 2-Oxo-PCMe Phase II Metabolites
3.2.4. HCD Fragmentation Patterns of 2-Oxo-PCPr Phase II Metabolites
3.3. Identification of Metabolites Using GC-MS
EI Fragmentation Patterns of Deschloroketamine Derivative and Their Metabolites
3.4. Confirmation of In Vivo Phase I Metabolites Using Human In Vitro Incubations
3.5. Proposed In Vivo Metabolic Pathways
3.5.1. 2-Oxo-PCcP

3.5.2. 2-Oxo-PCE
3.5.3. 2-Oxo-PCiP

3.5.4. 2-Oxo-PCMe
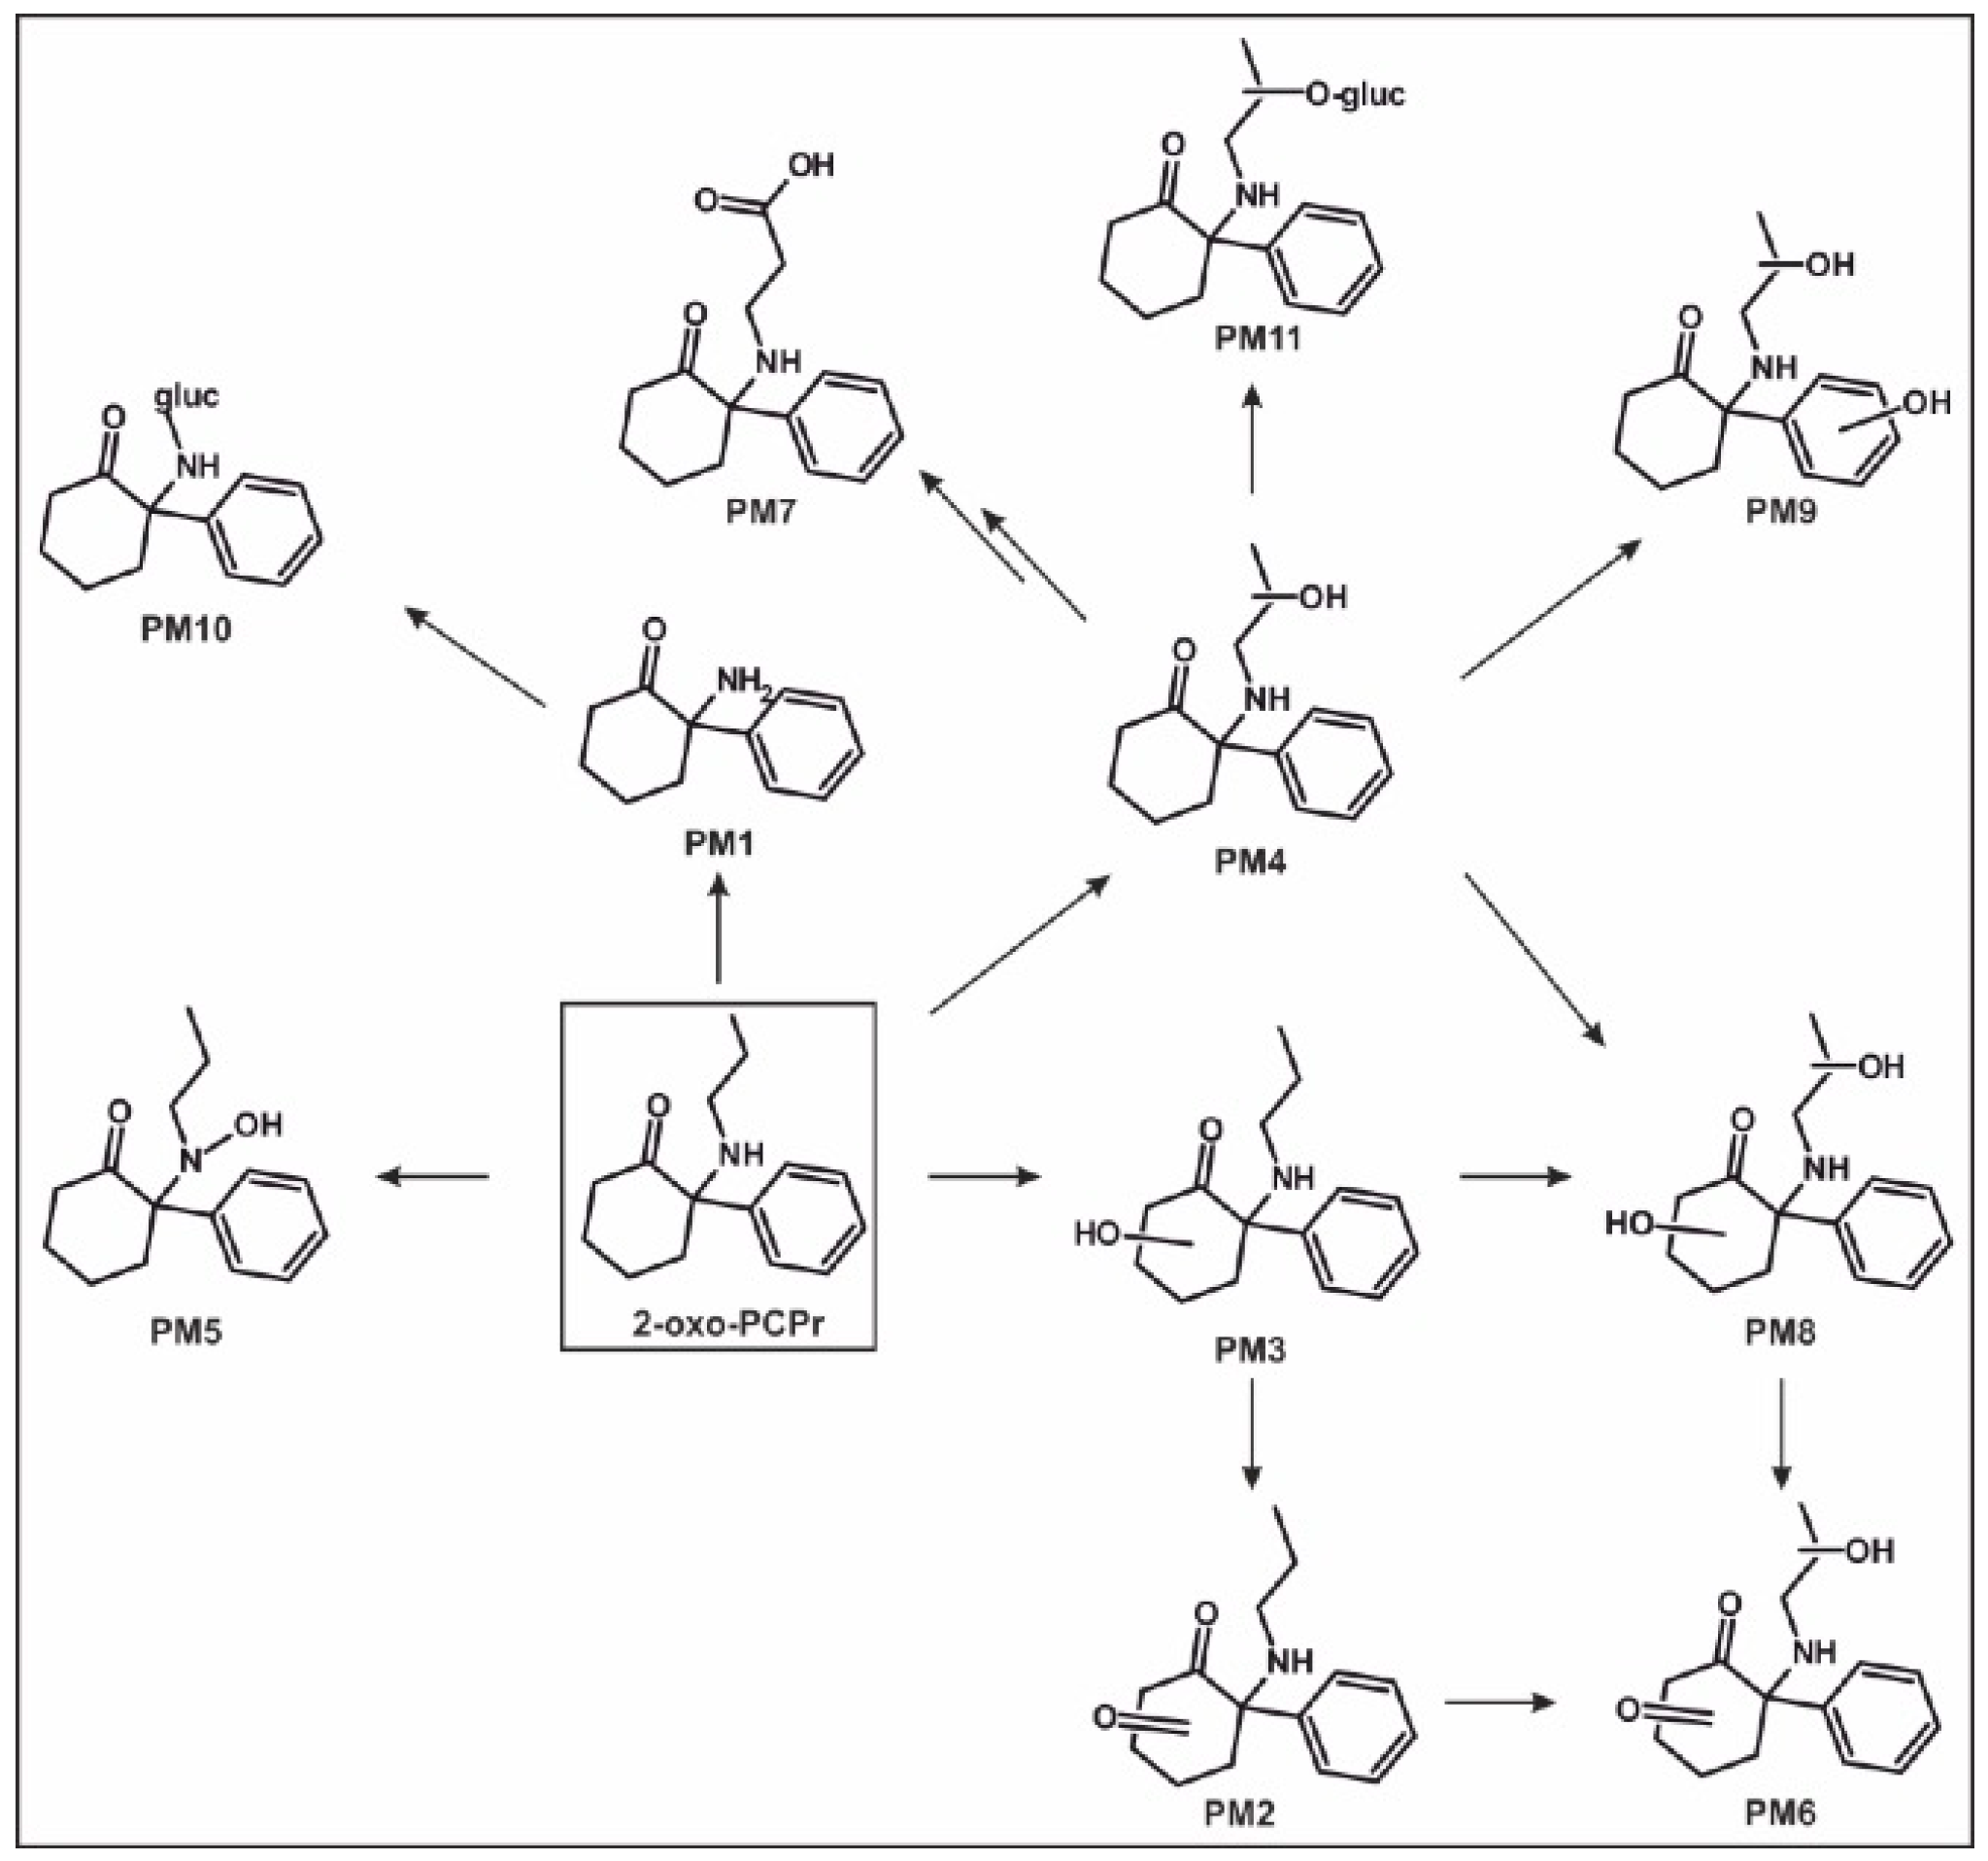
3.5.5. 2-Oxo-PCPr
3.6. LOI in Spiked Urine
3.7. Comparison of Different Sample Preparations and Their Detectability in Rat Urine
3.8. Toxicological Detectability Using SUSA
3.9. Analysis of a Human Urine Sample
4. Discussion
5. Conclusions
Supplementary Materials
Author Contributions
Funding
Institutional Review Board Statement
Informed Consent Statement
Data Availability Statement
Acknowledgments
Conflicts of Interest
List of Abbreviations
References
- EMCDDA. European Drug Report 2022; European Union: Lisbon, Portugal, 2022. [Google Scholar]
- EMCDDA. Other Drugs—The Current Situation in Europe; European Union: Lisbon, Portugal, 2023. [Google Scholar]
- WHO. 22nd Model List of Essential Medicines. 2021. Available online: https://www.who.int/publications/i/item/WHO-MHP-HPS-EML-2021.02 (accessed on 2 January 2024).
- Wallach, J.; Brandt, S.D. Phencyclidine-Based New Psychoactive Substances. Handb. Exp. Pharmacol. 2018, 252, 261–303. [Google Scholar] [PubMed]
- Marguilho, M.; Figueiredo, I.; Castro-Rodrigues, P. A Unified Model of Ketamine′s Dissociative and Psychedelic Properties. J. Psychopharmacol. 2023, 37, 14–32. [Google Scholar] [CrossRef]
- Pelletier, R.; Le Daré, B.; Le Bouëdec, D.; Kernalléguen, A.; Ferron, P.J.; Morel, I.; Gicquel, T. Arylcyclohexylamine Derivatives: Pharmacokinetic, Pharmacodynamic, Clinical and Forensic Aspects. Int. J. Mol. Sci. 2022, 23, 15574. [Google Scholar] [CrossRef] [PubMed]
- EMCDDA. Europol 2015 Annual Report on the Implementation of Council Decision 2005/387/Jha. 2015. Available online: https://www.emcdda.europa.eu/publications/implementation-reports/2015_en (accessed on 2 January 2024).
- EMCDDA. Europol 2016 Annual Report on the Implementation of Council Decision 2005/387/Jha. 2016. Available online: https://www.emcdda.europa.eu/system/files/publications/4724/TDAN17001ENN_PDFWEB.pdf (accessed on 2 January 2024).
- Stevens, L.C. Amino Ketones and Methods for Their Production. U.S. Patent 3,254,124, 31 May 1966. [Google Scholar]
- Hájková, K.; Jurásek, B.; Čejka, J.; Štefková, K.; Páleníček, T.; Sýkora, D.; Kuchař, M. Synthesis and Identification of Deschloroketamine Metabolites in Rats′ Urine and a Quantification Method for Deschloroketamine and Metabolites in Rats′ Serum and Brain Tissue Using Liquid Chromatography Tandem Mass Spectrometry. Drug Test. Anal. 2020, 12, 343–360. [Google Scholar] [CrossRef] [PubMed]
- Larabi, I.A.; Zerizer, F.; Ameline, A.; Etting, I.; Joseph, D.; Kintz, P.; Alvarez, J.C. Metabolic Profiling of Deschloro-N-Ethyl-Ketamine and Identification of New Target Metabolites in Urine and Hair Using Human Liver Microsomes and High-Resolution Accurate Mass Spectrometry. Drug Test. Anal. 2021, 13, 1108–1117. [Google Scholar] [CrossRef] [PubMed]
- Tang, M.H.; Chong, Y.; Chan, C.Y.; Ching, C.; Lai, C.; Li, Y.; Mak, T.W. Cluster of Acute Poisonings Associated with an Emerging Ketamine Analogue, 2-Oxo-Pce. Forensic Sci. Int. 2018, 290, 238–243. [Google Scholar] [CrossRef] [PubMed]
- Welter, J.; Meyer, M.R.; Wolf, E.; Weinmann, W.; Kavanagh, P.; Maurer, H.H. 2-Methiopropamine, a Thiophene Analogue of Methamphetamine: Studies on Its Metabolism and Detectability in the Rat and Human Using Gc-Ms and Lc-(Hr)-Ms Techniques. Anal. Bioanal. Chem. 2013, 405, 3125–3135. [Google Scholar] [CrossRef] [PubMed]
- Maurer, H.H.; Wissenbach, D.K.; Weber, A.A. Gc-Ms Library of Drugs, Poisons, and Their Metabolites, 6th ed.; Mass Spectral Library of Drugs, Poisons, Pesticides, Pollutants, and Their Metabolites 5th Edition Upgrade; Wiley-VCH: Weinheim, Germany, 2023. [Google Scholar]
- Wissenbach, D.K.; Meyer, M.R.; Remane, D.; Weber, A.A.; Maurer, H.H. Development of the First Metabolite-Based Lc-Ms(N) Urine Drug Screening Procedure-Exemplified for Antidepressants. Anal. Bioanal. Chem. 2011, 400, 79–88. [Google Scholar] [CrossRef] [PubMed]
- Meyer, M.R.; Du, P.; Schuster, F.; Maurer, H.H. Studies on the Metabolism of the Alpha-Pyrrolidinophenone Designer Drug Methylenedioxy-Pyrovalerone (Mdpv) in Rat and Human Urine and Human Liver Microsomes Using Gc-Ms and Lc-High-Resolution Ms and Its Detectability in Urine by Gc-Ms. J. Mass Spectrom. 2010, 45, 1426–1442. [Google Scholar] [CrossRef]
- Vollmer, A.C.; Wagmann, L.; Meyer, M.R. Toxic Plants-Detection of Colchicine in a Fast Systematic Clinical Toxicology Screening Using Liquid Chromatography-Mass Spectrometry. Drug Test. Anal. 2021, 14, 377–381. [Google Scholar] [CrossRef]
- Wagmann, L.; Frankenfeld, F.; Park, Y.M.; Herrmann, J.; Fischmann, S.; Westphal, F.; Müller, R.; Flockerzi, V.; Meyer, M.R. How to Study the Metabolism of New Psychoactive Substances for the Purpose of Toxicological Screenings-a Follow-up Study Comparing Pooled Human Liver S9, Heparg Cells, and Zebrafish Larvae. Front. Chem. 2020, 8, 539. [Google Scholar] [CrossRef]
- Wagmann, L.; Meyer, M.R.; Maurer, H.H. What Is the Contribution of Human FMO3 in the N-Oxygenation of Selected Therapeutic Drugs and Drugs of Abuse? Toxicol. Lett. 2016, 258, 55–70. [Google Scholar] [CrossRef]
- Maurer, H.H.; Meyer, M.R.; Helfer AGWeber, A.A. Maurer/Meyer/Helfer/Weber Mmhw Lc-Hr-Ms/Ms Library of Drugs, Poisons, and Their Metabolites; Wiley-VCH: Weinheim, Germany, 2018. [Google Scholar]
- Meyer, M.R.; Peters, F.T.; Maurer, H.H. Automated Mass Spectral Deconvolution and Identification System for Gc-Ms Screening for Drugs, Poisons, and Metabolites in Urine. Clin. Chem. 2010, 56, 575–584. [Google Scholar] [CrossRef] [PubMed]
- Wagmann, L.; Hempel, N.; Richter, L.H.; Brandt, S.D.; Stratford, A.; Meyer, M.R. Phenethylamine-Derived New Psychoactive Substances 2c-E-Fly, 2c-Ef-Fly, and 2c-T-7-Fly: Investigations on Their Metabolic Fate Including Isoenzyme Activities and Their Toxicological Detectability in Urine Screenings. Drug Test. Anal. 2019, 11, 1507–1521. [Google Scholar] [CrossRef] [PubMed]
- Helfer, A.G.; Michely, J.A.; Weber, A.A.; Meyer, M.R.; Maurer, H.H. Orbitrap Technology for Comprehensive Metabolite-Based Liquid Chromatographic-High Resolution-Tandem Mass Spectrometric Urine Drug Screening—Exemplified for Cardiovascular Drugs. Anal. Chim. Acta 2015, 891, 221–233. [Google Scholar] [CrossRef]
- Richter, M.J.; Wagmann, L.; Gampfer, T.M.; Brandt, S.D.; Meyer, M.R. In Vitro Metabolic Fate of the Synthetic Cannabinoid Receptor Agonists Qmpsb and Qmpcb (Sgt-11) Including Isozyme Mapping and Esterase Activity. Metabolites 2021, 11, 509. [Google Scholar] [CrossRef]
- Caspar, A.T.; Gaab, J.B.; Michely, J.A.; Brandt, S.D.; Meyer, M.R.; Maurer, H.H. Metabolism of the Tryptamine-Derived New Psychoactive Substances 5-Meo-2-Me-Dalt, 5-Meo-2-Me-Alcht, and 5-Meo-2-Me-Dipt and Their Detectability in Urine Studied by Gc-Ms, Lc-Ms(N), and Lc-Hr-Ms/Ms. Drug Test. Anal. 2018, 10, 184–195. [Google Scholar] [CrossRef] [PubMed]
- Carmo, H.; Hengstler, J.G.; de Boer, D.; Ringel, M.; Remião, F.; Carvalho, F.; Fernandes, E.; dos Reys, L.A.; Oesch, F.; Bastos, M.D.L. Metabolic Pathways of 4-Bromo-2,5-Dimethoxyphenethylamine (2c-B): Analysis of Phase I Metabolism with Hepatocytes of Six Species Including Human. Toxicology 2005, 206, 75–89. [Google Scholar] [CrossRef]
- Erowid. Erowid Experience Vaults. Available online: https://erowid.org/experiences/ (accessed on 2 January 2024).
- Tanaka, R.; Kawamura, M.; Mizutani, S.; Hakamatsuka, T.; Kikura-Hanajiri, R. Identification of Three Arylcyclohexylamines (Mxpr, Mxipr, and Dmxe) in Illegal Products. Yakugaku Zasshi J. Pharm. Soc. Jpn. 2022, 142, 675–681. [Google Scholar] [CrossRef]
- Goncalves, R.; Castaing, N.; Richeval, C.; Ducint, D.; Titier, K.; Morvan, E.; Grélard, A.; Loquet, A.; Molimard, M. Methoxpropamine (Mxpr) in Powder, Urine and Hair Samples: Analytical Characterization and Metabolite Identification of a New Threat. Forensic Sci. Int. 2022, 333, 111215. [Google Scholar] [CrossRef]
- Baselt, R.C. Disposition of Toxic Drugs and Chemicals in Man, 11th ed.; Biomedical Publications: Seal Beach, CA, USA, 2017. [Google Scholar]
- Gomila, I.; Leciñena, M.Á.; Elorza, M.Á.; Pastor, Y.; Sahuquillo, L.; Servera, M.; Puiguriguer, J.; Barcelo, B. Detectability of Dissociative Psychoactive Substances in Urine by Five Commercial Phencyclidine Immunoassays. J. Anal. Toxicol. 2019, 43, 497–503. [Google Scholar] [CrossRef] [PubMed]


| Metabolite ID | Metabolic Reaction | Exact Mass of PI, m/z | RT, min | Absolute Peak Area | Yield, % |
|---|---|---|---|---|---|
| CM1 | N-Dealkylation | 230.1539 | 5.70 | 4.88 × 10⁸ | 34 |
| CM5 | N-Dealkylation + glucuronidation | 366.1547 | 5.35 | 9.38 × 10⁸ | 66 |
| 2-Oxo-PCE | Parent compound | 218.1539 | 5.44 | 1.31 × 10⁸ | - |
| EM1 | N-Dealkylation | 190.1226 | 5.04 | 6.47 × 10⁸ | 34 |
| EM2 | Hydroxylation + oxidation to a ketone | 232.1332 | 4.75 | 3.06 × 10⁸ | 16 |
| EM3 | Hydroxylation isomer 1 | 234.1489 | 4.11 | 1.41 × 10⁸ | 7 |
| EM5 | N-Dealkylation + glucuronidation | 366.1547 | 5.20 | 8.21 × 10⁸ | 43 |
| IM1 | N-Dealkylation | 190.1226 | 5.03 | 3.13 × 10⁷ | 4 |
| IM3 | Hydroxylation isomer 1 + oxidation to a ketone | 246.1489 | 5.22 | 1.92 × 10⁸ | 27 |
| IM8 | N-Dealkylation + glucuronidation | 366.1547 | 5.22 | 4.32 × 10⁸ | 60 |
| IM9 | Hydroxylation isomer 3 + glucuronidation | 424.1966 | 5.24 | 6.51 × 10⁷ | 9 |
| 2-Oxo-PCMe | Parent compound | 204.1483 | 5.10 | 1.39 × 10⁸ | - |
| MM1 | N-Dealkylation | 190.1226 | 5.00 | 6.86 × 10⁸ | 36 |
| MM3 | N-Dealkylation + hydroxylamine | 206.1176 | 5.61 | 9.25 × 10⁶ | 1 |
| MM8 | N-Dealkylation + glucuronidation | 366.1547 | 5.25 | 1.17 × 10⁹ | 63 |
| 2-Oxo-PCPr | Parent compound | 232.1969 | 5.96 | 1.90 × 10⁷ | - |
| PM1 | N-Dealkylation | 190.1226 | 5.05 | 2.05 × 10⁸ | 9 |
| PM2 | Hydroxylation isomer 1 + oxidation to a ketone | 246.1489 | 5.37 | 3.68 × 10⁸ | 14 |
| PM6 | Dihydroxylation isomer 1 + oxidation to a ketone | 262.1438 | 4.85 | 5.67 × 10⁷ | 2 |
| PM7 | Hydroxylation isomer 2 + oxidation to carboxylic acid | 262.1438 | 5.31 | 8.91 × 10⁸ | 35 |
| PM8 | Dihydroxylation isomer 1 | 264.1594 | 4.61 | 2.65 × 10⁷ | 1 |
| PM9 | Dihydroxylation isomer 2 | 264.1594 | 5.09 | 1.50 × 10⁸ | 6 |
| PM10 | N-Dealkylation + glucuronidation | 366.1547 | 5.29 | 2.33 × 10⁸ | 9 |
| PM11 | Hydroxylation + glucuronidation | 424.1966 | 5.24 | 6.23 × 10⁸ | 24 |
| Metabolite | PI Mass, m/z | RI | Elemental Composition | Characteristic FI |
|---|---|---|---|---|
| 2-Oxo-PCcP N-dealkyl AC | 231 | 1874 | C14H17NO2 | 188, 174, 144, 132, 104, 91 |
| 2-Oxo-PCE N-dealkyl AC | 231 | 1874 | C14H17NO2 | 188, 174, 144, 132, 104, 91 |
| 2-Oxo-PCiP N-dealkyl AC | 231 | 1874 | C14H17NO2 | 188, 174, 144, 132, 104, 91 |
| 2-Oxo-PCMe N-dealkyl AC | 231 | 1874 | C14H17NO2 | 188, 174, 144, 132, 104, 91 |
| 2-Oxo-PCPr N-dealkyl AC | 231 | 1874 | C14H17NO2 | 188, 174, 144, 132, 104, 91 |
Disclaimer/Publisher’s Note: The statements, opinions and data contained in all publications are solely those of the individual author(s) and contributor(s) and not of MDPI and/or the editor(s). MDPI and/or the editor(s) disclaim responsibility for any injury to people or property resulting from any ideas, methods, instructions or products referred to in the content. |
© 2024 by the authors. Licensee MDPI, Basel, Switzerland. This article is an open access article distributed under the terms and conditions of the Creative Commons Attribution (CC BY) license (https://creativecommons.org/licenses/by/4.0/).
Share and Cite
Frankenfeld, F.; Wagmann, L.; Abelian, A.; Wallach, J.; Adejare, A.; Brandt, S.D.; Meyer, M.R. In Vivo and In Vitro Metabolic Fate and Urinary Detectability of Five Deschloroketamine Derivatives Studied by Means of Hyphenated Mass Spectrometry. Metabolites 2024, 14, 270. https://doi.org/10.3390/metabo14050270
Frankenfeld F, Wagmann L, Abelian A, Wallach J, Adejare A, Brandt SD, Meyer MR. In Vivo and In Vitro Metabolic Fate and Urinary Detectability of Five Deschloroketamine Derivatives Studied by Means of Hyphenated Mass Spectrometry. Metabolites. 2024; 14(5):270. https://doi.org/10.3390/metabo14050270
Chicago/Turabian StyleFrankenfeld, Fabian, Lea Wagmann, Anush Abelian, Jason Wallach, Adeboye Adejare, Simon D. Brandt, and Markus R. Meyer. 2024. "In Vivo and In Vitro Metabolic Fate and Urinary Detectability of Five Deschloroketamine Derivatives Studied by Means of Hyphenated Mass Spectrometry" Metabolites 14, no. 5: 270. https://doi.org/10.3390/metabo14050270