Article

Numerical Study of PBX 9501 Explosive Combustion Process in Confined Space

1
Institute of Systems Engineering, China Academy of Engineering Physics, Mianyang 621999, China
2
State Key Laboratory of Multiphase Flow in Power Engineering, Xi’an Jiaotong University, Xi’an 710049, China
*
Author to whom correspondence should be addressed.
Processes 2023, 11(7), 2056; https://doi.org/10.3390/pr11072056
Submission received: 16 May 2023 / Revised: 25 June 2023 / Accepted: 6 July 2023 / Published: 10 July 2023

Abstract

:
Explosives combustion is primarily classified into conductive and convective combustion. In situations where confinement is sufficiently strong, the instantaneous high pressure generated by convective combustion in cracks can cause rapid fragmentation of the explosive matrix, resulting in a significant increase in the combustion surface area and triggering a high-intensity reaction with potentially catastrophic consequences. Therefore, the study of convective combustion in cracks is crucial for ensuring the safety of weapons and explosives. Previous simulation studies have primarily used finite element analysis software, which has excellent performance in handling explosive detonation processes. However, its accuracy in describing gas behavior between explosives and constrained containers is limited. This study divides the combustion process of a pre-cracked explosive in a confined space into four stages based on reasonable assumptions and simplifications. We developed a simulation method that combines the Arrhenius formula with the MWSD model to model the combustion rate of the explosive. By introducing a correction coefficient, Con, to the Arrhenius formula, the formula and MWSD model control the first and third stages of explosive combustion, respectively, while smoothly transitioning during the second stage. We used this method to numerically simulate the experimental results of Shang Hailin et al. on a crack width of 50 μm. The simulation results include the temperature field and pressure field of the first three stages of explosive combustion and the pressure rise curve of the pressure measurement point at the same location, as in the experiment. The simulation results are consistent with the experimental results.

1. Introduction

The combustion and evolution characteristics of explosives are crucial for studying their response behavior in accidental ignition scenarios. Different explosives exhibit distinct combustion properties, and their propagation rates can range from only a few millimeters per second, similar to stable combustion in propellants, to high-speed detonation. These rates depend on factors such as combustion pressure, explosive porosity, and constraint strength. Gaining a comprehensive understanding of the combustion behavior of explosives is vital to ensuring the safety and reliability of their applications [1,2,3].
The combustion mode of explosives is mainly divided into conductive combustion and convective combustion [4]. Conductive combustion refers to the combustion of explosives caused by thermal conduction. During the process of conductive combustion, energy is mainly transferred between reactants and unreacted materials through thermal conduction, and the combustion advances layer by layer from the surface of the explosive to its interior, with a relatively slow propagation speed [5]. Under specific conditions (temperature, pressure, and confinement), combustion can penetrate into the internal voids or cracks of the explosive, and the propagation speed of this combustion mode significantly increases due to the convective effect of the high-temperature gas on the surface of the explosive crack, which is usually referred to as convective combustion [6]. In the case of sufficient confinement, the instantaneous high pressure generated by convective combustion in the crack can cause rapid fragmentation of the explosive matrix, leading to a significant increase in the combustion surface area, which may result in a high-intensity reaction or even transition to detonation, causing catastrophic consequences. Therefore, the study of convective combustion in cracks is crucial for the safety of weapon charges [7,8].
Dickson et al. [9,10] discovered the relationship between crack damage and reaction in explosive materials using cook-off experiments. The research showed that thermally damaged explosives can form multiple cracks when ignited under confinement, thereby increasing the reactive surface area and leading to violent chemical reactions, even detonation-to-detonation transition (DDT). Jackson et al. [11] and Berghout et al. [12,13] studied the combustion evolution process of pre-existing cracks in explosives by joining two elongated explosive bars together. They conducted experimental research on pre-existing cracks with a width (w) of 80 μm and lengths (L) of 4.06 cm and 19.1 cm, respectively. The results showed that the length-to-width ratio had a significant impact on the intensity of combustion reactions: as the length-to-width ratio increased from L/w = 508 for short cracks to L/w = 2388 for long cracks, the maximum pressure in the crack before constraint release increased from 15 MPa to 700 MPa, and the flame propagation speed increased from 60 m/s to over 1500 m/s. Jackson et al. [14] developed a simplified model to predict the critical conditions for the occurrence of uncontrolled reactions in high-energy explosive fissures (used to simulate cracks in explosives) based on predicting the fissure pressure increase using aerodynamic clogging at the fissure opening. The predicted results were consistent with the results of the strongly constrained, high-aspect-ratio crack combustion experiments conducted by Berghout et al. [15]. Recently, Shang et al. [5] conducted experimental observations on the combustion evolution process of the Ottojiniki JO 9159 bonded explosive in pre-existing cracks of different widths, obtaining the propagation speed of the combustion wavefront and the pressure rise curve at different measuring points in cracks of different widths.
The combustion evolution in narrow cracks of explosives involves many complex physical, chemical, and flow problems. Although some experimental studies have been conducted to obtain some evolutionary rules, the cost of conducting explosive detonation experiments is high, and large-scale experiments are difficult to conduct. Therefore, numerical simulation methods are crucial for investigating the combustion evolution characteristics of explosives. Finite element analysis software has been mainly used in previous simulation works, and such software has superior performance in modeling explosive detonation processes, but its description of gas behavior between explosives and confinement containers is not accurate. In this paper, the experiments of Shang Hailin et al. [5] were numerically simulated based on reasonable assumptions and simplifications, and a numerical simulation method was developed that can accurately describe the pressure increase process in pre-existing cracks.

2. Methodology

2.1. Combustion Rate Model

The process of PBX 9501 explosive being ignited and burned by black powder in a confined space is the research object of chemical reaction kinetics used in this study. On the basis of relevant studies [4], this study provides a detailed description of the combustion process of the explosive within a confined space, and divides the process into four stages, which are as follows:
  • Ignition stage of black powder. At this stage, the high-temperature gas produced by the combustion of black powder in the ignition chamber enters the crack, and the contact time between the surface of the explosive and the high-temperature combustion product produced by the combustion of black powder is short, so the combustion reaction of the explosive has not occurred.
  • Phase of convection combustion and crack growth. The hot gas generated by the burning black powder propagates into the middle of the crack, initiating the combustion of a portion of the explosive near the ignition chamber. As the burning progresses, the explosive undergoes crack formation, allowing the high-temperature product gas to enter the crack, expanding the combustion surface area.
  • The stage of rapid pressure rise. The continuous combustion of the upper and lower surface of the crack leads to increasing pressure inside the crack. When the pressure near the open end exceeds the pressure inside the ignition chamber, the product gas inside the crack flows into the ignition chamber through the open end. As the crack pressure continues to rise, the outlet’s flow velocity also increases.
  • Restrain the shell breaking and pressure unloading stage. This stage is not within the research scope of this paper and will not be discussed in this paper.
Based on the above analysis of the physical processes, it is concluded that the pressure has not yet reached a sufficient level to cause large cracks in the charge column when the explosive is just ignited, and the reaction mainly occurs on the outer surface of the charge column, which is mainly controlled by temperature. When the explosive reaction reaches a certain degree and the pressure reaches a certain magnitude, crack propagation occurs throughout the entirety of the charge column, and the high-temperature and high-pressure gas penetrate into the cracks, resulting in an expansion of the combustion surface area. The reaction at this stage is mainly controlled by pressure.
Therefore, for the first stage, we believe that the combustion reaction process of solid explosive includes the thermal decomposition of solid explosive. During this phase, the pyrolysis rate follows the Arrhenius equation and exhibits a positive correlation with the amount of remaining explosive within the current unit. Therefore, the combustion model based on the Arrhenius equation is used to simulate the combustion of explosives in the first stage, and the pressure and temperature rise in the fluid domain are controlled by chemical reaction. The Arrhenius equation is described in exponential form [16]:
r = C o n ρ Z e E R T
where r is the reaction rate expressed in kg/s; Z is the former factor, also known as Arrhenius’s constant; Con is the correction coefficient; r is the density of black powder; and E is the activation energy of the reaction, which can be generally regarded as a constant independent of temperature and has the unit J/mol. T is the absolute temperature in K; R is the molar gas constant in J/(mol·K); and e is the base of the natural logarithm.
In order to realize the coupling control of the two models, it is necessary to add a Con value to modify the Arrhenius formula. When the surface temperature of the explosive and black powder is low, the combustion reaction is in the first stage. The combustion rate in this stage mainly depends on the intrinsic properties of explosive and is significantly influenced by temperature. When the surface temperature of the explosive and black powder is high, the combustion reaction is in the third stage. The combustion rate in this stage is mainly determined by the self-reinforcing mechanism of explosive crack growth and is greatly affected by pressure. Therefore, we assume a correction coefficient Con with the following characteristics: Con maintains a high value when the temperature is lower than the ignition temperature of the explosive at 700 K. It transitions smoothly between 700 K and 1700 K, and then transitions to a low value at 1700 K. In a word, the Arrhenius’ formula works only in the first and second stages, and in the third stage, the Arrhenius’ formula makes a negligible contribution to the reaction rate. The value of correction coefficient Con changes with temperature, as shown in Figure 1.
As the third stage involves the process of rapid combustion and deflation to detonation of the PBX 9501 explosive, the finite rate reaction model used in conventional combustion simulation cannot easily capture the rapid pressure rise required at this stage. Therefore, for this stage, this study adopts the method that does not consider components, and the reaction rate is only affected by pressure. We select the modified Wescott–Stewart–Davis model (MWSD) [17] for PBX 9501 to describe the rapid rise in pressure in the process of explosive deflation to detonation. The specific equation for the reaction rate equation is as follows:
D λ D t = r , r = k p n ( 1 λ ) v
where r is the reaction rate expressed in Kg/s; p is the pressure in a confined space expressed in Pa; and λ is the degree of reactivity indicating the degree of reaction of the explosive. Based on the fitting method of merit function [18], the velocity parameters k, n and ν are calibrated to reproduce the detonation thickness effect and front shape data of two-dimensional plate geometry, where k = 0.0036010 s·GPa−n, n = 3.0, and ν = 0.76781. This formula has been fully verified in the literature, and has excellent performance in describing the combustion process of PBX 9501. Compared with previous empirical formulas, this formula can significantly improve the calculation accuracy.

2.2. Turbulence Model

Turbulence is a very widespread phenomenon in the process of fluid flow, especially with the combustion reaction, resulting in significant pressure and temperature changes. These changes result in irregular flow of the surrounding fluid, and thus, accurate turbulence calculations are crucial. Engineering applications pay more attention to the influence of turbulence on the average flow field and the overall trend. Thus, a calculation method is developed to solve the equation of the time of average momentum and an approximate model is used to solve the instantaneous pulsation quantity. This method is called the Reynolds average method. The SST k-ω model is chosen as the turbulence model in the calculation process. The SST k-ω model has more advantages in describing the wall-bound flow. Compared with the standard k-ω model, the SST k-ω model incorporates the cross diffusion from the omega equation and considers the propagation of the turbulent shear force. F1 is introduced to switch k-ω and k-ε models at units with different distances from the wall, which is more advantageous in the description of turbulence near the wall, and the restriction of turbulence viscosity is introduced.

2.3. Geometric Structure and Grid

In this section, a literature data simulation is carried out for the established calculation model, and the experimental data pressure curve and the flame tip propagation trend chart taken by high-speed camera are compared to verify the reliability and accuracy of the model. The experiments verified here are from the study of Shang Hailin et al. [5], and the experimental setup is shown in Figure 2. According to the experimental device size and structural form in the literature, this study draws the grid structure as shown in Figure 3. It is worth noting that since the solid pressure is not solved in our method, the explosive part is not drawn in the grid structure and only the expansion of the crack is used to represent the retreat of the explosive surface.
Observing the experimental structure, it can be seen that there is a pressure sensor behind the experimental sample. In order to better fit the experimental situation, the possible volume occupied by the sensor in the actual experiment is added behind the crack of the sample in the grid structure. The possible volume occupied by the sensor in this part is 0.65 mm × 0.4 mm × 200 mm. In addition, considering the existence of an ignition device in the ignition chamber, the connection between this part of the device and the wall of the container is not rigid, and compared with other parts of the container, the air tightness is relatively low, which is likely to lead to a decrease in the tightness of the container in the re-experiment process. Therefore, when the grid structure is established, an air spillway simulation test device is set in the ignition chamber. The problem of gas leakage is caused by poor sealing. It is worth noting that in this study, the grid of the explosive was not established, and only the grid of the fluid domain was established. The dynamic mesh on the contact surface between the explosive and the fluid domain was used to simulate the consumption of solid explosives, and a source term was added to the surface to simulate the combustion products of the explosive.

2.4. Simulation Set-Ups

Due to the fact that the simulation time in this study is on the millisecond level and the intense heat release during explosive combustion, the heat transfer between the fluid domain and the external air is ignored and all the walls are subjected to adiabatic boundary conditions. In addition, the explosive is a combination of oxidant and dye, and no additional oxidant is required. The gas composition in the fluid domain has little influence on the simulation results, so the initial condition in the fluid domain is air at normal temperature and pressure. The thermal properties of PBX 9501 explosive are taken from reference [19].

2.5. UDF Specification

Based on the Arrhenius formula and MWSD model, a UDF (user-defined functions) is developed to describe the combustion process of the PBX 9501 explosive in a confined space. Compared with the empirical formula based on pressure and reactivity generally used, this control method reduces the dependence on the accuracy of empirical formula parameters, and is closer to the real explosive combustion process, which is conducive to improving the authenticity of the simulation.
The UDF in this study mainly realizes two functions: the interface retreat of black powder and PBX 9501 explosive, and the control of the burning rate of black powder and PBX 9501 explosive. Since both the black powder and PBX 9501 explosive are solid substances, their volumes decrease during combustion. However, in this study, the volume of reactants is small, and we mainly focus on the behavior of the product gas in the basin after the explosive reaction. Therefore, this paper assumes that both the powder explosive and PBX 9501 explosives are consumed in such a way that the surface of the explosive in contact with the fluid domain recedes in a certain direction, where the direction of the retreat is perpendicular to the surface of the explosive in contact with the fluid domain and points to the explosive itself. In order to characterize such interface retreat, Dynamic Mesh technology was used in this study; that is, the movement of grid nodes on the explosive surface was controlled. The mesh nodes on the surface where explosives come into contact with the fluid domain move according to the aforementioned direction of movement, and the movement distance is calculated based on the consumption of explosives. The macro function called DEFINE_GRID_MOTION was used to obtain the position of grid nodes on the explosive surface, and the movement of nodes on the explosive surface was controlled by the following formula:
d z = d m a s s T A ρ
where dz is the movement distance of a grid node on the explosive combustion surface in a time step, and its moving direction is set by the UDF, so dz here only distinguishes between positive and negative. dmass is the explosive mass consumed by a grid surface on the combustion surface in a time step, which is calculated by the above-mentioned reaction rate model.

3. Results and Discussion

In the convective combustion of explosives with prefabricated cracks, phase I mainly involves the backward movement of the combustion surface of black powder after combustion and the propagation of high-temperature and high-pressure products along the prefabricated cracks. The ignition of black powder is realized by patching a high-temperature surface of 700 K. The whole process starts from 0 ms and ends at 3.8 ms. The regression of the black powder combustion surface within 3.8 ms is shown in Figure 4. Since the temperature and pressure in the cracks in this process are relatively low, we believe that the explosive has not been completely ignited. Therefore, the combustion process before 0.38 ms is not described in detail in this paper. This paper mainly describes the rapid pressurization process of the explosive from surface combustion to crack propagation after the end of black powder combustion.

3.1. Comparative Analysis of Temperature Field

Figure 5 shows the comparison between the cloud images of temperature distribution at different times in the simulation results and the digital photos of flame propagation in the experimental study. The temperature distribution contour at different times more clearly shows the combustion propagation trend in the simulation, and the high-temperature propagation trend in this temperature contour is highly consistent with the flame tip propagation trend photographed experiment reported in the literature. At 3.8 ms, the high-temperature gas produced by the combustion of black powder has spread to the middle part of the crack. At this time, the explosive at the entrance of the crack, which has the longest contact time with the high-temperature gas, first produces surface combustion, resulting in high-temperature combustion products. The surface combustion propagates from the entrance of the crack to the bottom of the crack, and the maximum temperature in the crack also increases. At the same time, as shown in Figure 6, when the reaction reaches 5.6 ms, the phenomenon described in the literature of high-temperature gas in the crack flowing into the ignition cavity from the crack entrance can be clearly observed.
It is important to note that in the simulation, with a duration on the order of milliseconds, the fluid domain within the crack is considered, along with the presence of two layers of explosive and walls. Given these conditions, we assume that heat transfer between the fluid domain and the external environment is negligible during the simulation, and thus, we apply adiabatic boundary conditions. It should be acknowledged that the use of adiabatic boundaries in the calculations may lead to an increase in the maximum temperature achievable in the simulation, resulting in the generation of non-physical high temperatures. Therefore, the specific temperature values are not of primary concern. Instead, the focus lies on the overall temperature distribution and the trends within the fluid domain.

3.2. Comparative Analysis of Pressure Field

Since each cloud image in Figure 7 uses the same legend, and the pressure range of the legend is relatively large, ranging from 0.1 MPa to 280 MPa, it can be seen from the cloud image of pressure distribution that the rising speed of pressure presents an obvious exponential trend. The pressure before 5.1 ms is basically below 28.1 MPa, indicating that the explosive has not been completely ignited inside. The cracks have not yet expanded enough for the high-temperature and high-pressure gas to penetrate. From 5.3 ms, the pressure in the crack begins to rise rapidly. From 5.3 ms to 5.6 ms, the pressure in the crack increases from about 50 MPa to about 250 MPa, indicating that about 5.3 ms is the critical time for crack propagation to the smooth flow of high-temperature and high-pressure gas. After this critical time, the third stage is formally entered, that is, the stage of rapid pressure rises.
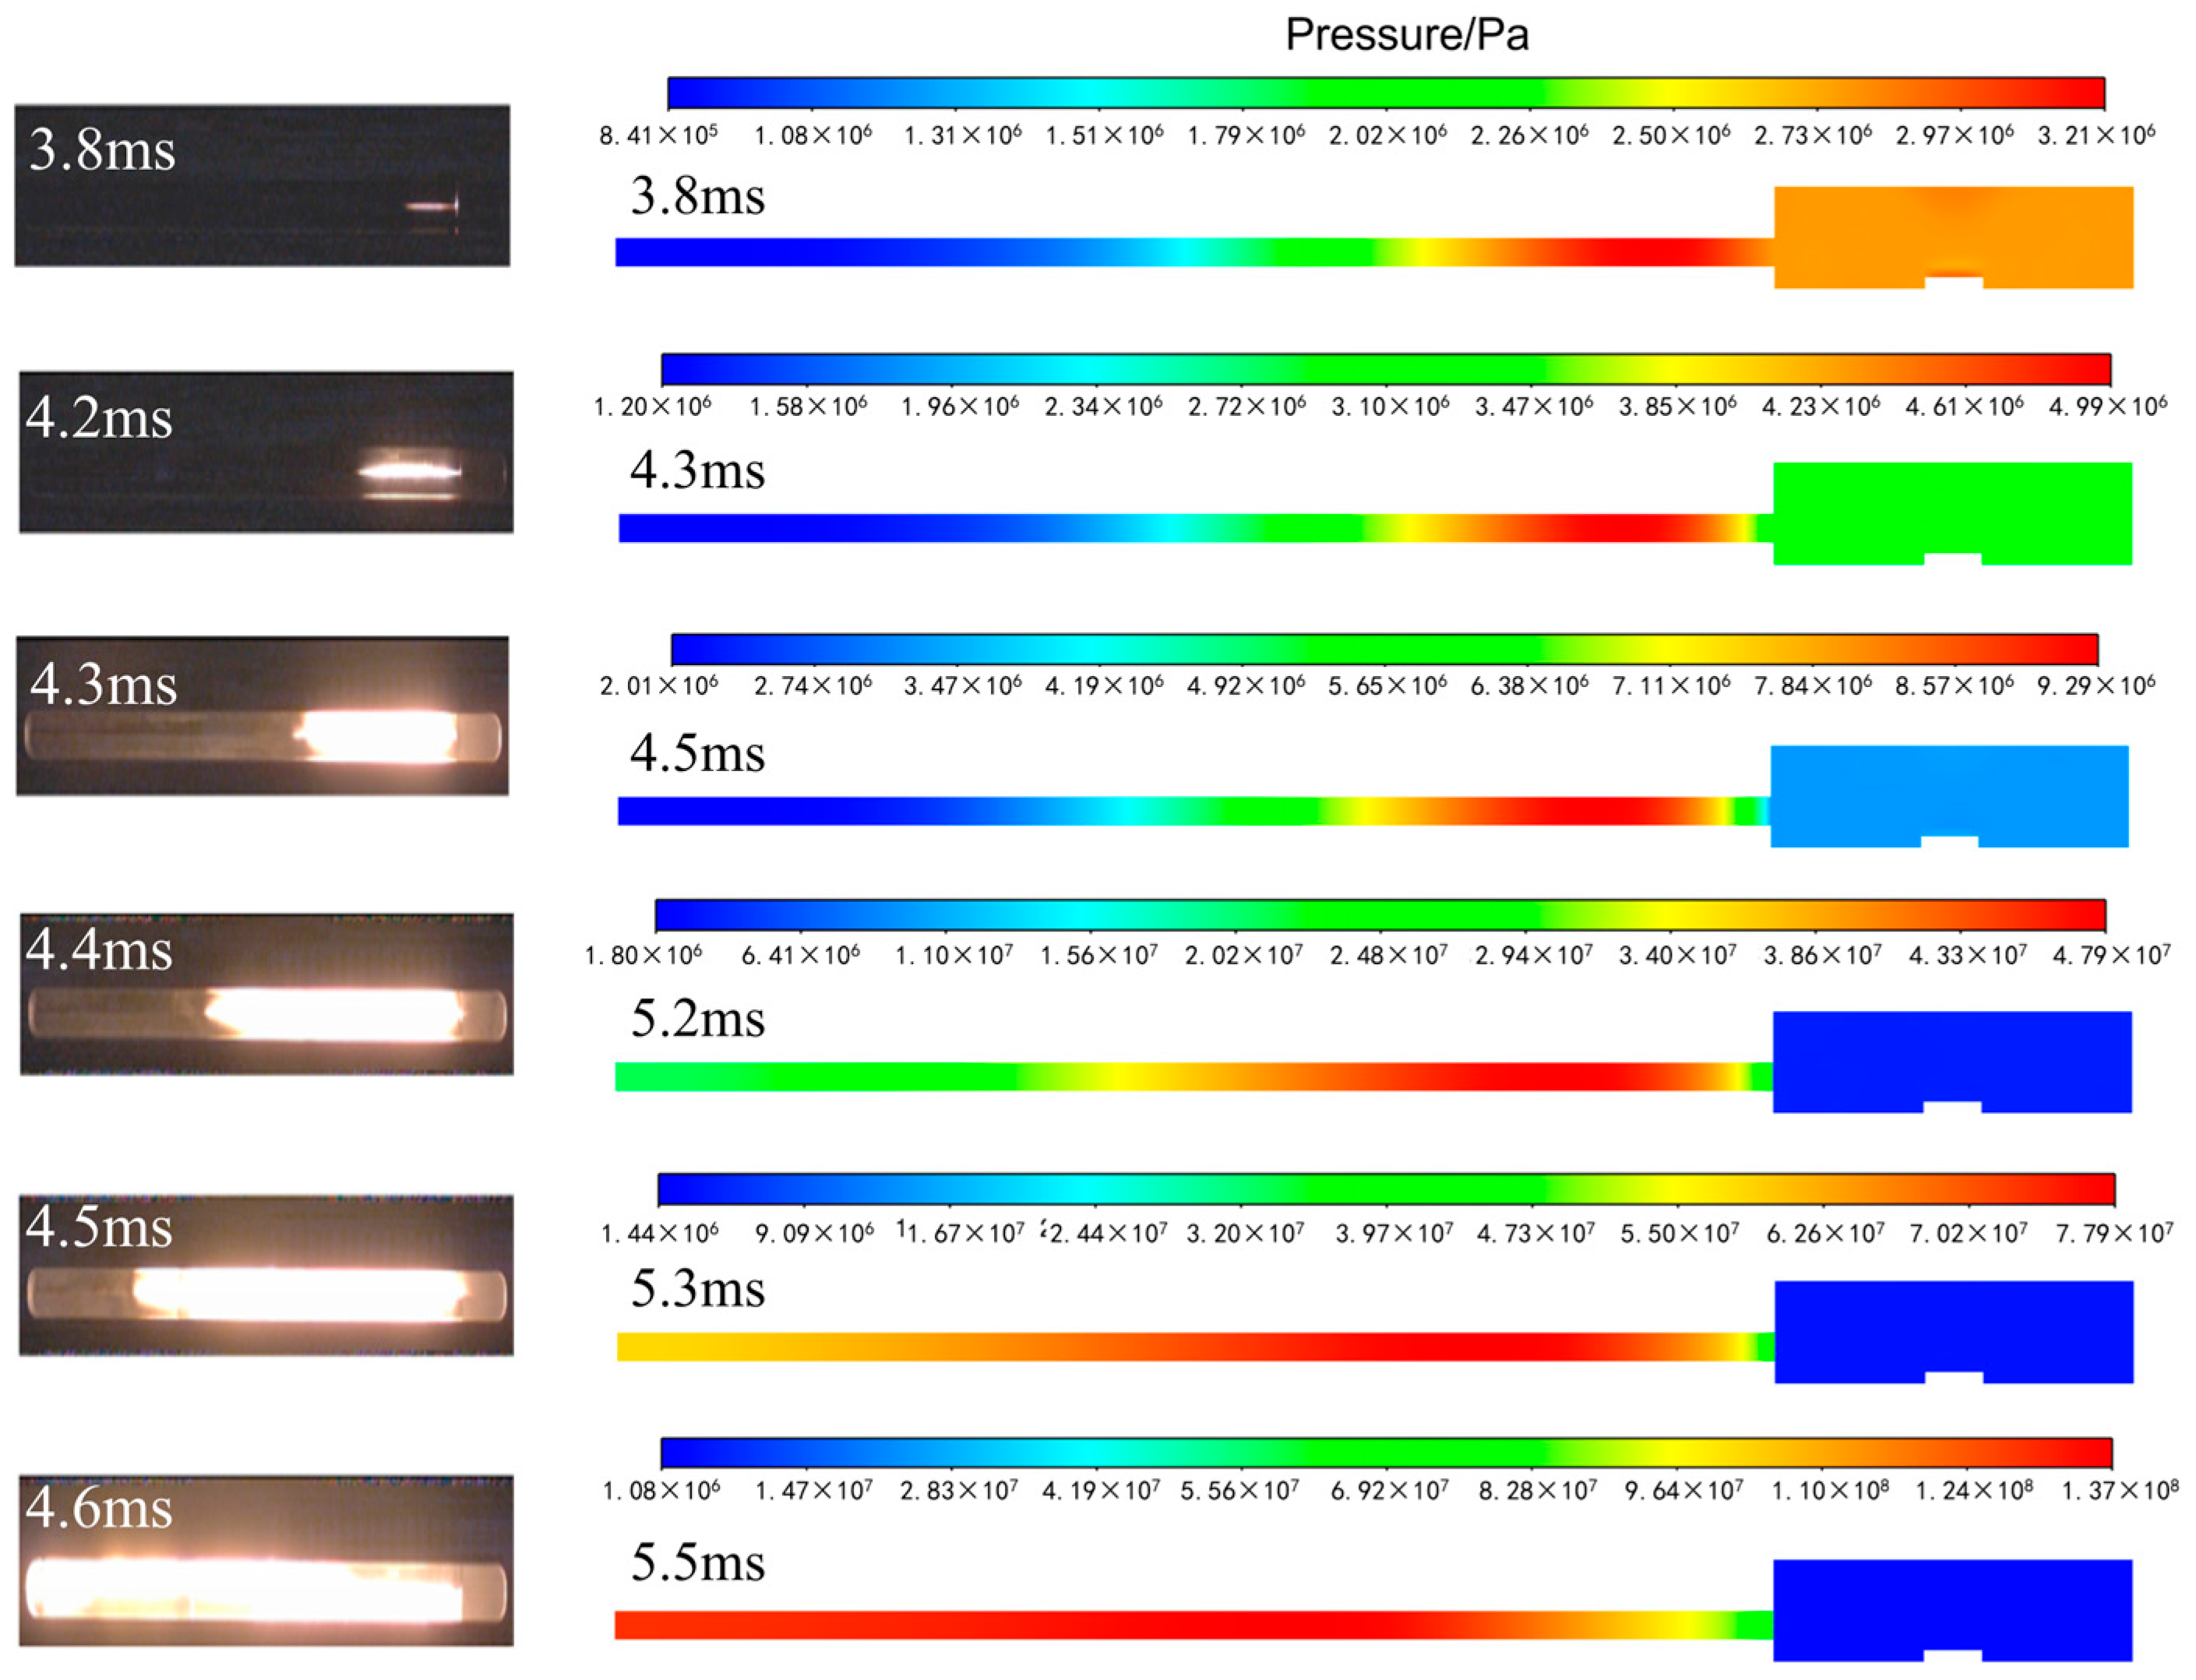
In order to clearly show the combustion state of explosives after ignition, Figure 8 shows the contour of pressure distribution with different color bar ranges. It is evident that the highest pressure appears at the entrance of the crack at 3.8 ms. However, there is little difference between the pressure in the ignition chamber and the pressure in the crack. This suggests that the explosive at the entrance of the crack has the longest contact time with the high-temperature and high-pressure gas produced by the just occurred surface combustion of black powder. As the combustion progresses, the highest pressure still appears at the entrance of the crack at 4.3 ms. However, there is a notable difference between the pressure at the entrance of the crack and that in the ignition chamber. This indicates that the explosive has been completely ignited, and the pressure generated by its combustion in the confined space surpasses that resulting from the combustion of black powder in the ignition chamber. As the reaction continues to 5.2 ms, the combustion of the explosive shows an obvious trend to move to the interior of the crack, and the minimum pressure in the crack exceeds 30 MPa, which produces a difference in magnitude with the pressure in the ignition chamber. At this time, the phenomenon of pressure congestion can be observed. The pressure in the crack does not propagate to the ignition chamber but continues to develop in the crack. This also allows the pressure to rise more rapidly. When the reaction reaches 5.5 ms, the explosive at the bottom of the crack is also fully ignited, and the pressure is at the same level throughout the crack.
Figure 9 shows the pressure curves of stage II and stage III as reported in the literature and in the simulation. Based on these curves, the following observations can be made:
  • The simulated pressure rise curve is basically consistent with that from the literature, showing an exponential rising trend.
  • In the literature, when the explosive is burned to 5.5 ms, the pressure at each node rises to about 250 MPa. In the simulation, when the combustion reaches 5.6 ms, the pressure at 100 mm, 148 mm and 196 mm rises to about 250 MPa, the pressure at 52 mm rises to about 200 MPa and the pressure at 4 mm rises to about 100 MPa.
  • In the experiment, the sequence of rising edges at nodes is 52 mm, 100 mm, 148 mm and 196 mm. In the simulation, the ascending edges at each node are in the same order of 52 mm, 100 mm, 148 mm and 196 mm. In addition, the time of each node’s rising edge in the experiment and simulation is distributed between 4.2 ms and 4.8 ms.
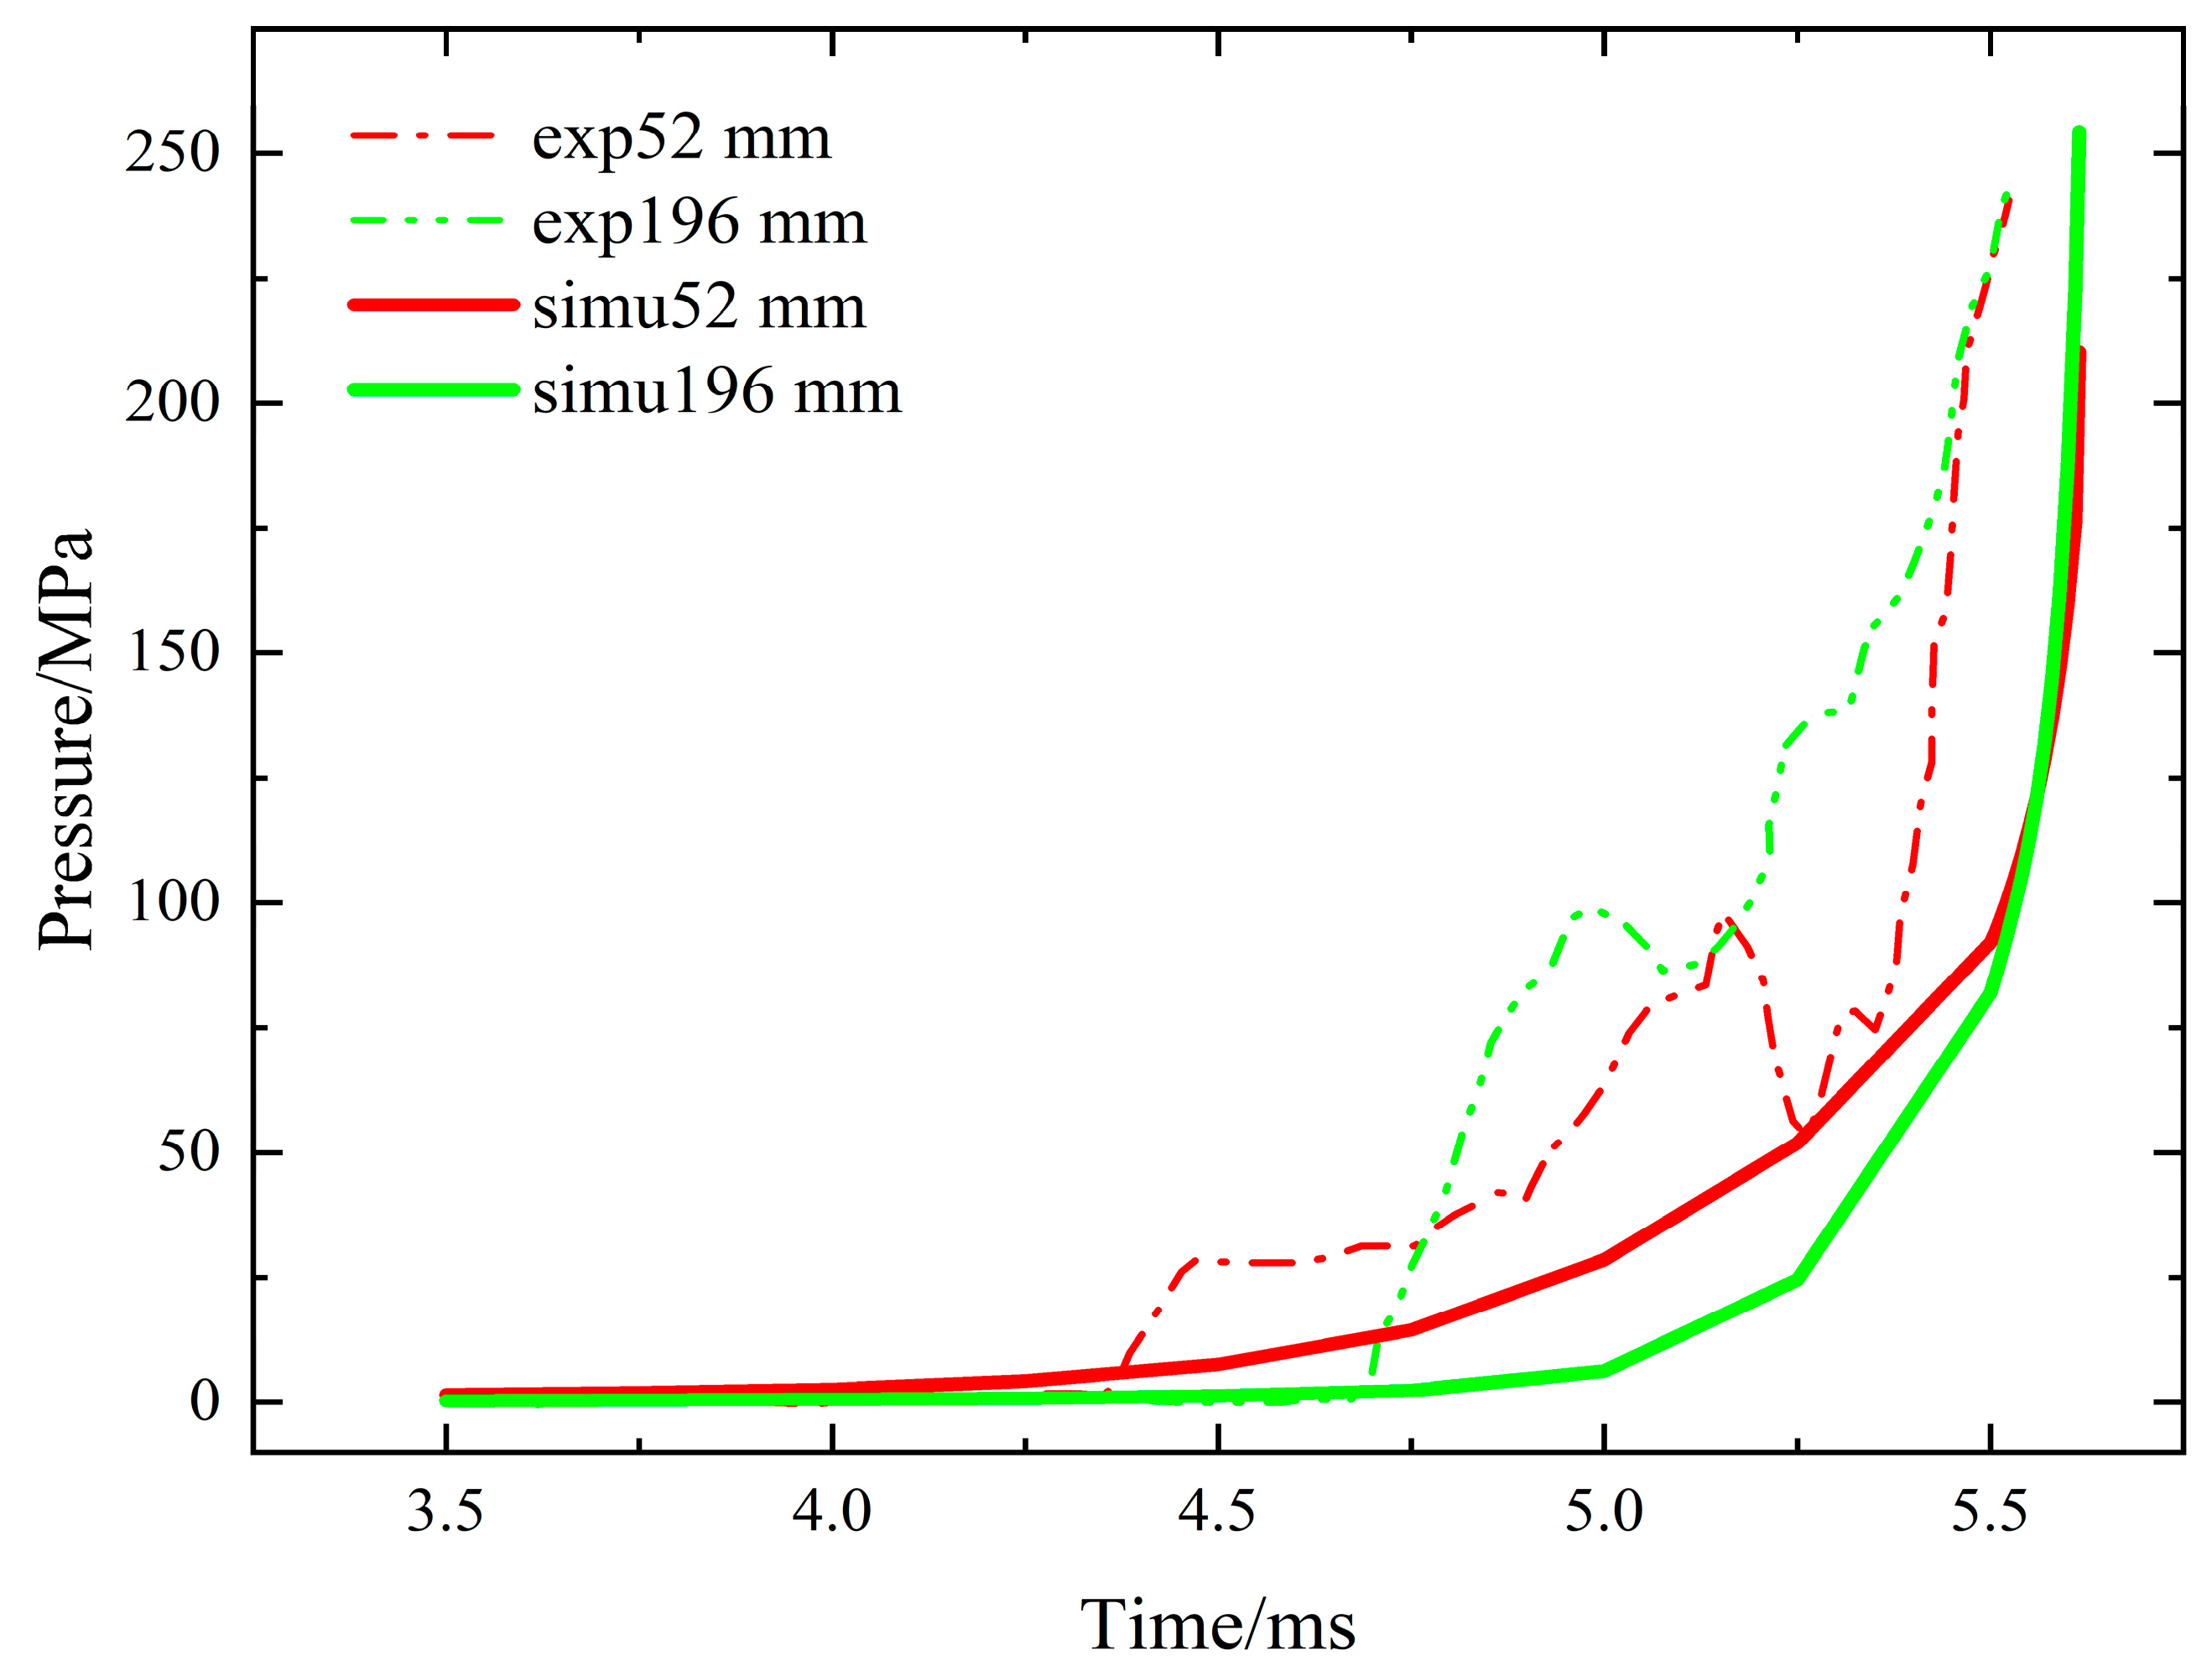
In order to clearly show the comparison between the experimental pressure curve and the simulated pressure curve in the literature, the pressure curves of two nodes, 52 mm and 196 mm, are selected for comparison under the same coordinates, as shown in Figure 10.
The error between the pressure curve in the literature experiment and the simulated pressure curve is analyzed as follows:
  • In the experiment, the explosive may have uneven filling pressure and it is impossible to achieve a complete seal, resulting in more fluctuations and bending of the experimental curve. The simulation is an ideal explosive combustion in a completely closed container, so the curve shows a relatively smooth rise.
  • In the experiment, the explosive itself may have local cracks, resulting in a partial pressure surge in the low-pressure section. In the simulation, the explosive is a uniform entity, so the curve shows a smooth rise.

4. Conclusions

In this study, the ignition of black powder and the combustion process of PBX 9501 explosive in a confined space were studied in the context of explosive combustion in a confined space. According to the different reaction characteristics in the combustion process, the combustion can be divided into four stages, which are the ignition stage of the black powder, the convective combustion and crack propagation stage, the rapid pressure rise stage, the confining shell breaking stage, and the pressure unloading stage. In this project, the global process of the first three stages, namely, laminar combustion from the surface after explosive ignition, explosive crack joint convection combustion, explosive combustion field pressure growth, and deflation to detonation, is described in detail. A set of simulation methods is developed independently, and a simulation study is carried out on the experiments [5]. The simulation results show that after the ignition of the powder explosive, the high-temperature combustion products enter the slit to ignite the PBX 9501 explosive. The explosive is ignited from the end close to the ignition chamber, and then spreads to the other end. Finally, the slit is filled with high-temperature and high-pressure combustion product gas, and the phenomenon of product gas pouring back into the ignition chamber occurs. This is almost consistent with the experimental description in terms of trend. For the combustion process of the PBX 9501 explosive in a closed space with preset cracks, the influence of temperature is greater than that of pressure because the cracks have not fully developed in the initial stage of explosive combustion. In the later stage of explosive combustion, cracks develop fully and the influence of pressure is greater than that of temperature. Therefore, the combined analysis method using the Arrhenius formula and MWSD combustion model is superior that based on only the formula for pressure control.

Author Contributions

Y.H.: resources, data curation, investigation, writing—original draft preparation; J.L.: methodology, data curation, investigation, writing—original draft preparation; Q.W.: formal analysis, supervision; M.Z.: formal analysis, writing—review and editing, project administration, supervision; M.L.: supervision, funding acquisition. All authors have read and agreed to the published version of the manuscript.

Funding

This research was funded by the Foundation Strengthening Project of Institute of Systems Engineering, China Academy of Engineering Physics (ISE-JCJQ22-015) and the National Natural Science Foundation of China (No. 52176130).

Institutional Review Board Statement

Not applicable.

Informed Consent Statement

Not applicable.

Data Availability Statement

Not applicable.

Acknowledgments

Yupeng Hu would like to thank colleagues from the Institute of Systems Engineering, China Academy of Engineering Physics for supporting this research. The authors acknowledge the group members of the Clean Combustion Center of Xi’an Jiaotong University who contributed to the development of the simulation.

Conflicts of Interest

The authors declare no conflict of interest.

Abbreviations

The following abbreviations are used in this manuscript:
PBXPlastic bonded explosive
MWSDModified Wescott–Stewart–Davis model
UDFUser-defined functions

References

  1. Leuret, F.; Chaisse, F.; Presles, H.N. Experimental study of the low velocity detonation regime during the deflagration to detonation transition in a high density explosive. In Proceedings of the 11th International Detonation Symposium, Snowmass, CO, USA, 15–20 July 1998. [Google Scholar]
  2. Verbeek, R.; Steen, A.; Jontg, E. The influence of parameter variations on the deflagration to detonation transition. In Proceedings of the 10th International Detonation Symposium, Boston, MA, USA, 12–16 July 1993. [Google Scholar]
  3. Luebcke, P.E.; Dickson, P.M.; Field, J.E. Experimental investigation into the deflagration to detonation transition in secondary explosives. In Proceedings of the 10th International Detonation Symposium, Boston, MA, USA, 12–16 July 1993. [Google Scholar]
  4. Shang, H.; Yang, J.; Li, T. Experimental Study on Burning Evolution in Confined HMX-bsaed PBX Cracks. Chin. J. Energ. Mater. 2019, 27, 1056–1061. (In Chinese) [Google Scholar]
  5. Shang, H.; Yang, J.; Hu, Q. Experimental Research on Convective Burning in Explosive Cracks. Acta Armamentarii 2019, 40, 99–106. (In Chinese) [Google Scholar]
  6. Shang, H.; Hu, Q.; Li, T. One-dimensional theory for pressurization process in explosive crack burning. Explos. Shock Waves 2020, 40, 011403. (In Chinese) [Google Scholar]
  7. Hu, H.; Guo, Y.; Fu, H. The Dominant Mechanisms of Reaction Violence Transition in Explosive Accidents. Chin. J. Energ. Mater. 2016, 24, 622–624. (In Chinese) [Google Scholar]
  8. Asay, B.W.; Son, S.F.; Bdzil, J.B. The role of gas permeation in convective burning. Int. J. Multiph. Flow 1996, 22, 923–952. [Google Scholar] [CrossRef]
  9. Dickson, P.M.; Asay, B.W.; Henson, B.F. Thermal cook-off response of confined PBX 9501. Proc. Royal Soc. A 2004, 460, 3447–3455. [Google Scholar] [CrossRef]
  10. Dickson, P.M.; Asay, B.W.; Henson, B.F. Observation of the Behaviour of Confined PBX 9501. In Proceedings of the 11th International Detonation Symposium, Snowmass, CO, USA, 15–20 July 1998. [Google Scholar]
  11. Jackson, S.I.; Hill, L.G.; Berghout, H.L. Runaway reaction in a solid explosive containing a single crack. In Proceedings of the 13th International Detonation Symposium, Norfolk, VA, USA, 23–28 July 2006. [Google Scholar]
  12. Wescott, B.L.; Scott Stewart, D.; Davis, W.C. Equation of state and reaction rate for condensed-phase explosives. J. Appl. Phys. 2005, 98, 053514. [Google Scholar] [CrossRef]
  13. Berghout, H.; Steven, F.S.; Larry, G.H. Flame spread through cracks of PBX 9501 (a composite octahydro-1,3,5,7-tetranitro-1,3,5,7-tetrazocine-based explosive). J. Appl. Phys. 2006, 99, 114901. [Google Scholar] [CrossRef]
  14. Jackson, S.I.; Hill, L.G. Runaway reaction due to gas-dynamic choking in solid explosive containing a single crack. Proc. Combust. Inst. 2009, 32, 2307–2313. [Google Scholar] [CrossRef]
  15. Berghout, H.L.; Son, S.F.; Asay, B.W. Convective burning in gaps of PBX 9501. Proc. Combust. Inst. 2000, 28, 911–917. [Google Scholar] [CrossRef]
  16. Hang, S.; Yan, S.; Zhang, G. Computing Method of Environment Equivalent Temperature Based on Arrhenius Equation for Missile Products. Equip. Environ. Eng. 2018, 15, 74–77. (In Chinese) [Google Scholar]
  17. Short, M.; Anderson, E.K.; Chiquete, C. Experimental and modeling analysis of detonation in circular arcs of the conventional high explosive PBX 9501. Proc. Combust. Inst. 2021, 38, 3683–3690. [Google Scholar] [CrossRef]
  18. Chiquete, C.; Short, M.; Meyer, C.D. Calibration of the Pseudo-Reaction-Zone model for detonation wave propagation. Combust. Theory Model. 2018, 22, 744–776. [Google Scholar] [CrossRef]
  19. John, F.B.; Richard, D.D. Lasl Explosive Property Data; Terry, R.G., Charles, E.M., Stanley, P.M., Eds.; Los Alamos Data Center: Los Alamos, NM, USA, 1980; pp. 109–119. [Google Scholar]
Figure 1. Change curve of Con value of correction coefficient with temperature.
Processes 11 02056 g001
Figure 2. Schematic diagram of simulation structure.
Processes 11 02056 g002
Figure 3. Grid structure diagram.
Processes 11 02056 g003
Figure 4. Regression of black powder combustion surface: (a) at 0 ms; and (b) at 3.8 ms.
Processes 11 02056 g004
Figure 5. Temperature clouds at different times [5].
Processes 11 02056 g005
Figure 6. Temperature cloud image at 5.6 ms.
Processes 11 02056 g006
Figure 7. Pressure contours at different times [5].
Processes 11 02056 g007
Figure 8. Pressure distribution at different times [5] (scale of legends is not uniform).
Processes 11 02056 g008
Figure 9. (a) Experimental pressure curve [5]; and (b) simulated pressure curve.
Processes 11 02056 g009
Figure 10. Comparison of experimental and simulated pressure curves at 52 mm and 196 mm [5].
Processes 11 02056 g010
Disclaimer/Publisher’s Note: The statements, opinions and data contained in all publications are solely those of the individual author(s) and contributor(s) and not of MDPI and/or the editor(s). MDPI and/or the editor(s) disclaim responsibility for any injury to people or property resulting from any ideas, methods, instructions or products referred to in the content.