
Study on the Influencing Factors of Injection Blockage during CO2 Sequestration in One-Dimensional Long Reactor
1
School of Civil Engineering, Guilin University of Technology, Guilin 541004, China
2
Guangxi Key Laboratory of Geomechanics and Geotechnical Engineering, Guilin 541004, China
3
State Key Laboratory of Geomechanics and Geotechnical Engineering, Institute of Rock and Soil Mechanics, Chinese Academy of Sciences, Wuhan 430071, China
4
College of Construction Engineering, Jilin University, Changchun 130021, China
*
Author to whom correspondence should be addressed.
Processes 2024, 12(5), 960; https://doi.org/10.3390/pr12050960
Submission received: 11 April 2024
/
Revised: 30 April 2024
/
Accepted: 6 May 2024
/
Published: 9 May 2024
(This article belongs to the Special Issue Recent Advances in Environment and Energy Related Processes in Offshore Geotechnical Engineering)
Abstract
:Carbon sequestration through CO2 injection into a formation is an effective strategy for reducing greenhouse gas emissions. In this study, a one-dimensional long reactor was constructed to simulate the CO2 injection process under various sediment temperatures, pressures, and flow rates. The formation of CO2 hydrate and the resulting blockages were investigated in detail through a series of indoor experiments. Due to the increasing driving force for CO2 hydrate formation, reducing sediment temperature and increasing sediment pressure can cause hydrate blockage to form near the injection end, leading to an increase in CO2 injection pressure and a reduction in the storage range. Furthermore, CO2 injection rate has a substantial impact on the pattern of hydrate blockage. A lower injection rate facilitates full contact between CO2 gas and pore water, which helps to increase the formation and blockage degree of CO2 hydrates, thereby decreasing the amount of CO2 injection. The experimental investigation presented in this paper examines the laws of CO2 injection and clogging under various sediment conditions and injection processes on a one-dimensional scale, which can provide valuable insights for the design of CO2 sequestration processes.
1. Introduction
Since the Industrial Revolution, the extensive use of fossil fuels by humans has produced large quantities of CO2 emissions. The global concentration of CO2 in the atmosphere has increased by about 30%. Increasing global warming poses a serious threat to the Earth’s climate and ecosystem [1]. Therefore, the issue of CO2 emission reduction has attracted extensive attention from scholars [2]. The formation of solid hydrates by injecting CO2 into marine sediments at low temperature to combine with pore water is currently regarded as a promising carbon sequestration technology [3].
The method of CO2 hydrate storage is known for its significant capacity, extensive storage area, and high safety levels [4]. Injecting CO2 into marine formations can form thermodynamically stable hydrates, which helps to increase the stability of sediments [5,6]. To enhance the comprehension of CO2 sequestration in marine formations under high-pressure and low-temperature conditions, Qureshi et al. [7] used an indoor experimental autoclave reactor system to replicate the conditions of the seafloor sedimentary layer and investigated the long-term stability of CO2 hydrate. They found that CO2 hydrate formed on the inner wall of the reactor and within the quartz sand, and it remained stable for up to one month. Furthermore, research indicates that MRI can effectively observe hydrate formation processes without being constrained by experimental conditions of temperature and pressure [8]. Yang et al. [9,10] used MRI techniques to examine the formation and decomposition of CO2 hydrate within water-saturated porous media at low-temperature conditions. The results indicated that the hydrate formation rate was slower at 3 °C compared to 1 °C and 2 °C, leading to a delay in hydrate formation. In addition, the CO2 hydrate formation was significantly affected by flow rates. The hydrate formation will be hindered at either high or low flow rates. Zheng et al. [11] used non-magnetic sand-filled tubes and Nuclear Magnetic Resonance (NMR) techniques to investigate the formation process of CO2 hydrate in porous media. Meanwhile, the characteristics of the sediments were investigated to explore the formation and stability of CO2 hydrate. Yan et al. [12] demonstrated that the stability conditions of CO2 hydrate are critically affected by the pore structure of the pulverized soil. Compared with the conditions that promote the formation of pure hydrates, the achievement of stability in pulverized soils requires higher pressures and lower temperatures. Zhang et al. [13] investigated the effect of the H2O molecular state on the process of CO2-CH4 hydrate replacement. The results showed that the replacement of CO2-CH4 hydrate was more easily achieved in a porous media system than in a pure water system. However, the substitution effect is not satisfactory due to the “self-protection effect” and the adsorption of SiO2 on small-molecule gases. Sun et al. [14] demonstrated the effectiveness of clay sediments in sequestering CO2 through NMR analysis, which evaluated the impact of mineral composition, water content, and pressure. Additionally, Pan et al. [15] utilized the displacement method to investigate gas production from hydrates in clay. Their findings indicated that an increase in the montmorillonite content within clay sediments negatively affected CO2 sequestration.
Recent research indicates that sediment temperature, pressure, and flow rate are critical factors that influence hydrate formation during CO2 injection processes [11]. Li et al. [16] conducted experiments of injecting liquid CO2 into glass sand to simulate seafloor sediment conditions for carbon sequestration. They observed that hydrate formation at high pressure was initially rapid, which increased mass transfer resistance and subsequently reduced hydrate growth. However, in the conditions of low temperatures and high pressure, the rate of conversion from water to hydrate was significantly higher. Shindo et al. [17] used simulations to investigate the formation of CO2 hydrates at the interface of liquid CO2 and water. Uchida et al. [18] used microscopy to observe the formation of hydrates at the interface between water and CO2. They found that liquid CO2 quickly formd a thin hydrate film, which hindered CO2 diffusion during the experiment. Wang et al. [19] investigated hydrate formation by injecting CO2 at different pressures and flow rates into a depleted methane hydrate sediment. The results indicated that pressure was the main factor affecting CO2 hydrate saturation and CO2 conversion rate, and high CO2 flow rate may reduce hydrate saturation and lower CO2 conversion efficiency. Bai et al. [20] developed a convective diffusion model for temperature and CO2. They confirmed through laboratory experiments that the rate of hydrate formation was significantly affected by the convective diffusion of gases, and temperature was found to exert a greater influence. Song et al. [21] discovered that higher pressure and lower flow rates enhanced CO2 hydrate formation, as monitored by magnetic resonance imaging. They also observed that initial water saturation had no significant effect on the CO2 flow process for hydrate formation. Kang et al. [22] investigated the formation of CO2 hydrates in silica gel at different pressures and temperatures. The results showed that the rate of hydrate formation was affected by the convective diffusion of gas, and the temperature contributes more. Li et al. [23] investigated the kinetic characteristics of hydrate formation under CO2 + N2 gas mixture seepage conditions. The results showed that CO2 + N2 hydrate formed nucleation at one location and then expanded outward in the freshwater environment, and the temperature increased sequentially during the process. In the decomposed water environment, the hydrate nucleated at different locations with a more homogeneous distribution, and the temperature rise occurred more frequently.
The existing technology is unable to characterize the transport dynamics and its response during hydrate carbon sequestration accurately. In addition, the diffusion of carbon dioxide in the formation is a complex phenomenon. During the process of CO2 injection, the driving force for hydrate formation and permeability of the sediments may vary significantly, and the efficiency performance of CO2 injection and sequestration may also differ. The current research on hydrate carbon sequestration focuses on the thermodynamic and kinetic aspects of formation, while there are fewer investigations on the plugging effect in the carbon sequestration process. In order to understand the mechanism of plugging effect during CO2 sequestration in clayey silt hydrate reservoirs, in this paper, a one-dimensional long reactor was constructed for conducting hydrate formation experiments by injecting carbon dioxide under specific conditions (e.g., sediment temperature, initial sediment pressure, and intra-sediment flow rate). This investigation primarily focused on evaluating the obstruction effects under various conditions throughout the experiments and elucidating the characteristics of CO2 hydrate injection within porous media. The results of this paper can provide a basic framework and theoretical basis for optimizing CO2 injection process parameters.
2. Materials and Methods
2.1. Experimental Materials
The study employed 99.9% pure CO2 from Wuhan Xiangyun Industry and Trade Limited Liability Company (Wuhan, China) as the experimental gas. Ultrapure water equipment from Wuhan Youpu Instrumentation and Equipment Company and homemade deionized water were also used. Quartz sand was used as the sediments to simulate the marine strata for the experiment. As shown in Figure 1, the size distribution determined by the laser particle size is mainly in the range of 0.07 to 0.447 mm.
2.2. Experimental Setup
In this study, a one-dimensional long reactor hydrate experimental platform was constructed. The platform includes a high-pressure reactor, a piston vessel for high-pressure applications, low-temperature water bath, glycol-based constant-temperature water bath, constant-flux pump, vacuum pump, gas flowmeter, electronic balances, and other components. The reactor is a crucial component comprising two thick-walled tube sections, each with an inner diameter of 2.5 cm and a length of 55 cm. These sections are interconnected via ball valves with matching inner diameters. The reactor has an effective volume of 588.75 cm³ and is designed to withstand pressures up to 25 MPa. To ensure precise monitoring, the reactor is equipped with several evenly distributed temperature and pressure measurement points. The schematic diagram of the experimental system is shown in Figure 2. The measurement points are labelled from gas injection to discharge ends as P1~P6 and T1~T5, respectively. In addition, a pressure measurement point, P0, is located on the piston vessel. Temperature monitoring is carried out using a sensor with a 3 mm diameter and a range of −50 to 200 °C, which has an accuracy of 0.1 °C. The measurement of pressure involves the use of a transmitter that can handle a range of 0 to 25 MPa with an accuracy of ± 0.2%. The flow rate of the constant-flux pump ranges from 0 to 30 mL/min with an accuracy of 0.01 mL/min. The MCGS data acquisition system is used to display and record real-time data on temperature and pressure within the system. In addition, there are a few sources of uncertainty and error in the experimental operation. Firstly, slight daily fluctuations in the temperature of the laboratory room may lead to minor variations in the amount of carbon dioxide injected into the experiment. Secondly, the unstable performance of the back-pressure regulator used in the experiment at higher pressures may also cause minor fluctuations in the data.
2.3. Experimental Principle
The objective of this study was to replicate seafloor hydrate formation by injecting CO2 gas into a one-dimensional long reactor. This was carried out under a high-pressure and low-temperature environment, where CO2 and water combined to form hydrates. The experiments were conducted under specific sediment temperatures and initial sediment pressures, using CO2 gas, as shown in Figure 3. The aim was to accurately simulate the seafloor sediment conditions and the extent of CO2 dispersion. During the experiment, CO2 was continuously injected into the reactor to initiate hydrate formation. Both pressure and temperature variations were recorded meticulously. The experiment ended when the CO2 supply from the high-pressure piston vessel was depleted. The setup, which included a one-dimensional long reactor and specific temperature and pressure conditions, allowed for an examination of the blocking effect caused by hydrate formation. The study investigated the injection characteristics of CO2 in porous media and evaluated the influence of important factors on the CO2 injection process.
2.4. Experimental Methods and Procedures
Eight experiments were conducted to investigate the effects of varying sediment temperatures, initial sediment pressures, and CO2 injection rates. The quartz sand was oven-dried at 105 °C. Then, 762.81 g of the dried sand and 74.03 g of distilled water were mixed and loaded into reaction tubes before being compacted. The reactor was placed in a thermostatic water bath, and the glycol bath’s temperature was maintained by circulating a low-temperature water bath and a liquid-level relay. The equipment was installed after a thorough leak check and vacuuming of the entire reaction system to remove air. Then, 233.62 g of distilled water was added to the reaction vessel using a constant-flux pump, and the water bath temperature reached the predefined experimental temperature.
During the experiments, water was injected into the piston vessel at rates ranging from 0 to 30 mL/min using a constant-flux pump. The process was regulated by the preset experimental pressure of the back-pressure regulator and the preset injection rate of the constant-flux pump, as shown in Table 1. This setup enabled the continuous injection rate of gas in the sediments with an initial fixed pressure and volume from the piston vessel to the reactor, thereby maintaining displacement stability. The gas flow rates discharged from the reactor were monitored using a gas mass flow controller and a flowmeter. After the CO2 gas injection, the reactor’s valves were sealed, and the MCGS data acquisition system displayed and recorded temperature and pressure data in real time throughout the injection process.
3. Results and Discussion
3.1. Effect of Sediment Temperature on CO2 Hydrate Formation
In order to investigate the plugging characteristics during CO2 gas injection, the spatial distribution of temperature and pressure was measured and monitored during the experiments. The occurrence of changes in temperature and pressure levels during the injection process may provide an indication of the potential formation of hydrates. The experiments involved the injection of gaseous carbon dioxide at sediment temperatures of 4 °C, 6 °C, and 8 °C. Figure 4a,b show the spatial and temporal evolution f pressure and temperature, respectively, with the x-axis representing the injection time and the y-axis the distance from the injection end. Figure 4c,d show the time evolution of temperature and pressure in the extended reactor at different sediment temperatures.
Figure 4a,b illustrate a substantial rise in pressure at measurement points P1 and P2, 20 min into the experiment. This was mainly caused by the formation of carbon dioxide hydrate, which obstructed further gas injection and blocked the existing pore flow channels, leading to increased gas injection pressure. During 45 to 60 min, the high-pressure region caused by blockage was concentrated near P1 and P2 measurement points adjacent to the injection port. At around the 50 min mark, pressure at P2 significantly fluctuated, peaking at 4.8 MPa before swiftly declining to 4.2 MPa. This abrupt pressure change was primarily due to a significant differential pressure at the two ends of the blockage, which makes the obstructed area unblocked. Following a decline in pressure at the P2 measurement point to its lowest point, a rapid increase occurs due to re-obstruction. This change serves to highlight the impact on the carbon dioxide injection process. After 55 min, the gradual increase in pressure at P1 indicates the development of a severe blockage that hinders further CO2 injection into the sediment. The decrease in pressure at P2 is attributed to the blockage at P1, which limits the volume of CO2 injection into the vicinity of P2. These observations confidently suggest that the blockage at P1 is a major obstacle to the CO2 injection process.
Furthermore, Figure 4c,d demonstrate that when the sediment temperature is consistently maintained at 4 °C, the temperatures at the T1 and T2 measurement points at depths of 10 cm and 20 cm increase significantly, forming a distinct zone of temperature rise. This increase is primarily the result of the reaction of gaseous carbon dioxide with pore water under suitable temperature and pressure conditions at these locations, which leads to the nucleation of hydrates and exothermic reactions that further elevate the temperature. The graph clearly demonstrates a temporary temperature rise near P2, which is confidently attributed to the exothermic nature of hydrate formation. This process consumes gas in the second half of the reactor to an extent that reduces the pressure in that section.
Figure 5 illustrates the spatial and temporal variations in pressure and temperature during CO2 injection at a sediment temperature of 6 °C. As indicated in Figure 5a,b, the pressures at measurement points P1 to P4 successively increase due to the plugging effect caused by hydrate formation. At point P1, pressure began to increase after 33 min due to localized blockage from hydrate formation during the initial injection phase, ultimately reaching approximately 6 MPa by 74 min. Under pressure, the blockage was breached, allowing CO2 to diffuse through the pore flow channels to the rear of the reactor. Subsequently, it reacts with the pore water to form a new hydrate, which was able to grow rapidly and spread around during the injection process, causing the blockage. This resulted in a significant increase in pressure, reaching 4.9 MPa at P2 and P3. The experiment showed that the impact had rapidly spread to the vicinity of P4, which is located 80 cm from the injection port, around 85 min into the experiment. By 97 min, pressure had also seen a slight rise, reaching 4.3 MPa, indicating the formation of blockage-causing hydrates further from the injection port. Additionally, Figure 5c,d demonstrate that during the initial 10 min of the experiment, temperatures at sensors T1, T2, and T3 increased by 8.3%, 30%, and 9.3%, respectively. This rise indicates an early onset of hydrate formation. Between 90 and 100 min, the temperature at sensor T4 exhibited a slight increase, indicating a rise in pressure resulting from blockage caused by the carbon dioxide hydrate.
Figure 6 illustrates the spatial and temporal variations in pressure and temperature during CO2 injection at a sediment temperature of 8 °C. Figure 6a,b indicate that the blockage is likely situated between measurement points P5 and P6, with pressures at points P1 to P5 demonstrating a persistent change. The pressure increases to 4.7 MPa at 40 min, then relieves temporarily and drops to 4.1 MPa at approximately 71 min. After 92 min, the pressure rapidly spikes to 5.1 MPa in only 3 min. Figure 6c,d confirm the location of the blockage between P5 and P6. These sections show a significant temperature increase at T1 and T2 measurement points near the injection end, with T1 reaching 8.2 °C around 37 min. T2 experienced two significant temperature increases: an initial rise to 8.2 °C at the start of injection and a subsequent 0.5 °C increase after 35 min.
Comparing Figure 4, Figure 5 and Figure 6 shows that CO2 reacts quickly with pore water to form significant amounts of hydrate during the initial stages of CO2 injection. This reaction releases heat and causes an increase in reactor temperature. As the process continues, hydrate saturation intensifies, and the formation zone widens.
At the same time, the dense accumulation of hydrates within the pore space may prevent CO2 injection into the sediment. In addition, the permeability of carbon dioxide is stronger under high-temperature conditions, and the time for blockage formation in porous media is shorter. The expansion of the hydrate formation area is notably more pronounced at elevated temperatures. This phenomenon is attributed to the reduced driving force for CO2 hydrate formation at higher temperatures, which requires a longer duration for plug formation. Furthermore, plugs that are exposed to high temperatures tend to fracture more easily under high-pressure differentials. Therefore, injecting CO2 into sediments at different sediment temperatures suggests that higher temperatures improve the ability to distribute CO2 more extensively.
3.2. Effect of Different Initial Sediment Pressures on CO2 Hydrate Formation
To investigate the effect of different initial sediment pressures on CO2 hydrate formation, three groups of experiments with initial sediment pressures of 2.7 MPa, 3.2 MPa, and 3.7 MPa, were adopted. The sediment characteristics are consistent during the experiments, i.e., the water saturation and gas injection rate are the same for these experiments. The sediment temperatures are all set to 4 °C.
As shown in Figure 7a,b, when the initial sediment pressure is 2.7 MPa, the pressures at measurement points P1~P5 increase synchronously and gradually at 26 min, and it reaches 7.6 MPa at 49 min. In contrast, the pressure at measurement point P6 decreases by 0.7 MPa at 9 min and then remains at about 2.8 MPa till the end of the gas injection process. Ultimately, the pressures at measurement points P1 to P5 are 4.7 MPa higher than that at P6. This phenomenon results from the blocking of pore flow channels by hydrates forming between P5 and P6, which hinders the diffusion of carbon dioxide gas within the porous medium. In addition, the hydrate shell thickens as the hydration reaction progresses, increasing the degree of blockage over time.
Meanwhile, the two minor temperature increases in the reactor are also observed in Figure 7c,d. The temperatures at measurement points T4 and T5 remain almost unchanged at about 4 °C throughout the gas injection process. The minor temperature fluctuations observed at measurement point T1 are primarily attributed to the nucleation of hydrates under high-pressure and low-temperature conditions, resulting from the injection of carbon dioxide into the pore water. The temperature rise of measurement points T2 and T3 is more obvious, and the temperature rise of T2 first appears in the period of 5 min to 9 min, when the highest temperature reaches 4.3 °C. Subsequently, during the period of 14 min to 24 min, the temperatures of T2 and T3 increase, which indicates that the range of temperature rise is gradually expanding. Given an adequate supply of gas, the hydrate rapidly grew during the injection process, accompanied by heat release.
When the initial sediment pressure is 3.2 MPa, as shown in Figure 8a,b, the pressure at measurement point P1 rises to 4.3 MPa in a minor and rapid rise at about 17 min, and then decreases slowly to 3.9 MPa. This indicates that between measurement points P1 and P2, the hydrates formed also caused a slight blockage, leading to an increase in pressure. Over time, this blockage gradually decreased. With the gas injection process, the pressures at measurement points P1 and P2 increase incrementally by 6.5 MPa and 5.6 MPa at 29 min and 40 min, respectively. This provides a further indication that the plugging range extends gradually from measurement points P1~P2 to measurement points P2~P3.
Figure 8c,d summarize the temperature variations at each measurement point during the gas injection process. Three slight temperature rises are recorded throughout the whole process. Following a 3 min interval, the process of hydrate nucleation, resulting from the interaction of injected carbon dioxide with pore water, was accompanied by the release of heat, which led to a first temperature increase of 0.2 °C at measurement point T1. The temperature rise at measurement point T2 occurs at 0 min, 7~34 min and 36 min, respectively. The three increases in temperatures are 0.1 °C, 0.2 °C, and 0.3 °C, respectively. Meanwhile, measurement point T3 exhibits a small range of temperature fluctuations during 8 to 32 min. The above phenomenon indicates that there are multiple nucleation sites in the sediment, leading to the formation of hydrates at various locations.
From Figure 9a,b, in the experiment with an initial sediment pressure of 3.7 MPa, the pressure at measurement point P1 rises rapidly from 4.6 MPa at 35 min and reaches a maximum value of 7.6 MPa after 13 min. The pressure increase was due to the formation of significant carbon dioxide hydrate blockages at the rear of P1. Based on the data in Figure 9c,d, the temperatures of measurement points T3, T4, and T5 remain almost unchanged during the gas injection process. Measurement point T1 shows an increase in temperature at the beginning of gas injection and remains at this temperature level throughout the gas injection process, with only minor fluctuations. The temperature of measurement point T2 rises significantly at 6 min and reaches a maximum value of 4.2 °C by 19 min. By 30 min, the temperature at measurement point T2 experiences an increase again and then drops back gradually. The observation of this series of changes indicates that the temperature in the region around the T2 measurement point is consistently higher than the initial value. This suggests that the hydration reaction of CO2 injection has continued to take place in this region, accompanied by the release of heat in the process.
From the comprehensive analysis of Figure 7, Figure 8 and Figure 9, the plugging region of CO2 hydrate formation is far away from the injection point under low sediment pressure conditions. When the sediment pressure is high, the driving force for hydrate formation is higher. The region closer to the injection point is susceptible to plugging, which affects the further injection of CO2 into the sediment interior.
3.3. Effect of Different Injection Rates on CO2 Hydrate Formation
The temperature of hydrate generation in the experiment was 6 °C, and the initial sediment pressure was 3.7 MPa. The injection rates of CO2 into the high-pressure piston vessel are 10, 20, and 30 mL/min. As shown in Figure 10a,b, due to fluctuations in the pressure control of the back-pressure regulator, the pressures at measurement points P1~P6 are in a state of synchronized rise and fall up to 15 min.
There is only a minor difference between the pressures at all measurement points, and there is almost no plugging. After 15 min, the pressure at measurement points P1~P3 is gradually larger than that at measurement points P4~P6. At 48 min, the pressure of P2 is 0.2 MPa higher than the pressure of P5. The pressure of P5 reaches a maximum value of 4.6 MPa at 48 min. This indicates that a significant plug is located between measurement points P3 and P4.
Hydrate formation and exothermic processes are weak in the 40-to-120-cm region of the reactor, as shown in Figure 10c,d. The released heat is absorbed by the water bath before it is captured by the temperature sensor. Therefore, the variations at measurement points T4 and T5 are minor. The temperature at measurement point T1 increases by 0.2 °C at 2 min, then decreases and stabilizes finally at about 6.1 °C. During 20 to 30 min, the temperature of T1 increases slightly, then decreases again and stabilizes at 6.1 °C until the end of the gas injection process. Measurement point T2 shows a significant temperature fluctuation, and two temperature increases occur in total. The first time, the temperature rises by 0.4 °C at about 15 min, and the second time at 33 min, the temperature rises by 0.7 °C. In addition, the temperature at measurement point T3 rises from 6 °C to 6.3 °C at 43 min.
As shown in Figure 11a,b, due to the limitation of the pressure control accuracy of the back-pressure regulator, the pressures at measurement points P1~P6 fluctuated at the same time, dropping to 4.2 MPa. After 7 min, the pressure at each measurement point maintains within the same level range at about 4.4 MPa. When the injection rate is 10 mL/min and 20 mL/min, the pressure rises sharply at 41 min and 46 min, respectively. However, a similar phenomenon is not observed at an injection rate of 30 mL/min. This demonstrates that at the high injection rate condition, there is no significant plugging in the reactor, and the pressure remains stable.
According to the data in Figure 11c,d, there is no variation in the temperature at measurement points T3 to T5. Especially, the temperature of measurement point T1 increases to 6.6 °C at the beginning of the experiment, whereas T2 shows a temperature increase of 0.2 °C at 2 min. In comparison with the injection rates of 10 and 20 mL/min, the duration of the temperature rise at 30 mL/min is significantly shorter. This indicates that the scale of CO2 hydrate formation in the sediment is not sufficient to plug the pore flow channels.
A comprehensive comparison of Figure 5, Figure 10 and Figure 11 shows that carbon dioxide hydrate plugging in the pore space is more evident under low carbon dioxide injection rate conditions. This is due to the fact that the CO2 gas has enough time to contact the pore fluid at low injection rates. When the injection rate is high, the contact time between CO2 gas and pore water is shorter. It is not susceptible to developing a local plug, and it is more conducive to the injection of CO2 gas to the far side of the sediment.
4. Conclusions
This study systematically examined the CO2 injection process within a one-dimensional long reactor experimental system under varying sediment conditions, including different temperatures (4, 6, and 8 °C), pressures (2.7 MPa, 3.2 MPa, and 3.7 MPa), and injection rates (10 mL/min, 20 mL/min, and 30 mL/min). The findings of this study offer significant insights into the dynamics of CO2 hydrate formation and the associated challenges of plugging, with implications for CO2 sequestration technologies. The key contributions from this study include:
- The study revealed that CO2 rapidly interacts with pore water to form significant amounts of hydrate, accompanied by heat release. This process not only increases the internal temperature of the reactor but also leads to a progressive increase in hydrate saturation. As hydrate forms, it extends the formation region, illustrating a dynamic system where the physical properties of the reactor environment are continuously evolving. It is of critical importance to note that the formation of dense hydrate structures within pore spaces can impede further CO2 injection by obstructing fluid flow channels. This finding serves to highlight the necessity of managing hydrate formation in order to optimize CO2 sequestration efficiency.
- The influence of pressure and temperature on hydrate formation has been the subject of considerable research. Our findings indicate that under conditions of low sediment pressure and high temperature, the driving force for CO2 hydrate formation is reduced, leading to slower hydrate formation rates. This slower formation rate mitigates the extent and severity of plugging, thereby enhancing the capacity for CO2 injection and sequestration. This observation is crucial for designing effective CO2 injection strategies that minimize operational disruptions caused by hydrate plugging.
- The impact of injection rate on system dynamics is a significant factor in the effectiveness of CO2 sequestration operations. Increasing the gas injection rate under constant temperature and pressure conditions has been shown to significantly reduce the contact time between CO2 gas and pore water, which alleviates hydrate plugging issues. This facilitates a broader distribution of gas injection, effectively increasing the volume of CO2 that can be sequestered. This finding suggests that optimizing injection rates can be a key strategy in maximizing the efficiency and effectiveness of CO2 sequestration operations.
Author Contributions
Conceptualization, H.W.; methodology, X.M.; writing—original draft preparation, Y.Z.; writing—review and editing, J.L. supervision, H.W. and X.M. All authors have read and agreed to the published version of the manuscript.
Funding
This study was funded by China Postdoctoral Science Foundation (Grant No. 2022M720161), Natural Science Foundation of China (Grant No. 42302352), the Key Technologies R&D Program of Guangxi (GUIKE AB22080073), Guangxi Science and Technology Major Program (GUIKE AA23073005), and the Chinese Academy of Sciences (2022000217).
Data Availability Statement
Data are contained within the article.
Conflicts of Interest
The authors declare no conflict of interest.
References
- Wei, Y.M.; Han, R.; Wang, C.; Yu, B.; Liang, Q.M.; Yuan, X.C.; Chang, J.; Zhao, Q.; Liao, H.; Tang, B. Self-preservation strategy for approaching global warming targets in the post-Paris Agreement era. Nat. Commun. 2020, 11, 1624. [Google Scholar] [CrossRef] [PubMed]
- Gabitto, J.; Tsouris, C. Dissolution mechanisms of CO2 hydrate droplets in deep seawaters. Energy Convers. Manag. 2006, 47, 494–508. [Google Scholar] [CrossRef]
- Zheng, J.; Chong, Z.R.; Qureshi, M.F.; Linga, P. Carbon Dioxide Sequestration via Gas Hydrates: A Potential Pathway toward Decarbonization. Energy Fuels 2020, 34, 10529–10546. [Google Scholar] [CrossRef]
- Rehman, A.N.; Bavoh, C.B.; Pendyala, R.; Lal, B. Research Advances, Maturation, and Challenges of Hydrate-Based CO2 Sequestration in Porous Media. ACS Sustain. Chem. Eng. 2021, 9, 15075–15108. [Google Scholar] [CrossRef]
- Lim, D.; Ro, H.; Seo, Y.; Seo, Y.J.; Lee, J.Y.; Kim, S.J.; Lee, J.; Lee, H. Thermodynamic stability and guest distribution of CH4/N2/CO2 mixed hydrates for methane hydrate production using N2/CO2 injection. J. Chem. Thermodyn. 2017, 106, 16–21. [Google Scholar] [CrossRef]
- Yang, M.; Song, Y.; Jiang, L.; Zhao, Y.; Ruan, X.; Zhang, Y.; Wang, S. Hydrate-based technology for CO2 capture from fossil fuel power plants. Appl. Energy 2014, 116, 26–40. [Google Scholar] [CrossRef]
- Fahed Qureshi, M.; Zheng, J.; Khandelwal, H.; Venkataraman, P.; Usadi, A.; Barckholtz, T.A.; Mhadeshwar, A.B.; Linga, P. Laboratory demonstration of the stability of CO2 hydrates in deep-oceanic sediments. Chem. Eng. J. 2022, 432, 134290. [Google Scholar] [CrossRef]
- Timur, A. Nuclear magnetic resonance study of carbonate rocks. Log Anal. 1972, 13, 3–11. [Google Scholar]
- Yang, M.; Song, Y.; Zhu, N.; Zhao, Y.; Liu, Y.; Jiang, L. Dynamic Measurements of CO2 Flow in Water Saturated Porous Medium at Low Temperature Using MRI. Energy Procedia 2013, 37, 1267–1274. [Google Scholar] [CrossRef]
- Yang, M.; Song, Y.; Jiang, L.; Zhu, N.; Liu, Y.; Zhao, Y.; Dou, B.; Li, Q. CO2 Hydrate Formation and Dissociation in Cooled Porous Media: A Potential Technology for CO2 Capture and Storage. Environ. Sci. Technol. 2013, 47, 9739–9746. [Google Scholar] [CrossRef] [PubMed]
- Zheng, J.n.; Yang, L.; Ma, S.; Zhao, Y.; Yang, M. Quantitative analysis of CO2 hydrate formation in porous media by proton NMR. AIChE J. 2020, 66, e16820. [Google Scholar] [CrossRef]
- Tian, H.; Wei, C.; Yan, R.; Chen, H. A NMR-based analysis of carbon dioxide hydrate dissociation process in silt. Sci. Sin. Phys. Mech. Astron. 2019, 49, 034615. [Google Scholar] [CrossRef]
- Zhang, X.; Huang, T.; Shan, T.; Yuan, Q.; Yin, S.; Li, J.; Wu, Q.; Zhang, P. Molecular dynamics study of the influence of water molecular phase state on the replacement of CO2–CH4 hydrate in porous media. J. Mol. Liq. 2023, 391, 123401. [Google Scholar] [CrossRef]
- Sun, Y.; Jiang, S.; Li, S.; Wang, X.; Peng, S. Hydrate formation from clay bound water for CO2 storage. Chem. Eng. J. 2021, 406, 126872. [Google Scholar] [CrossRef]
- Pan, D.B.; Zhong, X.P.; Zhu, Y.; Zhai, L.H.; Zhang, H.; Li, X.T.; Wang, Y.F.; Chen, C. CH4 recovery and CO2 sequestration from hydrate-bearing clayey sediments via CO2/N2 injection. J. Nat. Gas Sci. Eng. 2020, 83, 103503. [Google Scholar] [CrossRef]
- Li, N.; Kan, J.-Y.; Sun, C.-Y.; Chen, G.-J. Hydrate formation from liquid CO2 in a glass beads bed. Chin. J. Chem. Eng. 2022, 43, 185–191. [Google Scholar] [CrossRef]
- Shindo, Y.; Lund, P.C.; Fujioka, Y.; Komiyama, H. Kinetics of formation of CO2 hydrate. Energy Convers. Manag. 1993, 34, 1073–1079. [Google Scholar] [CrossRef]
- Uchida, T.; Ebinuma, T.; Kawabata, J.i.; Narita, H. Microscopic observations of formation processes of clathrate-hydrate films at an interface between water and carbon dioxide. J. Cryst. Growth 1999, 204, 348–356. [Google Scholar] [CrossRef]
- Wang, P.; Zhou, H.; Ling, Z.; Li, Y. Hydrate Formation Characteristics during Carbon Dioxide Flow Through Depleted Methane Hydrate Deposits. Energy Technol. 2018, 6, 1186–1195. [Google Scholar] [CrossRef]
- Bai, Y.; Cao, G.; An, H.; Zhang, H. Generation laws and distribution characteristics of carbon dioxide hydrate in a reaction kettle. Exp. Therm. Fluid Sci. 2020, 116, 110125. [Google Scholar] [CrossRef]
- Song, Y.; Zhou, H.; Ma, S.; Liu, W.; Yang, M. CO2 sequestration in depleted methane hydrate deposits with excess water. Int. J. Energy Res. 2018, 42, 2536–2547. [Google Scholar] [CrossRef]
- Kang, S.P.; Lee, J.W. Kinetic behaviors of CO2 hydrates in porous media and effect of kinetic promoter on the formation kinetics. Chem. Eng. Sci. 2010, 65, 1840–1845. [Google Scholar] [CrossRef]
- Li, B.; Sun, Y.; Jiang, S.; Shen, Y.; Qi, Y.; Zhang, G. Investigating CO2–N2 phase behavior for enhanced hydrate-based CO2 sequestration. Energy 2024, 289, 129946. [Google Scholar] [CrossRef]
Figure 1.
Quartz sand particle grading curve and physical figure.

Figure 2.
Experimental setup schematic.

Figure 3.
CO2 hydrate formation pressure–temperature curves and experimental conditions.

Figure 4.
The variations in temperature and pressure in the reactor during gas injection at a sediment temperature of 4 °C. (a) The figure illustrates the spatiotemporal evolution of pressure, with the x-axis representing the gas injection time and the y-axis representing the distance from the gas injection end; (b) Pressure changes during CO2 injection; (c) The figure illustrates the spatiotemporal evolution of temperature, with the x-axis representing the gas injection time and the y-axis representing the distance from the gas injection end; (d) Spatiotemporal evolution of temperature during CO2 injection.

Figure 5.
The variations in temperature and pressure in the reactor during gas injection at a sediment temperature of 6 °C. (a) The figure illustrates the spatiotemporal evolution of pressure, with the x-axis representing the gas injection time and the y-axis representing the distance from the gas injection end; (b) Pressure changes during CO2 injection; (c) The figure illustrates the spatiotemporal evolution of temperature, with the x-axis representing the gas injection time and the y-axis representing the distance from the gas injection end; (d) Spatiotemporal evolution of temperature during CO2 injection.
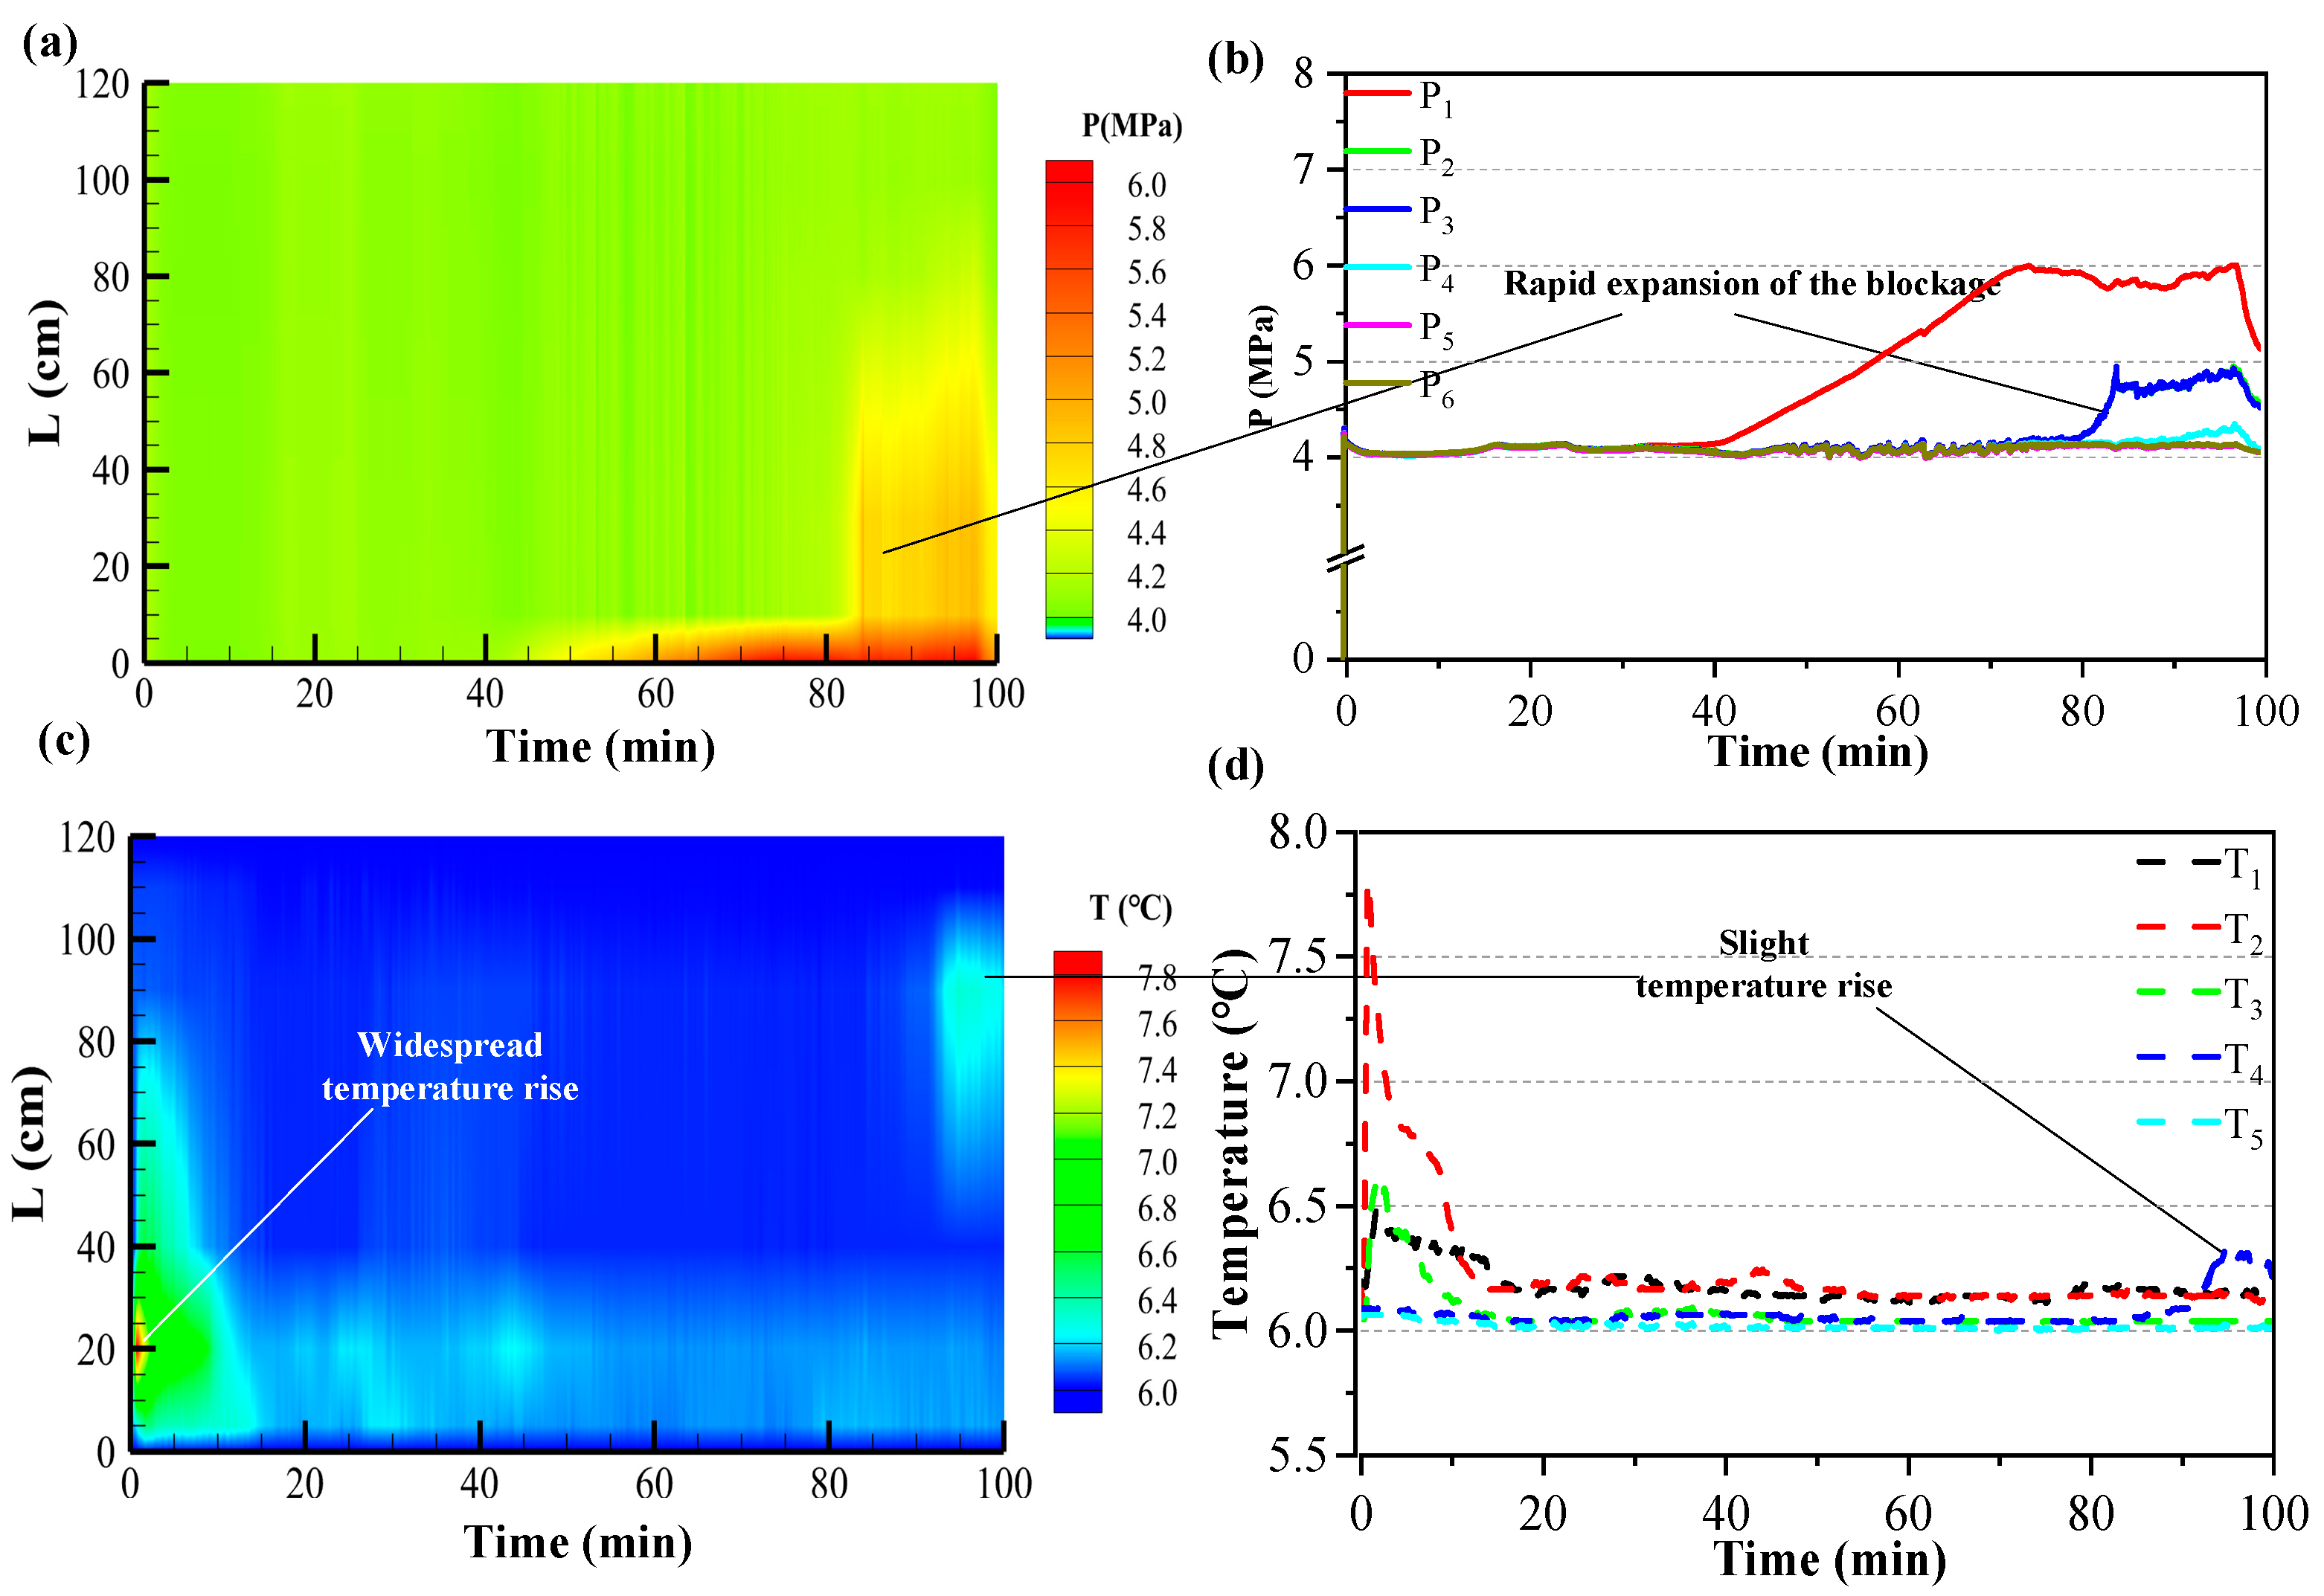
Figure 6.
The variations in temperature and pressure in the reactor during gas injection at a sediment temperature of 8 °C. (a) The figure illustrates the spatiotemporal evolution of pressure, with the x-axis representing the gas injection time and the y-axis representing the distance from the gas injection end; (b) Pressure changes during CO2 injection; (c) The figure illustrates the spatiotemporal evolution of temperature, with the x-axis representing the gas injection time and the y-axis representing the distance from the gas injection end; (d) Spatiotemporal evolution of temperature during CO2 injection.

Figure 7.
The variations in temperature and pressure in the reactor during gas injection at an initial sediment pressure of 2.7 MPa. (a) The figure illustrates the spatiotemporal evolution of pressure, with the x-axis representing the gas injection time and the y-axis representing the distance from the gas injection end; (b) Pressure changes during CO2 injection; (c) The figure illustrates the spatiotemporal evolution of temperature, with the x-axis representing the gas injection time and the y-axis representing the distance from the gas injection end; (d) Spatiotemporal evolution of temperature during CO2 injection.

Figure 8.
The variations in temperature and pressure in the reactor during gas injection at an initial sediment pressure of 3.2 MPa. (a) The figure illustrates the spatiotemporal evolution of pressure, with the x-axis representing the gas injection time and the y-axis representing the distance from the gas injection end; (b) Pressure changes during CO2 injection; (c) The figure illustrates the spatiotemporal evolution of temperature, with the x-axis representing the gas injection time and the y-axis representing the distance from the gas injection end; (d) Spatiotemporal evolution of temperature during CO2 injection.

Figure 9.
The variations in temperature and pressure in the reactor during gas injection at an initial sediment pressure of 3.7 MPa. (a) The figure illustrates the spatiotemporal evolution of pressure, with the x-axis representing the gas injection time and the y-axis representing the distance from the gas injection end; (b) Pressure changes during CO2 injection; (c) The figure illustrates the spatiotemporal evolution of temperature, with the x-axis representing the gas injection time and the y-axis representing the distance from the gas injection end; (d) Spatiotemporal evolution of temperature during CO2 injection.

Figure 10.
The variations in temperature and pressure in the reactor during gas injection at an injection rate of 20 mL/min. (a) The figure illustrates the spatiotemporal evolution of pressure, with the x-axis representing the gas injection time and the y-axis representing the distance from the gas injection end; (b) Pressure changes during CO2 injection; (c) The figure illustrates the spatiotemporal evolution of temperature, with the x-axis representing the gas injection time and the y-axis representing the distance from the gas injection end; (d) Spatiotemporal evolution of temperature during CO2 injection.

Figure 11.
The variations in temperature and pressure in the reactor during gas injection at an injection rate of 30 mL/min. (a) The figure illustrates the spatiotemporal evolution of pressure, with the x-axis representing the gas injection time and the y-axis representing the distance from the gas injection end; (b) Pressure changes during CO2 injection; (c) The figure illustrates the spatiotemporal evolution of temperature, with the x-axis representing the gas injection time and the y-axis representing the distance from the gas injection end; (d) Spatiotemporal evolution of temperature during CO2 injection.


Table 1.
Experimental conditions and control parameters.
| Case | Initial Temperature (°C) | Injection Rate (mL/min) | Initial Sediment Pressure (Mpa) | Piston Vessel Pressure (Mpa) | Injection Back-Pressure Valve Pressure (Mpa) |
|---|---|---|---|---|---|
| 1 | 4 | 10 | 3.7 | 4.2 | 4.2 |
| 2 | 6 | 10 | 3.7 | 4.2 | 4.2 |
| 3 | 8 | 10 | 3.7 | 4.2 | 4.2 |
| 4 | 4 | 20 | 2.7 | 3.2 | 3.2 |
| 5 | 4 | 20 | 3.2 | 3.7 | 3.7 |
| 6 | 4 | 20 | 3.7 | 4.2 | 4.2 |
| 7 | 6 | 20 | 3.7 | 4.2 | 4.2 |
| 8 | 6 | 30 | 3.7 | 4.2 | 4.2 |
Disclaimer/Publisher’s Note: The statements, opinions and data contained in all publications are solely those of the individual author(s) and contributor(s) and not of MDPI and/or the editor(s). MDPI and/or the editor(s) disclaim responsibility for any injury to people or property resulting from any ideas, methods, instructions or products referred to in the content. |
© 2024 by the authors. Licensee MDPI, Basel, Switzerland. This article is an open access article distributed under the terms and conditions of the Creative Commons Attribution (CC BY) license (https://creativecommons.org/licenses/by/4.0/).
Share and Cite
MDPI and ACS Style
Zhang, Y.; Wei, H.; Liu, J.; Ma, X. Study on the Influencing Factors of Injection Blockage during CO2 Sequestration in One-Dimensional Long Reactor. Processes 2024, 12, 960. https://doi.org/10.3390/pr12050960
AMA Style
Zhang Y, Wei H, Liu J, Ma X. Study on the Influencing Factors of Injection Blockage during CO2 Sequestration in One-Dimensional Long Reactor. Processes. 2024; 12(5):960. https://doi.org/10.3390/pr12050960
Chicago/Turabian StyleZhang, Yi, Houzhen Wei, Jinxin Liu, and Xiaolong Ma. 2024. "Study on the Influencing Factors of Injection Blockage during CO2 Sequestration in One-Dimensional Long Reactor" Processes 12, no. 5: 960. https://doi.org/10.3390/pr12050960
Note that from the first issue of 2016, this journal uses article numbers instead of page numbers. See further details here.