Article

Transcriptome Analysis on the Underlying Physiological Mechanism of Calcium and Magnesium Resolving “Sugar Receding” in ‘Feizixiao’ Litchi Pulp

1
Sanya Nanfan Research Institute of Hainan University, Sanya 572025, China
2
College of Horticulture, Hainan University, Haikou 570228, China
*
Author to whom correspondence should be addressed.
Horticulturae 2022, 8(12), 1197; https://doi.org/10.3390/horticulturae8121197
Submission received: 13 November 2022 / Revised: 5 December 2022 / Accepted: 12 December 2022 / Published: 14 December 2022
(This article belongs to the Collection Advances in Tropical Fruit Cultivation and Breeding)

Abstract

:
The sugar contents of ‘Feizixiao’ litchi (Litchi chinensis Sonn.) decrease at full maturity; calcium (Ca) and magnesium (Mg) foliar fertilizer can resolve this “sugar receding”. To investigate the physiological mechanism of Ca and Mg foliar fertilizer used to resolve the “sugar receding” phenomenon in ‘Feizixiao’ litchi pulp, 16-year-old litchi trees were treated with 0.3% CaCl2 + 0.3% MgCl2 foliar spraying or water as a control. We determined the pulp sugar content over a two-year period in 2020 and 2021. Pulp total RNA was extracted for transcriptome sequencing in 2020, and the expression pattern of 10 differentially expressed genes (DEGs) was verified by real-time PCR in 2020 and 2021. The results showed that the fertilizer treatment significantly increased pulp fructose and total soluble sugar contents at maturity in both years. According to Gene Ontology (GO) functional enrichment analysis, there were 155 DEGs divided into 35 GO categories, among which 49 DEGs were divided into 49 pathways according to Kyoto Encyclopedia of Genes and Genomes (KEGG) pathway enrichment analysis. We isolated sugar-metabolism-related enzyme genes, including sucrose synthase (SS), acid invertase (AI), neutral invertase (NI), sucrose phosphate synthase (SPS), and hexokinase (HK). All sucrose-metabolism-related enzyme (NI, AI, SS, SPS) genes were downregulated, and six of the seven HK genes were downregulated. The expression patterns of the 10 DEGs were verified by real-time PCR, which showed significant linear relationships (r2020 = 0.9127, r2021 = 0.8705). In conclusion, the fertilizer treatment inhibited the synthesis of sucrose and phosphorylation of hexose by downregulating the expression of the SS, SPS, and HK genes, thus increasing the fructose and total soluble sugar contents in ‘Feizixiao’ litchi.

1. Introduction

Litchi (Litchi chinensis Sonn., Sapindaceae) is a tropical and subtropical evergreen fruit tree that originated in China [1] and is cultivated in the regions of Guangdong, Guangxi, Hainan, Sichuan, Yunnan, and Taiwan. As a result of its juicy flesh and rich nutrition, it has the reputation of being the “king of Lingnan fruit”. ‘Feizixiao’ litchi, a medium- to early-maturing plant variety, is one of the main cultivars in Hainan Province, and has high economic value. However, there is a problem of “sugar receding” during the ripening period of litchi fruit. The sugar content starts to decrease when the peel turns red [2], which seriously affects fruit quality.
Fructose, glucose, and sucrose are the main sugars in ‘Feizixiao’ litchi pulp, with the hexoses (fructose, glucose) being the most prevalent [3]. The photosynthetic products from the leaves of higher plants are transported, mainly in the form of sucrose, to the fruit via the phloem [4]. Subsequently, sucrose is converted into fructose, glucose, or uridine diphosphate glucose (UDPG) under the action of sucrose-metabolism-related enzymes. Sucrose-metabolism-related enzymes include acid invertase (AI), neutral invertase (NI), sucrose synthase (SS), and sucrose phosphate synthase (SPS). SS catalyzes the reversible reaction between fructose, UDPG, and sucrose [5], SPS catalyzes the synthesis of sucrose, and the invertase enzymes catalyze the hydrolysis of sucrose to fructose and glucose [6]. Hexose is the primary energy source for most plant metabolic pathways [7], and its utilization by plants requires further reactions. The first step in hexose metabolism is hexose phosphorylation; hexose phosphorylation converts hexose into hexose phosphate, which then enters the glycolytic pathway (EMP) and pentose phosphate pathway (PPP), providing materials and energy for plant growth and development. The conversion of hexose into hexose phosphate directly leads to a decrease in sugar content, which means the “sugar receding” effect should be related to hexose phosphorylation. The enzymes known to catalyze hexose phosphorylation are hexokinase and fructokinase [7]. In grape berries, hexokinase has been reported to be involved not only in sugar metabolism but also as a hexose sensor, regulating the expression of various genes through signaling and thus affecting fruit growth and development [8,9,10]. In pears, PbHXK1, a gene involved in modulating sugar content, was positively correlated with hexokinase activity and negatively correlated with fruit sugar content, and affected fruit quality [11]. In apples, hexokinase affects fruit sugar metabolism as well as growth and development [12]. Overall, these results suggest that hexokinase has a significant regulatory effect on fruit quality.
Cell wall degradation begins during fruit senescence and is characterized by a subsequent decrease in fruit hardness and enhanced respiration. Calcium (Ca) and magnesium (Mg) are important minerals in fruit growth and development, and it has been shown that Ca delays ripening and inhibits fruit senescence [13], mainly by reducing fruit respiration [14]. For example, the increase in Ca content in sweet cherry fruit is accompanied by a decrease in fruit respiration rate and an increase in peel hardness [15]. It has been shown that Ca is able to maintain cell wall structure [16] and reduce fruit deterioration [17,18]. Moreover, Mg plays an important role in the loading and transport of photosynthetic assimilates from the phloem to the sink tissue [19] and is involved in leaf photosynthesis and carbohydrate, lipid, protein, and nucleic acid synthesis [20,21,22].
We have found that Ca and Mg foliar fertilizers can resolve the “sugar receding” effect in litchi, but the underlying mechanism is not clear. In this study, the sugar content of litchi fruit was measured after treating litchi trees with a foliar spray of 0.3% CaCl2 + 0.3% MgCl2 aqueous solution or water as a control. Transcriptome sequencing analysis was performed on the pulp RNA to identify key genes affecting sugar content and explain the mechanism by which Ca and Mg foliar fertilizer mediates the “sugar receding” effect in litchi fruit. The results of this study will provide theoretical support for better artificial regulation of sugar content in ‘Feizixiao’ litchi.

2. Materials and Methods

2.1. Experimental Design and Materials

In Team 5 Litchi Garden, Jinpai Farm, Chengmai County, Hainan Province, 10 16-year-old ‘Feizixiao’ litchi trees with basically the same growth vigor and no bad performance were selected as test materials in 2020, and another 10 trees were selected with the same standard in 2021. A foliar spray application of 0.3% CaCl2 + 0.3% MgCl2 aqueous solution was used as the treatment, and a foliar spray application of water was used as the control. There were five replicates in the treatment and control groups. In the garden, the fruit began to ripen 63 days after anthesis (DAA) in 2020 and 2021 and ripened completely at 69 DAA in 2020 and 70 DAA in 2021 [23]. Treatment was started at the end of the physiological fruit drop period (35 DAA). The treatment times were 35, 42, and 50 DAA in 2020 and 35, 42, and 49 DAA in 2021. Sampling occurred during the fruit expansion period and fruit ripening period, starting at 35 DAA (19 April 2020, 18 April 2021), and five fruit with the same average size in the middle and periphery of each tree were selected. The size and color of the five fruit were used as a reference for subsequent sampling, with highly similar fruit selected as the test materials at 30 fruit per tree. The sampling times were 35, 42, 50, 56, 63, and 69 DAA in 2020 and 35, 42, 49, 56, 63, and 70 DAA in 2021. After collection, the samples were placed in liquid nitrogen for quick freezing and returned to the lab for storage in an ultralow temperature freezer (−80 °C).

2.2. Extraction and Determination of Glucose, Fructose, and Sucrose

The method described by Wang et al. [3] was used with some modifications. First, 0.5 g of pulp was weighed into a mortar and heated in a microwave oven for 30 s; then, 5 mL of 90% ethanol was added, and the sample was ground thoroughly and centrifuged at 10,000× g for 15 min. The supernatant was collected, and 5 mL of 90% ethanol was added for a second extraction. The two supernatants were combined and evaporated to dryness in a 90 °C water bath, followed by the addition of deionized water to 10 mL. A small amount of the supernatant was then aspirated with a syringe and filtered through a 0.45 μm membrane for testing. The sugar content was determined by high-performance liquid chromatography with an evaporative light-scattering detector (model 2695; Waters Corp., Milford, MA, USA) and an amino column (Boston Analytics, Watertown, MA, USA). The mobile phase was acetonitrile:water = 8:2, the flow rate was 1 mL·min−1, the column temperature was 35 °C, and the injection volume was 10 μL. High-purity glucose, fructose, and sucrose (Beijing Tanmo Quality Inspection Technology Co., Ltd., Beijing, China) were used as the standards, and high-purity acetonitrile (Sinopharm Chemical Reagent Co., Ltd., Shanghai, China) was used as the mobile phase. Sucrose, fructose, and glucose have been identified as the main sugars in litchi [24], so the sum of the fructose, glucose, and sucrose contents was used as the soluble sugar content.

2.3. RNA Isolation and Sequencing

Total RNA was extracted from the treated and control litchi pulp samples at 35 and 69 DAA in 2020 for transcriptome sequencing, with 3 biological replicates for each period. An RNA extraction kit (RNAprep Pure Plant Plus Kit, Tiangen Biochemical Technology Co., Ltd., Beijing, China) was used for RNA extraction following the manufacturer’s protocol. After the RNA was purified and qualified, a cDNA library was established (Wuhan Metwell Biotechnology Co., Ltd., Wuhan, China), and the Illumina HiSeq platform was used for transcriptome sequencing after the library was qualified.

2.4. Sequence Assembly

After sequencing, the raw reads were filtered to remove low-quality reads with adapters to obtain clean reads. Trinity software [25] was used to splice the clean reads. The obtained data were stored in FASTA format, and the longest transcript obtained after hierarchical clustering was considered a unigene.

2.5. Gene Annotation and Differentially Expressed Genes (DEGs) Screening

Unigenes were compared to the Kyoto Encyclopedia of Genes and Genomes (KEGG) [26], the National Center of Biotechnology Information (Bethesda, MD, USA) nonredundant (NR) database [27], the SwissProt protein sequence database [28], Gene Ontology (GO) [29], cluster of orthologous groups of proteins and euKaryotic ortholog groups (COG/KOG) [30,31], and TrEMBL databases [32], and the predicted amino acid sequences of the unigenes were compared to the protein family (Pfam) [33] using HMMER software [34] to obtain annotation information. Fragments per kilobase of transcript per million fragments mapped (FPKM) was used to calculate the expression of the unigenes. DESeq2 software [35,36] was used to identify DEGs.

2.6. DEGs Enrichment Analysis

GO and KEGG enrichment analyses were performed for the DEGs, and significant GO terms and KEGG pathways were identified. A hypergeometric test was applied to find the pathways and GO terms that were significantly enriched for DEGs in the context of the whole genome.

2.7. Primer Design and Real-Time PCR Verification

Some high-expression genes related to sugar metabolism were screened, and the FPKM values for these genes were horizontally normalized and drawn into a heatmap with TBtools [37]. Ten genes were randomly selected from transcriptome sequencing (RNA-seq) data, and real-time PCR primers were designed with Primer3 [38] and synthesized (Shanghai Bioengineering Co., Ltd., Shanghai, China). The extracted pulp RNA was reverse transcribed into cDNA using a cDNA synthesis kit (HiScript II 1st Strand cDNA Synthesis Kit; Novizan Biotechnology Co., Ltd., Nanjing, China) and a PCR instrument (T100TM Thermal Cycler; BIO-RAD Inc, Hercules, CA, USA). The procedure was performed according to the manufacturer’s instructions. Real-time PCR verification was performed using a real-time PCR instrument (qTOWER3; Analytik Jena Inc, Jena, Germany) with a real-time PCR kit (Taq Pro Universal SYBR qPCR Master Mix; Vazyme Inc., Nanjing, China). The procedure was as follows: (1) The mixture was prepared in a 96-well plate with 8 µL of Taq Pro Universal SYBR qPCR Master Mix, 1 µL each of forward and reverse primers, and 5 µL of cDNA; (2) the reaction program was predenaturation at 95 °C for 30 s, a cycle reaction (40 cycles) at 95 °C for 10 s, and 60 °C for 30 s. Each real-time PCR reaction was performed with three technical repeats. The relative expression of genes was calculated using the 2−ΔΔCt method [39] with 35 DAA as the reference, and litchi actin was used as the internal reference gene [40]. The primers are shown in Table 1.

2.8. Data Analysis

Data were submitted to analysis of variance (ANOVA) using statistical software (SAS version 9.4; SAS Institute Inc., Cary, NC, USA). Student’s t-test was used to analyze significant differences between the fertilizer treatment and control at the same stage.

3. Results and Analysis

3.1. Changes in Fructose, Glucose, Sucrose, and Soluble Sugar Contents

As shown in Figure 1a–h, the fructose content showed an overall increasing trend between the treated and control fruit in a two-year period, and the fructose content of the treated fruit was significantly higher than that of the control at 63 days after anthesis (DAA) in 2021. At full maturity (69 DAA in 2020 and 70 DAA in 2021), the fructose content of the treated fruit was significantly higher than that of the control fruit in both years. At 50 and 56 DAA in 2020, the glucose content of the treated fruit was significantly lower and significantly higher than that of the control, respectively. At 56 DAA in 2021, the sucrose content of the treated fruit was significantly higher than that of the control. At full maturity, the soluble sugar content of the treated fruit was significantly higher than that of the control in both years.
The “sugar receding” effect occurred in the control group when the fruits were fully ripe, but the soluble sugar content of the treated fruit did not decrease because the treatment promoted the accumulation of fructose. In conclusion, the regulatory effect of the fertilizer treatment on the sugar contents of pulp was similar in both years.

3.2. Quality Assessment and Assembly of Transcriptome Sequencing Result

The quality assessment of transcriptome sequencing in 2020 is shown in Table 2. At least 42,158,766 raw reads were obtained in all samples, and at least 40,912,018 clean reads were obtained after filtration, with a total of 60.1 Gb clean bases and at least 6.14 Gb clean bases for each sample. The error rate was 0.02%, Q20 was more than 98%, Q30 was more than 94%, and GC content was more than 45%. These results indicated that the sequencing quality was favorable for subsequent analyses.
A total of 165,886 transcripts were assembled, and 161,697 unigenes were obtained by transcriptome sequencing. The length distribution is shown in Figure 2, with an average length of 1471 bp and 1502 bp.

3.3. Unigene Annotation Results

As shown in Figure 3, a total of 161,697 unigenes were obtained from all the samples by transcriptome sequencing, of which 83,859 were annotated in the KEGG database, 110,106 were annotated in the NR database, and 78,728 were annotated in the SwissProt database. A total of 109,690 were annotated in the TrEMBL database, 69,420 in the KOG database, 91,005 in the GO database, and 81,266 in the Pfam database.

3.4. Quantification and KEGG and GO Enrichment Analyses of DEGs

The number of DEGs between the treatment and the control group at 69 DAA was counted, and the results are shown in Figure 4a. There were 155 DEGs, of which 100 were upregulated and 55 were downregulated.
The above DEGs were enriched by KEGG and GO enrichment analysis, and the results are shown in Figure 4b,c. According to KEGG pathway annotation, 49 DEGs were annotated into 49 pathways, among which 29, 11, 4, and 4 DEGs were detected in metabolic pathways, biosynthesis of secondary metabolites, oxidative phosphorylation, and starch and sucrose metabolism, respectively. According to GO functional annotation, the 155 DEGs were divided into 40 categories, which were summarized into cell component, biological process, and molecular function. In the cell component category, there were more DEGs enriched in the terms cell, cell part, organelle, and membrane. In the molecular function category, there were more DEGs enriched in the terms catalytic activity and binding. In the biological process category, there were more DEGS enriched in the terms metabolic processes and cellular processes.

3.5. Screening and Expression Pattern Analysis of Sugar Metabolism-Related Genes

The highly expressed sucrose-metabolism-related enzyme genes and HK genes were isolated from the transcriptome data, and the FPKM values of these genes were normalized and plotted as a heatmap. As shown in Figure 5, compared with the control, all sucrose-metabolism-related enzyme genes were downregulated, and six of the seven HK genes were downregulated in the treated fruit at 69 DAA.

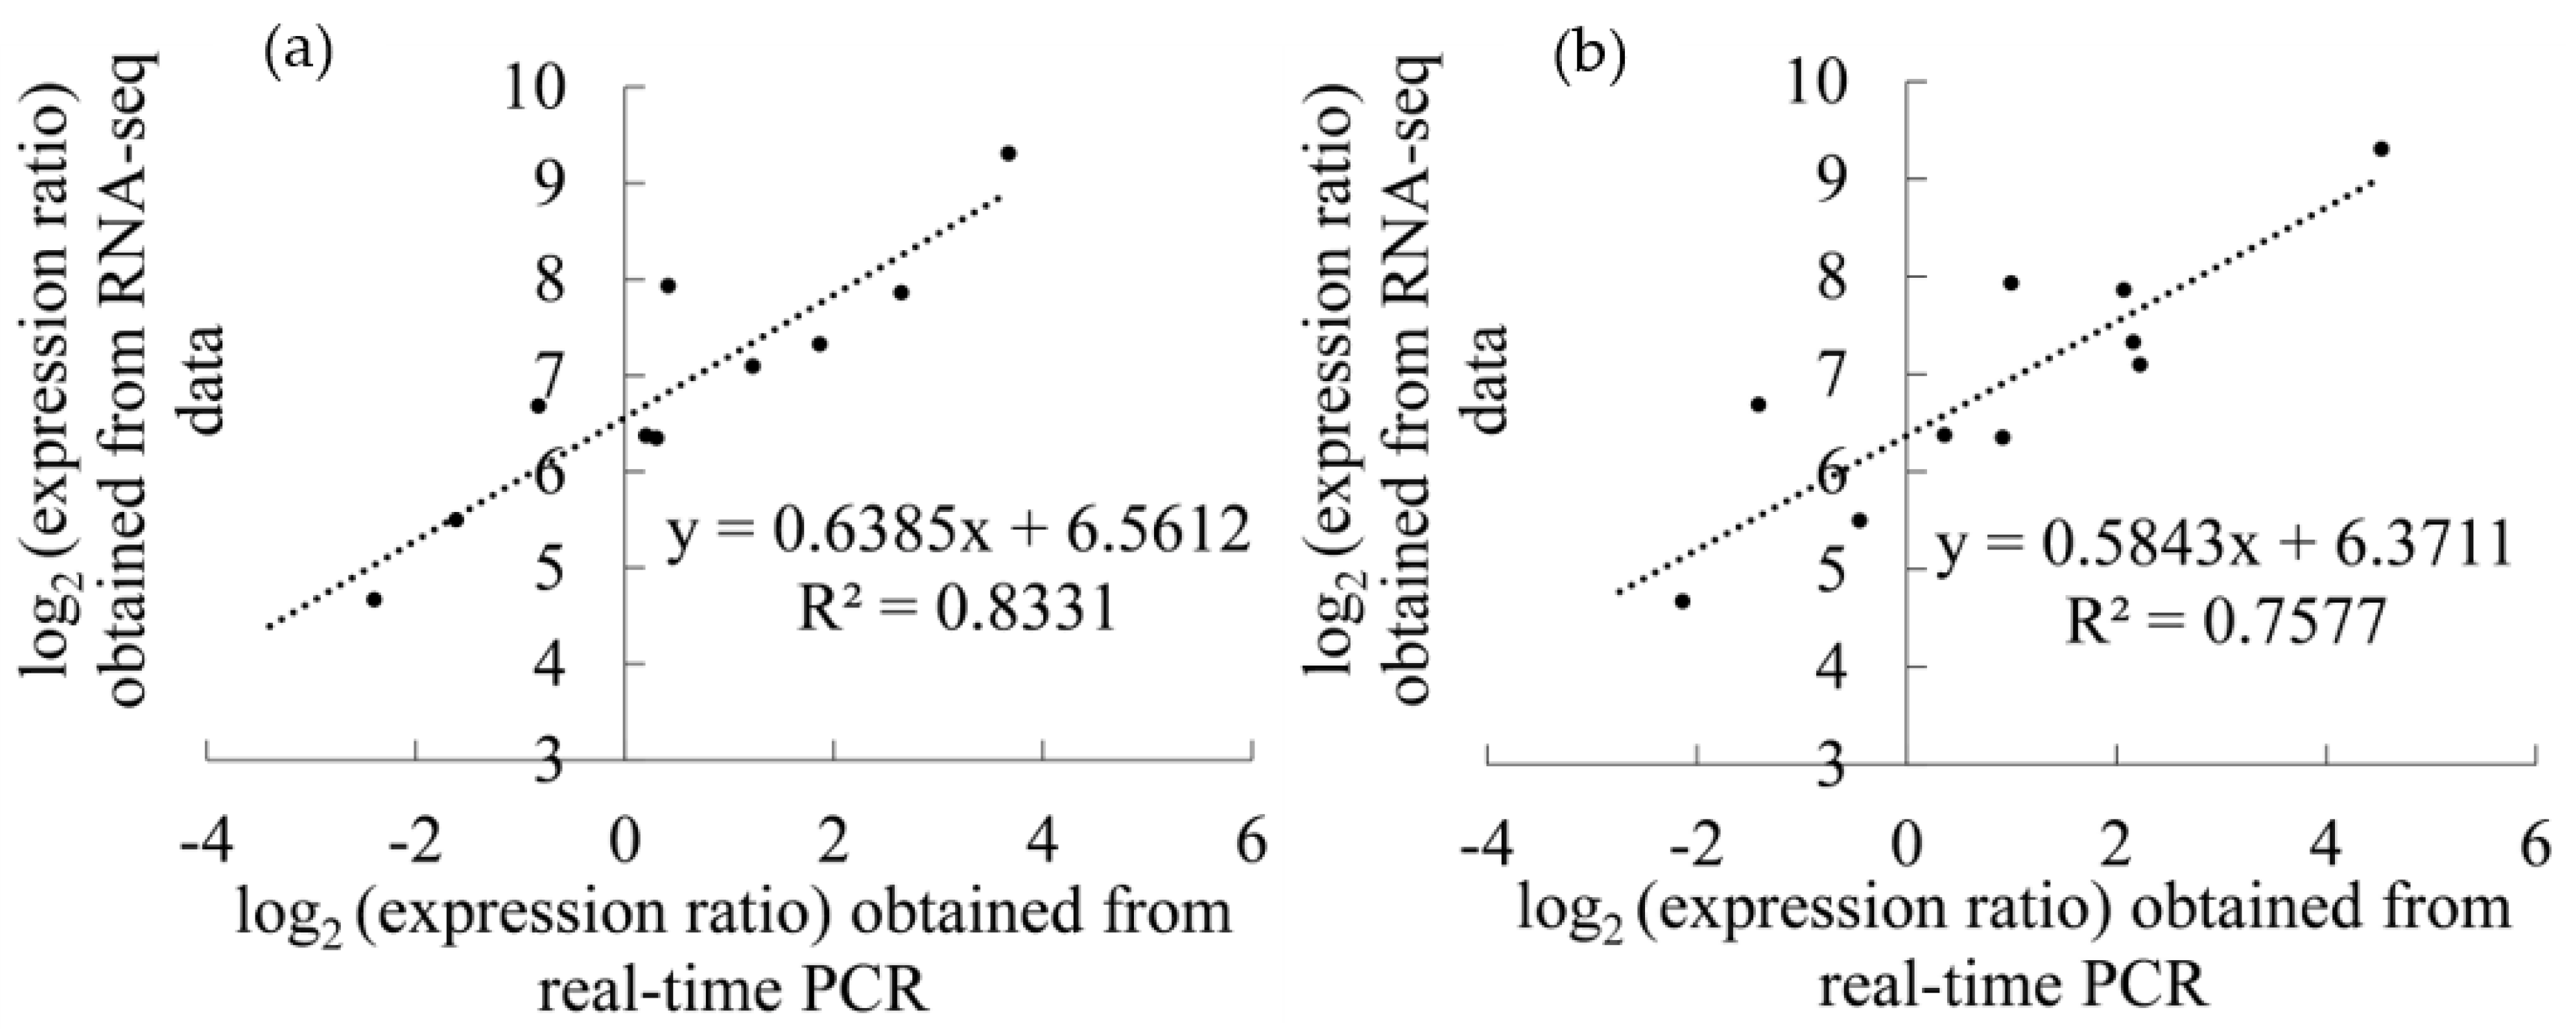
3.6. Real-Time PCR Validation

Ten genes were randomly selected for real-time PCR validation, and the results are shown in Figure 6a,b. The linear relationship between transcriptome data and real-time PCR was significant (r2020 = 0.9127, r2021 = 0.8705), which verified the reliability of the transcriptome results.

4. Discussion

4.1. The Ca and Mg Foliar Fertilizer Increased the Sugar Content in ‘Feizixiao’ Litchi Pulp

Mineral nutrition is an important factor affecting fruit quality, and different mineral elements have different effects on fruit quality. The increase in fruit Ca content facilitates the transport of carbohydrates to storage organs through the phloem, which can effectively increase the sugar content of fruit [41]. Moreover, the photosynthetic efficiency of leaves is also related to the sugar content of fruits. Mg content in leaves is involved in protein synthesis, and 35% of Mg exists in chloroplasts. Mg deficiency leads to a reduction in chlorophyll content, reduces the accumulation of photosynthetic products in plants, and inhibits the synthesis and transport of carbohydrates [42]. Therefore, foliar spraying of Ca and Mg fertilizer may promote the formation of chloroplasts and lead to enhanced photosynthesis. As a result, more photosynthates are transported to the fruit, making the sugar content of the treated fruit higher than that of the control. In this study, foliar application of Ca and Mg fertilizer significantly increased fruit fructose content, thus increasing soluble sugar content in ‘Feizixiao’ litchi pulp. Similar results have also been reported in which the application of lime, which is mainly composed of Ca, and Mg improved the yield and quality of citrus, as well as the content of soluble solids in fruit [43,44].

4.2. Ca and Mg Foliar Fertilizer Regulates the Sugar Content in ‘Feizixiao’ Litchi Pulp by Altering the Expression of Sugar Metabolism-Related Enzyme Genes

Transcriptome sequencing technology has advantages such as high throughput, low cost, and high efficiency. In this study, using transcriptome sequencing technology, we analyzed the differentially expressed gene profiles in ‘Feizixiao’ litchi pulp from the treated and control fruit. We found that at 69 DAA, sucrose-metabolism-related enzyme genes were downregulated, whereas the fructose content was increased in the treated fruit, which indicates that sucrose synthase and sucrose phosphate synthase genes may play a dominant role in promoting fruit to accumulate more hexose by inhibiting sucrose synthesis.
During fruit ripening, hexokinase activity is negatively correlated with hexose content [45]. Similar results were also found in a study on grapes [46], which showed that a low hexose content was accompanied by high hexokinase activity in the early growth and development of grapes. Hexokinase activity decreased sharply, and hexose content increased at maturity. Moreover, the hexokinase gene may modulate fruit sugar content by regulating the expression of sucrose synthase and invertase genes. Our results suggest that fertilizer treatment downregulates hexokinase gene expression at 69 DAA, which may lead to decreased hexokinase activity, thus limiting hexose metabolism and ultimately resulting in hexose accumulation. Additionally, fructokinase specifically catalyzes the phosphorylation of fructose, but this study found that all fructokinase genes were expressed at low levels and that the expression levels were not significantly different between the treated and control fruit. Although hexokinase can also catalyze the phosphorylation of fructose, it mainly catalyzes the phosphorylation of glucose. In our study, the fertilizer treatment downregulated the expression of the hexokinase gene, and although the phosphorylation of glucose and fructose was partially inhibited, hexokinase has a higher affinity with glucose and glucose is the primary source of carbon and energy for most plants [47,48], resulting in more glucose being consumed through hexokinase phosphorylation. Overall, there was a significant increase in fructose content but no significant change in glucose content in the treated fruit.

5. Conclusions

The Ca and Mg foliar fertilizer resolved the phenomenon of “sugar receding” in ‘Feizixiao’ litchi pulp. On the one hand, the fertilizer treatment downregulated the expression of sucrose synthase and sucrose phosphate synthase genes at 69 DAA to inhibit sucrose synthesis and promote hexose accumulation. On the other hand, the treatment downregulated the expression of the hexokinase gene at 69 DAA to inhibit the flow of hexose to the EMP and PPP, promoting the accumulation of hexose. Since glucose is the main source of carbon and energy for plants and hexokinase has a higher affinity for glucose, the fructose content in the treated fruit increased significantly, whereas there was no significant change in glucose content. In conclusion, foliar spraying fertilizer treatment with Ca and Mg increased the total soluble sugar and fructose contents and improved litchi fruit quality at maturity.

Author Contributions

Investigation, J.P., J.D., W.M., T.C., X.S., H.L., X.L. and K.Z.; data curation, J.P.; writing—original draft, J.P.; writing—review and editing, K.Z. All authors have read and agreed to the published version of the manuscript.

Funding

National Natural Science Foundation of China (No. 31960570).

Institutional Review Board Statement

Not applicable.

Informed Consent Statement

Not applicable.

Data Availability Statement

Not applicable.

Conflicts of Interest

The authors declare no conflict of interest.

References

  1. Menzel, C. The physiology of growth and cropping in lychee. Acta Hortic. 2001, 558, 175–184. [Google Scholar] [CrossRef]
  2. Wang, Z.; Yuan, M.L.; Li, S.J.; Gao, D.; Zhou, K.B. Applications of Mg affect pericarp colour in the Feizixiao lychee. J. Hortic. Sci. Biotechnol. 2017, 92, 559–567. [Google Scholar] [CrossRef] [Green Version]
  3. Wang, H.C.; Huang, H.B.; Huang, X.M.; Hu, Z.Q. Sugar and acid compositions in the arils of Litchi chinensis Sonn.: Cultivar differences and evidence for the absence of succinic acid. J. Hortic. Sci. Biotechnol. 2006, 81, 57–62. [Google Scholar] [CrossRef]
  4. Braun, D.M.; Wang, L.; Ruan, Y.L. Understanding and manipulating sucrose phloem loading, unloading, metabolism, and signalling to enhance crop yield and food security. J. Exp. Bot. 2014, 65, 1713–1735. [Google Scholar] [CrossRef] [PubMed] [Green Version]
  5. Kaur, G.; Das, N. An isoform of sucrose synthase involved in sink strength of potato (Solanum tuberosum L.): Molecular cloning, sequence analyses, 3-D structure, crucial motifs and expression. S. Afr. J. Bot. 2022, 149, 446–457. [Google Scholar] [CrossRef]
  6. Ruan, Y.L.; Jin, Y.; Yang, Y.J.; Li, G.J.; Boyer, J.S. Sugar input, metabolism, and signaling mediated by invertase: Roles in development, yield potential, and response to drought and heat. Mol. Plant 2010, 3, 942–955. [Google Scholar] [CrossRef] [PubMed]
  7. Granot, D.; Kelly, G.; Stein, O.; David-Schwartz, R. Substantial roles of hexokinase and fructokinase in the effects of sugars on plant physiology and development. J. Exp. Bot. 2014, 65, 809–819. [Google Scholar] [CrossRef] [PubMed] [Green Version]
  8. Aguilera-Alvarado, G.P.; Sánchez-Nieto, S. Plant hexokinases are multifaceted proteins. Plant Cell Physiol. 2017, 58, 1151–1160. [Google Scholar] [CrossRef] [Green Version]
  9. Granot, D. Putting plant hexokinases in their proper place. Phytochemistry 2008, 69, 2649–2654. [Google Scholar] [CrossRef]
  10. Singh, M.; Gupta, A.; Laxmi, A. Glucose control of root growth direction in Arabidopsis thaliana. J. Exp. Bot. 2014, 65, 2981–2993. [Google Scholar] [CrossRef]
  11. Zhao, B.; Qi, K.; Yi, X.; Chen, G.; Liu, X.; Qi, X.; Zhang, S. Identification of hexokinase family members in pear (Pyrus × bretschneideri) and functional exploration of PbHXK1 in modulating sugar content and plant growth. Gene 2019, 711, 143932. [Google Scholar] [CrossRef] [PubMed]
  12. Li, M.; Feng, F.; Cheng, L. Expression patterns of genes involved in sugar metabolism and accumulation during apple fruit development. PLoS ONE 2012, 7, e33055. [Google Scholar] [CrossRef] [PubMed] [Green Version]
  13. Sinha, A.; Jawandha, S.K.; Gill, P.; Singh, H. Influence of pre-harvest sprays of Ca nitrate on storability and quality attributes of plum fruits. J. Food Sci. Technol. 2019, 56, 1427–1437. [Google Scholar] [CrossRef] [PubMed]
  14. Recasens, I.; Benavides, A.; Puy, J.; Casero, T. Pre-harvest Ca treatments in relation to the respiration rate and ethylene production of ‘Golden Smoothee’ apples. J. Sci. Food Agric. 2004, 84, 765–771. [Google Scholar] [CrossRef]
  15. Wang, Y.; Xie, X.; Long, L.E. The effect of postharvest Ca application in hydro-cooling water on tissue Ca content, biochemical changes, and quality attributes of sweet cherry fruit. Food Chem. 2014, 160, 22–30. [Google Scholar] [CrossRef]
  16. Balic, I.; Ejsmentewicz, T.; Sanhueza, D.; Silva, C.; Peredo, T.; Olmedo, P.; Barros, M.; Verdonk, J.C.; Paredes, R.; Meneses, C.; et al. Biochemical and physiological study of the firmness of table grape berries. Postharvest Biol. Physiol. 2014, 93, 15–23. [Google Scholar] [CrossRef]
  17. Khaliq, G.; Mohamed, T.M.M.; Ali, A.; Ding, P.; Ghazali, H.M. Effect of gum arabic coating combined with Ca chloride on physico-chemical and qualitative properties of mango (Mangifera indica L.) fruit during low temperature storage. Sci. Hortic. 2015, 190, 187–194. [Google Scholar] [CrossRef]
  18. Wang, Y.; Long, L.E. Physiological and biochemical changes relating to postharvest splitting of sweet cherries affected by Ca application in hydrocooling water. Food Chem. 2015, 181, 241–247. [Google Scholar] [CrossRef]
  19. Cakmak, I.; Hengeler, C.; Marschner, H. Changes in phloem export of sucrose in leaves in response to phosphorus, potassium and Mg deficiency in bean plants. J. Exp. Bot. 1994, 45, 1251–1257. [Google Scholar] [CrossRef]
  20. Hermans, C.; Bourgis, F.; Faucher, M.; Strasser, R.J.; Delrot, S.; Verbruggen, N. Mg deficiency in sugar beets alters sugar partitioning and phloem loading in young mature leaves. Planta 2005, 220, 541–549. [Google Scholar] [CrossRef]
  21. Farhat, N.; Khouni, A.; Zorrig, W.; Smaoui, A.; Abdelly, C.; Rabhi, M. Effects of Mg deficiency on photosynthesis and carbohydrate partitioning. Acta Physiol. Plant. 2016, 38, 145. [Google Scholar] [CrossRef]
  22. Chen, Z.C.; Peng, W.T.; Li, J.; Liao, H. Functional dissection and transport mechanism of Mg in plants. Semin. Cell Dev. Biol. 2018, 74, 142–152. [Google Scholar] [CrossRef] [PubMed]
  23. Liao, H.Z.; Lin, X.K.; Du, J.J.; Peng, J.J.; Zhou, K.B. Transcriptomic analysis reveals key genes regulating organic acid synthesis and accumulation in the pulp of Litchi chinensis Sonn. cv. Feizixiao. Sci. Hortic. 2022, 303, 111220. [Google Scholar] [CrossRef]
  24. Yang, Z.Y.; Wang, T.D.; Wang, H.C.; Huang, X.M.; Qin, Y.H.; Hu, G.B. Patterns of enzyme activities and gene expressions in sucrose metabolism in relation to sugar accumulation and composition in the aril of Litchi chinensis Sonn. J. Plant Physiol. 2013, 170, 731–740. [Google Scholar] [CrossRef] [PubMed]
  25. Grabherr, M.; Haas, B.; Yassour, M.; Levin, J.; Thompson, D.; Amit, I.; Adiconis, X.; Fan, L.; Raychowdhury, R.; Zeng, Q.; et al. Full-length transcriptome assembly from RNA-Seq data without a reference genome. Nat. Biotechnol. 2011, 29, 644–652. [Google Scholar] [CrossRef] [Green Version]
  26. Kanehisa, M.; Goto, S.; Kawashima, S.; Okuno, Y.; Hattori, M. The KEGG resource for deciphering the genome. Nucleic Acids Res. 2004, 32, D277–D280. [Google Scholar] [CrossRef] [Green Version]
  27. Polashock, J.; Arora, R.; Peng, Y.; Naik, D.; Rowland, L. Functional identification of a C-repeat binding factor transcriptional activator from blueberry associated with cold acclimation and freezing tolerance. J. Am. Soc. Hortic. Sci. 2010, 135, 40–48. [Google Scholar] [CrossRef] [Green Version]
  28. Sato, A.; Okubo, H.; Saitou, K. Increase in the expression of an alpha-amylase gene and sugar accumulation induced during cold period reflects shoot elongation in hyacinth bulbs. J. Am. Soc. Hortic. Sci. 2006, 131, 185–191. [Google Scholar] [CrossRef]
  29. Boyle, E.I.; Weng, S.; Gollub, J.; Jin, H.; Botstein, D.; Cherry, J.M.; Sherlock, G. GO: TermFinder—Open source software for accessing gene ontology information and finding significantly enriched gene ontology terms associated with a list of genes. Bioinformatics 2004, 20, 3710–3715. [Google Scholar] [CrossRef] [Green Version]
  30. Li, L.; Stoeckert, C.; Roos, D. OrthoMCL: Identification of ortholog groups for eukaryotic genomes. Genome Res. 2003, 13, 2178–2189. [Google Scholar] [CrossRef]
  31. Natale, D.; Shankavaram, U.; Galperin, M.; Wolf, Y.; Aravind, L.; Koonin, E. Towards understanding the first genome sequence of a crenarchaeon by genome annotation using clusters of orthologous groups of proteins (COGs). Genome Biol. 2000, 1, RESEARCH0009. [Google Scholar] [CrossRef] [PubMed] [Green Version]
  32. O’Donovan, C.; Martin, M.; Gattiker, A.; Gasteiger, E.; Bairoch, A.; Apweiler, R. High-quality protein knowledge resource: SWISS-PROT and TrEMBL. Brief. Bioinform. 2002, 3, 275–284. [Google Scholar] [CrossRef] [PubMed]
  33. Bateman, A.; Birney, E.; Cerruti, L.; Durbin, R.; Etwiller, L.; Eddy, S.; Jones, S.; Howe, K.; Marshall, M.; Sonnhammer, E. The Pfam protein families database. Nucleic Acids Res. 2002, 30, 276–280. [Google Scholar] [CrossRef] [PubMed] [Green Version]
  34. Finn, D.; Clements, J.; Eddy, S. HMMER web server: Interactive sequence similarity searching. Nucleic Acids Res. 2011, 39, W29–W37. [Google Scholar] [CrossRef] [Green Version]
  35. Love, M.I.; Huber, W.; Anders, S. Moderated estimation of fold change and dispersion for RNA-Seq data with DESeq2. Genome Biol. 2014, 15, 550. [Google Scholar] [CrossRef] [Green Version]
  36. Varet, H.; Brillet-Guéguen, L.; Coppée, J.; Dillies, M. SARTools: A DESeq2- and edgeR-based R pipeline for comprehensive differential analysis of RNA-Seq data. PLoS ONE 2016, 11, e0157022. [Google Scholar] [CrossRef] [Green Version]
  37. Chen, C.; Chen, H.; Zhang, Y.; Thomas, H.R.; Frank, M.H.; He, Y.; Xia, R. TBtools: An integrative toolkit developed for interactive analyses of big biological data. Mol. Plant 2020, 13, 1194–1202. [Google Scholar] [CrossRef]
  38. Rozen, S.; Skaletsky, H. Primer3 on the WWW for general users and for biologist programmers. Methods Mol. Biol. 2000, 132, 365–386. [Google Scholar] [CrossRef] [Green Version]
  39. Livak, K.J.; Schmittgen, T.D. Analysis of relative gene expression data using real-time quantitative PCR and the 2(-Delta Delta C(T)) method. Methods 2001, 25, 402–408. [Google Scholar] [CrossRef]
  40. Jiang, L.; Ye, W.W.; Situ, J.J.; Chen, Y.B.; Yang, X.Y.; Kong, G.H.; Liu, Y.Y.; Tinashe, R.J.; Xi, P.G.; Wang, Y.C.; et al. A Puf RNA-binding protein encoding gene PlM90 regulates the sexual and asexual life stages of the litchi downy blight pathogen Peronophythora litchii. Fungal Genet. Biol. 2017, 98, 39–45. [Google Scholar] [CrossRef]
  41. Liaquat, M.; Ahmad, S.; Khan, A.S.; Ahmed, R. Reduction in fruit rot and enhancement in fruit quality of kinnow mandarin by Ca chloride application. Pak. J. Agric. Sci. 2019, 56, 367–376. [Google Scholar] [CrossRef]
  42. Wang, Z.; Hassan, M.U.; Nadeem, F.; Wu, L.; Zhang, F.; Li, X. Mg fertilization improves crop yield in most production systems: A meta-analysis. Front. Plant Sci. 2020, 10, 1727. [Google Scholar] [CrossRef] [PubMed] [Green Version]
  43. Zhang, S.W.; Yang, W.H.; Muneer, M.A.; Ji, Z.J.; Tong, L.; Zhang, X.; Li, X.X.; Wang, W.Q.; Zhang, F.S.; Wu, L.Q. Integrated use of lime with Mg fertilizer significantly improves the pomelo yield, quality, economic returns and soil physicochemical properties under acidic soil of southern China. Sci. Hortic. 2021, 290, 110502. [Google Scholar] [CrossRef]
  44. Xu, D.H.; Carswell, A.; Zhu, Q.C.; Zhang, F.S.; Vries, W.D. Modelling long-term impacts of fertilization and liming on soil acidification at Rothamsted experimental station. Sci. Total Environ. 2020, 713, 136249. [Google Scholar] [CrossRef]
  45. D’Aoust, M.A.; Yelle, S.; Nguyen-Quoc, B. Antisense inhibition of tomato fruit sucrose synthase decreases fruit setting and sucrose unloading capacity of young fruit. Plant Cell 1999, 11, 2407–2418. [Google Scholar] [CrossRef] [Green Version]
  46. Wang, X.Q.; Li, L.M.; Yang, P.P.; Gong, C.L. The role of hexokinases from grape berries (Vitis vinifera L.) in regulating the expression of cell wall invertase and sucrose synthase genes. Plant Cell Rep. 2014, 33, 337–347. [Google Scholar] [CrossRef]
  47. Rolland, F.; Baena-Gonzalez, E.; Sheen, J. Sugar sensing and signaling in plants: Conserved and novel mechanisms. Annu. Rev. Plant Biol. 2006, 57, 675–709. [Google Scholar] [CrossRef] [Green Version]
  48. Sheen, J. Master regulators in plant glucose signaling networks. J. Plant Biol. 2014, 57, 67–79. [Google Scholar] [CrossRef]
Figure 1. Dynamic changes in sugar contents in ‘Feizixiao’ litchi pulp between the treated and control group in 2020 and 2021: (a,b) fructose; (c,d) glucose; (e,f) sucrose; (g,h) soluble sugar. ** indicates a significant difference at the p < 0.01 level, * indicates a significant difference at the p < 0.05 level. Error bars are expressed as standard errors.
Horticulturae 08 01197 g001
Figure 2. The length distribution of unigenes and transcripts obtained by transcriptome sequencing in ’Feizixiao’ litchi pulp in 2020.
Horticulturae 08 01197 g002
Figure 3. Statistical map of the number of unigene annotations obtained from all the ‘Feizixiao’ litchi samples by comparing to KEGG, NR, SwissProt, TrEMBL, KOG, GO, and Pfam databases in 2020.
Horticulturae 08 01197 g003
Figure 4. Volcano diagram, KEGG, and GO enrichment analysis diagram of differentially expressed genes in ‘Feizixiao’ litchi pulp obtained by comparing the treated and control groups at 69 DAA in 2020: (a) Volcano diagram; (b,c) KEGG and GO enrichment analysis diagram.
Horticulturae 08 01197 g004
Figure 5. Map of the sugar metabolism pathway and heatmap of related differentially expressed genes in ‘Feizixiao’ litchi pulp between the treated and control groups in 2020.
Horticulturae 08 01197 g005
Figure 6. Correlation analysis between real-time PCR and transcriptome data: (a) 2020; (b) 2021.
Horticulturae 08 01197 g006
Table 1. Internal reference and real-time PCR gene primers.
Primer NamesLeft Primer Sequences (5′ to 3′)Right Primer Sequences (5′ to 3′)Primer Efficiency
Cluster-6206.78756CTGCCTCCATTTGTGGCTATCAAAATCAAGCTCGAGCACA1.097
Cluster-6206.79539TGGGTTTTGAGAAAGGTTGGCATCGGTACTCTCCCAAGGA1.090
Cluster-6206.80820GACTTGTGGCCTTCCAACATATTTTATGCCAGTGGCTTGG1.078
Cluster-6206.70575AAGCTTTGCTCAAGGTGGAAGTCATTGGAGAAGGGACGA1.028
Cluster-6206.77750TCCTCCTTCATTGGGTCAAGCCGATTGTGATCCTCCACTT1.069
Cluster-6206.71042GGGAGAAGTCGTACGCAGAGTTTTCAGTTTCGGTGGAACC1.083
Cluster-6206.88230GTCGCCCAAAAGATTGTTGTGCAAAGACCACCACACGTTA1.074
Cluster-6206.71164GGGGAGCTTCTCAGCTTTTTCCAGTGCCCTTCATACCAGT1.086
Cluster-6206.79974TCTATCTGGGCATGGGAGTCAAGCTTCAAAGGACCCACCT1.061
Cluster-6206.77879AATCTTGCCCTCAACATTGCGAGCACCAGCCTTAACAAGC0.990
actinAGTTTGGTTGATGTGGGAGACTGGCTGAACCCGAGATGAT1.085
Table 2. Statistical results of transcriptome sequencing of ‘Feizixiao’ litchi pulp in 2020.
SampleRaw ReadsClean ReadsClean Base (G)Error Rate (%)Q20 (%)Q30 (%)GC Content (%)
A1-146,959,76045,551,6446.830.0298.3094.8847.25
A1-244,303,09843,024,6466.450.0298.3495.0045.96
A1-346,957,05245,774,7906.870.0298.2994.8645.91
A2-142,158,76640,912,0186.140.0298.4095.0445.12
A2-242,572,23841,238,5166.190.0298.5095.3345.35
A2-345,151,58443,462,9486.520.0298.3594.9845.43
B2-142,733,51841,547,0746.230.0298.3494.9845.19
B2-252,085,00450,219,5507.530.0298.3594.9945.45
B2-350,267,75448,917,7607.340.0298.2194.5945.70
Note: Q20: The percentage of the number of bases with a Qphred value not less than 20 in the total number of bases. Q30: The percentage of the number of bases with a Qphred value not less than 30 in the total number of bases. GC Content: The percentage of the sum of the quantities of G and C in the total number of bases in high-quality reads. A1-1, A1-2, and A1-3 represent 35 d after anthesis, A2-1, A2-2, and A2-3 represent 69 d after anthesis of control, and B2-1, B2-2, and B2-3 represent 69 d after anthesis of treatment.
Publisher’s Note: MDPI stays neutral with regard to jurisdictional claims in published maps and institutional affiliations.

