
A Comparative Review of Models for All-Solid-State Li-Ion Batteries


Department of Mechanical and Industrial Engineering, Università degli Studi di Brescia, Via Branze 38, 25123 Brescia, Italy
*
Author to whom correspondence should be addressed.
Batteries 2024, 10(5), 150; https://doi.org/10.3390/batteries10050150
Submission received: 19 March 2024
/
Revised: 13 April 2024
/
Accepted: 24 April 2024
/
Published: 29 April 2024
(This article belongs to the Section Battery Modelling, Simulation, Management and Application)
Abstract
:In recent times, there has been significant enthusiasm for the development of all-solid-state Li-ion batteries. This interest stems from a dual focus on safety—addressing concerns related to toxic and flammable organic liquid electrolytes—and the pursuit of high energy density. While liquid electrolyte batteries currently constitute the vast majority of commercial cells, solid electrolyte batteries show great promise. In parallel with experimental research, computational models clarify several fundamental physics that take place throughout battery operations. Giving up on reviewing a broad screening of the existing literature, we set out to select here a few highly relevant models, emphasizing some fundamental conceptual advancements and offering an in-depth and critical insight into the current state of the art. The papers we selected aim at providing the reader with a tangible and quantitative understanding of how all-solid-state Li-ion batteries operate, including the different mechanisms at play and the mathematical tools required to model the pertinent physics and mechanics.
1. Introduction
Numerous instances demonstrate that traditional Li-ion batteries, which rely on liquid organic electrolytes and porous electrodes, are susceptible to chemo-mechanical degradation. They also face environmental and safety concerns, due to the flammability of the toxic liquid electrolytes. Hazardous leaks do not occur in all-solid-state batteries (ASSBs) [1,2], since they exploit solid electrolytes, broadly categorized in polymer, inorganic, and organic–inorganic composite [3]. In this note, we restrict our focus on thin-film ASSBs, equipped either with lithium phosphorous oxy-nitride “LiPON” or with lithium lanthanum zirconium oxide “LLZO” () electrolytes.
Largely funded international projects [4] and strategic action plans (such as the European Battery 2030+ initiative) assess how the scientific community trusts and supports the development of storage systems to meet the social quest for decarbonization. ASSBs are among the best next-generation candidates, provided that they achieve ultra-high performance while meeting sustainability and safety. Among the shortcomings of solid electrolytes cells, the technical ones that currently limit the industrialization of ASSBs appear to be (i) achieving a substantial ionic conductivity at ambient temperature; (ii) reducing the resistance at the interface between the active material and electrolyte [5,6]; and (iii) eliminating the mechanical damage [7,8] and the dendritic growth from anodic lithium foils [9,10,11]. Experimental investigations are presently mainly focused on key materials and structures [12,13,14], such as composite electrolyte/electrode morphologies [15] or thin-film glass layers [16].
Computational modeling and simulations, which operate at different scales and complement experimental research, allow a profound understanding of the interconnected physics that rule the response of ASSBs. Digital twins enable the comprehension of processes and the identification of limiting factors. Several advanced mathematical models have been documented in the literature. Unlike previous studies [1,2,17,18], a broad screening of the existing literature is not the goal of this review. It does not consist in a brief and cursory summary of various pieces of work in the literature, because it would fail to give the reader a physical and quantitative insight into the functioning principles of ASSBs. Although we realize that it is always hard, if not even impossible, to categorize the whole bibliography on a subject and undoubtedly identify those cornerstone papers that changed the flow of the subject itself, in this publication we detail and compare four different approaches [19,20,21,22] because of their significant ideas. A pictorial view of the mathematical framework that characterize each of those approaches is portrayed in Figure 1.
Fabre et al. [19] developed a one-dimensional model of a Li/LiPON thin-film microbattery, described in Section 2.1. The ionic transfer is modeled via a single-ion conduction within the solid electrolyte. This results in a uniform distribution of lithium ions () throughout the solid electrolyte, with concentrations determined by the initial conditions and established by the overall electroneutrality in the electrolyte (electroneutrality is extensively discussed in [23] (see also [24])). In single-ion conduction, the negative vacant positions in the lattice are tightly bound and do not flow. Since ionic mobility is not governed by a concentration gradient, the model’s main goal is to identify the potential drop, which is primarily determined by Ohm’s law.
An advanced model framework for ASSBs was further proposed by Landstorfer and co-workers in [20] and is analyzed in Section 2.2. While using a single-ion conduction ionic transport model as in [19], the authors enriched the formulation of the interface mechanisms. Standing from a rigorous thermodynamic setting, the interface conditions ultimately lead to non-Butler–Volmer type equations. Capacitance within interfaces was also captured in the third paper accounted for in this review, authored by Raijmakers and co-workers in [21]. Their key contribution lies in an innovative two-mechanism conduction model, wherein both interstitial lithium and negative vacancies move autonomously. This results in establishing a concentration gradient at a steady state, resembling the distribution seen in liquid electrolytes [25,26].
The double mechanism in ionic transport has been further developed in the last contribution discussed here, authored by Cabras et al. [22]. Since the unbalanced negative charges associated with a vacancy in the LiPON lattice cannot flow, the model proposed in [21] appears to be unphysical. Rather, Cabras et al. [22] assume that some positive ions hop to occupy neighboring empty vacancies, while the rest of the Li+ ions transition into a meta-stable interstitial phase of the same kind as described in [21]. The complex explanation of interfaces has also been incorporated from [21].
This review paper is organized as follows. A brief theoretical summary of models and their governing equations for ASSBs is proposed in Section 2. An experimental benchmark, taken from [27], is devised in Section 3. The finite element solution scheme provides numerical approximations for the electric potential profiles, interface currents, fluxes, and concentration profiles. These quantities of interest were used to compare the more recent model in [22] against the antecedent published in [21]. In Section 4, the article provides an overview of the objectives pursued. It also outlines the future plans that are intended to be implemented. Final remarks that summarize the key points discussed conclude the paper.
2. Models and Their Governing Equations
Several mathematical formulations, some of which were examined in [17,18], concern the battery microstructure, which simplistically can be categorized into two types, i.e., thin films and porous electrodes. Electrodes made of porous materials have been scrutinized by a broad set of models, including pseudo-2D [28,29], multiscale [30,31] and fine-grained [32], accounting for the different phases and attempting to capture realism either in liquid [33] or solid electrolytes [15].
In thin-film batteries, a planar geometry is commonly employed. This is because the ratio between the lateral dimension and the thickness is sufficiently large to treat the lateral dimension as infinite, as illustrated in Figure 1. Additionally, electrodes and electrolytes can be adequately represented as homogeneous planar materials. As a result, one-dimensional mathematical models are typically used to describe thin-film batteries.
An all-solid-state electrochemical cell incorporates two electrodes and a solid electrolyte, as depicted schematically in Figure 1. Li-ions are extracted from the cathode (positive electrode) during charge and inserted back during discharge. The opposite holds for the anode (negative electrode). Assuming to be the cathode material, the fundamental electrochemical charge-transfer reaction is written as
Since the anode is a lithium foil, the deposition and extraction processes at the negative surface are described by the following reaction:
Figure 2 depicts the structure of the solid electrolyte: is the lithium bound to the non-bridging oxygen atoms, ions have motion capabilities (either transferred to the meta-stable interstitial state or hopping). The uncompensated negative charges are associated with vacancies formed in the LiPON matrix. The saturation concentration of host sites is determined by the stoichiometric composition of the electrolyte material. This concentration is attained in the ideal scenario of a zero absolute temperature, as vanishing conductivity results from immobile ions. On the contrary, under standard conditions, some of the Li ions are thermally excited, and the chemical ionization reaction
occurs, and being the forward and backward rate constants for the ionization and recombination reaction, respectively.
A quantitative determination of the kinetics of mobile ionic species allows a prediction of the response of electrochemical cells. A electrode contains lithium oxide, and the lithium is an ion as part of a lithium salt. is intercalated in the cathode as an ion “shielded” by its own electron. It is denoted with to stress its ionic nature, while distinguishing it from mobile charges in the electrolyte.
In the following, we give an overview of four electrochemical models proposed in the literature, showcasing numerical results covering electric potential profiles, interfacial currents, fluxes, and concentration profiles. In terms of notation, T stands for the absolute temperature, F for Faraday’s constant, for the diffusivity of species ; symbol denotes the identity matrix.
2.1. One-Dimensional Single-Ion Conduction Models [19]
A one-dimensional model of a Li/LiPON thin-film microbattery was developed by Fabre et al. [19] and is depicted schematically in Figure 1a. The x-axis, which points out the characteristic lengths of the model is directed from the negative towards the positive electrode; the interface between the negative electrode and the solid electrolyte hosts its origin.
The authors aimed at keeping their model as simple as possible by introducing proper assumptions in order to come up with a reduced set of input parameters that can be measured from purposely designed experiments. The model is isothermal with no self-heating, neglects volume alterations during charge/discharge, and assumes that redox activities occur solely on the surface area, which remains unchanged throughout cycling. The negative electrode is a metallic film of lithium with negligible ohmic losses. The ionic transfer in the solid electrolyte is described by a single-ion conduction model; as such, the concentration of lithium ions across the solid electrolyte is uniform. This property straightforwardly comes out as long as electroneutrality approximation holds, a property of the governing equations largely discussed in [23,25,26].
Accordingly, the model traces lithium diffusion and electron migration in the positive electrode, single ions’ migration in the solid electrolyte, and charge-transfer kinetics at the electrode/electrolyte interfaces. Three unknown fields are required, the concentration of lithium in the positive electrode and the electric potentials and in the solid electrolyte and in the cathode, respectively.
The electric potentials in the positive electrode and in the solid electrolyte are related to the current densities and by means of Ohm’s law, through the electrical and ionic conductivities, respectively:
The third governing equation in the positive electrode is a planar solid-state diffusion equation, which describes the (neutral, in the sense detailed beforehand of a shielded positive ion) transport of lithium in the electrode:
with diffusion coefficient . A concentration-dependent ionic diffusion coefficient was studied in [19], which resulted in more accurate outcomes.
Denoting with the outward normal to the surface at the boundary, the two boundary conditions required for Equation (4c) are the lithium flux density at the reaction surface and the zero-flux condition for lithium at the electrode/collector interface:
The conditions for and , either at the anode–electrolyte () or at the electrolyte–cathode () interfaces
are modeled via Butler–Volmer equations in Fabre et al. [19], in the form
with s either or and the so-called anodic (cathodic) charge transfer coefficient, usually both taken to be equal to . The overpotential
is the difference between , i.e., the electric potential jump at the electrolyte/electrode interface, and the open-circuit potential (OCP). The latter can either be measured experimentally or calculated theoretically as in [34]. The exchange current is given by:
where and are the forward and backward reaction rate constants for the reaction (2), is the saturation concentration of lithium in the electrolyte. The exchange current is given by:
where and are the forward and backward reaction rate constants for the reaction (1), and represents the saturation’s lithium concentration within the cathode. Replacing with the initial, uniform concentration of lithium in the electrolyte, the exchange current densities and simplify as
where and are apparent rate constants for the negative electrode and are defined as the multiplication of the terms in Equations (9) and (10).
Galvanostatic boundary conditions are eventually imposed,
where is the given galvanostatic current flowing across the 1D battery. The potential is set arbitrarily to .
2.2. An Advanced Framework for Solid-Electrolyte Intercalation Batteries [20]
Landstorfer and co-workers studied in [20] a non-porous electrode and a crystalline solid electrolyte. As in [19], they assumed a solid electrolyte with one mobile species () and a uniform concentration of vacancies that remained unaltered in time. The model entailed a novel view of the electrode/solid electrolyte interface, which consisted of an intermediate layer and a space charge region within the electrolyte. A visual representation of the model is given in Figure 1b.
Once ions are randomly intercalated in the lattice structure of graphite or , a simple Fickian law diffusion analogous to Equation (4c) accounts for ionic transport. The electric potential is considered to be uniform within the electrodes, neglecting the ohmic loss (depicted in [19] via Equation (4b)), while influences the ionic transport in the electrolyte, ruled by non-equilibrium thermodynamics. The mass balance law relates the concentration of lithium to the actual flux of cations
Using the standard linear relationship of Onsager type (Here
is the expression taken in [20] for the mobility tensor. Note that Equation (14) differs a little from the choice made in [35,36]. This remark also gives a justification for the different outcomes on the final form of the mass balance equation.)
between the flux and the gradient of the electrochemical potential , the Clausis–Duhem inequality is satisfied a priori and thermodynamic consistency is granted, as largely discussed in [25,26]. The chemical potential is the functional derivative of the Gibbs free energy (or Helmholtz free energy according to [25,26]) with respect to the ionic concentration . The splitting of chemical and electrical potentials used in [20] is classical, as it is the free energy of mobile guest atoms interacting with a host medium, described by a regular solution model [37,38]. The electrochemical potential is eventually derived as the sum of the chemical and electrostatic potential as follows,
with . The chemical potential in (16b) collects the entropy of mixing and the energetic interactions. The term is the reference value of the chemical potential in the absence of interaction and entropic contributions. The energy of interaction between insertion sites and mobile guest species is characterized via the real-valued constant (see Equation (16b)), also called the exchange parameter [39]. means that mixing is purely entropic. The contribution , emanating from the excess Gibbs energy [35,36], may lead to phase segregation [40,41,42]. The mass flux to be inserted into the mass balance law (13) eventually holds:
The classical Nernst–Planck flux ( is the valency of ion , equal to for cations)
is attained in the dilute limit when the energy of interaction vanishes .
The whole electrolyte is thought to consist of a space charge region and a bulk region, as shown in Figure 1b. In the bulk region electroneutrality is imposed a priori, is defined by the (given and uniform) concentration of vacancies, and Ohm’s law (4a) allows the recovery of the electric potential. On the contrary, in proximity to the interfaces, where the concentrations of cations and anions differ, the electric potential is obtained by Gauss’s law, which provides, after constitutive prescriptions, the following Poisson equations:
where denotes the relative permittivity of the electrolyte and the vacuum permittivity. Local electroneutrality is not enforced in the space charge region [20]; rather, a weak (i.e., global) electroneutrality is prescribed in the whole electrolyte
thus allowing local deviations between cation and anion concentrations while keeping the overall number of cations and anions equal.
The interface between the electrodes and the solid electrolyte was modeled as two intermediate layers, treated as plate capacitors in terms of potential jumps and flux continuity. The authors borrowed from [43] the constitutive equation for potential jumps (defined as the potential at an electrode minus the one at the electrolyte) as
with given surface capacitances and , and permittivities and .
The boundary conditions on fluxes at electrode–solid electrolyte interfaces resemble Butler–Volmer equations (7) in a form originally presented in [44] and named generalized Frumkin–Butler–Volmer equations. They read:
where the reaction rate constants defined in reactions (1) and (2) are taken to be of Arrhenius type, i.e., , . The Gibbs energies of activation are further parameters of the model and relate to the OCP in Butler–Volmer equations.
2.3. An Advanced All-Solid-State Li-Ion Battery Model [21]
More complex one-dimensional mathematical models were proposed in a series of publications from Notten’s group [27,45,46] for a microbattery . In these studies, ionic transport in the solid electrolyte involved the ionization reaction (3) of immobile, oxygen-bound lithium to mobile ions and negatively charged vacancies. The transport of ions in the electrolyte and of in the positive electrode were accounted for, as well as the charge-transfer kinetics at both electrode/electrolyte interfaces. In their recent work [21], additional features were introduced, such as (i) a mixed ionic/electronic conductivity in the positive electrode; (ii) electrical double layers occurring at both electrode/electrolyte interfaces; and (iii) variable ionic and electronic diffusion coefficients that depend on the lithium concentration inside the positive electrode.
Figure 1c displays a discharge process. The anode consists of a lithium foil, the cathode of a film, while LiPON is used as the electrolyte material. The current collector is tied from the top of the . As for [19,20], this model is also isothermal (no self-heating). Redox processes exclusively take place at the interfaces between the electrolyte and the electrode layers. Volume expansion or shrinking in the electrolyte is disregarded, and it is assumed that the active surface area remains constant throughout cycling.
As a distinctive feature of this class of models, the ionic transfer in the solid electrolyte is not described by a single-ion conduction model and the concentration of lithium ions through the solid electrolyte is generally not uniform even though electroneutrality approximation holds. Defining with the fraction of Li at equilibrium, concentrations are denoted as follows: refers to mobile ions; to immobile lithium; to uncompensated negative charges; is the equilibrium concentration of the charge carriers; refers to the remaining immobile lithium. The overall rate of the charge carrier generation according to reaction (3) is
The ratio
is the equilibrium constant of reaction (3) and is related to the fraction of Li at equilibrium , see [21]. In addition to earlier models, two electrical double-layer capacitances and and a geometric capacitance were introduced in [21]. As in [20], double-layer capacitances attempt to capture the response of the space charge’s very narrow layers as for electric capacitors. Whereas the concept resembles [20], the implementation is different. Capacitors in [20] are described “in series”, whereas in [21], they are “in parallel” (compare Figure 1b and Figure 1c). In view of this assumption, the current at electrode/electrolyte interfaces splits into two terms, the faradaic contribution that drives the reduction/oxidation charge-transfer reactions (1) and (2) (), and the non-faradaic contribution that feeds the double layer (), with s either or .
During charging, the ions released from the positive surface must cross the solid electrolyte and are reduced into metallic Li at the anode. Electrons, generated by the charge-transfer reactions (1) and (2), flow across the Li foils and the electronic collector, with potential drops that follow Ohm’s law, similar to Equation (4a). The transport of ionic concentrations (this description of the transport of vacancies, in a form analogous to liquid electrolytes, appears to be questionable and is replaced by a different formulation in the novel approach to be presented in Section 2.4) and in the solid electrolyte is ruled by the mass continuity Equation (13), properly extended as
in order to account for the reaction rate (see Equation (23)). The generic mass flux , with , is constitutively described by the Nernst–Planck law (18), which carries the electric potential as a further unknown field. Coupling with an additional relation is thus mandatory to model the migration process. The most common selection for such an additional relation in battery modeling is the electroneutrality condition
By substituting Equation (18) into Equations (25a) and (25b) and subtracting Equation (25a) from Equation (25b), two independent partial differential equations eventually arise:
To be solved they require the initial concentrations for
and the Neumann conditions on fluxes at the left and right boundaries of the electrolyte
In the positive electrode a mixed ionic/electronic conductivity is considered. The mass balance equations that characterize the transport of ions and electrons are similar to Equations (25a) and (25b) for the solid electrolyte and is written as
The generic mass flux , is constitutively described by the Nernst–Planck law (18). This choice of independent motion of electrons and ionic intercalated lithium makes the governing equations different from Fabre’s [19] (Equations (4c) to be compared with (30a)).
Additionally, the model from [21] makes the positive electrode’s diffusion coefficients dependent on the concentration of ions. Experimental results show that the local electrochemical environment has a major impact on solid-state diffusion. The model further exploits the electroneutrality approximation inside the cathode, implying , and a space-time proportionality of the diffusion coefficients for and . Classical mathematical derivations allow one to retrieve Equation (4c) as the single PDE required to model the mass transport in the electrode, provided that the diffusivity is replaced by a suitable combination of electron and ionic diffusivities.
The initial concentration of the charge carrier at , when no concentration profile is developed yet, is equal to its equilibrium concentration
Neglecting the impact of geometric capacitance, the Neumann boundary conditions related to fluxes at both the left and right boundaries of the electrolyte result in:
with the given galvanostatic current flowing across the 1D battery, defined in Equation (12).
Non-faradaic current can be defined as
where . The jump is defined as the electrode potential minus the electrolyte potential. Equation (33) is compared with (21) in [20].
The faradaic current, as proposed in [21], arises from charge transfer kinetics. It takes a form that extends the Butler–Volmer Equation (7) to conditions influenced by the mass transfer [47]. The expression of at the metallic lithium electrode interface reads
where is the average bulk concentration of species , is the bulk activity of the metallic Li, is the charge transfer coefficient for reaction Equation (2), is the overpotential (8) of the charge transfer reaction at the negative electrode, and the exchange current is given by:
with the standard rate constant for reaction Equation (2). The expression of at the positive electrode interface is given by the Butler–Volmer Equation (7), with the exchange current density
with the standard rate constant for reaction Equation (1).
2.4. Two-Mechanism Model for All-Solid-State Lithium-Ion Batteries
A model that accounts for two mechanisms of ionic conduction was recently published in [22]. Rooted in the thermo-mechanics of continua, the model builds upon the work of Raijmakers et al. [21] to enhance the description of vacancy replenishment in a LiPON solid electrolyte and applies to LLZO as well, according to [48]. The equations that depict ionic transfer in [22] are also multiscale-compatible. This feature seems to be particularly pertinent for composite cathodes, as indicated in [15].
As eloquently detailed in [21], some of the Li ions within a solid electrolyte undergo thermal excitation at standard conditions. This activates the chemical ionization reaction (3), resulting in the generation of uncompensated negative charges associated with vacancies in the LiPON matrix at the sites previously occupied by lithium. Raijmakers et al. depicted vacancies as capable of movement within the solid material (as for the motion of anions in liquid electrolytes) driven by an entropic Brownian motion and migration within an electric field, as described in Equation (25b). This vision is thermodynamically encapsulated in the constitutive law (18).
The filling of vacancies was modeled in [22,49] following the pictorial view in Figure 3. Some ions, denoted henceforth with and depicted in blue in Figure 3, move in a meta-stable interstitial state, whereas other ions, depicted in red in Figure 3, hop and fill neighboring vacancies. This dynamic behavior thus entails a differentiation among the ions after the chemical ionization reaction (3) occurs. It is described by a further reaction
where and are the rate constants for reaction (35). When , no interstitial mechanism is accounted for and the model becomes a classical single-ion conducting solid electrolyte [19].
In essence, reaction (3) enables lithium ions to depart from the host sites and flow across the intricate amorphous LiPON structure, either by occupying neighboring vacancies or interstitially. The ratio of ions engaging in these two mechanisms is governed by reaction (35). Within this framework, only positive ions are mobile species, with the vacancies lacking inherent mobility. Consequently, there exists no direct flow of negative charges, in contrast to Equation (25b), and the local vacancy concentration is modified solely by the chemical ionization reaction (35).
This conceptual picture is framed into the following set of mass balance equations, which characterize the immobile lithium , the negative charges , the transport of the lithium ions that go interstitial, and the remaining ions that hop:
having set
according to reaction (35). The ratio
provides the equilibrium constant of reaction (35). Five unknown fields, i.e., the concentrations , , , and , and the electric potential , are accompanied by the set of four mass balance Equations (36a)–(36d). The additional required equation is Ampère’s law (with Maxwell’s correction, because the electroneutrality condition is not used as a fundamental law). To conclude the set of balance equations, the usual balance of forces in small strains was accounted for in [49]
An additive decomposition of the strain tensor in an elastic recoverable after unloading () and a swelling contribution related to the insertion of species in the host material () were considered:
The swelling contribution
was assumed to be volumetric and proportional to the deviation from the reference concentration by means of the chemical expansion coefficients of species . They equaled one-third of the partial molar volumes at a given temperature.
To derive governing equations from balance Equation (36), constitutive laws were derived from a rigorous thermodynamic setting. The interstitial motion differs thermodynamically from the hopping mechanism. Therefore, using the same thermodynamic approach for both mechanisms might be disputable. Aware of this limitation and inspired by [50,51,52], when restricted to small strains, elaborating the electromagnetic contribution to the Helmholtz free energy from [25,26], the chemical potential (16b) of species was extended to
as detailed in [35,36]. A standard quadratic form for the elastic part of the free energy density , in the small-strain regime, can be adopted
where K and G are the bulk and shear modulus, respectively, and they are made dependent on species concentrations. The stress tensor derives from thermodynamic restrictions (see [35] for details and extension to temperature dependency)
Note that the derivative in Equation (39) is the sum of two contributions
The first emanates from the swelling part of the strain and is present even if the material parameters are made independent of the concentration of species. The Nernst–Planck Equation (18) is extended as follows
with . By defining , the mobility tensor reads [37]
It accounts for saturation and thus differs from Equation (14). The energetic and entropic contributions in the constitutive law (43) have already been described in Equation (17). The mechanical contribution to the mass flux is driven by the chemical expansion coefficient and derives from the thermodynamic consistency.
The mass balance equations, after inserting (43) into Equations (36c) and (36d), do not form a complete set, because ionic transport entails a movement of mass and charge. In order to build a multiscale compatible theory, the generally accepted electroneutrality assumption cannot be taken, since it prevents one from imposing the conservation of energy across the scales: this concept was illustrated with great detail in [25,30] and is not further elaborated here. Multiscale compatibility is granted by using Ampere’s law (with Maxwell’s correction in the realm of small strains)
When multiscale compatibility is not invoked, the electroneutrality assumption
can be called for.
A widespread choice for the initial conditions for concentrations and electric potential enforces equilibrium conditions. They hold
Three independent factors influence the equilibrium concentrations within the system: and the equilibrium constants for reactions (3) and (35). While can be determined with precision, estimating and through experiments is fraught with substantial uncertainties. These three parameters are interrelated and play a role in defining the fraction of lithium existing in a mobile state at equilibrium, which is referred to as , as detailed in reference [21]. is as follows:
Equation (49) can be readily transformed to express in terms of both and as follows:
The interface conditions for this advanced model are Equations (29) and (33). The faradaic current originates from charge transfer kinetics, as proposed in [21]. Because of the interstitial and hopping classification of lithium flux, the faradaic interface conditions are split:
The charge transfer current is the sum of interstitial and hopping contributions, inferred from the Butler–Volmer Equation (7) or (34). The exchange current reads:
Here, and represent the average bulk concentrations of the species and , respectively. Unlike in [21], these averages are not time-independent. In the absence of a clearer understanding, we make the assumption that the non-faradaic current , as described in Equation (33), is proportional to the faradaic splitting, i.e.,
where . The Neumann conditions on fluxes at the boundaries of the electrolyte read:
The continuity of displacements and normal tractions are interface conditions for the mechanical governing Equation (36f). The electrodes governing equations and boundary conditions do not differ from Section 2.3.
In this section, the main features of the four models depicted in [19,20,21,22] have been recapitulated, highlighting the main features as well as the mathematical structure of each formulation. In the following section, the two most advanced theories, proposed in [21] and [22], are compared numerically. The experimental outcomes described in [27] are used for validation. Material and geometrical parameters are collected in Table A1 in Appendix B.
3. Benchmark Comparison
We considered a layer of with thickness deposited on a platinum substrate as the positive electrode. A Lithium metal foil with thickness was used as a negative electrode. The solid electrolyte was a one-micron-thick () layer of LiPON. The surface area of the deposited electrodes was , and the theoretical storage capacity of the battery was .
The electrochemical cell was subject to a galvanostatic process of discharge at different , under a temperature-controlled condition of 25 °C. Symbol denotes the current corresponding to . For , was . Initial and boundary conditions were made compatible with a thermodynamic equilibrium at , tuning the density current in time as:
with t in seconds. In view of Equation (54), the concentrations of ions across all battery components were uniform and at equilibrium at , since no profiles had been established yet. By enforcing the fraction of mobile lithium in the electrolyte and a maximum concentration of lithium host sites in the electrolyte , Equation (47) provided
The electric potential at the interface between the anode and the solid electrolyte was fixed as:
All material parameters used in the simulation are listed in Table A1. The equilibrium constants read
for this benchmark comparison.
The solution of the governing equations was approximated using the finite element method, implemented with custom weak forms in MATLAB. The unknown fields (refer to Figure 1c,d) and the geometry were tessellated with 61 linear elements. Only one element was necessary for the anode, as the lithium concentration was uniform and the electric potential was linear. The results were based on a mesh consisting of 40 finite elements covering the electrolyte and 20 panels discretizing the cathode. In both cases, the mesh was locally refined around the electrode/electrolyte interface. Integration in time was performed using the backward Euler method, with constant time increments of .
The OCP was reconstructed from experimental data presented in [27] using interpolatory splines derived in the simulations. Alternatively, the OCP could have been analytically calculated following the approach outlined in [34]. Results obtained with the analytically determined OCP are reported in Appendix A.
The simulations covered a wide set of rates, from 1.0 to 51.2. Experimental results are plotted with dots in Figure 4b as a function of time, while continuous lines reproduce simulated outcomes. Experimental evidences and simulations show good agreement for all investigated C-rates. As expected, the extracted charge decreased with increasing C-rate due to higher overpotentials. Lower discharge rates imply a slower insertion, hence a more uniform allocation, of lithium in the positive electrode.
For two different discharge rates, Figure 5 plots the profile of the electric potential at various times. At C-rate = 3.20, the battery is allowed to discharge in 1125 s. At C-rate = 51.2, the battery ideally completes the discharge process in 70 s. Simulations terminate when the concentration of lithium inside the cathode reaches the saturation limit , occurring after 1085 s and 50 s, respectively. Cathodic saturation is the limiting factor for battery operation. An extensive discussion on limiting factors induced by materials and architectures is reported in [53].
At the initial time, the electric potential discontinuity at the interfaces make Butler–Volmer currents vanishing. Based on the measured battery OCP, at full charge state, , as highlighted in Figure 5. During the discharge, the potential drops in the anode and in the electrolyte. However, the major changes in the potential profile occur at the interface between electrolyte and cathode: the battery voltage decreases significantly during discharge as depicted in Figure 5a,b and it becomes almost uniform within the cathode. A similar behavior is observed for the model in [21] (see Figure 5c,d).
Figure 6 depicts the evolution of lithium concentration in the cathode and in the solid electrolyte for the model in [22] (a,b) as well as for the one proposed in [21] (c,d). Since two ionic concentrations are concurrently present in the electrolyte, only their sum is plotted in Figure 6a,b.
The anodic foil of lithium remains unaffected by the charge/discharge processes and is considered as an unlimited reservoir of lithium. After intercalation, the lithium ions accumulate near the electrolyte/cathode interface. The discharge process ends when the lithium concentration in the cathode reaches its saturation limit . Therefore, saturation at the interface between the electrolyte and the cathode is the limiting factor for the performance of this battery.
The concentration of in [21], initially uniform, increases near the anode interface, while decreasing at the cathode interface. This “liquid electrolyte” kind of behavior is justified since in [21], negative charges are allowed to move. In the formulation proposed in [22], negative charges are filled by hopping lithium, which in turn is allowed to be intercalated. The time evolution of negative charges and total lithium is driven by the ionization reaction rates and , as already discussed, and is very small in Figure 6a,b.
Concentrations , , , and are individually depicted in Figure 7. The concentration of interstitial lithium qualitatively resembles the cationic behavior observed in [21] across varying C-rates. Due to teh electroneutrality and the assumption of no negative charge flow, the total concentration of lithium cannot vanish, unlike in liquid electrolyte systems and in [21] (compare Figure 6b,d). Nevertheless, the contributions of and can independently approach zero (refer to Figure 7b). The implications of this occurrence are currently unclear.
The concentration of at the cathode increases with discharge time, consistent with the Li-intercalation reaction described in Equation (1). At higher C-rates, the expected concentration gradient becomes steeper, potentially leading to diffusion issues within the electrode. This phenomenon is prominently observed in Figure 6b, at C = . A similar behavior is noted in [21]—see Figure 6d.
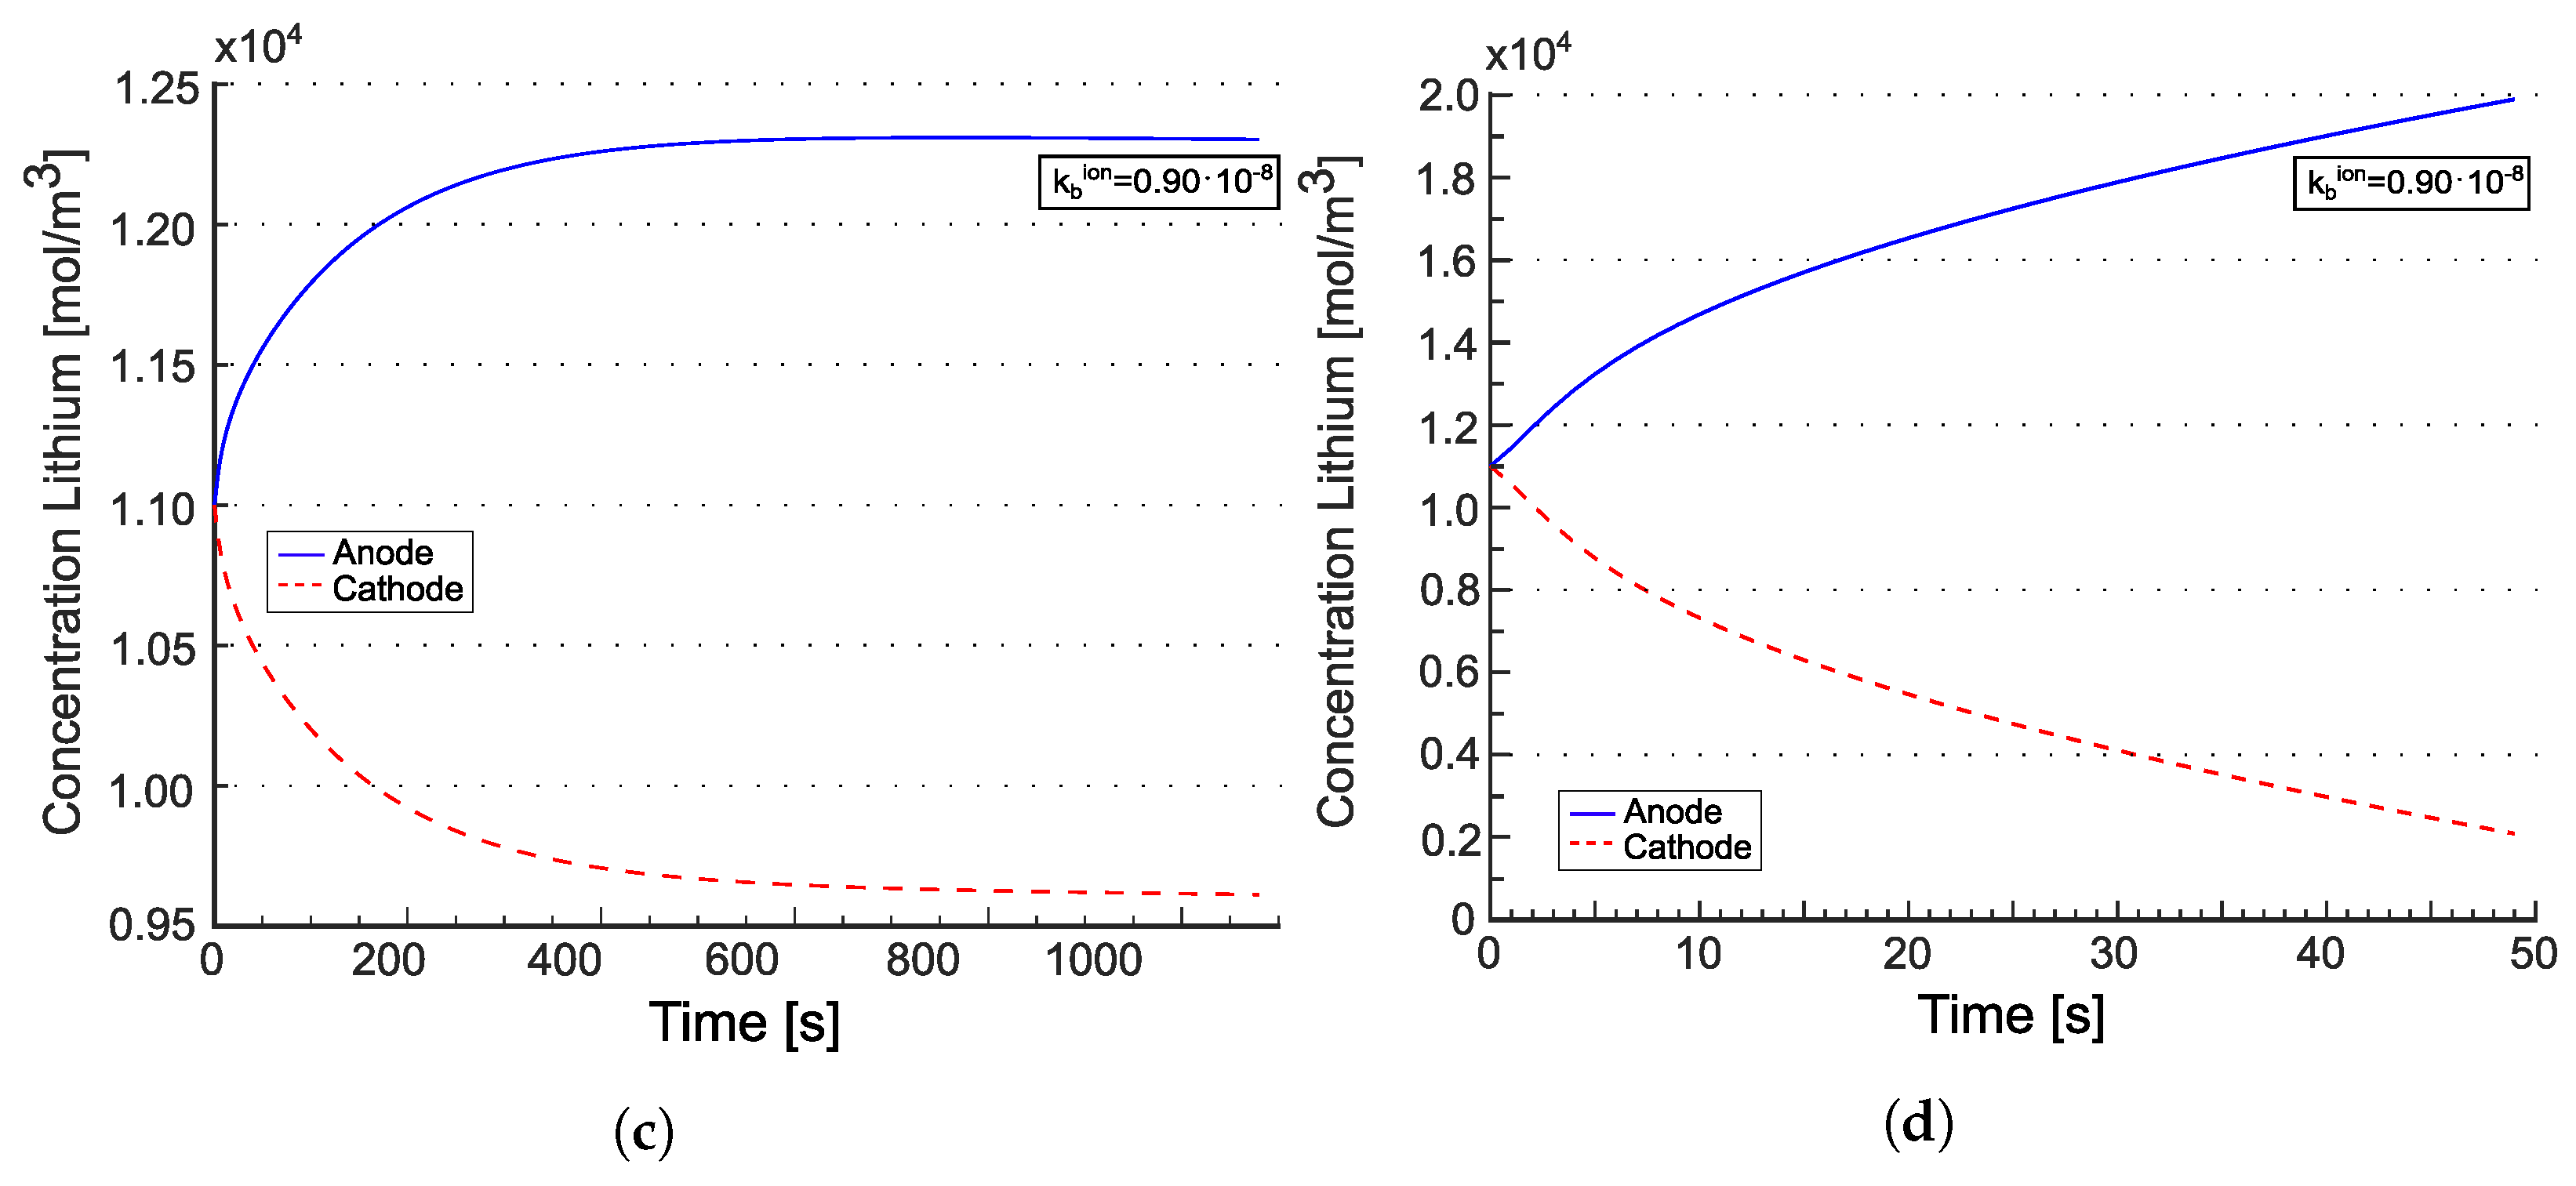
Figure 8 displays the total lithium concentration for the model from [22] (panels (a) and (b)) and for the model from [21] (panels (c) and (d)). The concentrations are depicted at the anode/electrolyte interface with a blue line and at the electrolyte/cathode interface with a red line. According to [22], the tangent disappears at . Such behavior is attributed to the electroneutrality coupled with the equilibrium condition imposed at in Equation (36b). The concentrations at the two electrodes evolve in accordance with the mass balance Equations (36c) and (36d). Over time, fluxes tend to converge to a uniform value across the electrolyte, diminishing the significance of the divergence contribution, and thus the evolution of concentrations is primarily driven by the evolution of and . It is expected that, at the same equilibrium constant, increasing the reaction constant (i.e., making the reaction faster) would lead to reaching the steady state more rapidly. This numerical response is observed in Figure 8 (panels (a) and (b)), where higher values of and , while keeping , result in reaching the concentration plateau faster. For the model from [21], the concentration response resembles that of liquid electrolytes [25,26], as expected. It is noteworthy that steady state is only achieved at low C-rates in that case.
4. Final Remarks and Further Developments
This note had the purpose of highlighting the main features, the fundamental assumptions, and the most relevant limitations of four ASSB models of particular relevance in the literature. All formulations were comprehensively examined from a theoretical perspective, whereas the model in [22] and its predecessor [21] were also compared from a computational standpoint. Such an assessment was achieved via the finite element method, validating and comparing interface currents, electric potentials, flux patterns, and concentration profiles.
Corresponding to the chronological order of publication, the models’ degree of complexity increased. All-solid-state microbatteries were modelled by Fabre et al. [19] in one dimension, addressing the kinetics involved in charge transfer at the interfaces between the electrodes and the electrolyte, as well as the diffusion of neutral lithium within the cathode and the migration of lithium ions throughout the solid electrolyte. A modified Poisson–Nernst–Planck system of equations for the solid electrolyte was established in [20]. Besides modeling the diffusion and migration of mobile lithium ions in the solid electrolyte, the model in [21] accounted for the kinetics of the charge transfer at the interfaces between electrodes and electrolyte. To capture the space-charge effect, double-layer capacitors were positioned at the electrode/electrolyte interfaces. The ionic mobility in [22] resulted from hopping and interstitial diffusion, i.e., two mechanisms of ionic conduction in the solid electrolyte were devised.
The reviewed models share some common assumptions. They are (i) thin-film-based: the first model encapsulates this assumption in the constitutive equations, while the others are in principle fully three-dimensional and hence also applicable to composite electrode/electrolyte systems; (ii) isothermal (no self-heating), although it is quite well known that temperature affects the response of the battery [54]. Those assumptions should be removed in further publications aiming at realistically replicating the response of batteries. The research focus should escape the limiting scenario of thin-film ASSBs and incorporate polymer solid electrolytes, inorganic solid electrolytes, and organic–inorganic composite solid electrolytes [3,55].
Polymer electrolytes show desirable characteristics such as exceptional flexibility, low weight, easy processing, and favorable compatibility with electrodes [56]. Their vulnerability to flammability underscores the urgent need for models that account for flame-retardant additives [57].
Inorganic solid electrolytes show a high energy density and inherent safety [48,58], but they suffer from a few major issues that might be mitigated by a proper design, facilitated by computational strategies [55]. Oxide solid electrolytes demonstrate exceptional electrochemical stability and ionic conductivity, yet they show inadequate electrode contact [59,60]. Halide electrolytes exhibit exceptional compatibility with electrodes, although they are vulnerable to moisture [61]. Sulfide electrolytes exhibit a notable ionic conductivity and commendable mechanical flexibility; however, they are characterized by a lack of stability of the electrode/electrolyte interface [62]. The presence of a lithium-depleted layer at the interface between an oxide cathode and sulfide electrolyte has been elucidated through the utilization of first-principle molecular dynamics simulations. Moreover, density functional theory (DFT) electronic structure calculations provide compelling evidence that the charge current specifically eliminates lithium ions from the sulfide electrolyte part of the interface, resulting in the depletion of lithium ions in that specific region. The obtained calculations align with experimental outcomes [63,64,65].
In recent years, the utilization of high-throughput density functional theory calculations and machine learning predictions has emerged as formidable methodologies for the exploration and identification of innovative materials [66,67,68]. Comprehensive calculations on a dataset of 740,000 lithium compounds have been published in [68], allowing the discovery of new solid electrolytes (SEs).
Xi et al. [69] conducted a comprehensive investigation into the physical contact and chemical/electrochemical properties of interfaces in ASSBs, offering a comprehensive summary of recent progress in interface modification techniques. In a recent work by Tian et al. [8], the effect of an imperfect contact area was incorporated into a 1D Newman battery model, assuming that the current and Li concentration were localized at the contacted area of the interfaces.
An electrochemical model for ASSBs with a composite positive electrode was developed in [70] by incorporating an imperfect solid–solid contact interface and an electrical double layer at the electrode–electrolyte interface. To enhance the accuracy of the battery model, diffusion coefficients dependent upon the lithium concentration were implemented. The simulations suggested that the primary factors restricting the performance of batteries were overpotentials that arose from a concentration polarization within positively charged particles and interface reactions. Moreover, the size of the particles and the area of contact within the composite positive electrode had a significant impact on the performance of the battery.
Further phenomena should be included in the list of processes to be modeled towards achieving a realistic digital twin of energy storage systems. A change in volume due to repeated insertion and removal of Li atoms may lead to contact breakdown and degradation of the solid electrolyte lattice. Among the four reviewed publications, only [22] did not neglect volume changes during charge/discharge, but the active surface area remained unaltered over cycling. The volumetric changes in composite electrodes increase the likelihood of crack formation and internal short circuits [71]. Hence, there is an urgent requirement to create innovative models of crack propagation and arrest in solid-state electrolytes [72]. It is recommended to handle the mechanical problem in a three-dimensional setting with large-strain mechanics, as in [50,73,74,75].
Modeling ASSBs should also account for the solid electrolyte interface (SEI) formation. It occurs as a result of the reduction of the electrolyte, leading to the development of a thin and heterogeneous layer at the interface between the anode and electrolyte [33,76]. The SEI progresses gradually over time, depleting active electrons and electrolyte species, resulting in an overall loss in capacity and ultimately the death of the battery [77,78]. An effective modeling of the SEI has not been achieved yet, despite attempts in molecular modeling methods, including DFT, force fields, and machine learning potentials [79,80].
Author Contributions
Conceptualization, A.S. and L.C.; methodology, E.Y., M.S., A.S. and L.C.; software, M.S. and L.C.; validation, A.S. and L.C.; formal analysis, E.Y., M.S., A.S. and L.C.; investigation, E.Y., M.S., A.S. and L.C.; resources, A.S.; data curation, E.Y., M.S., A.S. and L.C.; writing—original draft preparation, E.Y. and L.C.; writing—review and editing, E.Y., M.S., A.S. and L.C.; supervision, A.S.; project administration, A.S.; funding acquisition, A.S. All authors have read and agreed to the published version of the manuscript.
Funding
The publication was partially funded within the COMET K2 Competence Centers for Excellent Technologies from the Austrian Federal Ministry for Climate Action (BMK), the Austrian Federal Ministry for Labour and Economy (BMAW), the Province of Styria (Dept. 12) and the Styrian Business Promotion Agency (SFG). The Austrian Research Promotion Agency (FFG) has been authorized to manage the program.
Data Availability Statement
Not applicable.
Conflicts of Interest
The authors declare no conflict of interest.
Appendix A. Analytical OCP Simulations
An approach to calculate the open-circuit overpotential analytically is described in [34], based on the ideal chemical potential , as reported in Figure 4a with a blue dashed line. The discharge curves as a function of the extracted charge, obtained following this analytical approach, are given in Figure A1a,b.
Figure A1.
Discharge curves as a function of time (a), and the extracted charge (b) for different s, obtained following the analytical approach to evaluate the OCP as given in [34].
Figure A1.
Discharge curves as a function of time (a), and the extracted charge (b) for different s, obtained following the analytical approach to evaluate the OCP as given in [34].

The difference between the results obtained considering the OCP evaluated from experimental tests and from the analytical approach are not negligible for this kind of battery, meaning that more complex forms of the chemical potential should be used as in [81].
Appendix B. Material and Geometrical Parameters Used for Model Validation

Table A1.
A list of the parameters used in the simulations.
| Parameter | Value | Unit | Description |
|---|---|---|---|
| T | Temperature | ||
| Thickness of the anode | |||
| Thickness of the electrolyte | |||
| Thickness of the cathode | |||
| Thickness of the positive collector | |||
| A | Geometrical surface area | ||
| Maximum concentration of ions in the electrode | |||
| Electrical conductivities in the lithium anode | |||
| Electrical conductivities in the current collector | |||
| () | Lithium-ion generation reaction rate constant for Equation (3) | ||
| Lithium-ion recombination reaction rate constant for Equation (3) | |||
| () | Lithium-ion generation reaction rate constant for Equation (35) | ||
| Lithium-ion recombination reaction rate constant for Equation (35) | |||
| Double-layer capacity per unit area of anode | |||
| Double-layer capacity per unit area of cathode | |||
| - | Charge transfer coefficient for the negative electrode | ||
| - | Charge transfer coefficient for the positive electrode | ||
| Diffusion coefficient for ions in the electrolyte | |||
| Diffusion coefficient for ions in the electrolyte | |||
| Diffusion coefficient for ions in the cathode | |||
| Standard reaction rate constant for forward reaction in Equation (1) | |||
| Standard reaction rate constant for forward reaction in Equation (2) | |||
| - | Fraction of mobile ions in the electrolyte in equilibrium | ||
| Maximal lithium concentration in the electrolyte | |||
| - | Relative permittivity in the electrolyte |
References
- Schnell, J.; Günther, T.; Knoche, T.; Vieider, C.; Köhler, L.; Just, A.; Keller, M.; Passerini, S.; Reinhart, G. All-solid-state lithium-ion and lithium metal batteries—Paving the way to large-scale production. J. Power Sources 2018, 382, 160–175. [Google Scholar] [CrossRef]
- Zheng, F.; Kotobuki, M.; Song, S.; Lai, M.; Lu, L. Review on solid electrolytes for all-solid-state lithium-ion batteries. J. Power Sources 2018, 389, 198–213. [Google Scholar] [CrossRef]
- Arreaga-Salas, D.E.; Sra, A.K.; Roodenko, K.; Chabal, Y.J.; Hinkle, C.L. Progression of solid electrolyte interphase formation on hydrogenated amorphous silicon anodes for lithium-ion batteries. J. Phys. Chem. C 2012, 116, 9072–9077. [Google Scholar] [CrossRef]
- Pasta, M.; Armstrong, D.; Brown, Z.; Bu, J.; Castell, M.; Chen, P.; Cocks, A.; Corr, S.; Cussen, E.; Darnbrough, E.; et al. 2020 roadmap on solid-state batteries. J. Phys. Energy 2020, 2, 032008. [Google Scholar] [CrossRef]
- Santhanagopalan, D.; Qian, D.; McGilvray, T.; Wang, Z.; Camino, F.; Graetz, J.; Dudney, N.; Meng, Y. Interface limited lithium transport in solidstate batteries. J. Phys. Chem. Lett. 2014, 5, 298–303. [Google Scholar] [CrossRef] [PubMed]
- Chen, C.; Jiang, M.; Zhou, T.; Raijmakers, L.; Vezhlev, E.; Wu, B.; Schuelli, T.; Danilov, D.; Wei, Y.; Eichel, R.; et al. Interface Aspects in All-Solid-State Li-Based Batteries Reviewed. Adv. Energy Mater. 2021, 11, 2003939. [Google Scholar] [CrossRef]
- Zhang, F.; Huang, Q.; Tang, Z.; Li, A.; Shao, Q.; Zhang, L.; Li, X.; Zhang, J. A review of mechanics-related material damages in all-solid-state batteries: Mechanisms, performance impacts and mitigation strategies. Nano Energy 2020, 70, 104545. [Google Scholar] [CrossRef]
- Tian, H.K.; Qi, Y. Simulation of the Effect of Contact Area Loss in All-Solid-State Li-Ion Batteries. J. Electrochem. Soc. 2017, 164, 3512–3521. [Google Scholar] [CrossRef]
- Waldmann, T.; Hogg, B.; Wohlfahrt-Mehrens, M. Li plating as unwanted side reaction in commercial Li-ion cells—A review. J. Power Sources 2018, 384, 107–124. [Google Scholar] [CrossRef]
- Porz, L.; Swamy, T.; Sheldon, B.; Rettenwander, D.; Frömling, T.; Thaman, H.; Berendts, S.; Uecker, R.; Carter, W.; Chiang, Y. Mechanism of Lithium Metal Penetration through Inorganic Solid Electrolytes. Adv. Energy Mater. 2017, 7, 1701003. [Google Scholar] [CrossRef]
- Shishvan, S.; Fleck, N.; McMeeking, R.; Deshpande, V. Growth rate of lithium filaments in ceramic electrolytes. Acta Mater. 2020, 196, 444–455. [Google Scholar] [CrossRef]
- Fan, L.; Wei, S.; Li, S.; Li, Q.; Lu, Y. Recent Progress of the Solid-State Electrolytes for High-Energy Metal-Based Batteries. Adv. Energy Mater. 2018, 8, 1702657. [Google Scholar] [CrossRef]
- Yuan, H.; Luan, J.; Yang, Z.; Zhang, J.; Wu, Y.; Lu, Z.; Liu, H. Single Lithium-Ion Conducting Solid Polymer Electrolyte with Superior Electrochemical Stability and Interfacial Compatibility for Solid-State Lithium Metal Batteries. ACS Appl. Mater. Interfaces 2020, 12, 7249–7256. [Google Scholar] [CrossRef] [PubMed]
- Zheng, Y.; Yao, Y.; Ou, J.; Li, M.; Luo, D.; Dou, H.; Li, Z.; Amine, K.; Yu, A.; Chen, Z. A review of composite solid-state electrolytes for lithium batteries: Fundamentals, key materials and advanced structures. Chem. Soc. Rev. 2020, 49, 8790–8839. [Google Scholar] [CrossRef] [PubMed]
- Bielefeld, A.; Weber, D.; Janek, J. Microstructural modeling of composite cathodes for all solid state batteries. J. Phys. Chem. C 2019, 123, 1626–1634. [Google Scholar] [CrossRef]
- Cao, C.; Li, Z.; Wang, X.; Zhao, X.; Han, W. Recent advances in inorganic solid electrolytes for lithium batteries. Front. Energy Res. 2014, 2, 25–35. [Google Scholar] [CrossRef]
- Grazioli, D.; Magri, M.; Salvadori, A. Computational modeling of Li-ion batteries. Comput. Mech. 2016, 58, 889–909. [Google Scholar] [CrossRef]
- Li, G.; Monroe, C.W. Multiscale Lithium-Battery Modeling from Materials to Cells. Annu. Rev. Chem. Biomol. 2020, 11, 277–310. [Google Scholar] [CrossRef] [PubMed]
- Fabre, S.; Guy-Bouyssou, D.; Bouillon, P.; Le Cras, F.; Delacourt, C. Charge/Discharge Simulation of an All-Solid-State Thin-Film Battery Using a One-Dimensional Model. J. Electrochem. Soc. 2012, 159, A104–A115. [Google Scholar] [CrossRef]
- Landstorfer, M.; Funken, S.; Jacob, T. An advanced model framework for solid electrolyte intercalation batteries. Phys. Chem. Chem. Phys. 2011, 13, 12817–12825. [Google Scholar] [CrossRef] [PubMed]
- Raijmakers, L.; Danilov, D.; Eichel, R.; Notten, P. An advanced all-solid-state Li-ion battery model. Electrochim. Acta 2020, 330, 135147. [Google Scholar] [CrossRef]
- Cabras, L.; Danilov, D.; Subber, W.; Oancea, V.; Salvadori, A. A two-mechanism and multiscale compatible approach for solid state electrolytes of (Li-ion) batteries. J. Energy Storage 2022, 48, 103842. [Google Scholar] [CrossRef]
- Salvadori, A.; Grazioli, D.; Geers, M. Governing equations for a two-scale analysis of Li-ion battery cells. Int. J. Solids Struct. 2015, 59, 90–109. [Google Scholar] [CrossRef]
- Mykhaylov, M.; Ganser, M.; Klinsmann, M.; Hildebrand, F.; Guz, I.; McMeeking, R. An elementary 1-dimensional model for a solid state lithium-ion battery with a single ion conductor electrolyte and a lithium metal negative electrode. J. Mech. Phys. Solids 2019, 123, 207–221. [Google Scholar] [CrossRef]
- Salvadori, A.; Grazioli, D.; Geers, M.; Danilov, D.; Notten, P. A multiscale-compatible approach in modeling ionic transport in the electrolyte of (Lithium ion) batteries. J. Power Sources 2015, 293, 892–911. [Google Scholar] [CrossRef]
- Salvadori, A.; Grazioli, D.; Magri, M.; Geers, M.; Danilov, D.; Notten, P. On the role of saturation in modeling ionic transport in the electrolyte of (Li-ion) batteries. J. Power Sources 2015, 294, 696–710. [Google Scholar] [CrossRef]
- Danilov, D.; Niessen, R.; Notten, P. Modeling All-Solid-State Li-Ion Batteries. J. Electrochem. Soc. 2011, 158, A215–A222. [Google Scholar] [CrossRef]
- Doyle, M.; Newman, J. The use of mathematical modeling in the design of Lithium/polymer battery systems. Electrochim. Acta 1995, 40, 2191–2196. [Google Scholar] [CrossRef]
- Fuller, T.; Doyle, M.; Newman, J. Simulation and Optimization of the Dual Lithium Ion Insertion Cell. J. Electrochem. Soc. 1994, 141, 1–10. [Google Scholar] [CrossRef]
- Salvadori, A.; Bosco, E.; Grazioli, D. A computational homogenization approach for Li-ion battery cells. Part 1—Formulation. J. Mech. Phys. Solids 2014, 65, 114–137. [Google Scholar] [CrossRef]
- Franco, A. Multiscale modelling and numerical simulation of rechargeable Lithium ion batteries: Concepts, methods and challenges. RSC Adv. 2013, 3, 13027–13058. [Google Scholar] [CrossRef]
- Lee, S.; Sastry, A.; Park, J. Study on microstructures of electrodes in Lithium-ion batteries using variational multi-scale enrichment. J. Power Sources 2016, 315, 96–110. [Google Scholar] [CrossRef]
- Franco, A.; Rucci, A.; Brandell, D.; Frayret, C.; Gaberscek, M.; Jankowski, P.; Johansson, P. Boosting Rechargeable Batteries R&D by Multiscale Modeling: Myth or Reality? Chem. Rev. 2019, 119, 4569. [Google Scholar] [PubMed]
- Purkayastha, R.; McMeeking, R. An integrated 2-D model of a Lithium ion battery: The effect of material parameters and morphology on storage particle stress. Comput. Mech. 2012, 50, 209–227. [Google Scholar] [CrossRef]
- Salvadori, A.; McMeeking, R.; Grazioli, D.; Magri, M. A coupled model of transport-reaction-mechanics with trapping. Part I—Small strain analysis. J. Mech. Phys. Solids 2018, 114, 1–30. [Google Scholar] [CrossRef]
- Arricca, M.; Cabras, L.; Serpelloni, M.; Bonanno, C.; McMeeking, R.M.; Salvadori, A. A coupled model of transport-reaction-mechanics with trapping, Part II: Large strain analysis. J. Mech. Phys. Solids 2023, 181, 105425. [Google Scholar] [CrossRef]
- Anand, L. A Cahn-Hilliard-type theory for species diffusion coupled with large elastic-plastic deformations. J. Mech. Phys. Solids 2012, 60, 1983–2002. [Google Scholar] [CrossRef]
- DeHoff, R. Thermodynamic in Material Science; CRC Press—Taylor and Francis: New York, NY, USA, 2006. [Google Scholar]
- Shell, S. Thermodynamics and Statistical Mechanics: An Integrated Approach; Cambridge University Press: Cambridge, UK, 2015. [Google Scholar]
- Bohn, E.; Eckl, T.; Kamlah, M.; McMeeking, R. A Model for Lithium Diffusion and Stress Generation in an Intercalation Storage Particle with Phase Change. J. Electrochem. Soc. 2013, 160, A1638–A1652. [Google Scholar] [CrossRef]
- Di Leo, C.; Rejovitzky, E.; Anand, L. A Cahn-Hilliard-type phase-field theory for species diffusion coupled with large elastic deformations: Application to phase-separating Li-ion electrode materials. J. Mech. Phys. Solids 2014, 70, 1–29. [Google Scholar] [CrossRef]
- Bower, A.; Guduru, P.; Chason, E. Analytical solutions for composition and stress in spherical elastic–plastic Lithium-ion electrode particles containing a propagating phase boundary. Int. J. Solids Struct. 2015, 69-70, 328–342. [Google Scholar] [CrossRef]
- Bonnefont, A.; Argoul, F.; Bazant, M. Analysis of diffuse-layer effects on time-dependent interfacial kinetics. J. Electroanal. Chem. 2001, 500, 52–61. [Google Scholar] [CrossRef]
- Bazant, M.; Chu, K.; Bayly, B. Current-voltage relations for elecrochemical thin films. SIAM J. Appl. Math. 2005, 65, 1463–1484. [Google Scholar] [CrossRef]
- Li, D.; Danilov, D.; Xie, J.; Raijmakers, L.; Gao, L.; Yang, Y.; Notten, P. Degradation mechanisms of C6/LiFePO4 batteries: Experimental analyses of calendar aging. Electrochim. Acta 2016, 190, 1124–1133. [Google Scholar] [CrossRef]
- Li, D.; Danilov, D.; Gao, L.; Yang, Y.; Notten, P. Degradation mechanisms of C6/LiFePO4 batteries: Experimental analyses of cycling-induced aging. Electrochim. Acta 2016, 210, 445–455. [Google Scholar] [CrossRef]
- Bard, A.; Faulkner, L. Electrochemical Methods: Fundamentals and Applications, 2nd ed.; Wiley: New York, NY, USA, 2000. [Google Scholar]
- Famprikis, T.; Canepa, P.; Dawson, J.; Islam, M.S.; Masquelier, C. Fundamentals of inorganic solid-state electrolytes for batteries. Nat. Mater. 2019, 18, 1278–1291. [Google Scholar] [CrossRef] [PubMed]
- Cabras, L.; Serpelloni, M.; Salvadori, A. Electro-chemo-mechanics of solid state batteries with lithium plating and stripping. Front. Mater. 2022, 9, 1052617. [Google Scholar] [CrossRef]
- Ganser, M.; Hildebrand, F.; Kamlah, M.; McMeeking, R. A finite strain electro-chemo-mechanical theory for ion transport with application to binary solid electrolytes. J. Mech. Phys. Solids 2019, 125, 681–713. [Google Scholar] [CrossRef]
- Bower, A.; Guduru, P.; Chason, E. A continuum model of deformation, transport and irreversible changes in atomic structure in amorphous Lithium–silicon electrodes. Acta Mater. 2015, 98, 229–241. [Google Scholar] [CrossRef]
- Bucci, G.; Nadimpalli, S.; Sethuraman, V.; Bower, A.; Guduru, P. Measurement and modeling of the mechanical and electrochemical response of amorphous Si thin film electrodes during cyclic lithiation. J. Mech. Phys. Solids 2014, 62, 276–294. [Google Scholar] [CrossRef]
- Magri, M.; Boz, B.; Cabras, L.; Salvadori, A. Quantitative investigation of the influence of electrode morphology in the electro-chemo-mechanical response of li-ion batteries. Electrochim. Acta 2022, 405, 139778. [Google Scholar] [CrossRef]
- Latz, A.; Zausch, J. Multiscale modeling of Li-ion batteries: Thermal aspects. Beilstein J. Nanotechnol. 2015, 6, 987–1007. [Google Scholar] [CrossRef] [PubMed]
- Ma, J.; Li, Z. Computational Design of Inorganic Solid-State Electrolyte Materials for Lithium-Ion Batteries. Acc. Mater. Res. 2024. [Google Scholar] [CrossRef]
- Maurya, D.K.; Dhanusuraman, R.; Guo, Z.; Angaiah, S. Composite polymer electrolytes: Progress, challenges, and future outlook for sodium-ion batteries. Adv. Compos. Hybrid Mater. 2022, 5, 2651–2674. [Google Scholar] [CrossRef]
- Liao, Y.; Xu, X.; Luo, X.; Ji, S.; Zhao, J.; Liu, J.; Huo, Y. Recent progress in flame-retardant polymer electrolytes for solid-state lithium metal batteries. Batteries 2023, 9, 439. [Google Scholar] [CrossRef]
- Knauth, P.; Tuller, H.L. Solid-state ionics: Roots, status, and future prospects. J. Am. Ceram. Soc. 2002, 85, 1654–1680. [Google Scholar] [CrossRef]
- Takada, K. Progress in solid electrolytes toward realizing solid-state lithium batteries. J. Power Sources 2018, 394, 74–85. [Google Scholar] [CrossRef]
- Xu, R.; Xia, X.; Zhang, S.; Xie, D.; Wang, X.; Tu, J. Interfacial challenges and progress for inorganic all-solid-state lithium batteries. Electrochim. Acta 2018, 284, 177–187. [Google Scholar] [CrossRef]
- Li, X.; Liang, J.; Chen, N.; Luo, J.; Adair, K.R.; Wang, C.; Banis, M.N.; Sham, T.K.; Zhang, L.; Zhao, S.; et al. Water-mediated synthesis of a superionic halide solid electrolyte. Angew. Chem. 2019, 131, 16579–16584. [Google Scholar] [CrossRef]
- Gorai, P.; Famprikis, T.; Singh, B.; Stevanovic, V.; Canepa, P. Devil is in the defects: Electronic conductivity in solid electrolytes. Chem. Mater. 2021, 33, 7484–7498. [Google Scholar] [CrossRef]
- Takada, K.; Ohno, T. Experimental and computational approaches to interfacial resistance in solid-state batteries. Front. Energy Res. 2016, 4, 10. [Google Scholar] [CrossRef]
- Ohta, N.; Takada, K.; Sakaguchi, I.; Zhang, L.; Ma, R.; Fukuda, K.; Osada, M.; Sasaki, T. LiNbO3-coated LiCoO2 as cathode material for all solid-state lithium secondary batteries. Electrochem. Commun. 2007, 9, 1486–1490. [Google Scholar] [CrossRef]
- Takada, K.; Ohta, N.; Zhang, L.; Xu, X.; Hang, B.T.; Ohnishi, T.; Osada, M.; Sasaki, T. Interfacial phenomena in solid-state lithium battery with sulfide solid electrolyte. Solid State Ionics 2012, 225, 594–597. [Google Scholar] [CrossRef]
- Hautier, G.; Jain, A.; Chen, H.; Moore, C.; Ong, S.P.; Ceder, G. Novel mixed polyanions lithium-ion battery cathode materials predicted by high-throughput ab initio computations. J. Mater. Chem. 2011, 21, 17147–17153. [Google Scholar] [CrossRef]
- Zhu, Z.; Chu, I.H.; Ong, S.P. Li3Y (PS4) 2 and Li5PS4Cl2: New lithium superionic conductors predicted from silver thiophosphates using efficiently tiered ab initio molecular dynamics simulations. Chem. Mater. 2017, 29, 2474–2484. [Google Scholar] [CrossRef]
- Guo, X.; Wang, Z.; Yang, J.; Gong, X.G. Machine-Learning Assisted High-Throughput Discovery of Solid-State Electrolytes for Li-ion Batteries. J. Mater. Chem. A 2024. [Google Scholar] [CrossRef]
- Xi, L.; Zhang, D.; Xu, X.; Wu, Y.; Li, F.; Yao, S.; Zhu, M.; Liu, J. Interface Engineering of All-Solid-State Batteries Based on Inorganic Solid Electrolytes. Chemsuschem 2023, 16, e202202158. [Google Scholar] [CrossRef] [PubMed]
- Li, G.; Fan, G.; Zhang, X.; Han, J.; Wang, Y.; Liu, Y.; Jia, L.; Guo, B.; Zhu, C.; He, M. Modeling of an all-solid-state battery with a composite positive electrode. Etransportation 2024, 20, 100315. [Google Scholar] [CrossRef]
- Janek, J.; Zeier, W.G. Challenges in speeding up solid-state battery development. Nat. Energy 2023, 8, 230–240. [Google Scholar] [CrossRef]
- Haftbaradaran, H.; Esmizadeh, S.; Salvadori, A. Competing effects of current density and viscoplastic deformation on the critical conditions for dendrite growth into solid-state lithium battery electrolytes. Int. J. Solids Struct. 2022, 254–255, 111852. [Google Scholar] [CrossRef]
- Di Leo, C.; Rejovitzky, E.; Anand, L. Diffusion-deformation theory for amorphous silicon anodes: The role of plastic deformation on elecrochemical performance. Int. J. Solids Struct. 2015, 67–68, 283–296. [Google Scholar] [CrossRef]
- Fathiannasab, H.; Kashkooli, A.; Li, T.; Zhu, L.; Chen, Z. Three-Dimensional Modeling of All-Solid-State Lithium-Ion Batteries Using Synchrotron Transmission X-ray Microscopy Tomography. J. Electrochem. Soc. 2020, 167, 100558. [Google Scholar] [CrossRef]
- Fathiannasab, H.; Zhu, L.; Chen, Z. Chemo-mechanical modeling of stress evolution in all-solid-state lithium-ion batteries using synchrotron transmission X-ray microscopy tomography. J. Power Sources 2021, 483, 229028. [Google Scholar] [CrossRef]
- Goodenough, J.B.; Kim, Y. Challenges for rechargeable Li batteries. Chem. Mater. 2010, 22, 587–603. [Google Scholar] [CrossRef]
- Adenusi, H.; Chass, G.A.; Passerini, S.; Tian, K.V.; Chen, G. Lithium batteries and the solid electrolyte interphase (SEI)—Progress and outlook. Adv. Energy Mater. 2023, 13, 2203307. [Google Scholar] [CrossRef]
- Koohi-Fayegh, S.; Rosen, M.A. A review of energy storage types, applications and recent developments. J. Energy Storage 2020, 27, 101047. [Google Scholar] [CrossRef]
- Bin Jassar, M.; Michel, C.; Abada, S.; De Bruin, T.; Tant, S.; Nieto-Draghi, C.; Steinmann, S.N. A Perspective on the Molecular Modeling of Electrolyte Decomposition Reactions for Solid Electrolyte Interphase Growth in Lithium-Ion Batteries. Adv. Funct. Mater. 2024, 2313188. [Google Scholar] [CrossRef]
- Diddens, D.; Appiah, W.A.; Mabrouk, Y.; Heuer, A.; Vegge, T.; Bhowmik, A. Modeling the Solid Electrolyte Interphase: Machine Learning as a Game Changer? Adv. Mater. Interfaces 2022, 9, 2101734. [Google Scholar] [CrossRef]
- Landstorfer, M. A Discussion of the Cell Voltage during Discharge of an Intercalation Electrode for Various C-Rates Based on Non-Equilibrium Thermodynamics and Numerical Simulations. J. Electrochem. Soc. 2019, 167, 013518. [Google Scholar] [CrossRef]
Figure 1.
Schematics of the ASSB models proposed in the selected literature. The unknown fields, under discharge conditions, are highlighted. The yellow arrows in (c) point out the charge-transfer reactions at both interfaces. For the sake of generality, the lithium concentration in the anode is listed in the unknown fields. (a) Model in [19]; (b) model in [20]; (c) model in [21]; (d) model in [22].

Figure 2.
LiPON matrix contains nitrogen, which has triple and double coordination (a). Ionic conductivity in LiPON is achieved through the displacement of charged particles, either by hopping and vacancy-filling or by interstitial motion (b).
Figure 2.
LiPON matrix contains nitrogen, which has triple and double coordination (a). Ionic conductivity in LiPON is achieved through the displacement of charged particles, either by hopping and vacancy-filling or by interstitial motion (b).

Figure 3.
Cation migration mechanisms: hopping into uncompensated negative charges associated with vacancies in the LiPON matrix, direct interstitial and conversion after reaction (35). (a) A sequence of three ionic distribution snapshots in time; (b) Legend.
Figure 3.
Cation migration mechanisms: hopping into uncompensated negative charges associated with vacancies in the LiPON matrix, direct interstitial and conversion after reaction (35). (a) A sequence of three ionic distribution snapshots in time; (b) Legend.

Figure 4.
(a) The open-circuit potential (OCP) is depicted as a function of the extracted charge. The OCP obtained from experimental tests is represented by the red line, while the OCP evaluated using the approach in [34] is illustrated by the blue line. (b) Discharge curves plotting voltage against time for various s, from [22]. Different s are shown by colored lines, and the experimental values are indicated by dots. Reprinted with permission from [22] Copyright 2022 Elsevier.

Figure 5.
The electric potential profile for the models published in [22] (a,b) and [21] (c,d) at various times for two different C-rates. The simulations terminate when the concentration of lithium within the positive electrode reaches its saturation . Reprinted partially with permission from [22] Copyright 2022 Elsevier. (a) for [22]; (b) for [22]; (c) for [21]; (d) for [21].

Figure 6.
Lithium concentration profiles within the battery for two different C-rates at different time steps for the models published in [22] (a,b) and in [21] (c,d). The blue lines refer to the starting time, when the battery is in thermodynamic equilibrium. The red line depicts the last time step, when the amount of lithium in the positive electrode has reached the saturation limit . Reprinted partially with permission from [22] Copyright 2022 Elsevier. (a) for [22]; (b) for [22]; (c) for [21]; (d) for [21].

Figure 7.
Concentrations , , , and in the solid electrolyte at different times for (a) and (b). Reprinted with permission from [22] Copyright 2022 Elsevier.
Figure 7.
Concentrations , , , and in the solid electrolyte at different times for (a) and (b). Reprinted with permission from [22] Copyright 2022 Elsevier.


Figure 8.
Concentration of lithium at the interfaces with the positive and the negative electrodes for the two different C-rates. The values recorded at the anode/electrolyte interface are represented by the blue lines, while the red line illustrates the values at the electrolyte/cathode interface. Tangents at vanish in (a,b) due to the electroneutrality and the equilibrium condition set at in Equation (36b). Reprinted partially with permission from [22] Copyright 2022 Elsevier. (a) for [22]; (b) for [22]; (c) for [21]; (d) for [21].

Disclaimer/Publisher’s Note: The statements, opinions and data contained in all publications are solely those of the individual author(s) and contributor(s) and not of MDPI and/or the editor(s). MDPI and/or the editor(s) disclaim responsibility for any injury to people or property resulting from any ideas, methods, instructions or products referred to in the content. |
© 2024 by the authors. Licensee MDPI, Basel, Switzerland. This article is an open access article distributed under the terms and conditions of the Creative Commons Attribution (CC BY) license (https://creativecommons.org/licenses/by/4.0/).
Share and Cite
MDPI and ACS Style
Yildiz, E.; Serpelloni, M.; Salvadori, A.; Cabras, L. A Comparative Review of Models for All-Solid-State Li-Ion Batteries. Batteries 2024, 10, 150. https://doi.org/10.3390/batteries10050150
AMA Style
Yildiz E, Serpelloni M, Salvadori A, Cabras L. A Comparative Review of Models for All-Solid-State Li-Ion Batteries. Batteries. 2024; 10(5):150. https://doi.org/10.3390/batteries10050150
Chicago/Turabian StyleYildiz, Erkin, Mattia Serpelloni, Alberto Salvadori, and Luigi Cabras. 2024. "A Comparative Review of Models for All-Solid-State Li-Ion Batteries" Batteries 10, no. 5: 150. https://doi.org/10.3390/batteries10050150
Note that from the first issue of 2016, this journal uses article numbers instead of page numbers. See further details here.