Article

Environmental Impacts Associated with the Production and Packing of Persian Lemon in Mexico through Life-Cycle Assessment

by
Eduardo Castillo-González
,
Lorena De Medina-Salas
,
Mario Rafael Giraldi-Díaz
*,
Raúl Velásquez-De La Cruz
and
José Rafael Jiménez-Ochoa
Facultad de Ciencias Químicas, Universidad Veracruzana, Circuito Gonzalo Aguirre Beltrán, Zona Universitaria, Xalapa 91040, Mexico
*
Author to whom correspondence should be addressed.
Clean Technol. 2024, 6(2), 551-571; https://doi.org/10.3390/cleantechnol6020029
Submission received: 31 December 2023 / Revised: 2 April 2024 / Accepted: 25 April 2024 / Published: 7 May 2024

Abstract

:
In this study, the environmental impacts associated with the intensive production of Persian lemons are assessed, including the agricultural and packing phases of the fresh fruit. A life-cycle assessment (LCA) tool was used in accordance with the ISO 14040 and 14044 standards and implemented in SimaPro PhD (9.2) software. The life-cycle inventory database was primarily composed of data collected during field visits to local lemon orchards and the main packing company in the region. The functional unit was defined as 1 kg of packed fresh Persian lemons. The selected impact categories were the carbon footprint, water footprint, and energy footprint, and the results obtained for the defined functional unit were 405.8 g CO2 eq, 40.3 L of water, and 5.9 MJ, respectively. The industrial packing phase of the fruits had a greater impact on the carbon and energy footprints, mostly due to the manufacturing of packaging materials and cardboard boxes, followed by the transportation of supplies. Regarding the water footprint, the agricultural phase was identified as the most significant contributor to water consumption, primarily attributed to maintenance operations and the application of agrochemicals.

1. Introduction

Citrus fruits are some of the most popular fruit crops in the world, due to their culinary qualities and their derivatives from processing, such as essential oils, concentrated juice, confectionery, and flavorings, among others [1,2]. In the case of limes and lemons, approximately 21 million tons were produced globally in 2022. Out of this quantity, Mexico accounted for 14.4%, making it the second-largest producer worldwide. Additionally, Mexico was ranked first globally in terms of limes and lemons exported in 2022; it held second place in both total cultivated area and commercial value of exports for the same year; and it achieved third in the commercial value of citrus produced in 2021 [3]. Regarding its average annual production growth rate, for the period spanning 2010 to 2020, it was recorded at 3.5%, marginally below the global average of 3.8%. During the same period, the cultivated area increased by just over 28% globally whereas, in Mexico, this increase was 35%. However, the yield (kg/ha) did not follow a similar growth trend during the same period (2010–2020), as the percentage increase over the same period was only 13% globally and 16% locally in Mexico [4]. This indicates that the increased demand for these citrus fruits was not generated due to improved efficiency in their agricultural process but, rather, it was mainly achieved by expanding cultivation areas, with the environmental impacts that this entailed.
In this context, the global agricultural sector is a significant contributor to a range of environmental impacts, from soil overexploitation leading to degradation, to excessive deforestation for the expansion of croplands, which has disrupted ecosystems worldwide and led to a loss of biodiversity in both flora and fauna [5]. The pollution it produces can have extensive repercussions, as its extent is often diffuse and its environmental impacts frequently extend beyond the production site itself. Moreover, pre-production processes—such as the manufacturing of agrochemicals and inputs in general, as well as their transportation to the site—must be considered, along with post-production activities involving industrial product processing, packaging, and distribution. These factors further amplify the impacts of any agro-industrial system [6].
In the case of water, agriculture accounts for 72% of the world’s freshwater consumption, much of which comes from underground sources and is primarily used for the irrigation of intensive crops. Additionally, the agricultural sector is responsible for around 90% of all water evaporation [5,7,8,9]. It has been estimated that up to 5% of global water consumption is allocated to the processing of agricultural products and their derivatives [10]. All of this has led to the quantification that the water footprint related to crop production represents a value as high as 92% of the global water footprint, just over 7.4 thousand km3 per year [11].
Regarding the energy impact, the agricultural and fishing sectors shared 2.46% of the final energy consumption worldwide, accounting for between 15% and 30% of the overall primary energy supply [12]. However, when pre- and post-production processes are included, energy consumption can be as high as 33% in 2021, due to the conclusion that approximately 75% of the energy supply to agro-industrial systems is generated beyond the agricultural field itself [5,13]. This is directly linked to greenhouse gas emissions (GHG), as over 70% of the consumed energy comes from fossil fuel sources, primarily gas and diesel. This results in direct emissions from agriculture accounting for 11% of global GHG emissions. Considering the entire agro-industrial system, this proportion can reach 31% of global GHG emissions, quantified as an average of 16.5 Gt CO2eq [14,15,16,17,18]. In the pre-consumption phase of agro-industrial systems, the primary sources of GHG emissions, in descending order, are processing, transportation, manufacturing of agrochemicals, electricity supply, and packaging, which together account for approximately 40% of the total emissions from the agro-industrial sector [14].
Given the above, it is essential to assess the environmental effects and impacts generated by the myriad activities of the citrus agricultural sector with the goal of promoting sustainable production processes [19]. The scope of this study was to assess the environmental impacts associated with the production chain of the Persian lemon, focusing on the quantification of carbon, water, and energy footprints through the application of the LCA methodology. Given the significance of Mexico as the world’s leading producer and exporter of this citrus fruit, this research aims to identify and understand the critical factors influencing these environmental impacts. Similarly, the purpose of this LCA is to generate valuable knowledge for decision makers in regions engaged in the intensive production of Persian lemon, contributing to the mitigation of associated environmental impacts. Furthermore, it aims to disseminate relevant information among scientists with expertise and interest in the field, commercial importers, and an informed public, thereby encouraging socially responsible consumption practices.

2. Materials and Methods

2.1. Definition of Goal and Scope

The methodology used for this study was based on the guidelines of the ISO14040:2006 [20] and ISO14044:2006 standards [21], including the phases shown in Figure 1: definition of goal and scope, life-cycle inventory analysis (LCI), life-cycle impact assessment (LCIE), and interpretation of results.
In the initial stage of the LCA, the product system was detailed and the study’s objectives and scope were established, which allowed for appropriate development of the subsequent methodological phases. Information was provided about the study area, the time frame for data collection, and the data sources. The functional unit was also defined, which was used for quantitative determination of the material and energy flows that constituted the product system; this facilitated the association of environmental impacts both globally and at each study stage. Subsequently, the product system boundaries were established—that is, the activities, processes, and operations involved—and each was described in detail. The input and output flows corresponding to each stage of the product system were qualitatively established, including the supply of inputs and their manufacture, the transformation processes to make the final product, the energy supply, and the transportation required for all of these. Potential pollutants were also accounted for, including effluents, emissions, and waste generated. As mentioned above, the products and co-products in each phase that constituted the product system were identified.

2.2. Life-Cycle Inventory

At this stage, the database that formed the inventory was constructed. The data of the product system were collected mainly through fieldwork and supplemented with specialized studies from the literature. The data provided by the producers in the study area consisted of averaged unique values for each analyzed parameter. This data collection process was conducted in several stages, through planned field meetings. The collected data were processed with material and energy balances to verify the data’s suitability, and then quantified with respect to the functional unit. In accordance with ISO 14044 [21], load allocations by mass were applied for the distribution of environmental impacts generated in the products and co-products defined within the product system.

2.3. Life-Cycle Impact Assessment

In the LCIA, each piece of data included in the LCI was associated with the corresponding environmental impact, according to the impact models implemented in the SimaPro software. The categories that were used in the current LCA are described below, and include the carbon footprint (CF), water footprint (WF), and energy footprint (EF).
The carbon footprint quantifies and totals the emissions of gases considered to cause the greenhouse effect (GHG), expressed in kg CO2 eq., emitted throughout the supply chain and processing of a product or service. It considers the production of raw materials, transportation, and transformation, up to the final disposal of the generated waste. The IPCC GWP 100a method was used to determine the carbon footprint, based on the Greenhouse Gas Protocol standard ISO14067 [22,23].
The water footprint impact category reflects the environmental burdens related to the water supply for any anthropic system, by quantifying the volume of water consumed (measured in m3 or liters) at all stages of the product system under evaluation. The ReCiPe methodology (v. 1.01) [24], based on the ISO 14046: 2014 standard [25], was used for this indicator.
The energy footprint accounts for the energy consumed (in MJ) in the procurement of raw materials, manufacturing, distribution, use, and end-of-life of the analyzed element, including the primary energy used to generate fuel inputs and electric power. The cumulative energy demand (CED) method was used, which categorizes different sources of energy, both renewable and non-renewable [26,27,28,29,30]. Additional specific information on the carbon, water, and energy footprints is shown in Table 1.

2.4. Life-Cycle Interpretation

In the life-cycle interpretation, the results of the LCI and LCIA are analyzed in relation to the objectives and scope proposed in the initial phase. The results obtained were compared with those of other similar studies, the stages of the product system with significant impacts were identified, and the findings presented for the current LCA were highlighted.

3. LCA of Persian Lemon Production

3.1. Goal and Scope Definition

The purpose of the current LCA was to assess the impacts associated with the production chain of the Persian lemon through the quantification of carbon, water, and energy footprints. The scope of the LCA was “from cradle to gate”, as the product system considered the cultivation, harvesting, and packaging of the Persian lemon ready for distribution. Therefore, the functional unit was 1 kg of packaged Persian lemon. The supply of required inputs and their transport to the place of consumption were included, as well as the supplied energy (mainly electricity). Regarding capital goods, agricultural implements were considered, while facilities and infrastructure were not included. For transportation, only the movement involved in supplying inputs and those specific to Persian lemon within the product system, as it transitions between the various phases of production, was considered.

3.2. Description of the Product System

The product system comprised two phases: (i) the agricultural stage, with three sub-stages—seedbed, nursery, and orchard; and (ii) the citrus industrial stage, with two sub-stages—processing and packing. Subsequently, the description of the product system is presented based on the information collected from field visits and supplemented with additional information from the literature. Figure 2 depicts the scheme corresponding to the agricultural phase.

3.2.1. Nursery and Seedbed

This phase begins with the cleaning and preparation of the land, removing weeds and generally all existing vegetation, and then clearing the soil for leveling. To carry out this activity, the use of tools for field work is necessary, including machetes, shovels, hoes, chainsaws, and, in some cases, heavy machinery such as backhoes, among others. Subsequently, disinfection of the land is carried out to reduce the population of pathogens that can affect the processes of germination, growth, and development of the seedlings. The sanitized soil is covered with polyethylene for a period of 12 days to complete the disinfection. Then, the land is ready for planting, which consists of placing the seeds in germination beds placed in the disinfected soil.
The germination and primary development of the seedling lasts approximately 60 days. During this time, irrigation is provided every 3 days, and nutrients and fungicides are added preventively. Afterward, the seedlings are transplanted to a larger area that improves their exposure to sunlight, where they conclude their development for about 3 more months. During this time, fertilizers and agrochemicals are added for sanitation; likewise, the grafting process is carried out, which guarantees the characteristics of the fruit and its quality in terms of foliage and early flowering. Once the plant reaches the required size and maturity, it is transferred to the orchard as the definitive location for its productive stage [31,32,33,34,35,36,37,38,39,40,41,42].

3.2.2. Lemon Orchard

In the orchard, the same land conditioning activities as mentioned above are initially carried out. For planting, spatial conditions are established to favor high tree densities. When planting each plant, a mixture of compost and soil is placed, agrochemicals are added to prevent infections, and the surface is covered with a layer of soil and grass. Finally, water is added. In the case of the study area, the arrangement of the lemon trees produces a density of around 278 trees per hectare. Once the planting is carried out, the stage of growth and productive development of the lemon tree begins, which is divided into three phases regarding the tree: young, adult, and long-lived. In the first phase, the tree receives the necessary care and maintenance for the first three years until it starts to bear fruit, the production as a young tree is considered for about four years, with limited yield. The adult phase lasts for approximately 18 years and, during this time, the best yield of lemon harvest is produced. Subsequently, there is a variant phase of a long-lived tree, with production gradually decreasing for about five years. Therefore, for the present study, an established orchard with 26 to 27 years of productive life was considered [43,44].
Throughout the three life stages of the lemon tree, constant maintenance is performed in the orchard. Synthetic fertilizers and natural composts are applied directly to the damp soil near the tree trunk, while foliar fertilizer is sprayed on the tree crowns with a conventional sprayer. Their addition provides the required amount of nutrients to induce greater root development, growth, increased plant biomass, and intensive fruit production all year round. Weed control is important, due to competition for nutrients in the soil, evapotranspiration of water, and pest prevention. The main phytosanitary control methods are mechanical and chemical. In the first case, rudimentary tools such as plows and harrows are used; however, in intensive crops, motorized equipment such as weeders and brush cutters are mainly used. In the case of chemical control, specific herbicides are applied according to the type of plants that are to be eliminated. Another relevant activity is the pruning of trees, which (i) has benefits for fruit development, as it allows better penetration of sunlight and air; (ii) facilitates the application of foliar fertilizers and pesticides; and, therefore, (iii) lowers the incidence of losses and diseases. Generally, this activity for young trees up to 4 years old consists of central thinning pruning, in which original branches of the central trunk are eliminated, resulting in better foliage distribution. For adult trees, maintenance pruning is performed, which consists of removing dead wood and unproductive branches, as well as removing the lower 40 cm of the crown to prevent the fruit from being close to the ground. This produces higher harvest yields, decreases the propensity to diseases by facilitating sanitation, and slows down the aging of the tree [34,45,46].
In Persian lemon cultivation, being permanent, there are parasites or pests. These can cause significant production losses, as they cause diseases that limit development, vigor, flower production, and even the death of the tree. In the orchards studied, the use of two main types of agrochemicals was recorded: insecticides/acaricides for pest control, and fungicides for fungus control. Fertilization is important to maintain high fruit production yields by providing the amount of nutrients required for intensive crops. Its application is provided in two ways: directly in the soil (near the tree trunk) and foliar (on the tree crowns). In both cases, the benefits of root development, increased tree biomass, and the contribution of micronutrients can be obtained. In the study area, the use of synthetic and organic fertilizers was identified; for the latter, mainly compost of pig origin was used. In the case of synthetic fertilizers, the use of urea and various formulas of nitrogen and phosphorus mixed with mineral micronutrients and vitamins was recorded [33,39,44,47,48,49,50,51].
Harvesting is carried out when the fruits reach their commercial maturity between 120 and 126 days after flowering and when their diameter ranges between 40 and 50 mm; likewise, the color of the fruit is considered. In the study area, harvesting is mainly performed manually, with the necessary care to avoid damage such as blows or excessive exposure to the sun that can cause deterioration of the quality of the product. Harvesting is preferably carried out on sunny days and after it has rained or been watered. Once harvested, the lemons are placed in crates with a capacity of 28 kg. Later, about 300 to 312 crates are placed in Thornton trucks that transport them to the packing site [44,52].

3.2.3. Packing Plant

The primary processes involved in the industrial processing of lemons are depicted in Figure 3. The initial sub-stage begins with the receipt of the fruit. In this phase, the lemons from the orchard are transferred to the company’s crates, during which they are labeled for traceability purposes. This allows for the control of their origin and quality which, in turn, determines their price in conjunction with other market variables such as demand and seasonality. The fruit is left to stand for 12 to 24 h, with the aim of identifying any anomalies during harvesting and transportation to the plant. After this duration, the crates are placed on rollers that transport them to the tipping area, where their contents are laid onto other rollers placed a certain distance apart. This ensures that the fruit rotates during the transfer and is cleaned of any debris, branches, or leaves it may contain. The cleaned lemons are then placed into a sorting machine, where selective separation by size is conducted. Fruits with a diameter smaller than 32 mm are removed by gravity, and the rest proceed to the next stage. The discarded fruits are sold as second-grade lemons. The selected lemons, whilst in motion on the rollers, undergo a manual inspection for identification of defects such as oleocellosis, necrosis, puffing, and citrus endoxerosis.
High-quality lemons undergo a sprinkler washing process, which is conducted using water and neutral food-grade soap, applied with micro-sprayers and mops that scrub the fruit to remove dust, insects, spores, and other surface contaminants. Then, a second immersion wash is carried out, where the lemon is placed inside a tank containing water with a chlorine solution (150 to 200 ppm), achieving sanitization of the fruit. Following this, drying is accomplished through a physical process wherein the fruit undergoes centrifugation, brushing, and aeration to remove any residual surface moisture. Once dry, the fruit is waxed, which serves to protect the fruit, retain its moisture, and extend its shelf life. This process is performed using sprayers that coat the fruit with a wax containing bactericidal and fungicidal agents of natural origin. The fruit then passes through a fan zone, which circulates air at ambient temperature to dry the wax on its surface.
The cleaned lemon proceeds to a sorter, where an automated vision system identifies and segregates the fruit based on pre-determined size or grade and color, which are used to determine its packaging and pricing. The classified lemons are directed to different outlets for temporary storage. During the packaging stages, 10- and 40-pound boxes are manually assembled, where the lemons are packed and palletized. Following this, they are placed into thermally regulated containers maintained at 13 °C. These containers are then loaded onto trucks for distribution [53].

3.3. Life-Cycle Inventory

The construction of the LCI began with the collection of information through field interviews with farmers, traders, entrepreneurs, and specialists in the cultivation and processing of Persian lemon in the study area [34,44,53]. Approximately 30 field visits were conducted over a three-month period, during which a nursery, two of the largest intensive producers in the region, and a packing facility that receives the entirety of the region’s Persian lemon production were visited. It is noteworthy that production practices are consistently uniform across approximately 250 producers within the study area. This process essentially comprised three phases: (i) reconnaissance of the study area to identify intensive Persian lemon producers and verify their willingness to provide information from their orchards; (ii) the construction of questionnaires and their subsequent distribution to farmers facilitated the acquisition of firsthand cultivation techniques (as detailed in Section 3.2), and data collection was provided and endorsed by the designated technicians who advise the visited fruit growers.; and (iii) this procedure was replicated at the main Persian lemon packing company in the study area for the collection of information from the industrial stage. The collected data focused on measuring machinery usage time, fossil fuel consumption, and water supply, as well as the amount of agrochemicals used in various agricultural phases, electrical power supply, and various required inputs, both for agricultural and industrial phases. Secondary data were supplemented with information from the specialized literature, such as local primary energy sources, external transport, and input manufacturing. In the analysis of the key inputs supplied to the product system, such as the applied agrochemicals, their manufacturing processes were considered. The data contained in the Ecoinvent 3.8 database [54] were adapted and updated with locally collected data. This adaptation ensures a more accurate representation of the environmental impacts associated with the product system under study. The gathered data were subsequently validated by conducting material and energy balances, from which the flows that make up the product system were determined. The following sections provide relevant information for the construction of the current LCI.

3.3.1. Energy Supply

In the current LCA, electrical supply was primarily used during the industrial phase of the fruit packing for its commercialization. In this phase, various equipment and machinery—mostly automated—operate using electrical energy. For electricity generation, local primary energy sources utilized for its generation were considered, as shown in Table 2. This information was obtained from technical reports issued by governmental energy management entities. In the case of fossil fuels, they were used for machinery and equipment in the agricultural phase, such as backhoes, water pumps, brush cutters, portable equipment for irrigation, and agrochemical applications, among others, as well as for those used in the manufacturing and transportation of inputs.

3.3.2. Water Supply

The water supply for the present study was considered for the three phases that constitute the agricultural stage, as well as the water used in the industrial phase. In the initial phases of the seedbed and nursery, irrigation is of paramount importance for the proper development of seedlings and plants to absorb essential nutrients for their survival. Persian lemon plants in their initial development stage require consistent moisture. Irrigation is carried out 12 times per month, typically using a water pump for this purpose.
Water management is a crucial factor in achieving abundant harvests of high quality. Citrus plants are perennial, requiring available soil moisture throughout the year for their growth and production. Water consumption (and, thus, irrigation frequency) is influenced by factors such as tree size, seasonal rainfall, temperature, soil type, and the irrigation system employed. Regions with annual precipitation in the range of 1200 to 1500 mm water depth are sufficient to meet the water requirements of a lemon orchard. In the study area, historical records show rainfall ranging from 714 to 1766 mm [59]. As a result, irrigation is only used during dry months or periods of little rain, with water sourced from nearby artificial lagoons. The orchards examined used gravity irrigation infrastructure equipped with automated sprinklers, facilitating localized moistening. This system can be applied to non-uniform soils with minimal losses and does not necessitate intensive maintenance for its operation. The installed system employs fixed plastic piping with micro-sprinkler devices. This irrigation practice is the most used in the study area, due to its low installation, maintenance, and operating costs [44,47,52].

3.3.3. Balance of Trees and Fruits in Lemon Orchard

Throughout various stages of the product system for packing Persian lemon, from the seedbed, through the nursery, to the final planting in the orchard, losses were documented for multiple reasons in the study area. In the case of the seedbed and nursery, the primary causes were non-germination and seedlings perishing during their initial development before being transferred to the lemon orchard due to disease onset or nutritional deficiencies. Regarding the fruits on the trees, many fall off before reaching maturity, and other harvested fruits do not meet the necessary quality standards and are discarded at different processing stages. The average balance of trees and fruits data collected from the study site are given in Table 3.

3.3.4. Transportation

The transportation of supplies and of the Persian lemon itself is a recurring operation in the product system. Transportation of various supplies required during the agricultural phase was considered, primarily in relation to the provision of agrochemicals. The transportation of young lemon trees to the orchard fields was also incorporated. Once the lemons were harvested, their transportation to the packing site was accounted for. In the case of the packing facility, the transportation of the required materials for packaging—mainly boxes and tools for assembly—was also included. The primary inputs for transportation were categorized according to the main stages of production.

3.3.5. Foreground Data Collection for the LCI

Table 4 provides a summarized compilation of foreground data for the product system, including the main mass flows and energy supplies that were recurrent in both agricultural and industrial operations. Each of the quantities displayed is with reference to the functional unit of 1 kg of packed Persian lemons and is categorized by the sub-stages of the product system: seedbed, nursery, lemon orchard, and packing facility. In the case of the lemon orchard, requirements for each productive stage of the existing trees (young, mature, and aged) were differentiated as, in the study area, it was identified that a single lemon orchard consisted of trees from all three productive life stages, all producing Persian lemons. The addition of metals shown in Table 4 refers to the input of tools and utensils regularly used in the maintenance of the lemon orchard.

4. Results and Discussion

4.1. Life-Cycle Impact Assessment

The environmental impacts associated with the intensive production of 1 kg of packaged Persian lemon, quantified through carbon, water, and energy footprints, were 405.8 g of CO2 eq, 40.3 L of water, and 5.9 MJ, respectively. The sections below analyze these results, highlighting the most significant findings and identifying the hot-spot processes that contributed to each footprint. Additionally, the convergence and divergence from results reported in similar research are discussed.

4.2. Carbon Footprint

Figure 4 depicts the composition of the carbon footprint results. The largest contribution, accounting for 81%, came from the packing of the lemon, while the remaining 19% originated from the agricultural stages. In terms of contribution by operation type, it was found that freight transport accounted for 66%, mainly due to the road transport of packing materials supplied to the packing facility, as well as the provision of agrochemicals required in the cultivation areas. The transport of supplies has been reported in other studies as a significant source of impact on fruit production systems [60,61].
In the case of the manufacture of fertilizers and other agrochemicals, they contributed 12%, which is consistent with other studies where these inputs have been shown to have a considerable impact during the agricultural phase [62]. Operations carried out in the cultivation areas had just under 10% impact. It is worth noting that the manufacturing of packaging materials contributed about 10%, which is in agreement with studies that have reported significant impacts when including the packaging of similar fruits [61,63,64,65].
A comparison of the current LCA with other similar studies conducted on various citrus fruits, including lemons, is depicted in Figure 5. The results presented focus exclusively on the agricultural phase, as this stage has been consistently addressed in studies in the existing literature. Figure 5 displays a wide range of outcomes (40 to 269 g CO2 eq/kg of citrus produced). This variation can be primarily attributed to operational differences and unique cultivation attributes inherent to each study. Pergola et al. [66] and Basset-Mens et al. [67] have studied both low and high planting densities as well as conventional and organic farming methods, leading to distinct GHG emission values. In certain instances, the source of irrigation water was a distinguishing factor, particularly if energy was required for the extraction of groundwater, which eventually raised GHG emissions [68]. Other influential factors included the amount of fertilizers applied and the general procurement of agrochemicals. The transportation of supplies was influenced by the geographic origin of their sourcing, which caused changes in the overall quantified emissions.

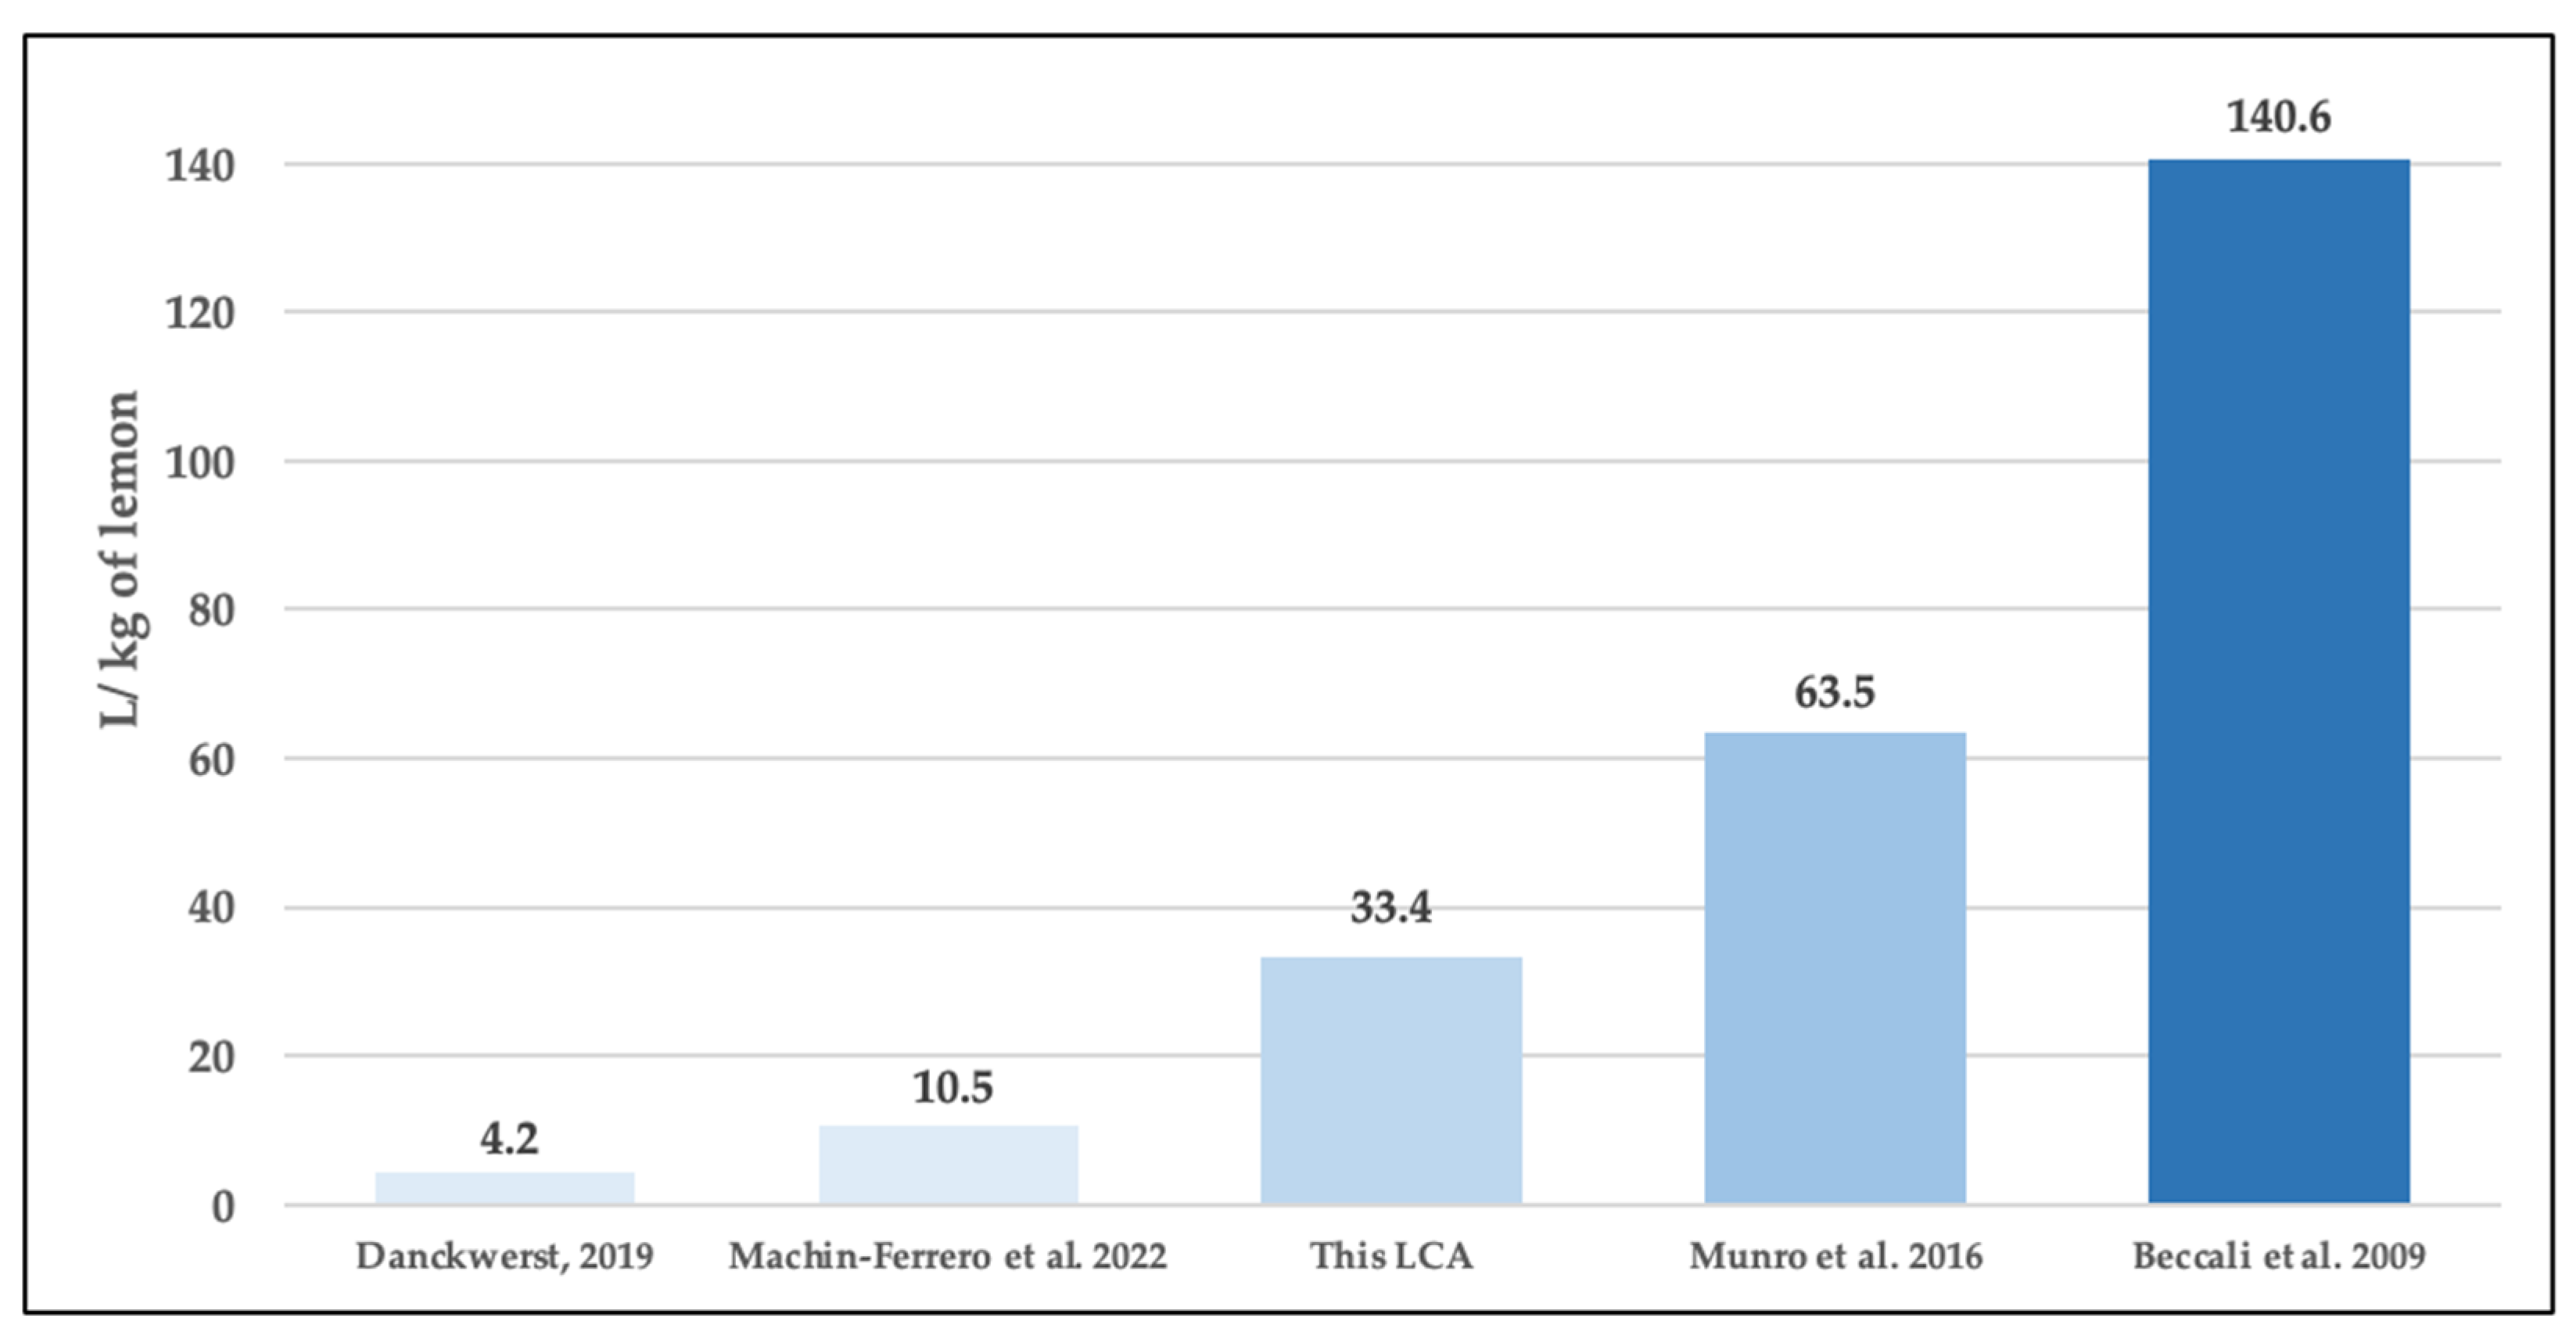
4.3. Water Footprint

The water footprint was measured at 40.29 L, as illustrated in Figure 6. Regarding the impacts of the product system stages, over 96% was due to water consumption during the lemon orchard phase; the packing facility had a lower environmental impact, accounting for slightly more than 3% of the share; while nurseries and seedbeds contributed less than 1%. In terms of impacts by operation type, two main processes stood out within the lemon orchard: the first was the application and manufacturing of agrochemicals, impacting 76% of the water footprint, followed by irrigation activities at 21%. It is important to note that, for the current LCA, irrigation was applied seasonally during the months of low rainfall—mainly from March to May—with sporadic irrigation during the rest of the year.
In terms of the type of lemon tree, adult trees had the highest water footprint impact, at 76%, due to their greater number and higher productivity. Long-lived trees accounted for just over 20%, while the remaining 4% was attributed to young lemon trees. Meanwhile, in the industrial phase, the water footprint impact was attributed to fruit washing and water used in the manufacturing of fresh fruit packaging boxes.
In Figure 7, a selection of studies is presented for comparison of the water footprint with the current LCA. The results reported in the literature concerning the water footprint exhibited a broad variability in terms of the magnitude of the values obtained. This was attributed to the various methods by which water can be supplied to the lemon orchard. For instance, if the cultivation area is situated in a region with consistent rainfall throughout the year, the need for water from irrigation systems becomes minimal, as outlined in the product system description section. In cases with an irrigation system, the primary influencing factors were the configuration of the system itself, the origin of the supplied water (i.e., whether it comes from surface or groundwater), and the necessary infrastructure for water supply. Studies that reported low water footprint values were consistent with regular rainfall throughout the year, which meant that the need for irrigation was limited [62,69]. Conversely, the higher magnitude values displayed in Figure 7 employed continuous irrigation from various water sources [70]. In this study, irrigation water was used more intensively only for two months of the year, leading to a reduced water footprint magnitude.

4.4. Energy Footprint

As mentioned in Section 4.1, the energy footprint of the current LCA was 5.9 MJ per kilogram of packaged Persian lemon. Figure 8 illustrates the energy consumption characterization across different production stages and the main processes within them. The industrial packaging stage had the highest energy consumption, primarily due to electrical energy supply, input transportation, and the manufacturing of packaging materials. It is crucial to emphasize that, globally, the transportation of inputs in both agricultural and industrial phases accounted for 73% of the energy footprint. Meanwhile, the manufacturing of packaging materials contributed 18%, while the remaining 9% was divided between the energy supply for agricultural and industrial maintenance operations, as well as the production of agrochemicals.
The energy supplied to intensive crops, as in the current study, is associated with various factors, such as the productive potential. For instance, there is a marked difference between an ancient tree and a young one, as will be discussed in the subsequent section. Additionally, the efficient use of agrochemicals to balance agroecological resources is also significant [72]. The transportation of inputs and the manufacturing of these inputs play a pivotal role in the dynamics of energy consumption. In this regard, during the lemon packing process, the production of the boxes had a significant impact on the magnitude of the energy footprint. Research studies have indicated that post-production processes of food products have substantial impacts, which are contingent upon the complexity of the production chain and the quantity and type of supplies required for their processing [73,74].
In Figure 9, the contribution of energy supply from its primary source is depicted. It was observed that fossil primary energy accounted for the most significant supply, holding an 88% share. Of this amount, the most substantial contributor was the transportation of inputs by vehicles powered by fossil fuels. This transportation encompasses the provisioning of fertilizers, packaging, and various materials needed in the industrial phase, as well as the transfer of the lemons from production sites to the packing facility. Another significant factor in the energy supply was the manufacturing of boxes for the packaging stage of the Persian lemons, accounting for a nearly 10% share. It is crucial to highlight that, depending on the box type chosen, its capacity can range from 4 to 15 kg of Persian lemon per packaged box. Regarding other primary energy sources, renewable biomass energy was prominent, constituting around 7%. This prominence results from leveraging biomass-derived energy for the electric power generation required across the stages that form the product system.
In Figure 10, various studies are shown that have reported energy supply for the agricultural phase of lemon production. The presented studies indicated variations in the reported values, largely attributable to the level of mechanization, which refers to the utilization of equipment for lemon orchard maintenance. This maintenance primarily involves the application of fertilizers, pruning, and irrigation. For the energy associated with lemon orchard upkeep, which entails the operation of equipment using fuels and electricity, the reported range spanned 18–50%. In the present LCA, this figure was 18%, as the study area did not showcase a widespread use of agricultural machinery but leaned towards rudimentary equipment for pruning tasks and soil preparation. In terms of agrochemicals, encompassing fertilizers and pest control agents, the reported energy contribution ranged between 43 and 65% (this LCA: 64%).
In investigations where agricultural mechanization was limited, agrochemicals accounted for a more significant proportion of the total energy provision. In terms of irrigation for the lemon orchard, the supplied energy ranged from 6 to 19% (this LCA: 17%). This outcome is significantly influenced by the climatic conditions of the study regions, as previously noted. In the study area, for the present LCA, pump energy was sparingly used for irrigation during months of low rainfall, in order to ensure a consistent yield of lemons.

4.5. Analysis by Tree Yield in the Lemon Orchard

As an additional analysis, the impacts of carbon, water, and energy footprints were quantified in the current LCA according to the type of lemon trees present in the study area; that is, quantifying the impacts generated by young, mature, and old lemon trees. In all cases, it was observed that the mature lemon trees had the greatest impact on the three footprints quantified, as shown in Figure 11 (impact units per tree), due to their higher input requirements and care during their peak productivity stage. However, when the yield from each type of lemon tree was included in the results, the impact value increased for young and old trees, due to their low productivity. This effect was more pronounced for young lemon trees, which have no yield in their initial growth stage and low yields in their early flowering years, before maturing into adult lemon trees. In the case of old lemon trees, their yield decreases progressively over the years, necessitating increased maintenance care. This, combined with their lower yields, heightens the impacts on the three footprints, as illustrated in Figure 11 (impact units per kg of fruit).

5. Conclusions

In this research, the environmental impacts associated with the cultivation and packaging processing of Persian lemons were quantified in terms of carbon, water, and energy footprints. An LCI database was constructed using information from local farmers and data from the region’s packing plant. The overall results demonstrated that the fruit cultivation stage was the primary source of environmental impact on the water footprint. Conversely, the industrial packaging phase had greater significance for carbon and energy footprints, due to the consumption of electrical energy and the manufacturing of packaging materials. In the agricultural phase, the formulation and application of various agrochemicals provided to the lemon orchard were major contributors to carbon and energy footprints. Water supply for irrigation and the water used in the application of different agrochemicals, which are necessary for year-round intensive cultivation, were the main contributors to the water footprint. Additionally, farmers in this region have not widely adopted drip irrigation, which would result in more efficient water consumption.
It was demonstrated that, during the industrial packaging stage, the primary contributors to the evaluated environmental impacts in the carbon and energy footprints were not the different equipment and operations. Instead, it was identified that the packaging materials—primarily the manufacturing of cardboard boxes—had the most significant impact in the industrial phase. This effect is accentuated due to the packing industry’s lack of a box recycling management system. The majority of the packed lemons were designated for export outside of the country, making the boxes in such circumstances irretrievable. This situation results in the need for a continuous supply of cardboard boxes. Finally, it was shown that young and old lemon trees—being less productive in fruit production during their early growth stages and towards the end of their useful life, respectively—contribute to greater impacts in the three footprints studied in the current LCA.

Author Contributions

Conceptualization, M.R.G.-D., E.C.-G. and L.D.M.-S.; methodology, E.C.-G.; formal analysis, L.D.M.-S.; writing—original draft preparation, M.R.G.-D.; writing—review and editing, M.R.G.-D., E.C.-G. and L.D.M.-S.; resources, E.C.-G.; validation, L.D.M.-S.; supervision, M.R.G.-D.; data curation, R.V.-D.L.C. and J.R.J.-O.; project administration, M.R.G.-D.; investigation R.V.-D.L.C. and J.R.J.-O. All authors have read and agreed to the published version of the manuscript.

Funding

This research received no external funding.

Institutional Review Board Statement

Not applicable.

Informed Consent Statement

Not applicable.

Data Availability Statement

Data are contained within the article.

Conflicts of Interest

The authors declare no conflicts of interest.

References

  1. Khan, M.M.; Al-Yahyai, R.; Al-Said, F. The Lime: Botany, Production and Uses, 1st ed.; CAB International: Wallingford, UK, 2017; pp. 1–273. ISBN 9781780647845. [Google Scholar]
  2. Vargas-Canales, J.M.; Guido-López, D.L.; Rodríguez-Haros, B.; Bustamante-Lara, T.I.; Camacho-Vera, J.H.; Orozco-Cirilo, S. Evolution of the specialization and competitiveness of lemon production in Mexico. Rev. Mex. Cienc. Agríc. 2020, 11, 1043–1056. [Google Scholar] [CrossRef]
  3. Food and Agriculture Organization. Crops and Livestock Products. Available online: https://www.fao.org/faostat/es/#data/QCL (accessed on 1 March 2024).
  4. Food and Agriculture Organization. Citrus Fruit Statistical Compendium 2020. Available online: https://www.fao.org/3/cb6492en/cb6492en.pdf (accessed on 1 April 2023).
  5. Organization for Economic Cooperation and Development; Food and Agriculture Organization. Environmental Sustainability in Agriculture 2023; FAO: Rome, Italy, 2023; pp. 1–24. [Google Scholar]
  6. Tubiello, F.N.; Rosenzweig, C.; Conchedda, G.; Karl, K.; Gütschow, J.; Xueyao, P.; Sandalow, D. Greenhouse gas emissions from food systems: Building the evidence base. Environ. Res. Lett. 2021, 16, 065007. [Google Scholar] [CrossRef]
  7. Hoogeveen, J.; Faurès, J.-M.; Peiser, L.; Burke, J.; Van de Giesen, N. GlobWat—A global water balance model to assess water use in irrigated agriculture. Hydrol. Earth Syst. Sci. 2015, 19, 3829–3844. [Google Scholar] [CrossRef]
  8. Food and Agriculture Organization of the United Nations. The State of Food and Agriculture 2020: Overcoming Water Challenges in Agriculture; FAO: Rome, Italy, 2020; pp. 1–210. ISBN 978-92-5-133441-6. [Google Scholar]
  9. United Nations. The United Nations World Water Development Report 2022: Groundwater: Making the Invisible Visible; UNESCO: Paris, France, 2022; pp. 1–225. ISBN 978-92-3-100507-7. [Google Scholar]
  10. Boretti, A.; Rosa, L. Reassessing the projections of the World Water Development Report. npj Clean Water 2019, 2, 15. [Google Scholar] [CrossRef]
  11. Naciones Unidas. Informe Mundial de las Naciones Unidas Sobre el Desarrollo de los Recursos Hídricos 2021: El Valor del Agua; UNESCO: París, France, 2021; pp. 1–207. ISBN 978-92-3-300164-0. [Google Scholar]
  12. International Energy Agency. Statistics Report: Key World Energy Statistics 2021. Available online: https://www.iea.org/reports/key-world-energy-statistics-2021 (accessed on 4 February 2023).
  13. International Renewable Energy Agency; Food and Agriculture Organization of the United Nations. Renewable Energy for Agri-Food Systems—Towards the Sustainable Development Goals and the Paris Agreement; FAO: Rome, Italy, 2021; pp. 1–89. ISBN 978-92-5-135235-9. [Google Scholar]
  14. Food and Agriculture Organization. Greenhouse Gas Emissions from Agri-Food Systems—Global, Regional And Country Trends, 2000–2020; FAOSTAT Analytical Brief No. 50; FAO: Rome, Italy, 2022; pp. 1–12. [Google Scholar]
  15. Flammini, A.; Pan, X.; Tubiello, F.N.; Qiu, S.Y.; Rocha Souza, L.; Quadrelli, R.; Sims, R. Emissions of greenhouse gases from energy use in agriculture, forestry and fisheries: 1970–2019. Earth Syst. Sci. Data 2022, 14, 811–821. [Google Scholar] [CrossRef]
  16. Organisation for Economic Co-Operation and Development; Food and Agriculture Organization. OECD-FAO Agricultural Outlook 2022–2031; FAO: Rome, Italy; OECD: Paris, France, 2022; pp. 1–363. ISBN 978-92-5-136313-3. [Google Scholar]
  17. Rosa, L.; Rulli, M.C.; Ali, S.; Chiarelli, D.D.; Dell’Angelo, J.; Mueller, N.D.; D’Odorico, P. Energy implications of the 21st century agrarian transition. Nat. Commun. 2021, 12, 2319. [Google Scholar] [CrossRef]
  18. Tubiello, F.; Karl, K.; Flammini, A.; Conchedda, G.; Oblylayrea, G. Food Systems Emissions Shares, 1990–2019 (Nov 2021 FAOSTAT Update). 2021. Available online: https://zenodo.org/records/5615082(accessed on 5 March 2023). [CrossRef]
  19. Nicolo, B.F.; De Luca, A.I.; Stillitano, T.; Iofrida, N.; Falcone, G.; Gulisano, G. Environmental and economic sustainability assessment of navel oranges from the cultivation to the packinghouse according to environmental product declarations system. Calitatea 2017, 18, 108–112. [Google Scholar]
  20. ISO 14040; Environmental Management-Life Cycle Assessment-Principles and Framework. International Organization for Standardization: Geneva, Switzerland, 2006. Available online: https://www.iso.org/obp/ui#iso:std:iso:14040:ed-2:v1:es (accessed on 29 July 2023).
  21. ISO 14044; Environmental Management-Life Cycle Assessment-Requirements and Guidelines. International Organization for Standardization: Geneva, Switzerland, 2006. Available online: https://www.iso.org/obp/ui/#iso:std:iso:14044:ed-1:v1:es (accessed on 29 July 2023).
  22. ISO 14067; Greenhouse Gases. Carbon Footprint of Products. Requirements and Guidelines for Quantification. International Organization for Standardization: Geneva, Switzerland, 2018. Available online: https://www.iso.org/obp/ui#iso:std:iso:14067:ed-1:v1:en (accessed on 29 July 2023).
  23. Jolliet, O.; Antón, A.; Boulay, A.M.; Cherubini, F.; Fantke, P.; Levasseur, A.; McKone, T.; Michelsen, O.; Milà i Canals, L.; Motoshita, M.; et al. Global guidance on environmental life cycle impact assessment indicators: Impacts of climate change, fine particulate matter formation, water consumption and land use. Int. J. Life Cycle Assess 2018, 23, 2189–2207. [Google Scholar] [CrossRef]
  24. Huijbregts, M.A.J.; Steinmann, Z.J.N.; Elshout, P.M.F. ReCiPe2016: A harmonized life cycle impact assessment method at mid- point and endpoint level. Int. J. Life Cycle Assess. 2017, 22, 138–147. [Google Scholar] [CrossRef]
  25. ISO 14046; Environmental Management—Water Footprint—Principles, Requirements and Guidelines. International Organization for Standardization: Geneva, Switzerland, 2014. Available online: https://www.iso.org/obp/ui#iso:std:iso:14046:ed-1:v1:es (accessed on 29 July 2023).
  26. Huijbregts, M.A.J.; Rombouts, L.J.A.; Hellweg, S.; Frischknecht, R.; Hendriks, A.J.; Van De Meent, D.; Ragas, A.M.J.; Reijnders, L.; Struijs, J. Is Cumulative Fossil Energy Demand a Useful Indicator for the Environmental Performance of Products? Environ. Sci. Technol. 2006, 40, 641–648. [Google Scholar] [CrossRef]
  27. Huijbregts, M.A.J.; Hellweg, S.; Frischknecht, R.; Hendriks, H.W.M.; Hungerbühler, K.; Hendriks, A.J. Cumulative Energy Demand as Predictor for the Environmental Burden of Commodity Production. Environ. Sci. Technol. 2010, 44, 2189–2196. [Google Scholar] [CrossRef] [PubMed]
  28. Puig, R.; Fullana, I.P.P.; Baquero, G.; Riba, J.-R.; Gala, A.B. A Cumulative Energy Demand indicator (CED), life cycle based, for industrial waste management decision making. Waste Manag. 2013, 33, 2789–2797. [Google Scholar] [CrossRef]
  29. Frischknecht, R.; Wyss, F.; Knöpfel, S.B.; Lützkendorf, T.; Balouktsi, M. Cumulative energy demand in LCA: The energy harvested approach. Int. J. Life Cycle Assess. 2015, 20, 957–969. [Google Scholar] [CrossRef]
  30. Hischier, R.; Weidema, B.; Althaus, H.-J.; Bauer, C.; Doka, G.; Dones, R.; Frischknecht, R.; Hellweg, S.; Humbert, S.; Jungbluth, N.; et al. Implementation of Life Cycle Impact Assessment Methods, Final Report Ecoinvent v2; Swiss Centre for Life Cycle Inventories: Dübendorf, Switzerland, 2010. [Google Scholar]
  31. Arango, E.; Capote, M.; Morera, S.; Clemente, J. Viveros protegidos de cítricos. Manejo Técnico. In Taller Regional Sobre Viveros de Cítricos; IIFT: Havana, Cuba, 2010; pp. 1–18. [Google Scholar]
  32. Berdeja-Arbeu, R.; Aguilar-Méndez, L.; Moreno-Velazquez, D.; Vázquez-Huerta, G.; Ibáñez-Martínez, A.; Ontiveros-Capurata, R. Calidad de fruta de lima “Persa” en diferentes portainjertos en Veracruz, México. Acta Agríc. Pecu. 2016, 2, 17–22. [Google Scholar]
  33. Estrada-Venegas, E.G.; Acuña-Soto, J.A.; Chaires-Grijalva, M.P.; Equihua-Martínez, A. Ácaros Asociados y de Importancia Económica a los “Sistemas Producto” en México, y la Relevancia de Algunas Especies que Afectan Estos Cultivos con Importancia Cuarentenaria. Sociedad Mexicana de Entomología: Texcoco, México, 2013; pp. 151–236.
  34. Flores Contreras, C.; (Citrus producer, Emiliano Zapata, Veracruz, Mexico). Personal communication, 2022.
  35. García, A.; Rodríguez, K.; Puente, A.; Valero, L.; Rodríguez, G. Evaluación de alternativas para disminuir los niveles de hongos fitopatógenos del suelo en áreas de replantación de cítricos. Cent. Agríc. 2011, 38, 5–7. [Google Scholar]
  36. Irigoyen, J.N.; Cruz Vela, M.A. Guía Ténica de Semilleros y Viveros Frutales; Ministerio de Agricultura y Ganadería: San Salvador, El Salvador, 2005; pp. 1–40. [Google Scholar]
  37. Jaramillo, J.; Rodríguez, V.P.; Guzmán, M.; Zapata, M.; Renfigo, T. En la Producción de Tomate Bajo Condiciones Protegidas; FAO: Santiago de Chile, Chile, 2007; pp. 1–316. [Google Scholar]
  38. Luis, M.; Peña, M.; Collazo, C.; Ramos, P.; Llauger, R. Enfermedades Bacterianas y Fungosas en Viveros de Cítricos: Características y Control. In Taller Regional Sobre Viveros de Cítricos; IIFT: Havana, Cuba, 2010; pp. 1–42. [Google Scholar]
  39. Macías-Rodríguez, L.; Santillan-Ortega, C.; Robles-Bermúdez, A.; Isidora-Aquino, N.; Ortíz-Catón, M. Insecticidas de Bajo Impacto Ambiental para el Control de Diaphorina citri (Hemiptera: Psyllidae) en Limón Persa en “La Fortuna”, Nayarit, México. Bio Cienc. 2013, 2, 154–161. [Google Scholar]
  40. Sandoval-Rincón, J.A.; Curti-Díaz, S.A. Producción de Planta Certificada en Vivero; Instituto Nacional de Investigaciones Forestales, Agricolas y Pecuarias, Martínez de la Torre: Veracruz, Mexico, 2011; pp. 1–43. ISBN 978-607-425-654-3. [Google Scholar]
  41. Steduto, P.; Hslao, T.C.; Fereres, E.; Raes, D. Respuesta del Rendimiento de los Cultivos al Agua; FAO: Roma, Italy, 2012; pp. 1–531. [Google Scholar]
  42. Trinidad Santos, A.; Aguilar Manjarrez, D. Fertilización foliar, un respaldo importante en el rendimiento de los cultivos. Terra Latinoam. 1999, 17, 247–255. [Google Scholar]
  43. Mayorga-Castañeda, F.J. Manejo Agronómico para la Producción de Limón Persa en el Estado de Morelos; Secretaría de Agricultura, Ganadería, Desarrollo Forestal, Pesca y Alimentación: Morelos, Mexico, 2009. [Google Scholar]
  44. Jiménez Pérez, M.; (Citrus producer, Emiliano Zapata, Veracruz, Mexico). Personal communication, 2022.
  45. Rodríguez-Cedillos, M. Cultivo de Limón Pérsico; Centro Nacional de Tecnología Agropecuaria y Forestal: San Salvador, El Salvador, 2002; pp. 1–32. [Google Scholar]
  46. Vanegas, M. Guía Técnica Cultivo del Limón Persa, 1st ed.; Escobar-de-León, J., Alas, F.A., Eds.; Editorial Maya: San Salvador, El Salvador, 2002; pp. 1–46. [Google Scholar]
  47. Curti-Díaz, S.A.; Laredo-Salazar, X.; Díaz-Zorrilla, U.; Sandoval-Rincón, J.A.; Hernández-Hernández, J. Tecnología para Producir Limón Persa; Instituto Nacional de Investigaciones Forestales, Agricolas y Pecuarias: Veracruz, Mexico, 2000; pp. 1–166. [Google Scholar]
  48. González-Mancilla, A.; Rivera-Cruz, M.d.; Ortíz-García, C.F.; Almaraz-Suárez, J.J.; Trujillo-Narcía, A.; Cruz-Navarro, G. Use of organic fertilisers to improve soil chemical and microbiological properties and citric Citrage troyer growth. Univ. Cienc. 2013, 29, 123–139. [Google Scholar]
  49. Velazquez, P. Momento óptimo de aplicación de pulverizaciones cúpricas para el control de la cancrosis de los cítricos en hojas de limonero en Famaillana, Tucumán. Hortic. Argent. 2008, 27, 5–10. [Google Scholar]
  50. Vargas, F.; Viera, M.; Anteparra, M. Efecto comparativo de paraquat, glifosato y gramocil para el control de malezas en cítricos en Tulumayo, Loncio Prado. Investig. Amaz. 2012, 2, 20–26. [Google Scholar]
  51. Vegas-Rodríguez, U.; Narrea Cango, M. Manejo Integrado del Cultivo de Limón; Universidad Nacional Agraria la Molina: Piura, Peru, 2011; pp. 1–43. [Google Scholar]
  52. Alia-Tejacal, I.; Lugo-Alonso, A.; Ariza-Flores, R.; Valdez-Aguilar, L.A.; Víctor, L.M.; Pacheco-Hernández, P. Manual de Tecnología de Producción en Limón “Persa” y Naranja “Valencia” en el Estado de Morelos; Instituto Nacional de Investigaciones Forestales, Agricolas y Pecuarias: Morelos, Mexico, 2011; pp. 1–99. [Google Scholar]
  53. Hernández Ruíz, A.; (Persian Lime Packing Facility, Emiliano Zapata, Veracruz, Mexico); Contreras Mejía, A.K.; (Persian Lime Packing Facility, Emiliano Zapata, Veracruz, Mexico); Morales Navarro, A.; (Persian Lime Packing Facility, Emiliano Zapata, Veracruz, Mexico). Personal communication, 2022.
  54. Ecoinvent. The Ecoinvent Database. Available online: https://www.ecoinvent.org/database/database.html (accessed on 31 January 2023).
  55. Secretaría de Energía. Balance Nacional de Energía. Gobierno de México. 2021. Available online: https://www.gob.mx/cms/uploads/attachment/file/805509/BNE-2021.pdf (accessed on 3 March 2023).
  56. Secretaría de Energía. Informe Pormenorizado Sobre el Desempeño y las Tendencias de la Industria Eléctrica Nacional 2021. Gobierno de México. Available online: http://base.energia.gob.mx/InfPormenorizado/IP2021.pdf (accessed on 15 March 2023).
  57. Secretaría de Energía. Reporte Anual del Potencial de Mitigación de GEI en el Sector Eléctrico. Gobierno de México. Available online: https://www.gob.mx/cms/uploads/attachment/file/754392/Reporte_Anual_Pot__Mit_SE__VF.pdf (accessed on 30 January 2023).
  58. Giraldi-Díaz, M.R.; Castillo-González, E.; De Medina-Salas, L.; Velasquez-De la Cruz, R.; Huerta-Silva, H.D. Environmental impacts associated with intensive production in pig farms in Mexico through life cycle assessment. Sustainability 2021, 13, 11248. [Google Scholar] [CrossRef]
  59. Sistema Meteorológico Nacional. Normales Climatológica por Estado. Comisión Nacional del Agua, Gobierno de México. Available online: https://smn.conagua.gob.mx/es/informacion-climatologica-por-estado?estado=ver (accessed on 15 November 2022).
  60. Janse-van Vuuren, P.F. Regional Resource Flow Model Fruit Sector Report; GreenCape, Department of Economic Development and Tourism, Western Cape Government: Cape Town, South Africa, 2015. [Google Scholar]
  61. Frankowska, A.; Jeswani, H.K.; Azapagic, A. Life cycle environmental impacts of fruits consumption in the UK. J. Environ. Manag. 2019, 248, 109111. [Google Scholar] [CrossRef] [PubMed]
  62. Machin Ferrero, L.M.; Wheeler, J.; Mele, F.D. Life cycle assessment of the Argentine lemon and its derivatives in a circular economy context. Sustain. Prod. Consum. 2022, 29, 672–684. [Google Scholar] [CrossRef]
  63. Machin Ferrero, L.M.; Araujo, P.Z.; Nishihara Hun, A.L.; Valdeón, D.H.; Mele, F.D. Water footprint assessment of lemon and its derivatives in Argentina: A case study in the province of Tucumán. Int. J. Life Cycle Assess. 2021, 26, 1505–1519. [Google Scholar] [CrossRef]
  64. Beccali, M.; Cellura, M.; Iudicello, M.; Mistretta, M. Resource consumption and environmental impacts of the agrofood sector: Life cycle assessment of Italian citrus-based products. Environ. Manag. 2009, 43, 707–724. [Google Scholar] [CrossRef] [PubMed]
  65. Bell, E.M.; Horvath, A. Modeling the carbon footprint of fresh produce: Effects of transportation, localness, and seasonality on US orange markets. Environ. Res. Lett. 2020, 15, 034040. [Google Scholar] [CrossRef]
  66. Pergola, M.; D’Amico, M.; Celano, G.; Palese, A.M.A.; Scuderi, A.; Di Vita, G.; Inglese, P. Sustainability evaluation of Sicily’s lemon and orange production: An energy, economic and environmental analysis. J. Environ. Manag. 2013, 128, 674–682. [Google Scholar] [CrossRef] [PubMed]
  67. Basset-Mens, C.; Vannière, H.; Grasselly, D.; Heitz, H.; Braun, A.; Payen, S.; Biard, Y. Environmental impacts of imported and locally grown fruits for the French market: A cradle-to-farm-gate LCA study. Fruits 2016, 71, 93–104. [Google Scholar] [CrossRef]
  68. Aguilera, E.; Guzmán, G.; Alonso, A. Greenhouse gas emissions from conventional and organic cropping systems in Spain. I. Herbaceous crops. Agron. Sustain. Dev. 2015, 35, 713–724. [Google Scholar] [CrossRef]
  69. Danckwerts, L. Water Footprint and Economic Water Productivity of Citrus Production: A Comparison across Three River Valleys in the Eastern Cape Midlands. Master’s Thesis, Rhodes University Grahamstown South Africa, Makhanda, South Africa, 2019. [Google Scholar]
  70. Munro, S.A.; Fraser, G.C.; Snowball, J.D.; Pahlow, M. Water footprint assessment of citrus production in South Africa: A case study of the Lower Sundays River Valley. J. Clean. Prod. 2016, 135, 668–678. [Google Scholar] [CrossRef]
  71. Machin Ferrero, L.M.; Araujo, P.Z.; Valdeón, D.H.; Hun, A.L.N.; Mele, F.D. Water footprint of lemon production in Argentina. Sci. Total Environ. 2022, 816, 151614. [Google Scholar] [CrossRef]
  72. Kumar, S.; Singh, S.P.; Meena, R.S.; Lalotra, S.; Parihar, R.K.; Mitra, B. Reduction of Energy Consumption in Agriculture for Sustainable Green Future. In Input Use Efficiency for Food and Environmental Security; Bhatt, R., Meena, R.S., Hossain, A., Eds.; Springer: Singapore, 2021. [Google Scholar]
  73. Fardet, A.; Rock, E. Ultra-processed foods and food system sustainability: What are the links? Sustainability 2020, 12, 6280. [Google Scholar] [CrossRef]
  74. Tubiello, F.N.; Karl, K.; Flammini, A.; Gütschow, J.; Obli-Laryea, G.; Conchedda, G.; Torero, M. Pre-and post-production processes increasingly dominate greenhouse gas emissions from agri-food systems. Earth Syst. Sci. Data 2022, 14, 1795–1809. [Google Scholar] [CrossRef]
  75. Yilmaz, H.; Aydin, B. Comparative input-output energy analysis of citrus production in Turkey: Case of Adana province. Erwerbs-Obstbau 2020, 62, 29–36. [Google Scholar] [CrossRef]
  76. Özbek, O.; Dokumacı, K.Y.; Gökdoğan, O. Analysis of Energy Use Efficiency and Greenhouse Gas Emissions of Lemon (Citrus lemon L.) Production in Turkey. Erwerbs-obstbau 2023, 65, 1705–1712. [Google Scholar] [CrossRef] [PubMed]
Figure 1. Life-cycle assessment methodology. Source: own elaboration based on [20].
Cleantechnol 06 00029 g001
Figure 2. Composition of the agricultural stage of Persian lemon production. Source: own elaboration.
Cleantechnol 06 00029 g002
Figure 3. Industrial packaging stage of the Persian lemon. Source: own elaboration.
Cleantechnol 06 00029 g003
Figure 4. Components of the carbon footprint from intensive production of Persian lemon. Source: own elaboration.
Cleantechnol 06 00029 g004
Figure 5. Carbon footprint of citrus production from selected case studies. Source: own elaboration based on [61,62,66].
Cleantechnol 06 00029 g005
Figure 6. Components of the water footprint from intensive production of Persian lemon. Source: own elaboration.
Cleantechnol 06 00029 g006
Figure 7. Water footprint of citrus production from selected case studies. Source: own elaboration based on [64,69,70,71].
Cleantechnol 06 00029 g007
Figure 8. Components of the energy footprint from intensive production of Persian lemon. Source: own elaboration.
Cleantechnol 06 00029 g008
Figure 9. Primary energy by supply source from intensive production of packaged Persian lemon. Source: own elaboration.
Cleantechnol 06 00029 g009
Figure 10. Energy footprint for lemon production from selected LCA studies. Source: own elaboration based on [61,64,66,75,76].
Cleantechnol 06 00029 g010
Figure 11. Environmental impacts generated based on the productive life stage of lemon trees. Source: own elaboration.
Cleantechnol 06 00029 g011
Table 1. Quantification description of parametric footprints used in the current LCA *.
FootprintEquationDescription
Carbon C F = G   G W P g a s Expressed in units of kg CO2 eq, the carbon footprint (CF) equation epitomizes the aggregate global warming potential (GWP) of all substances tallied within the inventory. Herein, G denotes the quantity of the examined gas emission, and GWPgas represents its global warming potential [23].
Water W F = C h a r a c t e r i z a t i o n   f a c t o r w a t e r   c o n s u m p t i o n The application of the water footprint (WF) equation was based on the model proposed by Huijbregts et al. [24], which assesses the cumulative impact of water consumption measured in cubic meters (m3). The utilized weighting parameters associate (Characterization factor) the volume of consumed water with water extracted from either surface or subterranean sources, multiplied by the water flows accounted (water consumption) for in the inventory pertinent to each process within the product system.
Energy E F = E n e r g y   f a c t o r f u e l The energy footprint (EF) equation was derived from the accumulated energy model, aggregating energy flows provided within the product system. Conversion factors (energy factor) for each type of primary energy source, as proposed by Hischier et al. [30], were applied, and multiplied by the fuel consumption computed in the inventory.
* Note: these computations were executed using the methodologies embedded in the SimaPro software, as delineated in Section 2.3.
Table 2. Characterization of the electrical power generation at the national level a.
Type of EnergyPrimary Fuel SuppliedNet Calorific Value Conversion FactorPrimary Energy Share b
(%)
Energy Efficiency (%)Self-Consumption c (%)Electric Power Generation (%)
Natural gas9.43 × 109 m339.08 MJ/m335.9843.30.9437.03
Coal8.44 × 109 kg19.43 MJ/kg16.0141.17.7914.56
Fuel oil3.36 × 109 L40.74 MJ/L13.3537.17.2911.02
Diesel4.55 × 108 L37.68 MJ/L1.6736.64.411.41
Uranium3.82 × 104 kg3.29 GJ/g12.2634.62.769.90
Hydro-energy 8.9091.90.8919.45
Geothermal 10.7516.75.554.07
Wind 1.0799.60.052.56
Solar (photovoltaic) 0.00199.21.000.001
Notes: a A factor of 10.75% for transmission and distribution losses was considered. b The total primary energy was 1.025 × 10¹² MJ. c Proportion of energy generated for self-consumption from production plants. Source: own elaboration with information from [55,56,57,58].
Table 3. Balance of trees and fruits in the lemon orchard *.
Tree/Ha Lemons
Sprouted lemon plants117Fruits on the tree1126
Seeded lemon plants115Harvested fruits113
Plants in the lemon orchard110Selected fruits111
Young lemon trees106Packed fruits100
Adult lemon trees100
* Note: values were scaled to achieve 100 in the final step. Source: own compilation based on information gathered from the study area.
Table 4. Data collection summary in the foreground of the product system.
StagesInput/OutputQuantityUnit
Seedbed and nurserySeedbed placeFertilizers3.5217 × 10−9kg
Fossil fuels3.7122 × 10−4kg
Metals-supply9.0671 × 10−10kg
Pesticides1.2586 × 10−7kg
Plastics supplies3.5093 × 10−10kg
Transport3.4262 × 10−6kg
Water4.6984 × 10−6m3
Emissions1.0905 × 10−3kg
Residual agrochemicals1.7165 × 10−8kg
Wastewater3.6647 × 10−6m3
NurseryFertilizers7.8513 × 10−4kg
Metals-supply7.0949 × 10−7kg
Pesticides3.5100 × 10−6kg
Plastics supplies2.1933 × 10−6kg
Transport4.6157 × 10−4tkm
Water4.0749 × 10−3m3
Emissions2.5625 × 10−4kg
Residual agrochemicals9.7375 × 10−6kg
Wastewater1.3002 × 10−5m3
Lemon orchardOverall maintenanceFossil fuels1.0142 × 10−5kg
Metals-supply9.8954 × 10−10kg
Plastics supplies1.5851 × 10−10kg
Transport5.1763 × 10−6tkm
Water2.1285 × 10−3m3
Emissions4.9574 × 10−5kg
Wastewater1.6602 × 10−3m3
Young lemon treeFertilizers4.9365 × 10−6kg
Pesticides7.3265 × 10−6kg
Transport5.9616 × 10−5tkm
Water1.4782 × 10−3m3
Residual agrochemicals1.6381 × 10−6kg
Wastewater1.3714 × 10−7m3
Adult lemon treeFertilizers1.1664 × 10−2kg
Pesticides2.6366 × 10−5kg
Transport1.8929 × 10−3tkm
Water1.0274 × 10−3m3
Residual agrochemicals2.9263 × 10−3kg
Wastewater7.8694 × 10−9m3
Long-lived lemon treeFertilizers2.2067 × 10−3kg
Pesticides1.5095 × 10−5kg
Transport3.9766 × 10−4tkm
Water4.6616 × 10−4m3
Residual agrochemicals7.3416 × 10−4kg
Wastewater7.8694 × 10−9m3
IndustrializedPacking houseChemical supplies2.5995 × 10−3kg
Electric power5.5441 × 10−3MJ
Packing materials1.6057 × 10−1kg
Transport3.4466 × 100tkm
Water1.6400 × 10−5m3
Wastewater9.3620 × 10−6m3
Source: own compilation based on information gathered from the study area.
Disclaimer/Publisher’s Note: The statements, opinions and data contained in all publications are solely those of the individual author(s) and contributor(s) and not of MDPI and/or the editor(s). MDPI and/or the editor(s) disclaim responsibility for any injury to people or property resulting from any ideas, methods, instructions or products referred to in the content.

