
Liquid Biopsy Profiling with Multiple Tests in Patients with Metastatic Breast Cancer

 , , , , and
Abstract
:1. Introduction
2. Materials and Methods
2.1. Patient Population
2.2. Sample Collection
2.3. FMI FoundationACT Assay
2.4. NIBR PanCancer ctDNA Assay
2.5. USC High-Definition Single Cell Assay (HDSCA) and Thermo Fisher Oncomine Breast cfDNA Assay v2
2.6. Data Analysis
3. Results
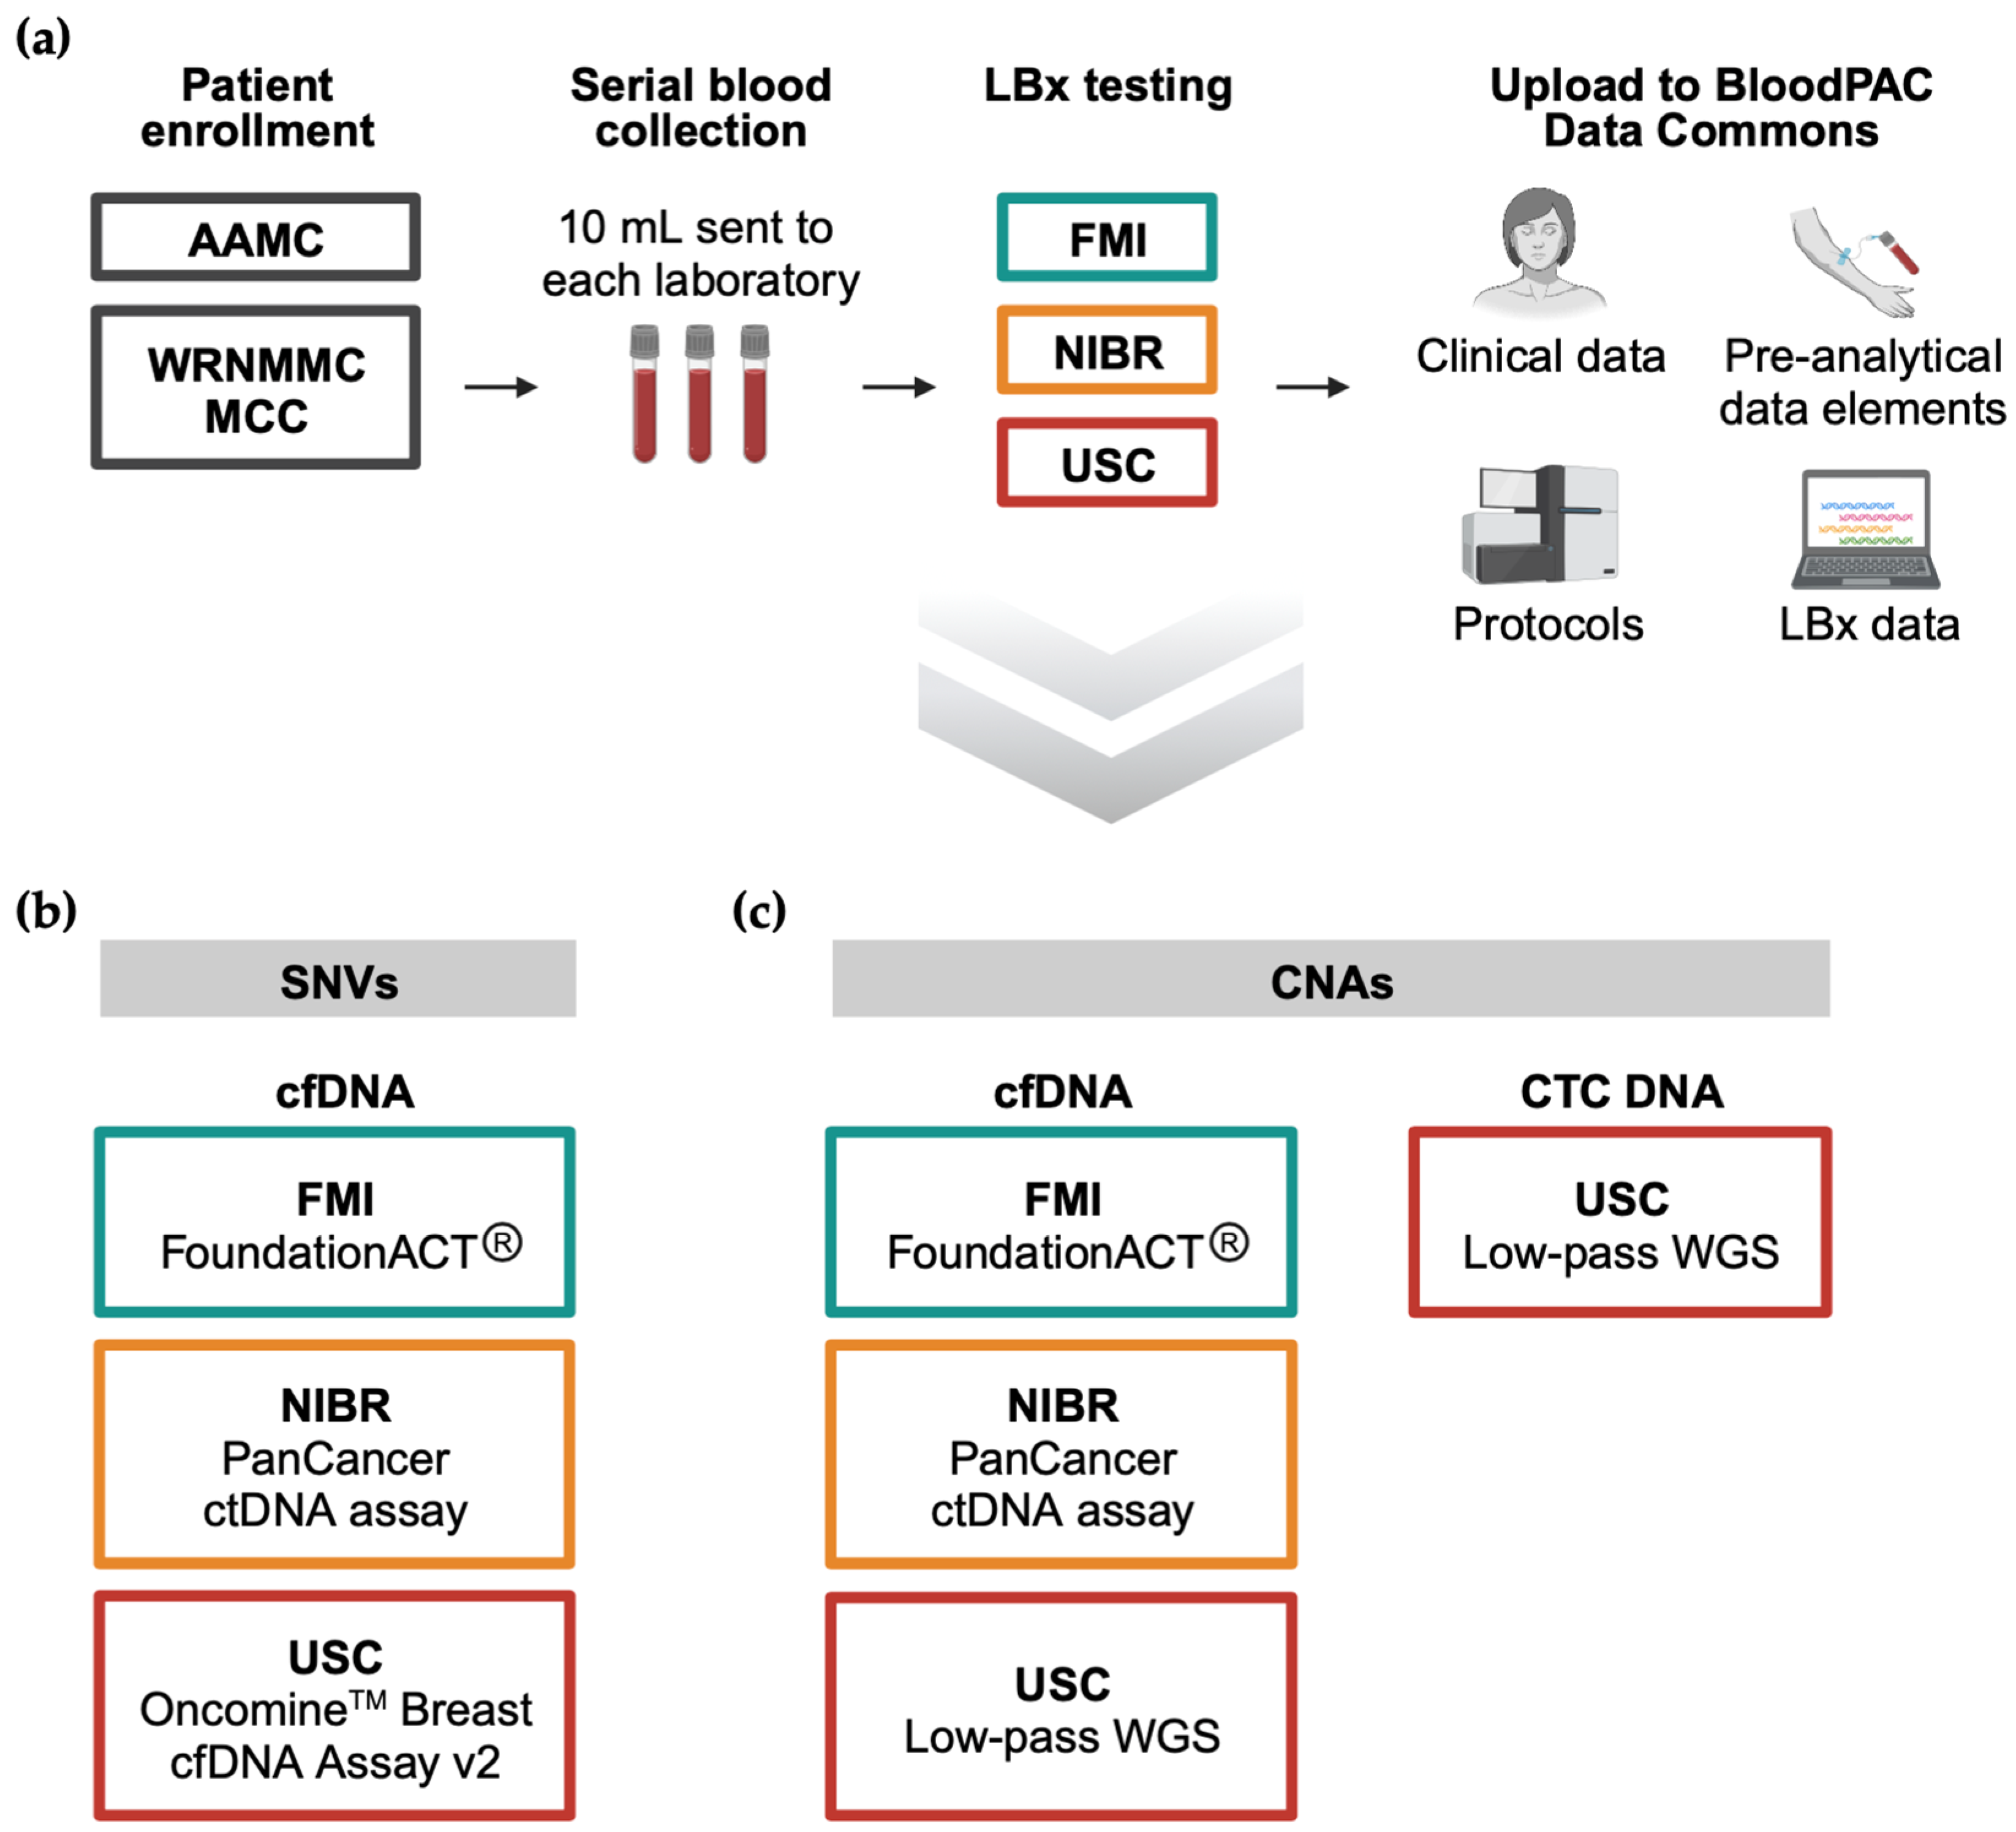
3.1. Study Workflow
3.2. cfDNA Mutational Profiles via Targeted Sequencing
3.3. Concordance of Cross-Platform cfDNA SNV Detection
3.4. cfDNA Whole-Genome CNA Profiles
3.5. CNA Profiling in CTCs and cfDNA
3.6. Longitudinal LBx Profiles
4. Discussion
Supplementary Materials
Author Contributions
Funding
Institutional Review Board Statement
Informed Consent Statement
Data Availability Statement
Acknowledgments
Conflicts of Interest
References
- Zardavas, D.; Irrthum, A.; Swanton, C.; Piccart, M. Clinical management of breast cancer heterogeneity. Nat. Rev. Clin. Oncol. 2015, 12, 381–394. [Google Scholar] [CrossRef]
- Aparicio, S.; Caldas, C. The implications of clonal genome evolution for cancer medicine. N. Engl. J. Med. 2013, 368, 842–851. [Google Scholar] [CrossRef]
- Gerlinger, M.; Rowan, A.J.; Horswell, S.; Math, M.; Larkin, J.; Endesfelder, D.; Gronroos, E.; Martinez, P.; Matthews, N.; Stewart, A.; et al. Intratumor heterogeneity and branched evolution revealed by multiregion sequencing. N. Engl. J. Med. 2012, 366, 883–892. [Google Scholar] [CrossRef]
- Overman, M.J.; Modak, J.; Kopetz, S.; Murthy, R.; Yao, J.C.; Hicks, M.E.; Abbruzzese, J.L.; Tam, A.L. Use of research biopsies in clinical trials: Are risks and benefits adequately discussed? J. Clin. Oncol. 2013, 31, 17–22. [Google Scholar] [CrossRef]
- Murtaza, M.; Dawson, S.J.; Tsui, D.W.; Gale, D.; Forshew, T.; Piskorz, A.M.; Parkinson, C.; Chin, S.F.; Kingsbury, Z.; Wong, A.S.; et al. Non-invasive analysis of acquired resistance to cancer therapy by sequencing of plasma DNA. Nature 2013, 497, 108–112. [Google Scholar] [CrossRef]
- Welter, L.; Xu, L.; McKinley, D.; Dago, A.E.; Prabakar, R.K.; Restrepo-Vassalli, S.; Xu, K.; Rodriguez-Lee, M.; Kolatkar, A.; Nevarez, R.; et al. Treatment response and tumor evolution: Lessons from an extended series of multianalyte liquid biopsies in a metastatic breast cancer patient. Cold Spring Harb. Mol. Case Stud. 2020, 6, a005819. [Google Scholar] [CrossRef] [PubMed]
- Adalsteinsson, V.A.; Ha, G.; Freeman, S.S.; Choudhury, A.D.; Stover, D.G.; Parsons, H.A.; Gydush, G.; Reed, S.C.; Rotem, D.; Rhoades, J.; et al. Scalable whole-exome sequencing of cell-free DNA reveals high concordance with metastatic tumors. Nat. Commun. 2017, 8, 1324. [Google Scholar] [CrossRef]
- Turner, N.C.; Kingston, B.; Kilburn, L.S.; Kernaghan, S.; Wardley, A.M.; Macpherson, I.R.; Baird, R.D.; Roylance, R.; Stephens, P.; Oikonomidou, O.; et al. Circulating tumour DNA analysis to direct therapy in advanced breast cancer (plasmaMATCH): A multicentre, multicohort, phase 2a, platform trial. Lancet Oncol. 2020, 21, 1296–1308. [Google Scholar] [CrossRef] [PubMed]
- André, F.; Ciruelos, E.; Rubovszky, G.; Campone, M.; Loibl, S.; Rugo, H.S.; Iwata, H.; Conte, P.; Mayer, I.A.; Kaufman, B.; et al. Alpelisib for PIK3CA-Mutated, Hormone Receptor-Positive Advanced Breast Cancer. N. Engl. J. Med. 2019, 380, 1929–1940. [Google Scholar] [CrossRef]
- Bidard, F.C.; Kaklamani, V.G.; Neven, P.; Streich, G.; Montero, A.J.; Forget, F.; Mouret-Reynier, M.A.; Sohn, J.H.; Taylor, D.; Harnden, K.K.; et al. Elacestrant (oral selective estrogen receptor degrader) Versus Standard Endocrine Therapy for Estrogen Receptor-Positive, Human Epidermal Growth Factor Receptor 2-Negative Advanced Breast Cancer: Results From the Randomized Phase III EMERALD Trial. J. Clin. Oncol. 2022, 40, 3246–3256. [Google Scholar] [CrossRef] [PubMed]
- Dawson, S.J.; Tsui, D.W.; Murtaza, M.; Biggs, H.; Rueda, O.M.; Chin, S.F.; Dunning, M.J.; Gale, D.; Forshew, T.; Mahler-Araujo, B.; et al. Analysis of circulating tumor DNA to monitor metastatic breast cancer. N. Engl. J. Med. 2013, 368, 1199–1209. [Google Scholar] [CrossRef] [PubMed]
- Stover, D.G.; Parsons, H.A.; Ha, G.; Freeman, S.S.; Barry, W.T.; Guo, H.; Choudhury, A.D.; Gydush, G.; Reed, S.C.; Rhoades, J.; et al. Association of Cell-Free DNA Tumor Fraction and Somatic Copy Number Alterations with Survival in Metastatic Triple-Negative Breast Cancer. J. Clin. Oncol. 2018, 36, 543–553. [Google Scholar] [CrossRef]
- Reichert, Z.R.; Morgan, T.M.; Li, G.; Castellanos, E.; Snow, T.; Dall’Olio, F.G.; Madison, R.W.; Fine, A.D.; Oxnard, G.R.; Graf, R.P.; et al. Prognostic value of plasma circulating tumor DNA fraction across four common cancer types: A real-world outcomes study. Ann. Oncol. 2023, 34, 111–120. [Google Scholar] [CrossRef]
- Cristofanilli, M.; Budd, G.T.; Ellis, M.J.; Stopeck, A.; Matera, J.; Miller, M.C.; Reuben, J.M.; Doyle, G.V.; Allard, W.J.; Terstappen, L.W.; et al. Circulating tumor cells, disease progression, and survival in metastatic breast cancer. N. Engl. J. Med. 2004, 351, 781–791. [Google Scholar] [CrossRef] [PubMed]
- Paoletti, C.; Muñiz, M.C.; Thomas, D.G.; Griffith, K.A.; Kidwell, K.M.; Tokudome, N.; Brown, M.E.; Aung, K.; Miller, M.C.; Blossom, D.L.; et al. Development of circulating tumor cell-endocrine therapy index in patients with hormone receptor-positive breast cancer. Clin. Cancer Res. 2015, 21, 2487–2498. [Google Scholar] [CrossRef]
- Papadaki, M.A.; Stoupis, G.; Theodoropoulos, P.A.; Mavroudis, D.; Georgoulias, V.; Agelaki, S. Circulating Tumor Cells with Stemness and Epithelial-to-Mesenchymal Transition Features Are Chemoresistant and Predictive of Poor Outcome in Metastatic Breast Cancer. Mol. Cancer Ther. 2019, 18, 437–447. [Google Scholar] [CrossRef]
- Keup, C.; Suryaprakash, V.; Hauch, S.; Storbeck, M.; Hahn, P.; Sprenger-Haussels, M.; Kolberg, H.C.; Tewes, M.; Hoffmann, O.; Kimmig, R.; et al. Integrative statistical analyses of multiple liquid biopsy analytes in metastatic breast cancer. Genome Med. 2021, 13, 85. [Google Scholar] [CrossRef]
- Bortolini Silveira, A.; Bidard, F.C.; Tanguy, M.L.; Girard, E.; Trédan, O.; Dubot, C.; Jacot, W.; Goncalves, A.; Debled, M.; Levy, C.; et al. Multimodal liquid biopsy for early monitoring and outcome prediction of chemotherapy in metastatic breast cancer. NPJ Breast Cancer 2021, 7, 115. [Google Scholar] [CrossRef] [PubMed]
- Merker, J.D.; Oxnard, G.R.; Compton, C.; Diehn, M.; Hurley, P.; Lazar, A.J.; Lindeman, N.; Lockwood, C.M.; Rai, A.J.; Schilsky, R.L.; et al. Circulating Tumor DNA Analysis in Patients with Cancer: American Society of Clinical Oncology and College of American Pathologists Joint Review. J. Clin. Oncol. 2018, 36, 1631–1641. [Google Scholar] [CrossRef]
- Narayan, P.; Prowell, T.M.; Gao, J.J.; Fernandes, L.L.; Li, E.; Jiang, X.; Qiu, J.; Fan, J.; Song, P.; Yu, J.; et al. FDA Approval Summary: Alpelisib Plus Fulvestrant for Patients with HR-positive, HER2-negative, PIK3CA-mutated, Advanced or Metastatic Breast Cancer. Clin. Cancer Res. 2021, 27, 1842–1849. [Google Scholar] [CrossRef]
- Administration, U.S.F.D. FDA Approves Elacestrant for ER-Positive, HER2-Negative, ESR1-Mutated Advanced or Metastatic Breast Cancer. Available online: https://www.fda.gov/drugs/resources-information-approved-drugs/fda-approves-elacestrant-er-positive-her2-negative-esr1-mutated-advanced-or-metastatic-breast-cancer (accessed on 29 June 2023).
- Administration, U.S.F.D. FoundationOne Liquid CDx (F1 Liquid CDx). Available online: https://www.accessdata.fda.gov/scripts/cdrh/cfdocs/cfpma/pma.cfm?id=P200006 (accessed on 29 June 2023).
- Grossman, R.L.; Abel, B.; Angiuoli, S.; Barrett, J.C.; Bassett, D.; Bramlett, K.; Blumenthal, G.M.; Carlsson, A.; Cortese, R.; DiGiovanna, J.; et al. Collaborating to Compete: Blood Profiling Atlas in Cancer (BloodPAC) Consortium. Clin. Pharmacol. Ther. 2017, 101, 589–592. [Google Scholar] [CrossRef] [PubMed]
- Godsey, J.H.; Silvestro, A.; Barrett, J.C.; Bramlett, K.; Chudova, D.; Deras, I.; Dickey, J.; Hicks, J.; Johann, D.J.; Leary, R.; et al. Generic Protocols for the Analytical Validation of Next-Generation Sequencing-Based ctDNA Assays: A Joint Consensus Recommendation of the BloodPAC’s Analytical Variables Working Group. Clin. Chem. 2020, 66, 1156–1166. [Google Scholar] [CrossRef] [PubMed]
- Grossman, R.L.; Dry, J.R.; Hanlon, S.E.; Johann, D.J.; Kolatkar, A.; Lee, J.S.H.; Meyer, C.; Salvatore, L.; Wells, W.; Leiman, L. BloodPAC Data Commons for Liquid Biopsy Data. JCO Clin. Cancer Inform. 2021, 5, 479–486. [Google Scholar] [CrossRef]
- Woodhouse, R.; Li, M.; Hughes, J.; Delfosse, D.; Skoletsky, J.; Ma, P.; Meng, W.; Dewal, N.; Milbury, C.; Clark, T.; et al. Clinical and analytical validation of FoundationOne Liquid CDx, a novel 324-Gene cfDNA-based comprehensive genomic profiling assay for cancers of solid tumor origin. PLoS ONE 2020, 15, e0237802. [Google Scholar] [CrossRef] [PubMed]
- Clark, T.A.; Chung, J.H.; Kennedy, M.; Hughes, J.D.; Chennagiri, N.; Lieber, D.S.; Fendler, B.; Young, L.; Zhao, M.; Coyne, M.; et al. Analytical Validation of a Hybrid Capture-Based Next-Generation Sequencing Clinical Assay for Genomic Profiling of Cell-Free Circulating Tumor DNA. J. Mol. Diagn. 2018, 20, 686–702. [Google Scholar] [CrossRef] [PubMed]
- Tate, J.G.; Bamford, S.; Jubb, H.C.; Sondka, Z.; Beare, D.M.; Bindal, N.; Boutselakis, H.; Cole, C.G.; Creatore, C.; Dawson, E.; et al. COSMIC: The Catalogue Of Somatic Mutations In Cancer. Nucleic Acids Res. 2019, 47, D941–D947. [Google Scholar] [CrossRef] [PubMed]
- Fairchild, L.; Whalen, J.; D’Aco, K.; Wu, J.; Gustafson, C.B.; Solovieff, N.; Su, F.; Leary, R.J.; Campbell, C.D.; Balbin, O.A. Clonal hematopoiesis detection in patients with cancer using cell-free DNA sequencing. Sci. Transl. Med. 2023, 15, eabm8729. [Google Scholar] [CrossRef]
- Cibulskis, K.; Lawrence, M.S.; Carter, S.L.; Sivachenko, A.; Jaffe, D.; Sougnez, C.; Gabriel, S.; Meyerson, M.; Lander, E.S.; Getz, G. Sensitive detection of somatic point mutations in impure and heterogeneous cancer samples. Nat. Biotechnol. 2013, 31, 213–219. [Google Scholar] [CrossRef] [PubMed]
- Ye, K.; Wang, J.; Jayasinghe, R.; Lameijer, E.W.; McMichael, J.F.; Ning, J.; McLellan, M.D.; Xie, M.; Cao, S.; Yellapantula, V.; et al. Systematic discovery of complex insertions and deletions in human cancers. Nat. Med. 2016, 22, 97–104. [Google Scholar] [CrossRef]
- Riester, M.; Singh, A.P.; Brannon, A.R.; Yu, K.; Campbell, C.D.; Chiang, D.Y.; Morrissey, M.P. PureCN: Copy number calling and SNV classification using targeted short read sequencing. Source Code Biol. Med. 2016, 11, 13. [Google Scholar] [CrossRef]
- Sherry, S.T.; Ward, M.H.; Kholodov, M.; Baker, J.; Phan, L.; Smigielski, E.M.; Sirotkin, K. dbSNP: The NCBI database of genetic variation. Nucleic Acids Res. 2001, 29, 308–311. [Google Scholar] [CrossRef]
- Cingolani, P.; Platts, A.; Wang, L.L.; Coon, M.; Nguyen, T.; Wang, L.; Land, S.J.; Lu, X.; Ruden, D.M. A program for annotating and predicting the effects of single nucleotide polymorphisms, SnpEff: SNPs in the genome of Drosophila melanogaster strain w1118; iso-2; iso-3. Fly 2012, 6, 80–92. [Google Scholar] [CrossRef] [PubMed]
- Chai, S.; Matsumoto, N.; Storgard, R.; Peng, C.C.; Aparicio, A.; Ormseth, B.; Rappard, K.; Cunningham, K.; Kolatkar, A.; Nevarez, R.; et al. Platelet-Coated Circulating Tumor Cells Are a Predictive Biomarker in Patients with Metastatic Castrate-Resistant Prostate Cancer. Mol. Cancer Res. 2021, 19, 2036–2045. [Google Scholar] [CrossRef] [PubMed]
- Baslan, T.; Morris, J.P.t.; Zhao, Z.; Reyes, J.; Ho, Y.J.; Tsanov, K.M.; Bermeo, J.; Tian, S.; Zhang, S.; Askan, G.; et al. Ordered and deterministic cancer genome evolution after p53 loss. Nature 2022, 608, 795–802. [Google Scholar] [CrossRef] [PubMed]
- Chakravarty, D.; Gao, J.; Phillips, S.M.; Kundra, R.; Zhang, H.; Wang, J.; Rudolph, J.E.; Yaeger, R.; Soumerai, T.; Nissan, M.H.; et al. OncoKB: A Precision Oncology Knowledge Base. JCO Precis. Oncol. 2017, 2017, 1–16. [Google Scholar] [CrossRef]
- Wickham, H. ggplot2: Elegant Graphics for Data Analysis; Springer: New York, NY, USA, 2016. [Google Scholar]
- Gu, Z. Complex heatmap visualization. iMeta 2022, 1, e43. [Google Scholar] [CrossRef]
- Gu, Z.; Eils, R.; Schlesner, M. Complex heatmaps reveal patterns and correlations in multidimensional genomic data. Bioinformatics 2016, 32, 2847–2849. [Google Scholar] [CrossRef] [PubMed]
- Razavi, P.; Li, B.T.; Brown, D.N.; Jung, B.; Hubbell, E.; Shen, R.; Abida, W.; Juluru, K.; De Bruijn, I.; Hou, C.; et al. High-intensity sequencing reveals the sources of plasma circulating cell-free DNA variants. Nat. Med. 2019, 25, 1928–1937. [Google Scholar] [CrossRef] [PubMed]
- Deveson, I.W.; Gong, B.; Lai, K.; LoCoco, J.S.; Richmond, T.A.; Schageman, J.; Zhang, Z.; Novoradovskaya, N.; Willey, J.C.; Jones, W.; et al. Evaluating the analytical validity of circulating tumor DNA sequencing assays for precision oncology. Nat. Biotechnol. 2021, 39, 1115–1128. [Google Scholar] [CrossRef] [PubMed]
- Hernandez, K.M.; Bramlett, K.S.; Agius, P.; Baden, J.; Cao, R.; Clement, O.; Corner, A.S.; Craft, J.; Dean, D.A., II; Dry, J.R.; et al. Contrived Materials and a Data Set for the Evaluation of Liquid Biopsy Tests: A Blood Profiling Atlas in Cancer (BLOODPAC) Community Study. J. Mol. Diagn. 2023, 25, 143–155. [Google Scholar] [CrossRef]
- Stetson, D.; Ahmed, A.; Xu, X.; Nuttall, B.R.B.; Lubinski, T.J.; Johnson, J.H.; Barrett, J.C.; Dougherty, B.A. Orthogonal Comparison of Four Plasma NGS Tests with Tumor Suggests Technical Factors are a Major Source of Assay Discordance. JCO Precis. Oncol. 2019, 3, 1–9. [Google Scholar] [CrossRef] [PubMed]
- Comprehensive molecular portraits of human breast tumours. Nature 2012, 490, 61–70. [CrossRef]
- Taavitsainen, S.; Annala, M.; Ledet, E.; Beja, K.; Miller, P.J.; Moses, M.; Nykter, M.; Chi, K.N.; Sartor, O.; Wyatt, A.W. Evaluation of Commercial Circulating Tumor DNA Test in Metastatic Prostate Cancer. JCO Precis. Oncol. 2019, 3, 1–9. [Google Scholar] [CrossRef] [PubMed]
- Shaw, J.A.; Guttery, D.S.; Hills, A.; Fernandez-Garcia, D.; Page, K.; Rosales, B.M.; Goddard, K.S.; Hastings, R.K.; Luo, J.; Ogle, O.; et al. Mutation Analysis of Cell-Free DNA and Single Circulating Tumor Cells in Metastatic Breast Cancer Patients with High Circulating Tumor Cell Counts. Clin. Cancer Res. 2017, 23, 88–96. [Google Scholar] [CrossRef] [PubMed]
- Rossi, G.; Mu, Z.; Rademaker, A.W.; Austin, L.K.; Strickland, K.S.; Costa, R.L.B.; Nagy, R.J.; Zagonel, V.; Taxter, T.J.; Behdad, A.; et al. Cell-Free DNA and Circulating Tumor Cells: Comprehensive Liquid Biopsy Analysis in Advanced Breast Cancer. Clin. Cancer Res. 2018, 24, 560–568. [Google Scholar] [CrossRef] [PubMed]
- Kong, S.L.; Liu, X.; Tan, S.J.; Tai, J.A.; Phua, L.Y.; Poh, H.M.; Yeo, T.; Chua, Y.W.; Haw, Y.X.; Ling, W.H.; et al. Complementary Sequential Circulating Tumor Cell (CTC) and Cell-Free Tumor DNA (ctDNA) Profiling Reveals Metastatic Heterogeneity and Genomic Changes in Lung Cancer and Breast Cancer. Front. Oncol. 2021, 11, 698551. [Google Scholar] [CrossRef]
- Bettegowda, C.; Sausen, M.; Leary, R.J.; Kinde, I.; Wang, Y.; Agrawal, N.; Bartlett, B.R.; Wang, H.; Luber, B.; Alani, R.M.; et al. Detection of circulating tumor DNA in early- and late-stage human malignancies. Sci. Transl. Med. 2014, 6, 224ra224. [Google Scholar] [CrossRef] [PubMed]
- Kang, Y.; Pantel, K. Tumor cell dissemination: Emerging biological insights from animal models and cancer patients. Cancer Cell 2013, 23, 573–581. [Google Scholar] [CrossRef] [PubMed]
- Bidard, F.C.; Peeters, D.J.; Fehm, T.; Nolé, F.; Gisbert-Criado, R.; Mavroudis, D.; Grisanti, S.; Generali, D.; Garcia-Saenz, J.A.; Stebbing, J.; et al. Clinical validity of circulating tumour cells in patients with metastatic breast cancer: A pooled analysis of individual patient data. Lancet Oncol. 2014, 15, 406–414. [Google Scholar] [CrossRef]
- Alix-Panabières, C.; Pantel, K. Clinical Applications of Circulating Tumor Cells and Circulating Tumor DNA as Liquid Biopsy. Cancer Discov. 2016, 6, 479–491. [Google Scholar] [CrossRef]
- Paoletti, C.; Schiavon, G.; Dolce, E.M.; Darga, E.P.; Carr, T.H.; Geradts, J.; Hoch, M.; Klinowska, T.; Lindemann, J.; Marshall, G.; et al. Circulating Biomarkers and Resistance to Endocrine Therapy in Metastatic Breast Cancers: Correlative Results from AZD9496 Oral SERD Phase I Trial. Clin. Cancer Res. 2018, 24, 5860–5872. [Google Scholar] [CrossRef]
- O’Leary, B.; Hrebien, S.; Morden, J.P.; Beaney, M.; Fribbens, C.; Huang, X.; Liu, Y.; Bartlett, C.H.; Koehler, M.; Cristofanilli, M.; et al. Early circulating tumor DNA dynamics and clonal selection with palbociclib and fulvestrant for breast cancer. Nat. Commun. 2018, 9, 896. [Google Scholar] [CrossRef] [PubMed]
- Smerage, J.B.; Barlow, W.E.; Hortobagyi, G.N.; Winer, E.P.; Leyland-Jones, B.; Srkalovic, G.; Tejwani, S.; Schott, A.F.; O’Rourke, M.A.; Lew, D.L.; et al. Circulating tumor cells and response to chemotherapy in metastatic breast cancer: SWOG S0500. J. Clin. Oncol. 2014, 32, 3483–3489. [Google Scholar] [CrossRef]
- CIrCuLAting Dna ESr1 Gene Mutations Analysis (CICLADES). Available online: https://clinicaltrials.gov/ct2/show/NCT03318263 (accessed on 29 June 2023).
- Levels of Circulating Tumor DNA as a Predictive Marker for Early Switch in Treatment for Patients with Metastatic (Stage IV) Breast Cancer. Available online: https://clinicaltrials.gov/ct2/show/NCT05826964 (accessed on 29 June 2023).
- Carlson, K.E.; Choi, I.; Gee, A.; Katzenellenbogen, B.S.; Katzenellenbogen, J.A. Altered ligand binding properties and enhanced stability of a constitutively active estrogen receptor: Evidence that an open pocket conformation is required for ligand interaction. Biochemistry 1997, 36, 14897–14905. [Google Scholar] [CrossRef] [PubMed]
- Robinson, D.R.; Wu, Y.M.; Vats, P.; Su, F.; Lonigro, R.J.; Cao, X.; Kalyana-Sundaram, S.; Wang, R.; Ning, Y.; Hodges, L.; et al. Activating ESR1 mutations in hormone-resistant metastatic breast cancer. Nat. Genet. 2013, 45, 1446–1451. [Google Scholar] [CrossRef] [PubMed]
- Toy, W.; Shen, Y.; Won, H.; Green, B.; Sakr, R.A.; Will, M.; Li, Z.; Gala, K.; Fanning, S.; King, T.A.; et al. ESR1 ligand-binding domain mutations in hormone-resistant breast cancer. Nat. Genet. 2013, 45, 1439–1445. [Google Scholar] [CrossRef] [PubMed]
- Chandarlapaty, S.; Chen, D.; He, W.; Sung, P.; Samoila, A.; You, D.; Bhatt, T.; Patel, P.; Voi, M.; Gnant, M.; et al. Prevalence of ESR1 Mutations in Cell-Free DNA and Outcomes in Metastatic Breast Cancer: A Secondary Analysis of the BOLERO-2 Clinical Trial. JAMA Oncol. 2016, 2, 1310–1315. [Google Scholar] [CrossRef] [PubMed]
- Turner, N.C.; Swift, C.; Kilburn, L.; Fribbens, C.; Beaney, M.; Garcia-Murillas, I.; Budzar, A.U.; Robertson, J.F.R.; Gradishar, W.; Piccart, M.; et al. ESR1 Mutations and Overall Survival on Fulvestrant versus Exemestane in Advanced Hormone Receptor-Positive Breast Cancer: A Combined Analysis of the Phase III SoFEA and EFECT Trials. Clin. Cancer Res. 2020, 26, 5172–5177. [Google Scholar] [CrossRef] [PubMed]
- Hu, Y.; Ulrich, B.C.; Supplee, J.; Kuang, Y.; Lizotte, P.H.; Feeney, N.B.; Guibert, N.M.; Awad, M.M.; Wong, K.K.; Jänne, P.A.; et al. False-Positive Plasma Genotyping Due to Clonal Hematopoiesis. Clin. Cancer Res. 2018, 24, 4437–4443. [Google Scholar] [CrossRef] [PubMed]
- Liu, J.; Chen, X.; Wang, J.; Zhou, S.; Wang, C.L.; Ye, M.Z.; Wang, X.Y.; Song, Y.; Wang, Y.Q.; Zhang, L.T.; et al. Biological background of the genomic variations of cf-DNA in healthy individuals. Ann. Oncol. 2019, 30, 464–470. [Google Scholar] [CrossRef]
- Sun, D.; Kuang, Z.; Fine, A.D.; Polisecki, E.; Gettler, H.; Al-Rekabi, H.; Pavlick, D.; Huang, Y.; Albacker, L.A.; Decker, B.; et al. Abstract 2289: Predicting tumor somatic versus clonal hematopoiesis origin for short variants in liquid assay. Cancer Res. 2023, 83, 2289. [Google Scholar] [CrossRef]
- Cristiano, S.; Leal, A.; Phallen, J.; Fiksel, J.; Adleff, V.; Bruhm, D.C.; Jensen, S.; Medina, J.E.; Hruban, C.; White, J.R.; et al. Genome-wide cell-free DNA fragmentation in patients with cancer. Nature 2019, 570, 385–389. [Google Scholar] [CrossRef]
- Lo, Y.M.D.; Han, D.S.C.; Jiang, P.; Chiu, R.W.K. Epigenetics, fragmentomics, and topology of cell-free DNA in liquid biopsies. Science 2021, 372, aaw3616. [Google Scholar] [CrossRef]
- Nanou, A.; Zeune, L.L.; Bidard, F.C.; Pierga, J.Y.; Terstappen, L. HER2 expression on tumor-derived extracellular vesicles and circulating tumor cells in metastatic breast cancer. Breast Cancer Res. 2020, 22, 86. [Google Scholar] [CrossRef] [PubMed]
- Hu, M.; Brown, V.; Jackson, J.M.; Wijerathne, H.; Pathak, H.; Koestler, D.C.; Nissen, E.; Hupert, M.L.; Muller, R.; Godwin, A.K.; et al. Assessing Breast Cancer Molecular Subtypes Using Extracellular Vesicles’ mRNA. Anal. Chem. 2023, 95, 7665–7675. [Google Scholar] [CrossRef]


| Title 1 | AAMC | WRNMMC MCC | Total |
|---|---|---|---|
| Patients | 18 | 20 | 38 |
| Blood draws | 51 | 56 | 107 |
| Receptor status * | |||
| HR+/HER2− | 10 | 11 | 21 |
| HR+/HER2+ | 0 | 3 | 3 |
| HR−/HER2+ | 0 | 1 | 1 |
| HR−/HER2− | 7 | 4 | 11 |
| Histological subtype | |||
| Ductal | 13 | 18 | 31 |
| Lobular | 3 | 2 | 5 |
| Other | 2 | 0 | 2 |
Disclaimer/Publisher’s Note: The statements, opinions and data contained in all publications are solely those of the individual author(s) and contributor(s) and not of MDPI and/or the editor(s). MDPI and/or the editor(s) disclaim responsibility for any injury to people or property resulting from any ideas, methods, instructions or products referred to in the content. |
© 2024 by the authors. Licensee MDPI, Basel, Switzerland. This article is an open access article distributed under the terms and conditions of the Creative Commons Attribution (CC BY) license (https://creativecommons.org/licenses/by/4.0/).
Share and Cite
Higa, N.; Welter, L.; Xu, L.; Kolatkar, A.; Bramlett, K.S.; Gjoerup, O.V.; Graf, R.; Huang, R.S.P.; Leary, R.J.; Lee, Y.; et al. Liquid Biopsy Profiling with Multiple Tests in Patients with Metastatic Breast Cancer. J. Mol. Pathol. 2024, 5, 199-214. https://doi.org/10.3390/jmp5020013
Higa N, Welter L, Xu L, Kolatkar A, Bramlett KS, Gjoerup OV, Graf R, Huang RSP, Leary RJ, Lee Y, et al. Liquid Biopsy Profiling with Multiple Tests in Patients with Metastatic Breast Cancer. Journal of Molecular Pathology. 2024; 5(2):199-214. https://doi.org/10.3390/jmp5020013
Chicago/Turabian StyleHiga, Nikki, Lisa Welter, Liya Xu, Anand Kolatkar, Kelli S. Bramlett, Ole V. Gjoerup, Ryon Graf, Richard S.P. Huang, Rebecca J. Leary, Young Lee, and et al. 2024. "Liquid Biopsy Profiling with Multiple Tests in Patients with Metastatic Breast Cancer" Journal of Molecular Pathology 5, no. 2: 199-214. https://doi.org/10.3390/jmp5020013