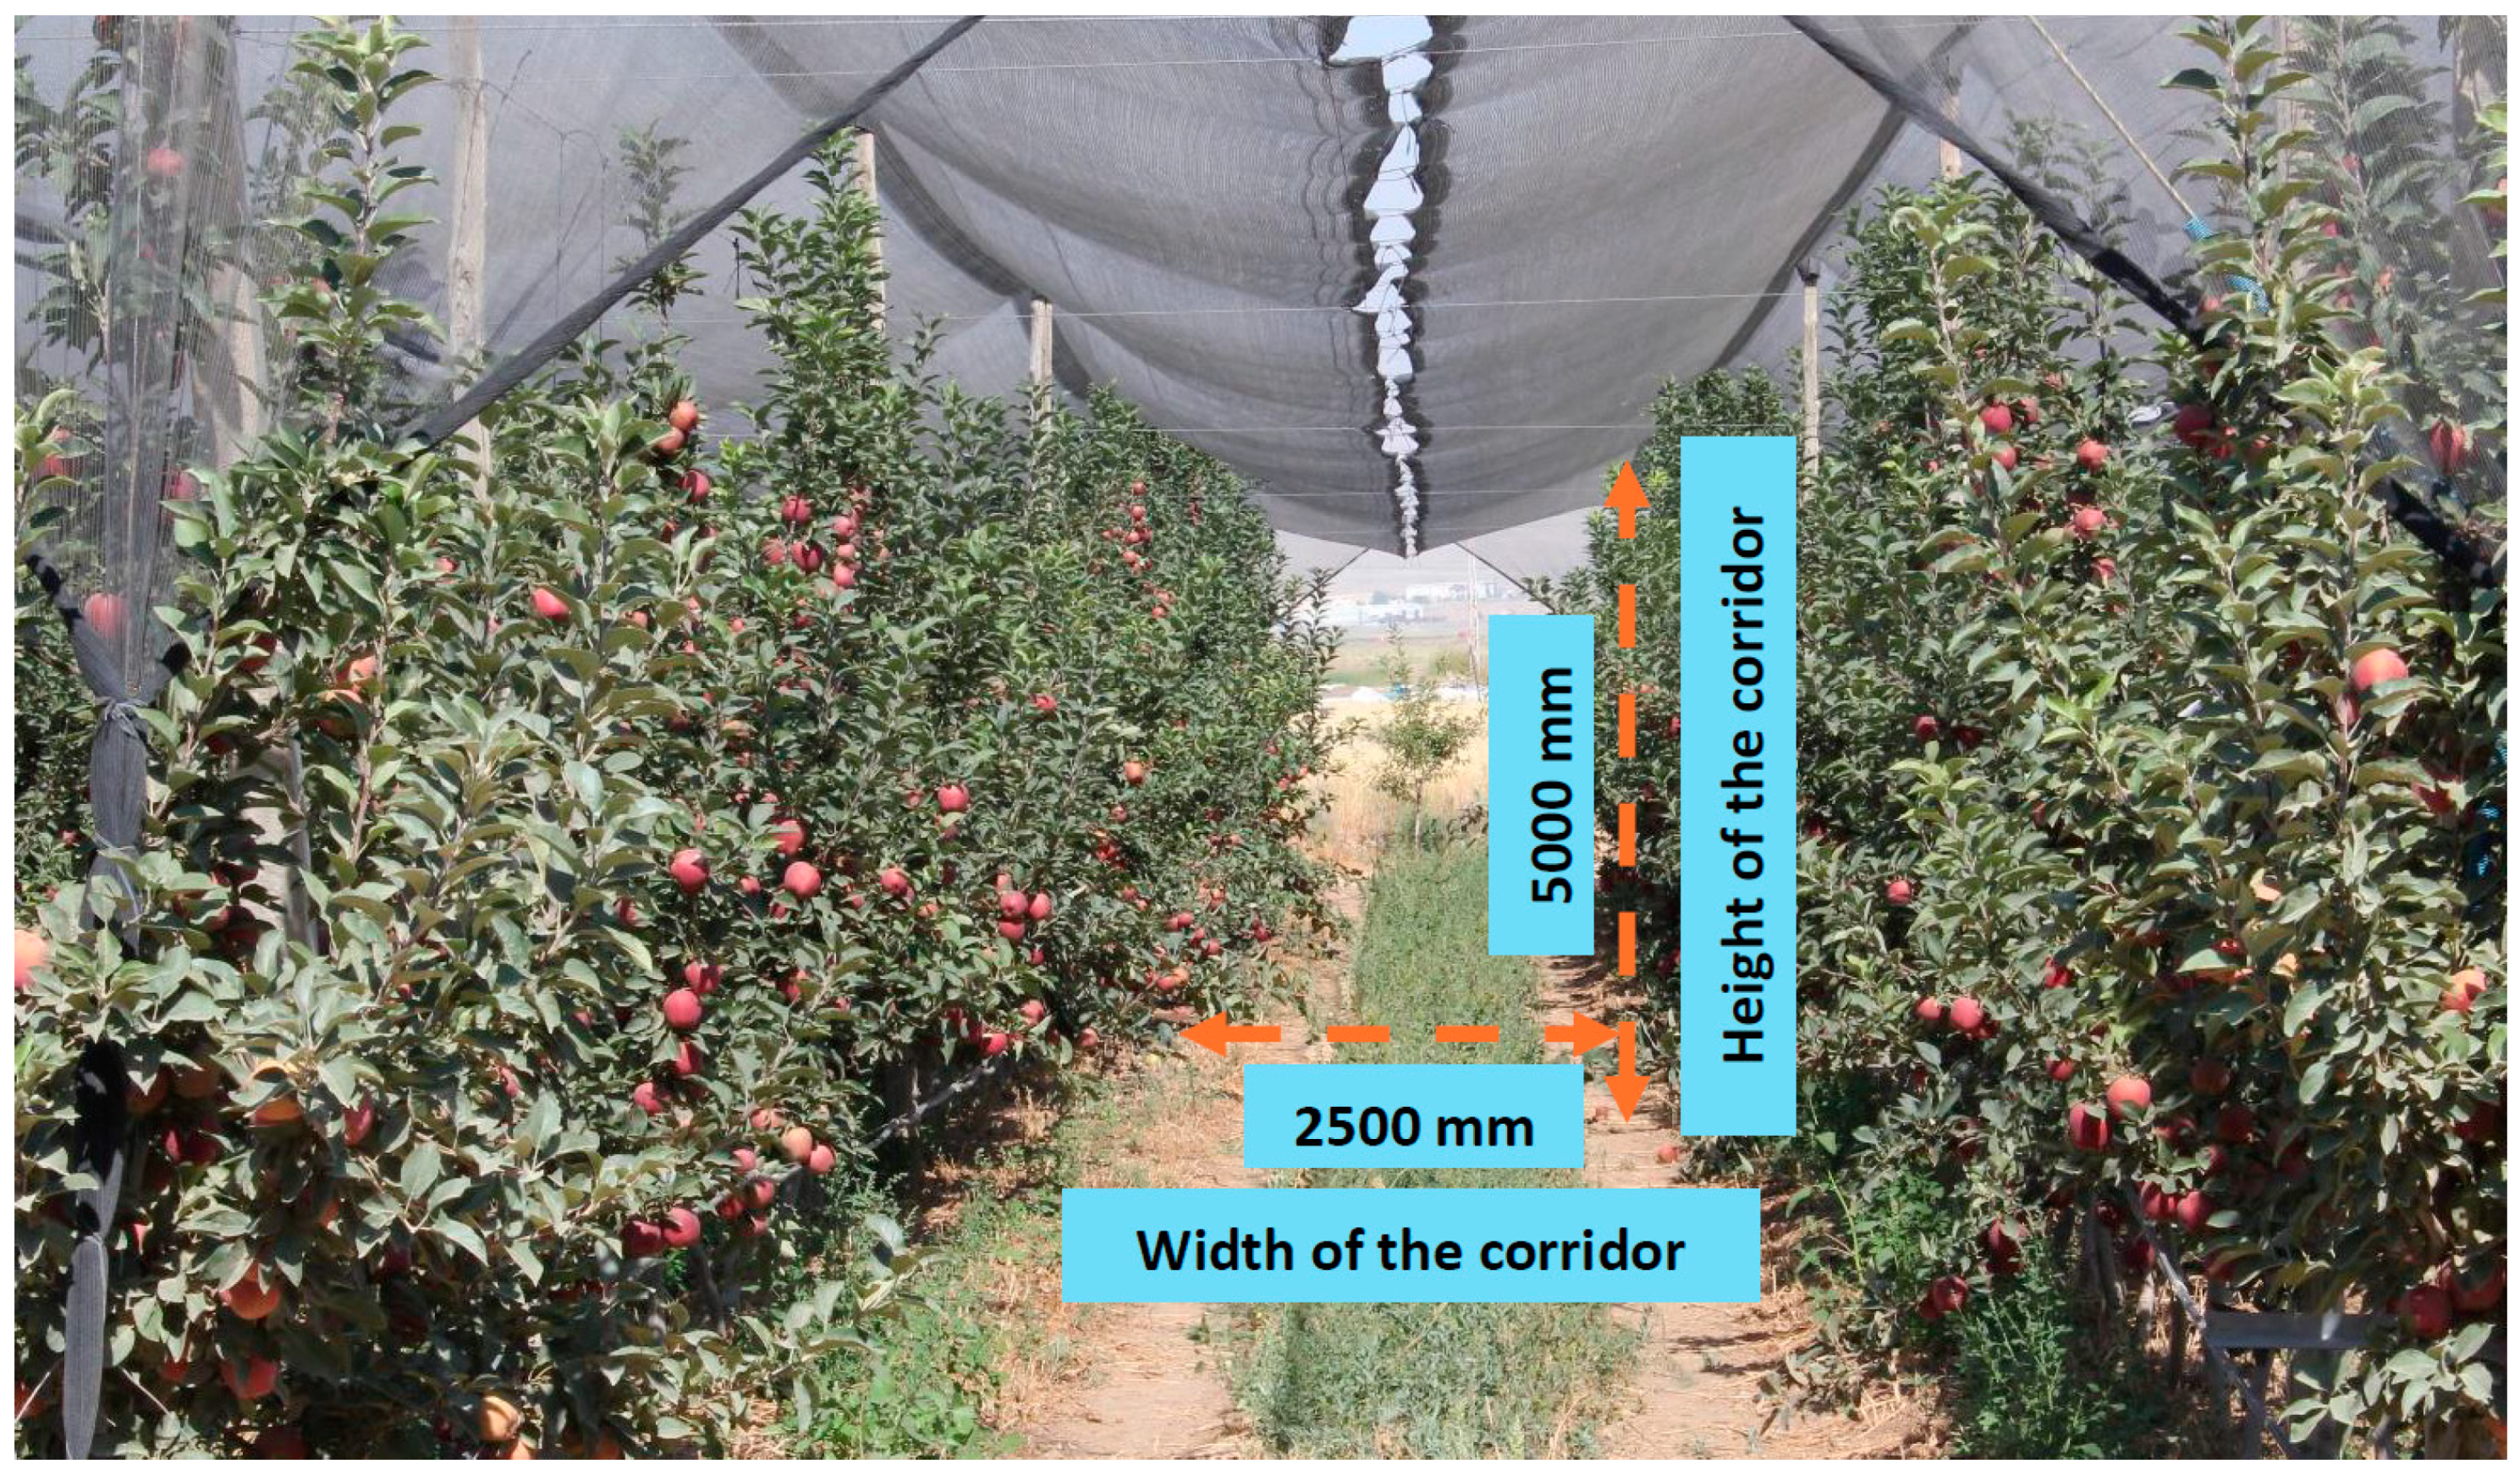
Using the conventional approach of autotune mode to establish control parameters for the quadrotor robotic system is deemed unsuitable, particularly in an apple orchard’s narrow and sparsely covered corridors, as illustrated in
Figure 1. Autotune mode is frequently used in studies to determine PID control parameters. Mini aerial vehicles using this mode automatically determine the optimum K
p, K
i and K
d gain parameters in large and open areas, with movements similar to the dance of bees in the air. However, it is not possible to apply the method in the apple orchard where the study will be carried out to determine the yield since the apple orchards have narrow corridors and the upper parts are covered with thin cover. For this reason, in this study, the K
p, K
d and K
i gain parameters are determined with artificial intelligence methods in the determined trajectories and the system performance is evaluated. In the study, the determination of K
p, K
d and K
i gain parameters is carried out in a simulation environment, and the trajectory tracking performance of the quadrotor system is examined with the obtained gain parameters.
2.1. Software Specifications
Ardupilot software (Copter-4.4.0) is embedded in the controller to run flight commands and manage the flight. Through this software, precise control of the quadrotor can be achieved with PID control parameters determined through the flight planning program. The high accuracy of the simulation software is demonstrated by comparing simulated and experimental trajectories for three different UAVs [
18]. In this study, Mission Planner is used as the flight planning and simulation program. Furthermore, the quadrotor dynamics [
19] required for flight are provided by embedded libraries in the Mission Planner open source software [
20].
In addition to referenced studies, flight trajectory is created for simulation to compare trajectory tracking performances with different K
p, K
i and K
d parameters. For the quadrotor to track this trajectory, which is similar to the corridors in the apple orchard, a mission program is coded in Python using the Dronekit library. Software in the Loop (SITL) is used to simulate systems operating in real time [
21]. Using this program, each simulation flight performed with different parameters is tracked on the map as shown in
Figure 3, and location data is recorded. These data are then processed and a data set is created for training the neural network model.
2.2. Standard PID Controller System
PID controllers have been used for a wide variety of systems. Today, PID control is also used in many drone studies [
22]. The continuous time PID controller is defined by Equation (1) [
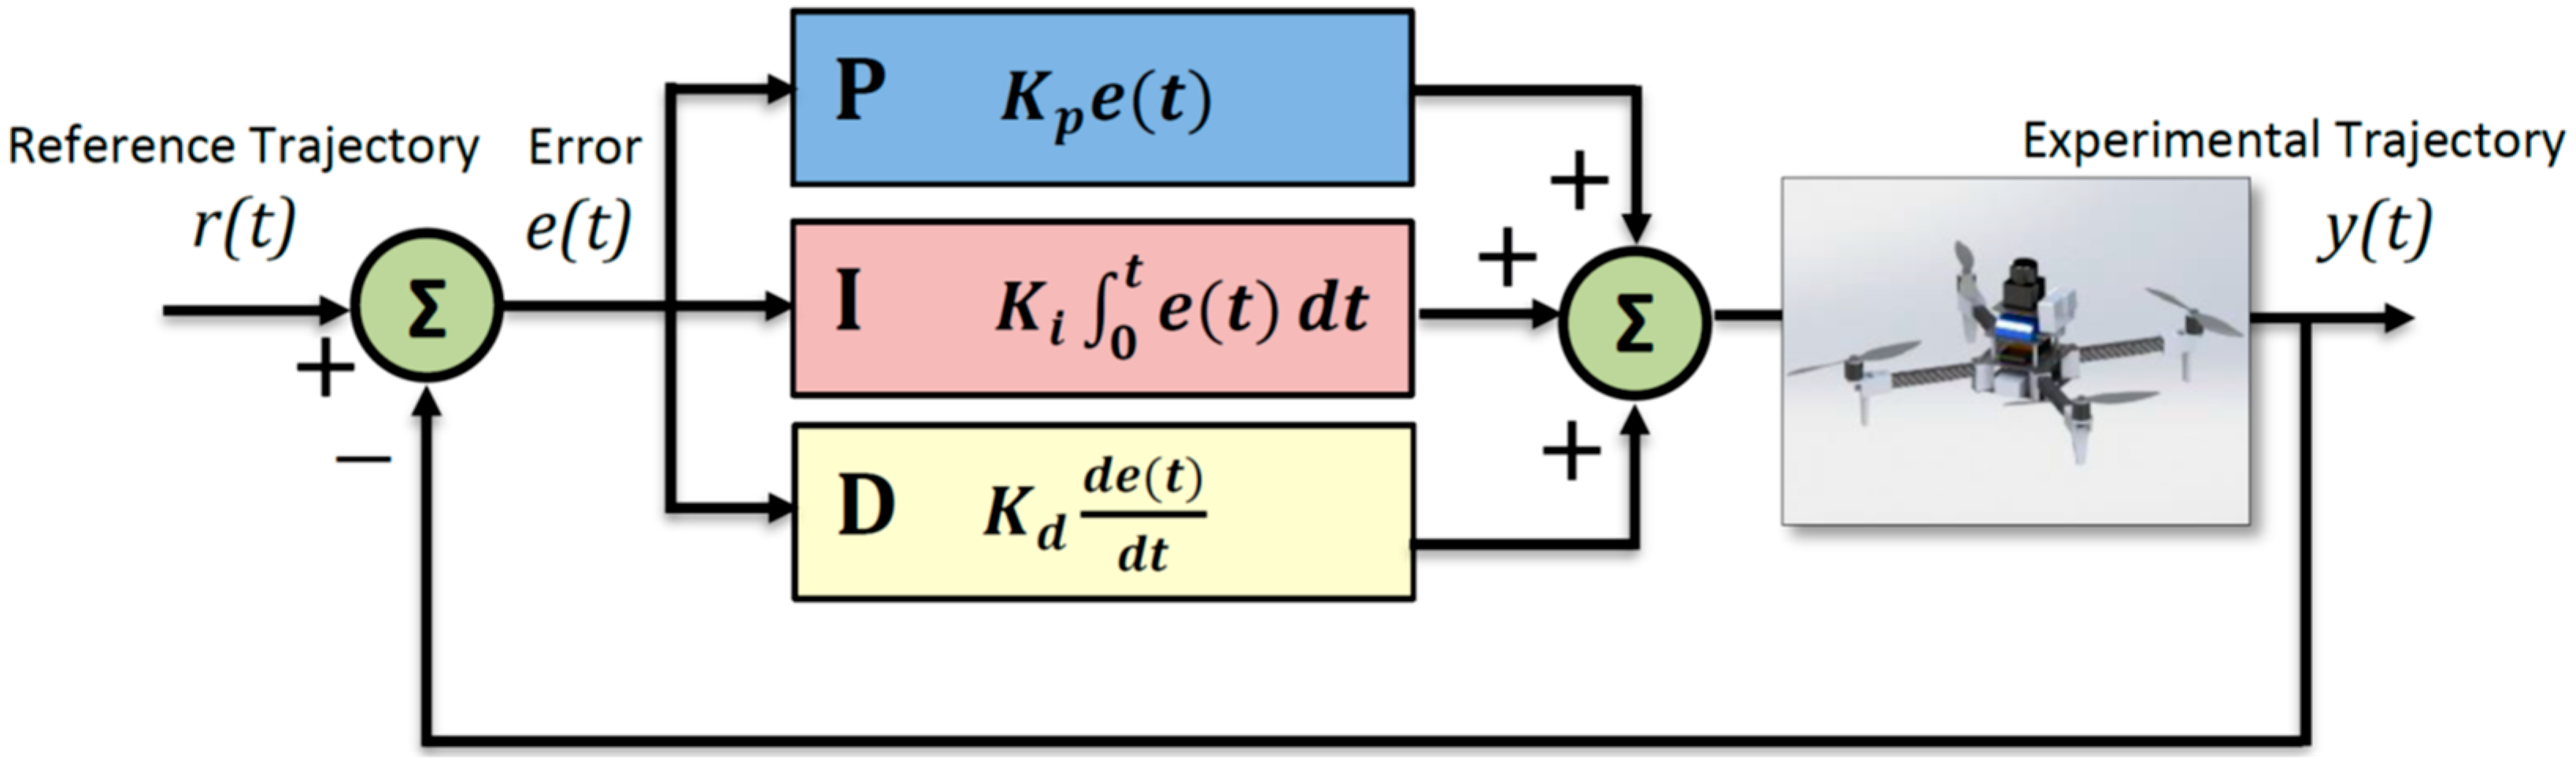
23]. To drive a plant output y(t), towards a reference signal r(t), the control input u(t), is calculated by a closed loop PID controller, which uses the error in the output, that is,
e(
t) = r(t) − y(t) [
24]. In Equation (1),
Kp is the proportional gain,
Ki is the integral gain and
Kd is the derivative gain.
Appropriate coefficient values must be adjusted for the PID controller parameter to operate correctly. Although the Ziegler Nichols method [
25] is the most widely used method for tuning these parameters in many systems, it is not easy to apply in such unique systems. Due to the high degree of non-linearity in these systems, it is difficult to modify the PID controller’s gain parameters when there are external disturbances or the system parameters are changing. As a result, the PID controller’s performance is reduced [
26].
MAVs perform their flights according to specific modes. This study uses Auto and Guided modes for the quadrotor to perform the task fully autonomously. Auto mode is used when the flight program is uploaded to the controller, and Guided mode is used when it is managed externally through the program written with Dronekit. In both modes, position errors must be minimized by continuous monitoring of a controller so the quadrotor system can follow the determined trajectory. This system is controlled by three different PID control structures for roll, pitch and yaw movements. The PID control model of UAVs is shown schematically in
Figure 4 for UAV movements.
Kp, Ki and Kd parameters must be tuned for each control model before the flight. This tuning can be performed by the trial-and-error method based on experience or adjusted autonomously in autotune mode, a mode developed for this type of MAV. If there is a suitable and sufficient area for flight, automatically tuning the PID controller gain parameters gives a more effective result. In this mode, the UAV moves autonomously in a wide-area trajectory, similar to the dance of bees, according to a determined algorithm. During this movement, Kp, Ki and Kd parameters are tuned in the most optimal way.
However, it is not possible to use the autotune mode because the micro-UAV designed in this study will perform its movement in a narrow and covered environment among trees. For this reason, an artificial neural network (ANN) model has been developed to determine the Kp, Ki and Kd parameters.
In the simulation environment, a trajectory was determined by reference to the row size of the tree array where the experimental study will be carried out. This trajectory is autonomously followed with datasets consisting of 100 different Kp, Ki and Kd parameters determined separately for the roll and pitch control models. During the sample preparation, it is experienced that 100 samples in the dataset are sufficient to extract the characteristics between the position-PID parameters. Changing the PID parameters of the yaw control does not cause a significant change in the trajectory error. Therefore, there is no need for an optimization for the yaw control model in the simulation flights, and the default values are used in all flights. The default values for the gain parameters are 0.2 for Kp, 0.02 for Ki and 0.002 for Kd.
In this method, 200 flight simulations are performed according to the parameter changes in two different control models. The Kp, Ki and Kd parameters adjusted in each simulation are used as output values for the samples in the training of the ANN model. These values are determined randomly through the program and the Kp, Ki and Kd parameters of one of the roll and pitch control models were changed while the others were kept constant. In this way, it is aimed to determine the optimum Kp, Ki and Kd control parameters for each movement type.
2.3. Proposed Artificial Neural Network (ANN)
For tuning PID parameters, several offline methods are available. In this section, the critical ideas of ANN, supervised learning and system identification methodologies are introduced and analyzed in relation to the theoretical development and applications of optimal PID controllers [
27]. ANNs can offer flexible solutions to non-linear problems with their structure similar to the human brain.
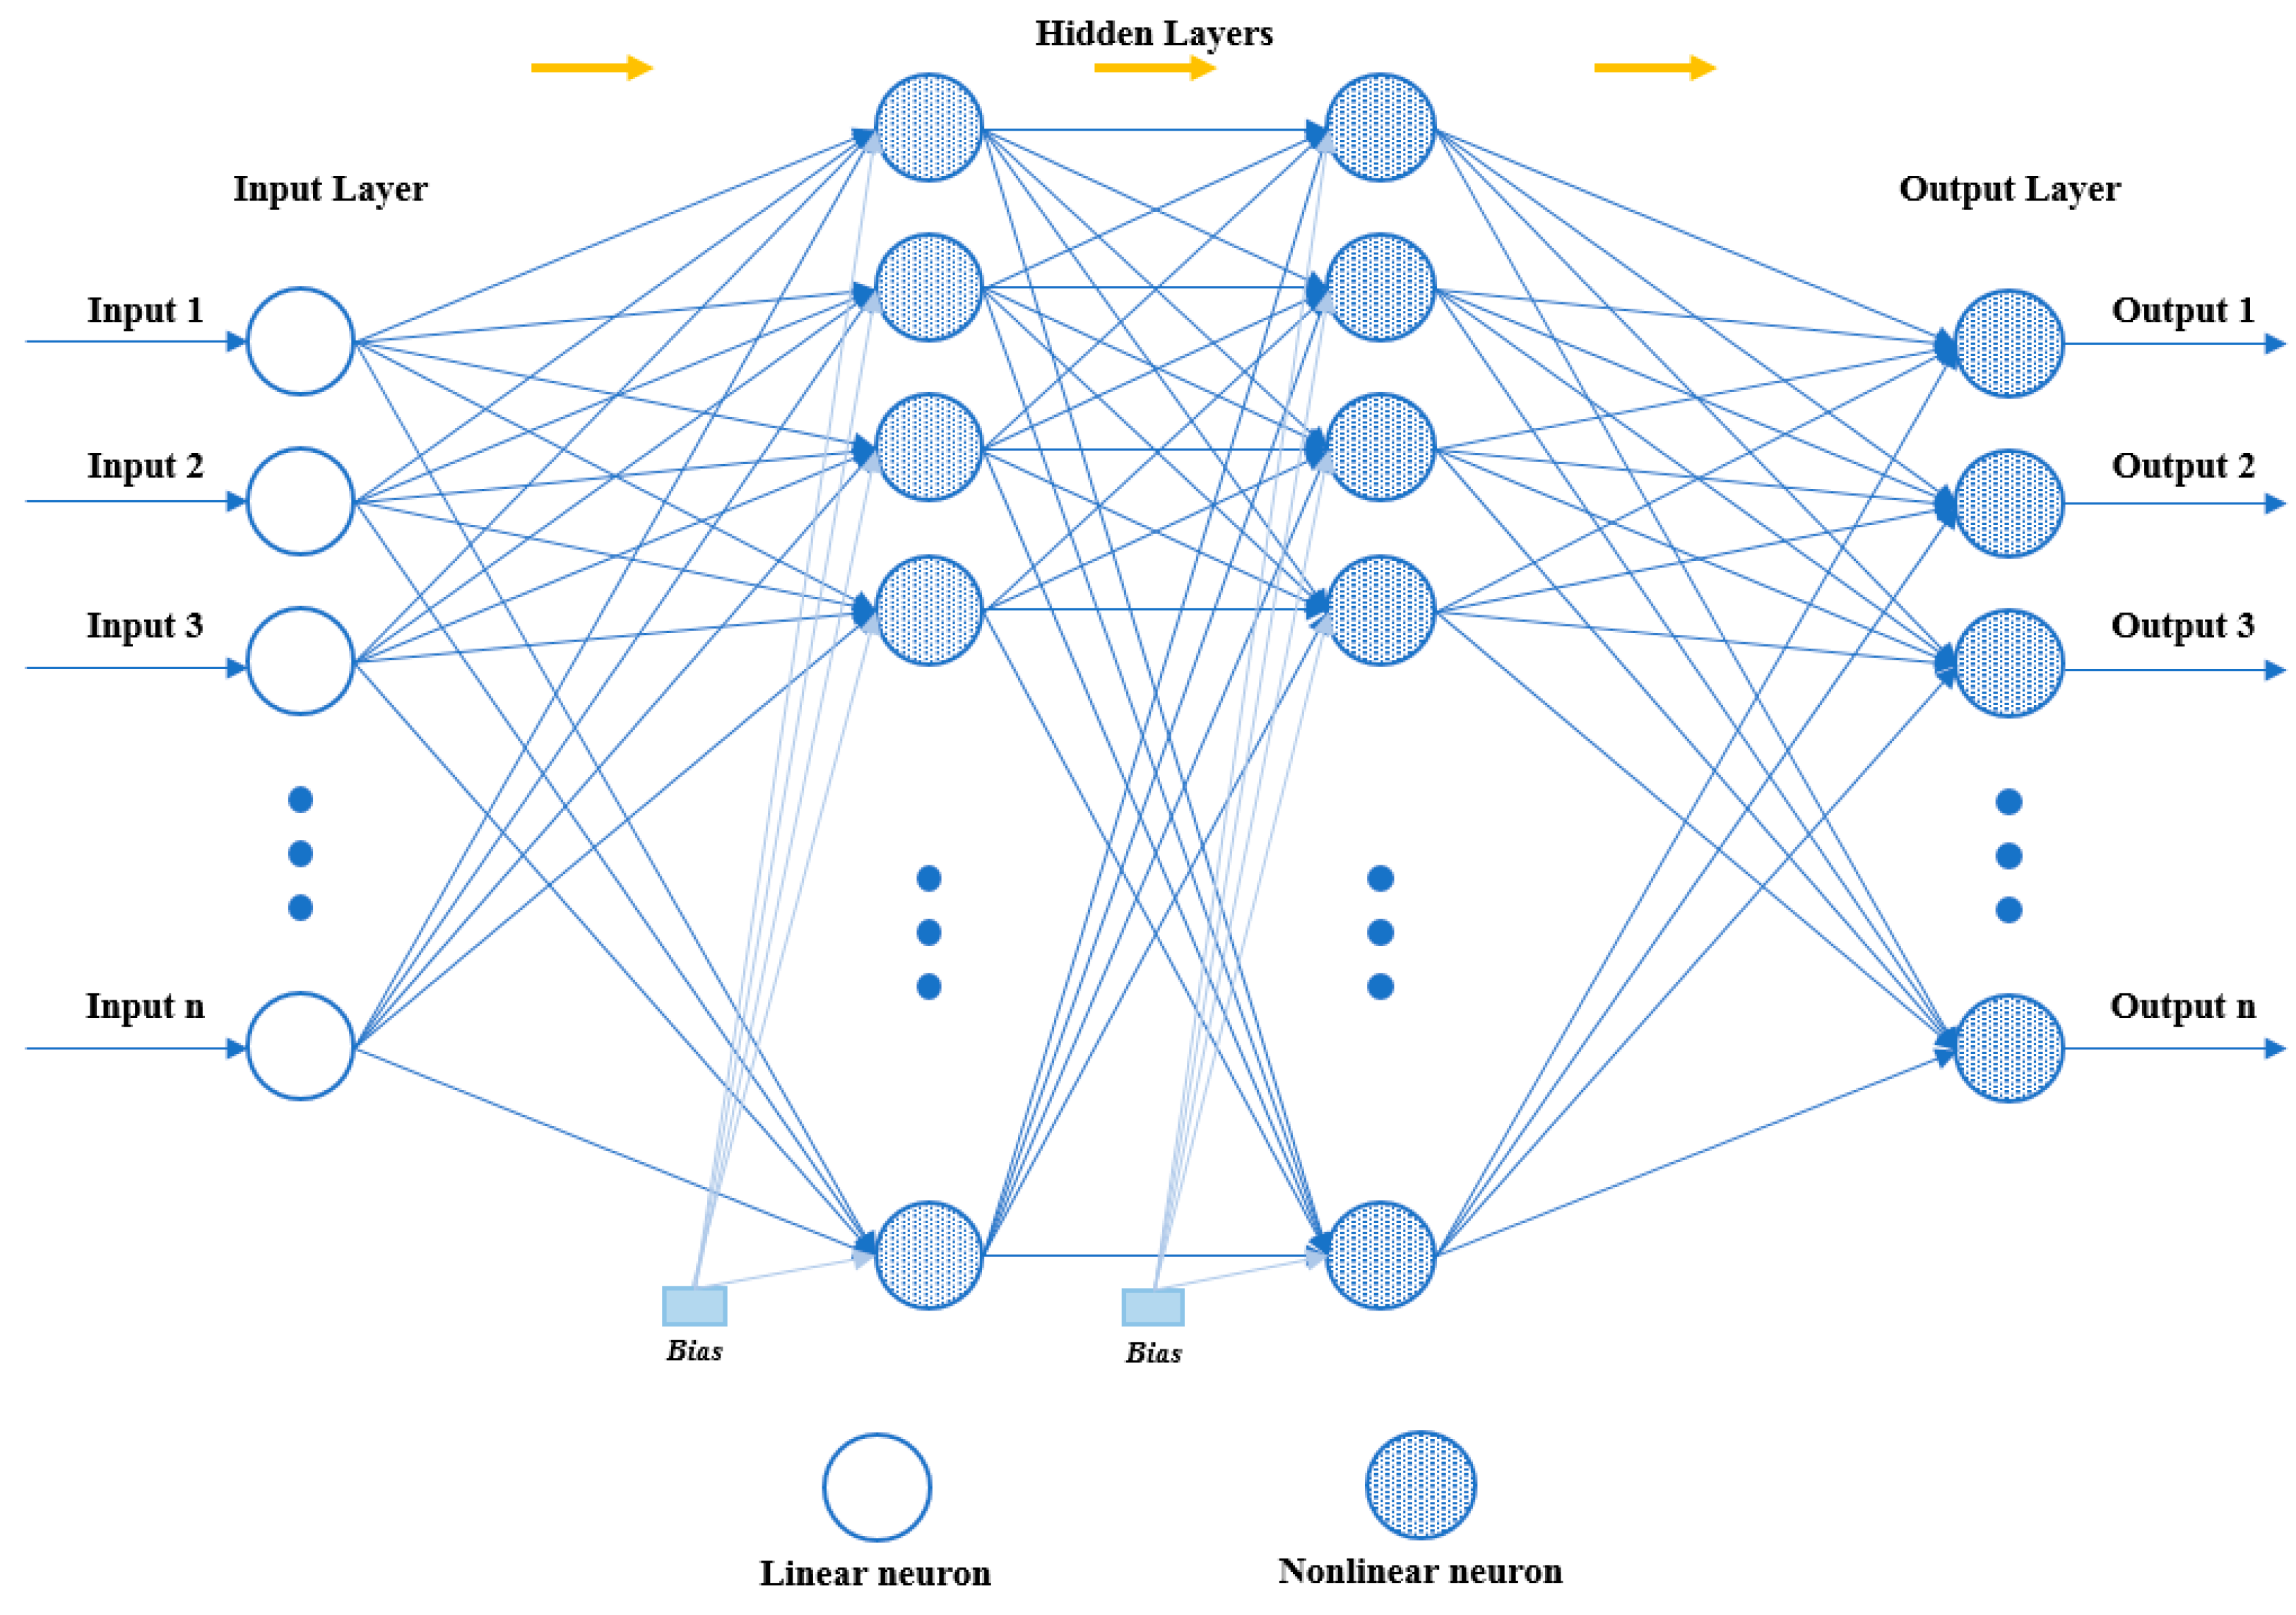
ANNs where data flow only in the forward direction are feed-forward networks. ANNs with connections that allow data to flow both forward and backward are called feedback neural networks. One of the network structures used in this study is the feed-forward back propagation network (FFBPN). The FFBPN is a method of supervised learning. Radial basis neural network (RBNN) and cascade forward back propagation network (CFBPN), other network structures used in the study, are also supervised learning methods.
The schematic representation of the ANN model trained to estimate the K
p, K
i and Kd parameters for the FFBPN model is given in
Figure 5.
The weights between input and hidden layers are updated as Equation (2) in FFBPN, where η is the learning rate and α is the momentum term.
E2(
t) is the propagation error between hidden and input layers.
E1(
t) is the error between experimental and neural network output signals [
28,
29].
The weights between the hidden and output layers are updated as Equation (3).
The CFBPN model is similar to a FFBPN model in using the backpropagation algorithm for weight updating. However, a fundamental characteristic of this network is that every layer of neurons is associated with all preceding layers of neurons. As other feed-forward networks, CFBPN has one or more interconnected hidden layers and activation functions. Each neuron has a bias of its own and each connection has a specific weight [
30,
31]. The schematic representation of the CFBPN model is given in
Figure 6.
Each combination in the CFBPN learning sample (p
q, d
q) is calculated as follows [
32]:
pq inputs are propagated forward through the layers of the m-layer neural network by Equation (4):
where
pq is input,
a is cell output,
b is bias and
w is weight.
Back propagate the sensitivities through the layers by Equation (5):
Modify the biases and weights by Equations (6) and (7), respectively:
These steps continue until the stopping criterion is reached.
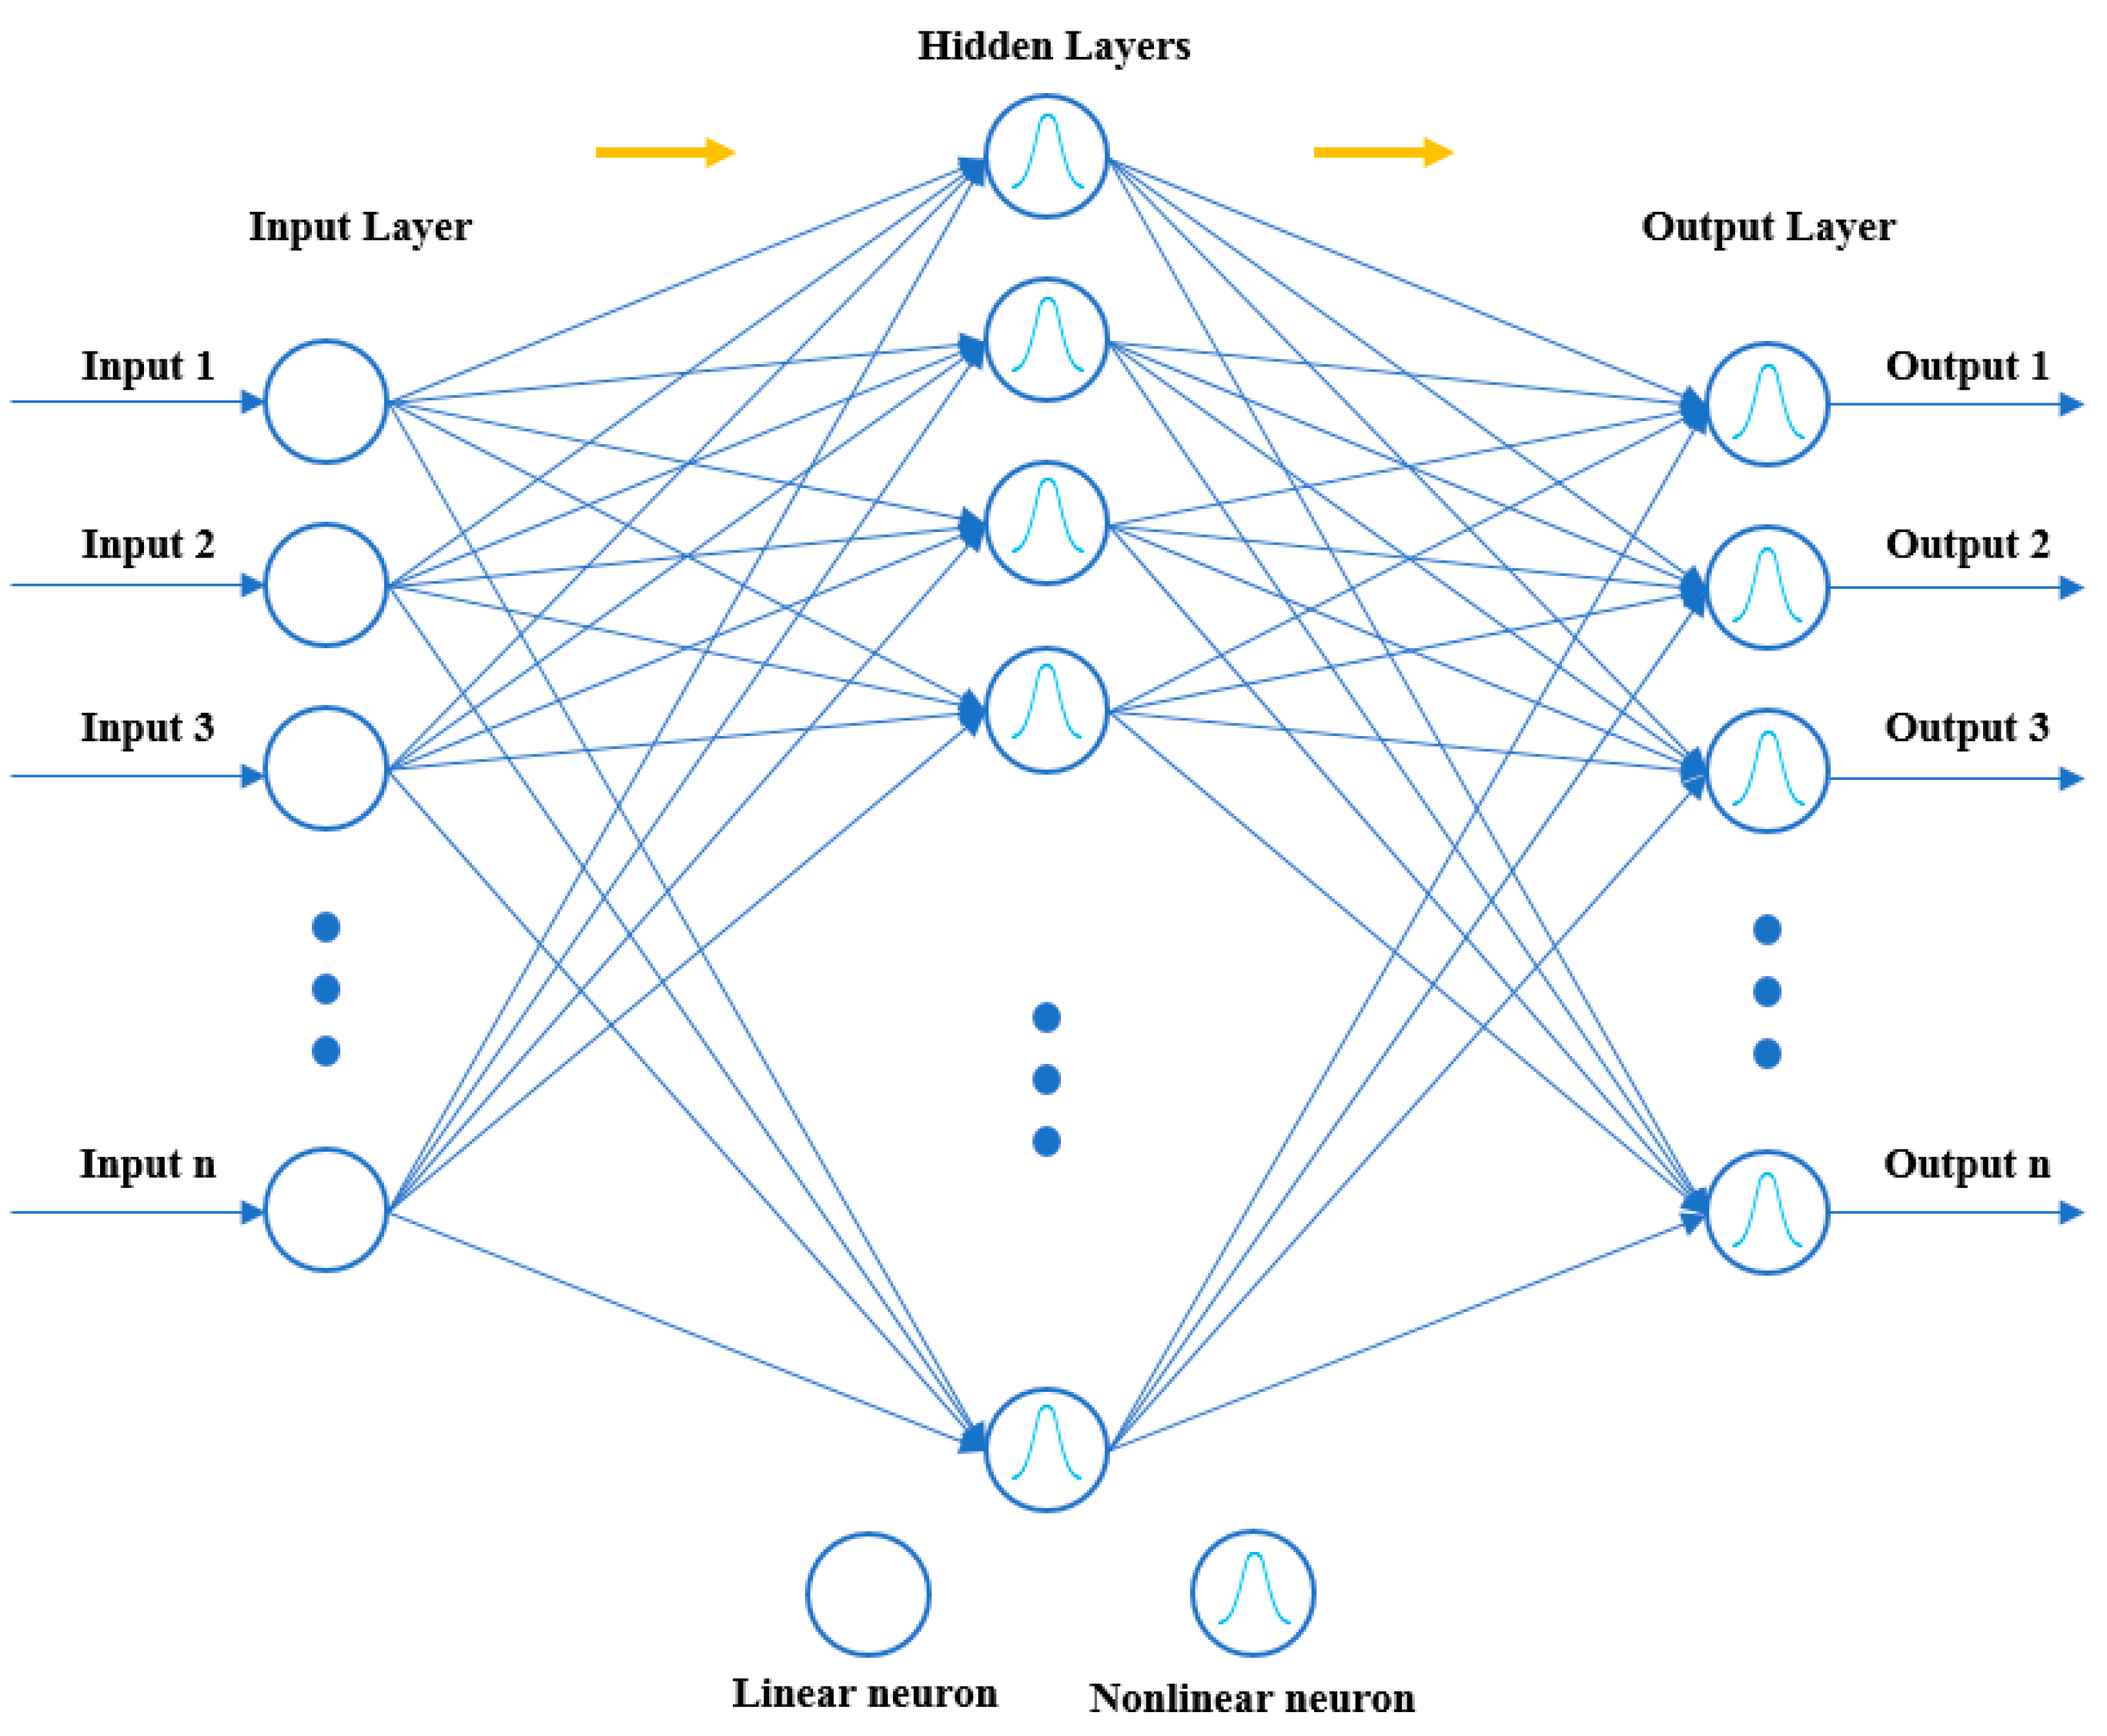
The nonparametric estimation of multidimensional functions using sparse amounts of training data is a common application for RBNN. Fast and thorough training of RBNNs makes them effective [
33,
34]. RBNNs have many benefits, including strong global approximation ability, no local minimum difficulties and fast learning speed [
35]. FFBPNs can have one or multiple hidden layers, while RBNNs have only one. The input layer, which is the first layer of the RBNN, just serves to transfer information and does not process the input data in any way. The second layer is a hidden layer. The third layer is the output layer, which will linearly transform the input data and then the output [
36]. The schematic representation of the RBNN model is given in
Figure 7.
The objective function in RBNN can be defined by Equation (8), where h
i is the height value of sample
i [
37].
The
f(
x) given in Equation (8) can be defined as in Equation (9).
where
n is the number of neurons in the hidden layer,
∈ W is the weight of neuron i in the linear output neuron,
ci denotes the center vector of the neuron i,
(.) denotes the nonlinear function that is a multiquadratic function in Equation (10).
where
r denotes the distance between unknown and known data, and
ξ is a smoothing factor between 0 and 1. As a result, the formula used to calculate the weights in the network structure is given in Equation (11).
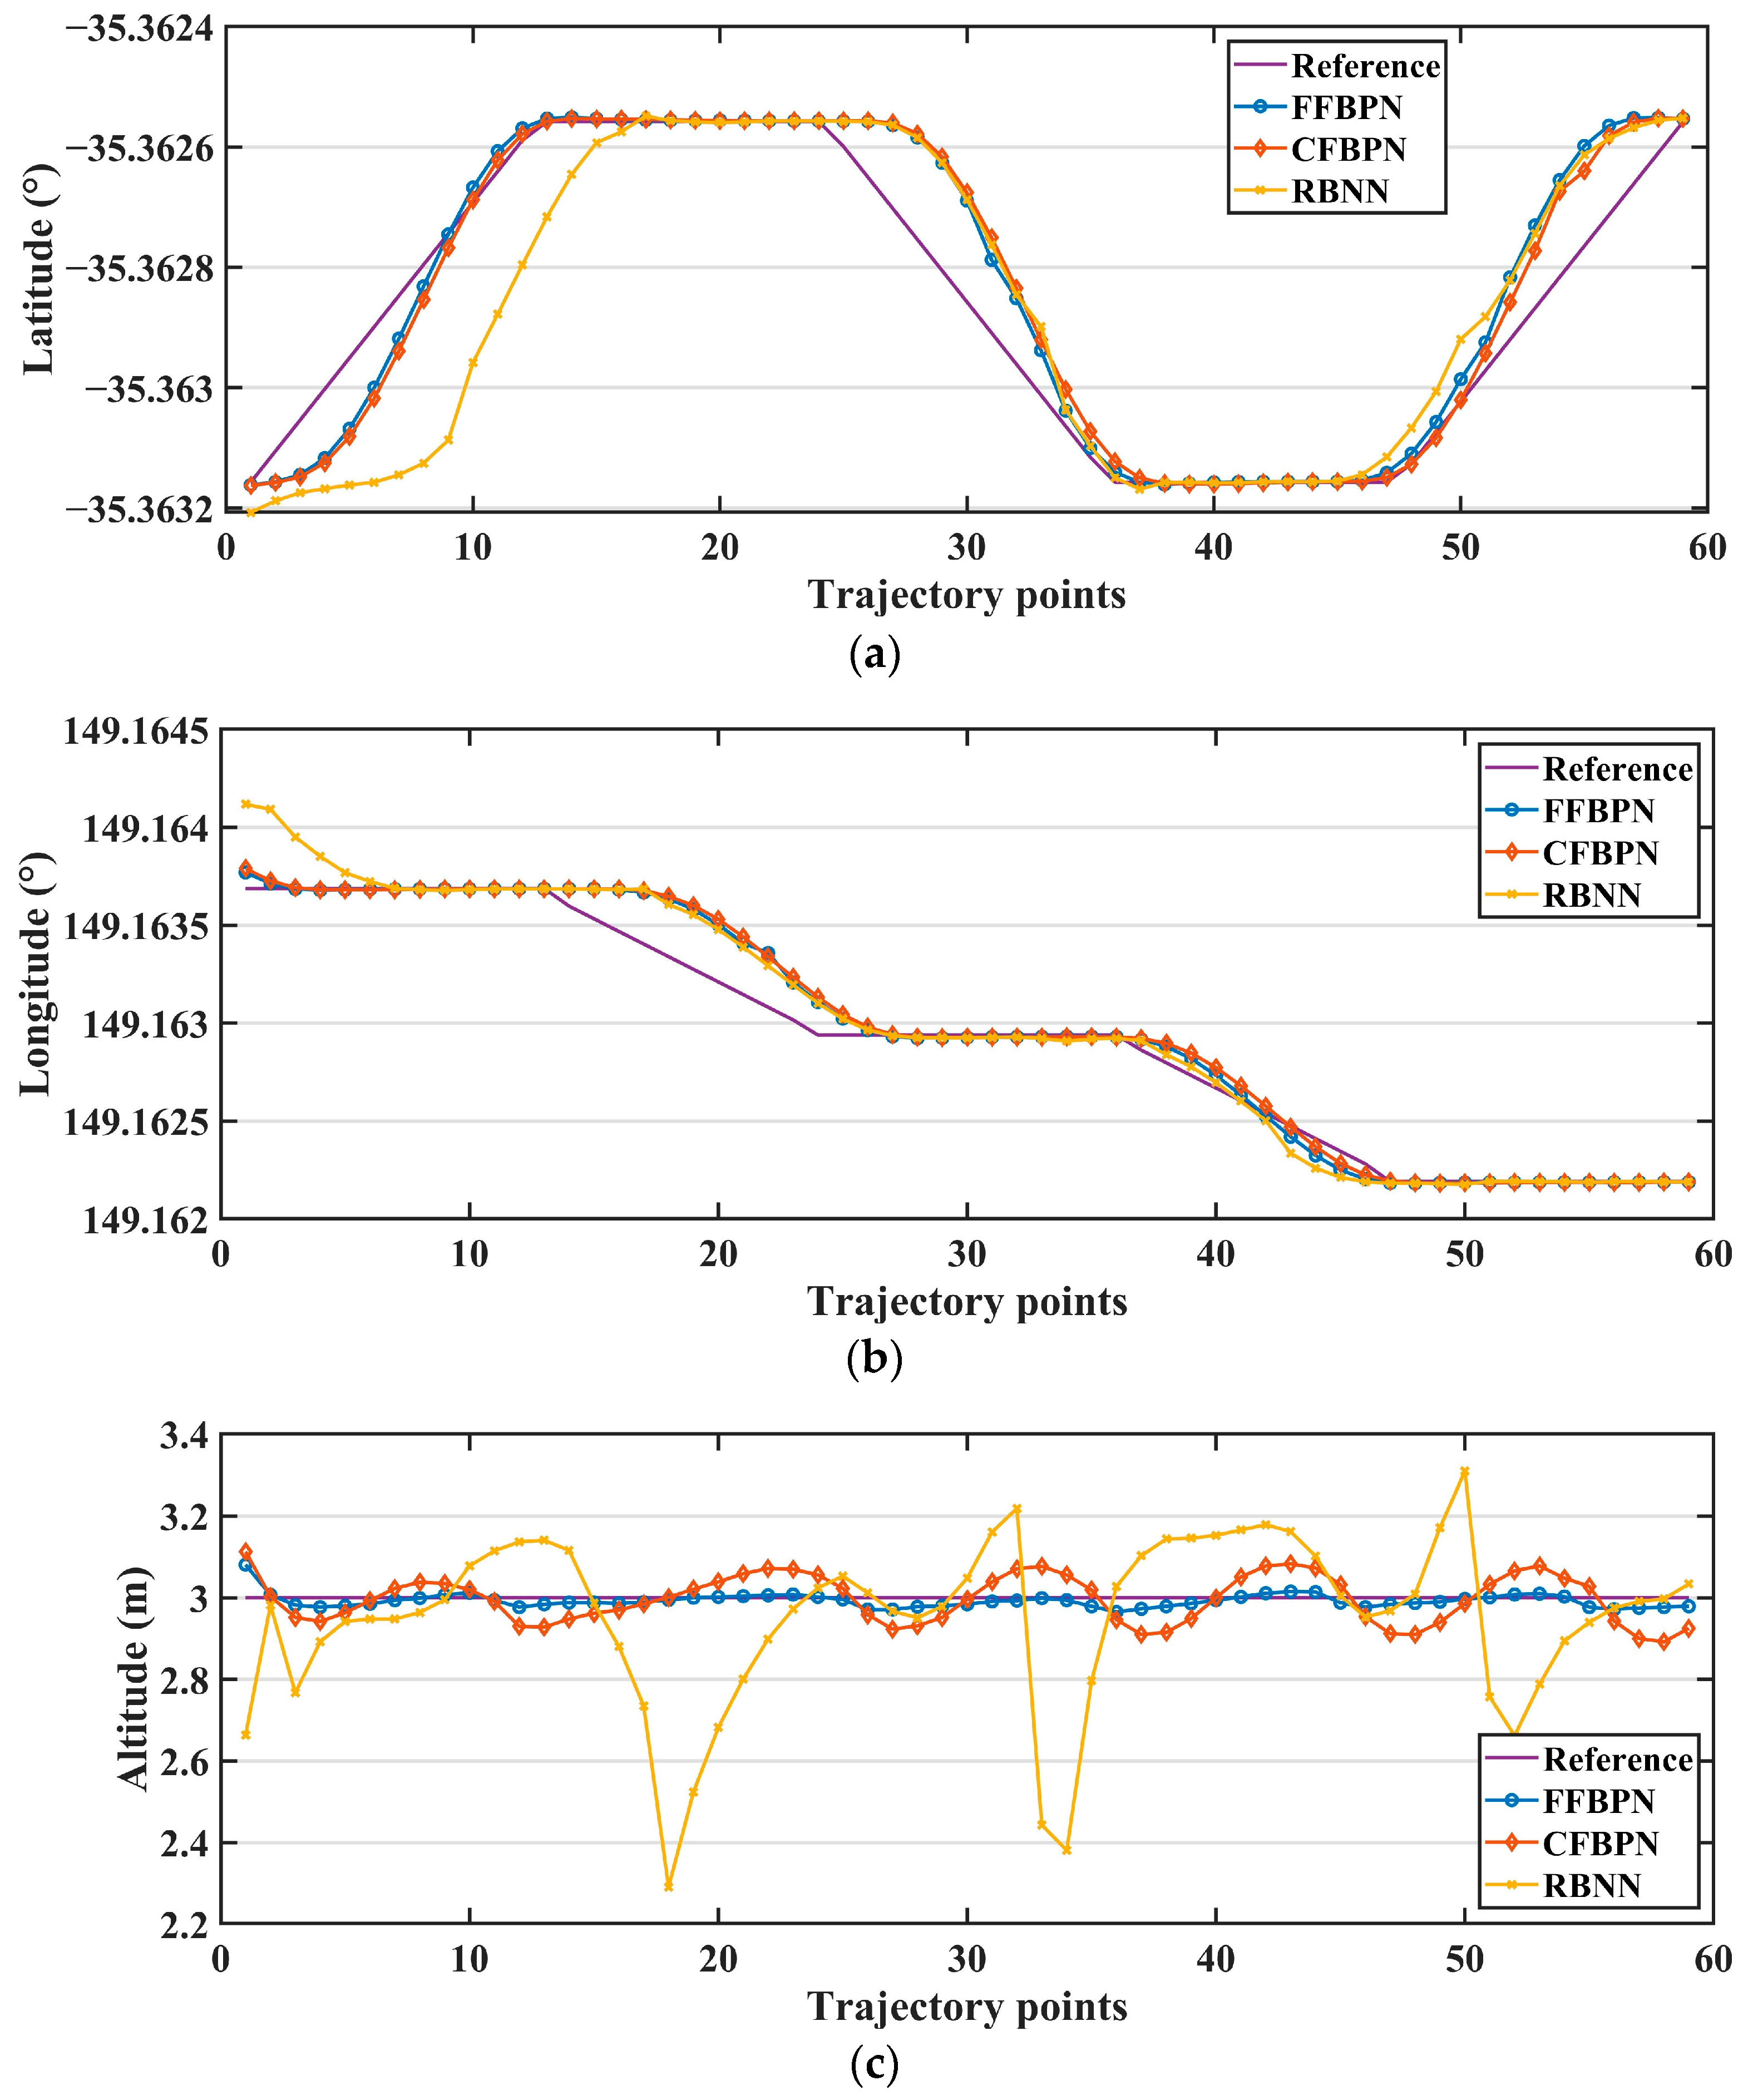
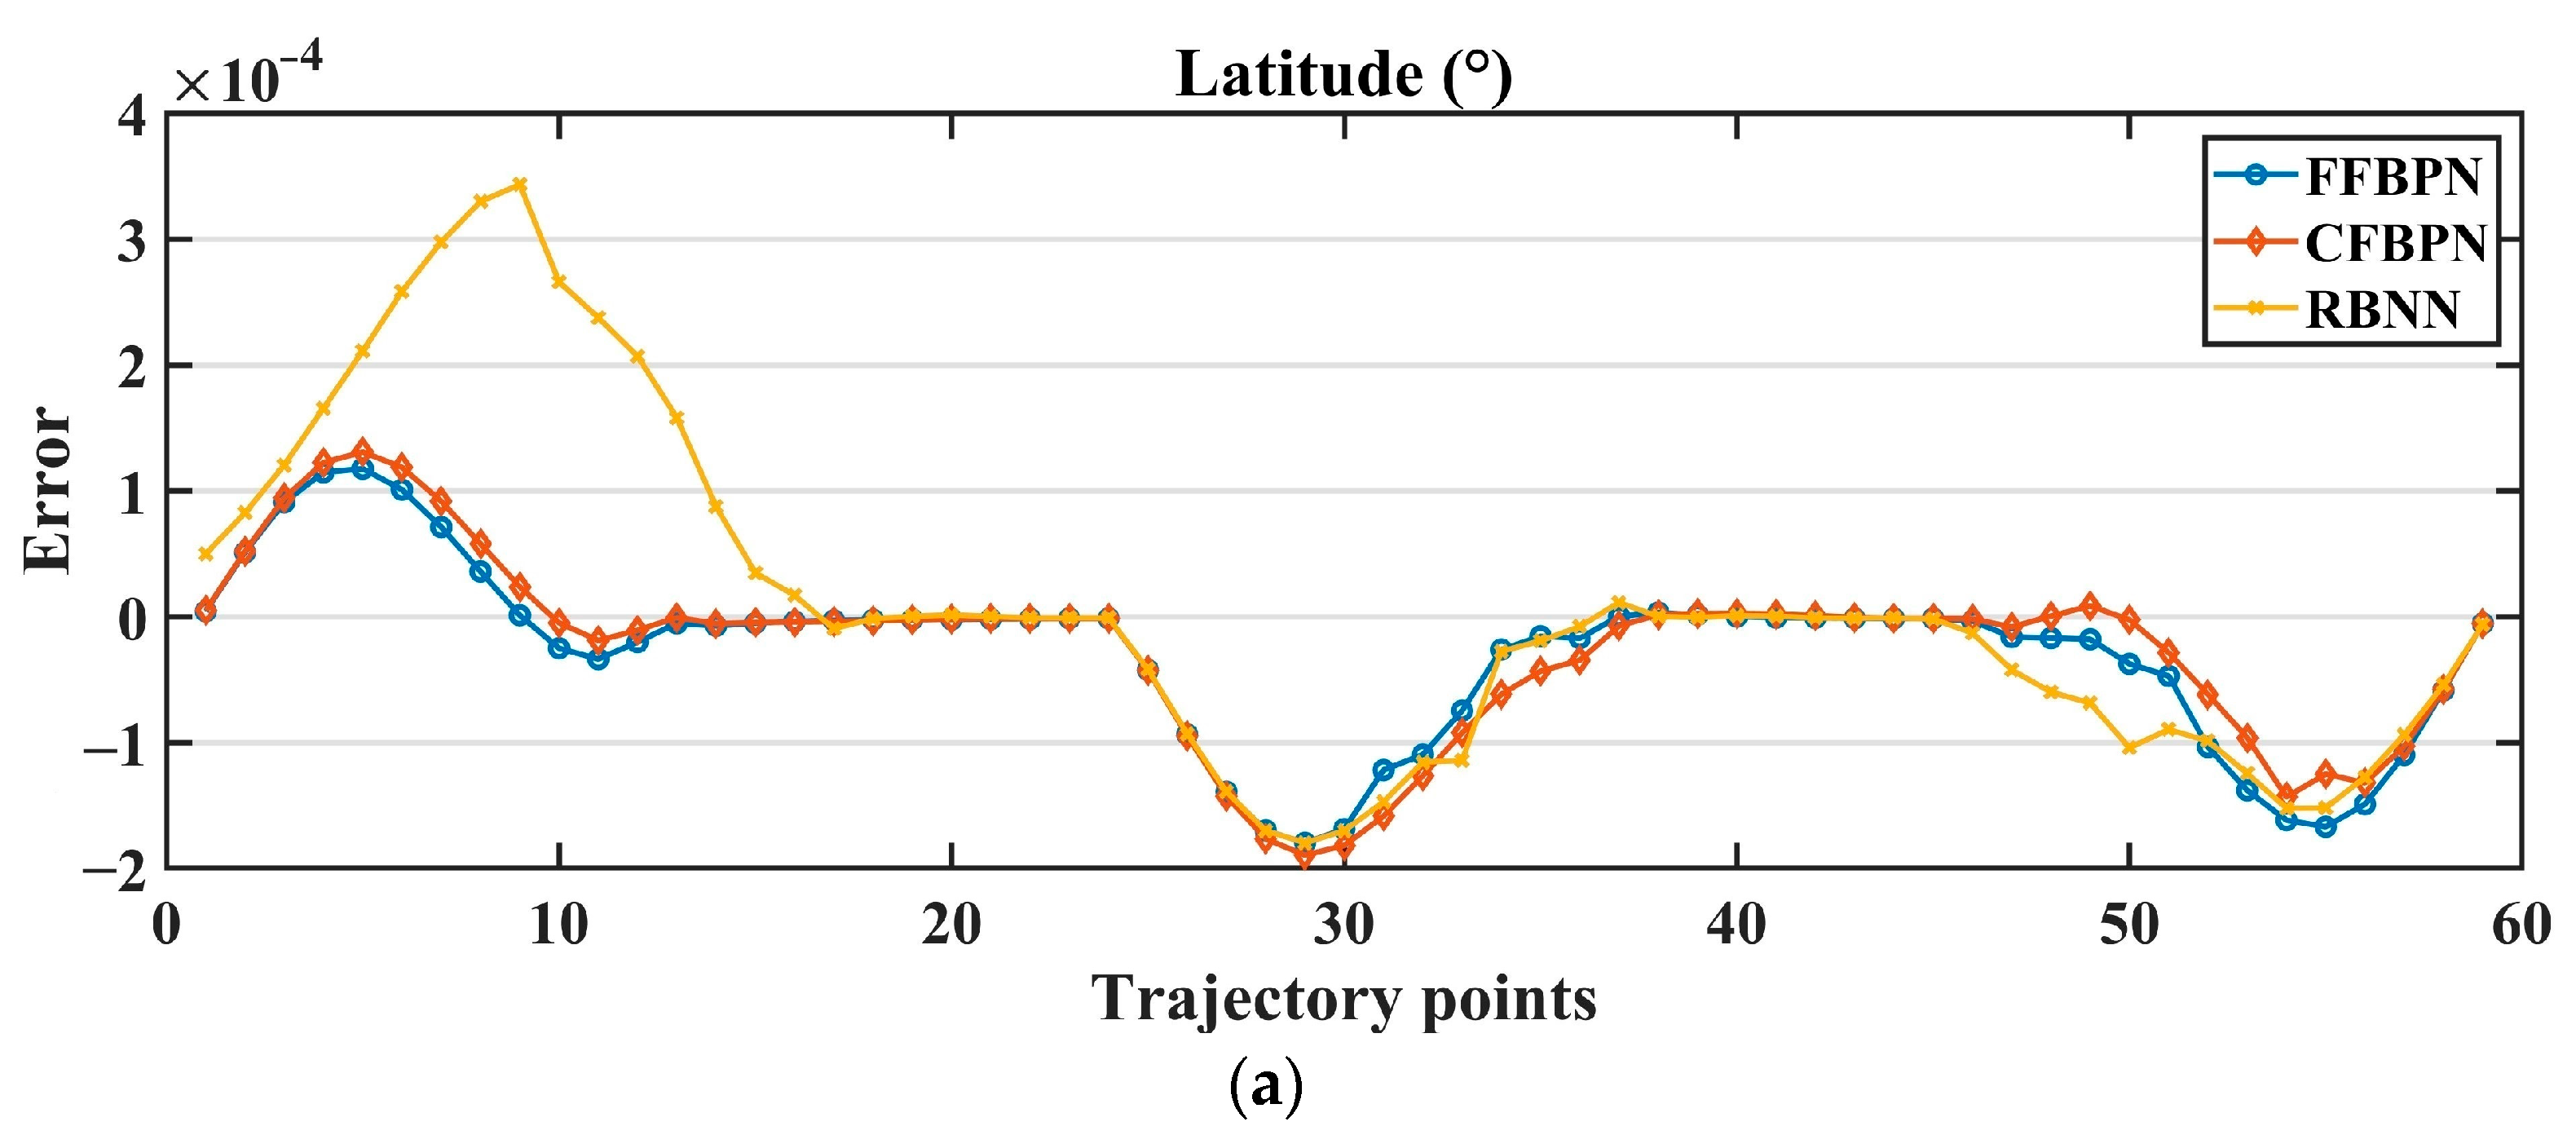
The latitude and longitude values (12 pieces) of the corner points determined from the position data recorded at 2 s intervals during the flight are used as input in the training of the ANN model. The output of the ANN model is the parameters Kp, Ki and Kd. The performance of the ANN models for the roll and pitch control models are examined in detail in the Results section.


 ,
, 


