
DEM-CFD Simulation Analysis of Heat Transfer Characteristics for Hydrogen Flow in Randomly Packed Beds


School of Environment and Energy Engineering, Anhui Jianzhu University, Hefei 230009, China
*
Author to whom correspondence should be addressed.
Energies 2024, 17(9), 2226; https://doi.org/10.3390/en17092226
Submission received: 15 April 2024
/
Revised: 1 May 2024
/
Accepted: 2 May 2024
/
Published: 5 May 2024
(This article belongs to the Special Issue Advances in Hydrogen Production and Hydrogen Storage)
Abstract
:In this study, three randomly packed beds with varying tube-to-particle diameter ratios (D/d) are constructed using the discrete element method (DEM) and simulated via CFD under low pore Reynolds numbers (Rep < 100). An innovation of this research lies in the application of hydrogen in randomly packed beds, coupled with the consideration of its temperature-dependent thermal properties. The axial analysis of the heat transfer characteristics shows that PB−5 and PB−6 achieve thermal equilibrium 44% and 58% faster than PB−4, respectively, demonstrating enhanced heat transfer efficiency. However, at higher flow rates (0.8 m/s), the large-sized fluid channels in PB−6 severely impact the heat transfer efficiency, slightly reducing it compared to PB−5. Additionally, this study introduces a localized segmentation method for calculating the axial local Nusselt number, showing that the axial local Nusselt number (Nu) not only exhibits an inverse relationship with the axial porosity distribution, but also matches its amplitude fluctuations. The wall effect significantly impacts the flow and temperature distribution in the packed bed, causing notable velocity and temperature oscillations in the near-wall region. In the near-wall region, the average temperature is lower than in the core region, and the axial temperature profile exhibits more intense oscillations. These findings may provide insights into the use of hydrogen in randomly packed beds, which are vital for enhancing industrial applications such as hydrogen storage and utilization.
1. Introduction
Packed beds are widely used across chemical and energy fields, attributed to their superior particle conductivity and enhanced surface area-to-volume ratio, such as high-temperature gas-cooled reactors [1], low calorific value burners [2,3], thermal energy storage systems [4,5,6,7], and catalytic reformers [8,9]. However, accurately capturing the localized thermal behavior in a packed bed remains an arduous task for experimental approaches, due to the complexity of these systems [10]. Traditional methods often struggle to provide detailed insights into the thermal exchanges and flow dynamics between particles.
With the development of numerical simulation techniques, the Discrete Element Method (DEM) has become an increasingly attractive option for tackling the tough experimental challenges of studying thermal particulate systems. It can reveal the pore-scale characteristics of thermal transport through the spaces in packed beds, which are often challenging to capture with traditional experiments. Theuerkauf et al. [11] analyzed the packing structure and porosity characteristics of randomly packed beds with different tube-to-particle diameter (D/d) ratios in detail by using the DEM. Investigations have demonstrated that the DEM reliably and precisely predicts the radial distribution of porosity across packed beds of various sizes, even those with small D/d ratios.
Due to the complex internal structure of packed beds or porous media, many experimental and theoretical studies treat the bed as a homogeneous system and focus primarily on bulk properties. While advanced experimental techniques can capture local characteristics of packed beds and fluid flow, thoroughly investigating key variables remains costly and labor intensive [12]. With the advent of Computational Fluid Dynamics (CFD), a significant advancement in simulating complex fluid flow and heat transfer phenomena has been achieved. CFD employs numerical methods and algorithms to solve and analyze problems involving fluid flows, offering a profound insight into the intricate dynamics of fluids interacting with solid boundaries. Studies have focused on using CFD techniques to better capture the interactions between phases, enhancing the predictive capabilities of models. For example, researchers like Afgan et al. [13] and Wu et al. [14] have expanded the application of CFD-DEM to nano-fluid dynamics and complex multiphase flows in energy systems, respectively. Ge and Zheng [15] explored the fluid-solid interactions crucial for understanding erosion and deposition processes, while Wijesooriya et al. [16] applied these methods to investigate wind-induced forces on structures, demonstrating the versatility and depth of analysis provided by CFD.
However, conducting CFD simulations of packed beds presents notable challenges, especially when generating effective meshing schemes. This issue is particularly pronounced at contact points between particles and between particles and walls, where grid cells often become highly skewed, severely affecting convergence and computational accuracy. To overcome these challenges, researchers have proposed various methods, including Gaps [17]; Overlaps [18]; Bridges [19], and Caps [20], with Bridges method being particularly effective for predicting thermal behaviors in packed beds [21,22].
Building on these technical advancements, numerous studies over the past few decades have delved into the factors influencing fluid flow and heat transfer in packed beds. Fernengel et al. [23] considered variables like bed height, particle insertion height, and material mechanical properties (such as friction and restitution). They demonstrated how geometrical structure influences flow characteristics and heat transfer, emphasizing the significance of these parameter settings in numerical packing design. The tube-to-particle diameter (D/d) ratio is also a crucial parameter for assessing the packing structure. Dong et al. [24] conducted comprehensive research on radial heat transfer in fixed-bed reactors, combining experiments and DEM-CFD simulations. The results of experimental studies and simulations emphasized the local inhomogeneities that are prevalent in fixed-bed reactors, especially in those with small D/d ratios. Guo et al. [25] found that an increase in the D/d ratio leads to a higher pressure drop and improved heat convection efficiency in a randomly packed bed at high Reynolds numbers (Re ~104). Liu et al. [26] noted that changes in the D/d ratios in packed beds result in varied radial porosity distributions, affecting fluid velocity distribution and heat transfer performance, which is crucial for heat transfer. Furthermore, with larger D/d ratios, fluid velocity variation near wall regions increases, while velocity heterogeneity in the central region decreases.
A packed bed can be divided into two regions based on radial porosity distribution: the core region and the near-wall region [27]. Yang et al. [28] examined how the tube wall affected fluid flow in beds with small D/d ratios, discovering that the mean velocity near the wall surpasses that in the core area. Cheng and Wong [29] conducted pore-scale simulations to investigate the thermal behaviors in both the near-wall and the core regions, identifying significant differences in flow patterns between these regions. They then developed separate empirical correlations for the convection coefficients in each region, reflecting the spatial variations in flow patterns. Guo and Dai [30] built a randomly packed bed of 120 spheres with a small D/d ratio (D/d = 7), focusing on local fluid flow and heat transfer characteristics in the packing structure at low Reynolds numbers (4.6 ≤ Re ≤ 56.2). They found that the wall effect can be attributed to the significantly inhomogeneous porosity distribution.
Furthermore, the tortuous internal channels in the packing structure may cause a channeling effect. Jadidi et al. [31] investigated how flow channeling affects the Nusselt number (Nu) and pressure drop across various Reynolds numbers. The results revealed that the channeling in the packing region significantly impacts temperature distribution, resulting in local maximum peaks in the Nu.
Over the past few decades, numerous studies have analyzed the flow characteristics in packed beds using water [32], air [33,34], or helium [35] as the heat transfer fluids (HTFs). However, little research has been conducted with hydrogen as the HTF in packed beds. As an excellent alternative to fossil fuels, hydrogen is an abundant and efficient fuel which is considered the fuel for the future [36,37,38]. In recent years, there has been an increased focus on the flow and heat transfer characteristics of hydrogen [39,40,41]. However, hydrogen is extremely sensitive to temperature variations, and the spatial temperature distribution significantly impacts its flow properties [42]. Fang et al. [43] empirically studied the thermal behavior of hydrogen flowing through a horizontally heated tube, considering the variable properties of hydrogen. A new correlation, incorporating temperature and length corrections, was evaluated for the local heat transfer prediction of hydrogen.
In the present study, we construct three randomly packed beds with varying tube-to-particle diameter ratios (D/d) using the discrete element method (DEM). These are simulated via computational fluid dynamics (CFD) and innovatively utilized hydrogen as the heat transfer fluid, considering the temperature-dependent properties of the hydrogen flow. The hydrogen flow and heat transfer characteristics in randomly packed beds are investigated at the pore scale. This study specifically examines the impacts of varying D/d ratios, as well as the influence of wall effects, channeling effects, and oscillations in local porosity, on the flow and heat transfer processes.
2. Physical Model and Numerical Method
2.1. Physical Model
In the present study, three randomly packed beds with different D/d ratios of 4, 5, and 6 are generated (named as PB−4, PB−5, and PB−6, respectively) using the DEM. The Hertz–Mindlin model describes interactions among spherical aluminum oxide particles, including particle-wall interactions [44]. Spherical aluminum oxide particles are randomly initialized in the cylindrical packing region and fall to the bottom of the tube due to gravity. The governing dynamics for particle motion in DEM simulations are as follows:
Equation (1) delineates the translational motion. is the mass of the particle. and represent the contact and damping forces, respectively. is external forces. Equation (2) pertains to the rotational motion. is the moment of inertia, is the angular velocity vector, signifies the torque due to contact, and reflects the torque as a consequence of rolling resistance.
The center positions of the particles are recorded, and the geometry of the packing structure is constructed using this positional data. Table 1 presents the properties of the particles used in the simulation.
As shown in Figure 1, the packed beds have a total length of 200 mm, with the packing region measuring 100 mm. To minimize the impact of flow disturbances at the entrance and exit, the heights of the entrance and outlet regions are extended to 40 mm and 60 mm, respectively. Cold hydrogen flows from the inlet region and is heated by the spherical particles at a temperature Tp after passing through the packing region. Furthermore, to mitigate the point contact effects, cylindrical bridges are employed between particle-particle and particle-to-tube wall contact points, as recommended by Bu et al. [22] and Dixon et al. [21].
2.2. Meshing Scheme
After the geometric model of the packed bed is constructed, the next step is the generation of the mesh. First, particle parameters from DEM simulations, including the centers and diameters of the particles, are imported into a CAD tool (Unigraphics NX 12, Siemens PLM Software, Plano, TX, USA). Subsequently, the re-modeled CAD geometric model is imported into a CFD meshing tool (Fluent Meshing 2021 R1, Ansys, Canonsburg, PA, USA) for mesh generation.
Figure 2 shows the mesh distribution in packed beds. An unstructured grid is used to better accommodate the complex geometry of the packing structure. Moreover, the bridge method is adopted to avoid the known issues that have been reported in the literature regarding grid cells near particle-particle and particle-wall contact points. According to Dixon’s report [21], when conducting simulations involving heat transfer calculations and a Re ≤ 2000, the bridge sizes should be db/dp ≤ 0.2. Therefore, the bridge columns’ diameters are set at db = 12%dp, ensuring computational accuracy while optimizing resource utilization.
2.3. Validation of Grid Independence
This study carries out grid independence validation for the PB−4 model at an inlet velocity of 0.3 m/s to ensure that the selected mesh size appropriately reflects the internal structure of the packed bed and captures its complex porosity characteristics while balancing the limitations of computational resources.
Figure 3 shows six different mesh sizes evaluated during this verification process. Following the recommendations of Dixon et al. [45], the maximum element sizes are set at 1/10, 1/15, 1/20, 1/25, 1/30, and 1/35 of the particle diameter. The figure also shows the trends in the global Nusselt number (Nu) and friction factor as functions of the mesh size. Significant fluctuations in the global Nu are observed with the larger mesh sizes of 1/10dp, 1/15dp, and 1/20dp. However, the response curve stabilizes with a mesh size of 1/25dp, beyond which changes in mesh size have negligible impact on the results. Consequently, a maximum element size of 1/25dp is selected for optimal accuracy and resource efficiency.
2.4. Governing Equations
In this simulation, the three-dimensional Navier–Stokes and energy equations are employed to model the steady-state, incompressible flow. According to the study by Bear et al. [46], Reynolds numbers less than 300 characterize laminar flow. In this study, the pore Reynolds number (Rep) is calculated to be approximately 15–50, based on Equation (15); therefore, the flow is characterized as incompressible and laminar. The governing equations are delineated as follows:
Continuity equation
where is the velocity vector and ρ is density.
Momentum equation
where p is pressure and μ is dynamic viscosity.
Energy equation
where T is thermodynamic temperature and cp is specific heat capacity.
In this study, ANSYS FLUENT version 21.1 is utilized for computational analysis. The SIMPLE algorithm is applied to couple velocity and pressure fields. For the momentum and energy equations, the convective terms are resolved using the second-order upwind scheme. Convergence of the iterative calculation is achieved when the residuals decrease to a value below 10−5, ensuring adherence to the principles of mass and energy conservation across the fluid flow at the inlet and outlet, as well as within the packed bed system.
2.5. Boundary Conditions
The simulation uses hydrogen at an inlet temperature of 293 K and inlet velocities of 0.3 m/s, 0.5 m/s, and 0.8 m/s. Particle walls, made of aluminum oxide, are kept at a constant temperature of 373 K. Additionally, the tube wall is defined as adiabatic, preventing heat transfer between the tube and the surrounding environment. The boundary conditions are specified as follows:
where is the heat transfer rate, is the heat transfer coefficient, is the particle temperature, and is the fluid temperature.
2.6. Hydrogen Properties
Research indicates that the thermal properties of hydrogen exhibit high sensitivity to temperature variations, a fact often overlooked in many studies [47]. However, within the temperature range specified in this paper (from 293 to 373 K), the specific heat, thermal conductivity, and viscosity of hydrogen increase by 1.2%, 19.8%, and 18.2%, respectively. Therefore, this research examines the impact of temperature on the thermal properties of hydrogen to improve simulation accuracy. Measurements of the thermal properties are conducted using the NIST REFPROP software version 10.0 [48], and a polynomial fitting approach is applied to obtain the expression for the variation of hydrogen properties with temperature, as follows:
where T is the temperature of the hydrogen.
2.7. Definitions of Dimensionless Parameter
This study uses a series of dimensionless parameters to elucidate the flow and heat transfer characteristics in the packed bed, integrating key factors like porosity and the D/d ratio into the hydraulic diameter (dh) calculation for the packed bed, as shown in the study by Romkes et al. [49]. The pore Reynolds number (Rep) for the packed bed is defined as follows:
where vi is interstitial velocity and dh is hydraulic diameter.
where vs is superficial velocity and N is tube-to-particle diameter ratio.
The Nusselt number is presented as follows:
where ∆Tm is logarithmic mean temperature difference.
The friction factor is presented as follows:
3. Model Validation
3.1. Validation of the Packing Structure
In this study, the packed beds are circumferentially divided into 60 equidistant annular sections. The porosity of each section is calculated, allowing us to generate the radial porosity distribution curves for beds with D/d ratios of 4, 5, and 6. The simulated radial porosity distributions are subsequently compared and analyzed against two experimental-based radial porosity correlations. In the Mueller model [50], the radial porosity distribution is expressed as:
where εb is the porosity of the central region away from the wall, J0(x) is the Bessel function of the first kind, and order 0, a and b are shape parameters. In the de Klerk model [51], the radial porosity distribution is expressed as a piecewise function:
where z is the dimensionless wall distance.
Figure 4 illustrates the relationship between the radial porosity and the dimensionless radial distance, measured in particle diameters. Porosity peaks where particles closely adhere to the tube wall, then decreases to a minimum approximately 0.5dp from the wall. This is due to the orderly arrangement of spherical particles near the tube wall, inducing a similar arrangement in the internal particle structure. This leads to pronounced porosity peaks and troughs, with subsequent oscillations of gradually diminishing amplitude. Figure 4a indicates that the PB−4 model exhibits a significant increase in porosity approaching the bed center. While some local deviations in the profiles due to random packing are noted, the fundamental characteristics like amplitude and periodicity are effectively replicated. Discrepancies in the central region of the tube, particularly at (R − r)/dp = 1.8, are primarily attributed to the sampling area limitations of the model, with minimal impact on the overall packing structure. These results validate the effectiveness and reliability of the DEM employed in this study for generating packed bed models.
3.2. Validation of the Heat Transfer Model
Figure 5 displays the global Nusselt number (Nu) for the three packed beds, comparing simulation results with experimental correlation predictions. It is found that the Nu curves obtained from the simulations conducted in this study are steeper compared to those reported in the literature. This discrepancy is primarily attributed to the use of hydrogen, which is characterized by a superior thermal conductivity in comparison to air (the conventional working fluid), as the working fluid in this study. Crucially, the variation in the thermal properties of hydrogen with temperature also contributes to these differences.
Furthermore, the global Nu for PB−4 and PB−5 exhibit the highest degree of agreement with the Wakao correlation [52], whereas the Nu for PB−6 aligns most closely with the Tavassoli correlation [53]. The majority of the data points fall within the 10% error range for PB−4, the 15% error range for PB−5, and the 10% error range for PB−6 (as indicated by the shaded areas in the figures). Specifically, the average deviations for PB−4 and PB−5 are found to be 5.53% and 8.87%, respectively, while for PB−6, the average deviation is 5.00%.

4. Results and Discussion
4.1. Analysis of Friction Factor in Packed Bed
Figure 6 reveals the variation of friction factors as a function of inlet pore Reynolds number (Rep) for the three different packed beds. The results demonstrate that the friction factor increases with the D/d ratio at certain inlet Rep. This increase is attributed to denser particle packing, which narrows and distorts fluid channels, consequently enhancing fluid separation and backflow, thereby significantly elevating pressure loss. To validate the accuracy of the simulation results, Figure 6 also compares these results with predictions from four empirical calculations, detailed in Table 2. Figure 6a shows the PB−4 model closely matches Foumeny’s correlation [56], while Figure 6b,c show PB−5 and PB−6 models align more with Carman’s correlation [57]. The maximum deviations between the PB−4, PB−5, and PB−6 models’ calculated results and their closest correlations are 11.76%, 9.72%, and 6.35%, respectively, all within an acceptable error range.
4.2. Characteristics of Flow and Heat Transfer in Packed Bed
Figure 7 shows velocity and temperature field analysis at cross-section (X = 0) for the three packed beds. Near the tube walls, flow channels align with the main flow direction due to the wall influence, whereas the internal bed channels, influenced by random particle gaps, tend to diverge or create bypass flows. This leads to lower interior flow velocities compared to the near-wall regions, a trend especially marked in beds with smaller D/d ratios (e.g., PB−4).
As the D/d ratio increases, the compactness of particle packing reduces the gap sizes within the bed, leading to a more uniform porosity distribution. This enhancement increases the internal channel complexity, causing the fluid to face more local resistance and directional changes while navigating through the bed. Consequently, diverse and complex internal flow channels form, enhancing flow separation and lateral flows. Specifically, in the PB−4 model’s streamlines (Figure 7a), most flow spaces are dominated by fluid moving in the main flow direction, exhibiting minimal flow separation and recirculation among the three models.
In the central region of PB−4, a large fluid channel can be found, where flow velocity significantly exceeds surrounding areas, creating a marked low-temperature zone (seen in Figure 7b) and contributing to the noticeable temperature distribution inhomogeneity. Additionally, as depicted in Figure 7a, certain flow areas, especially around particle wakes or packing region ends, display low-speed or stagnant zones. Fluid separation at the end of the packing region generates vortices that induce local negative pressure and fluid backflow. Similar low-speed areas appear in the upstream regions of spherical particles at wakes. Stagnant zones and bypass channels often form in loosely packed areas or near tube walls, causing local flow velocity spikes. These observations are typical of the flow within PB−4 as a result of the low D/d ratio.
The temperature distribution within each packing tube exhibits a strong correlation with the velocity distribution, with higher local velocities tending to exhibit lower temperature distributions, and vice versa. This indicates that the temperature field heterogeneity in PB−4 is higher than in PB−5 and PB−6, likely caused by differences in internal flow characteristics and the interactions between the fluid and packed bed particles.
To investigate the impact of internal geometric packing structure on flow, 200 equidistant cross-sections along the Z-axis at different heights (0.5 mm apart) are analyzed for porosity and surface average velocity. The axial porosity and velocity distributions in the three packed bed types are plotted, as depicted in Figure 8.
The axial porosity analysis delineates three distinct zones. Initially, from the base of the bed (Z = 0 mm) up to twice the particle diameter height shows notable porosity fluctuations due to the regular particle packing structure at the bed’s bottom. This regularity leads to pronounced peaks and valleys in porosity at specific locations, contributing to increased inhomogeneity. The second zone exhibits a reduction in porosity fluctuation to about a third of that in the first zone, with a slight increase near the top of the packing region. The third zone, within one particle diameter from the top layer, exhibits a sharp increase in porosity due to the loose packing of particles at the top.
The velocity and porosity exhibit a significant inverse correlation, where areas of high porosity typically show lower velocities. Furthermore, the fluctuation pattern in the axial velocity distribution is consistent with the three identified zones, indicating that local changes in porosity directly affect the fluid velocity distribution characteristics.
To further investigate the temperature distribution along the axial direction in the packed bed, this study plots the temperature distribution curve of hydrogen flow along the Z-axis (see Figure 9). The analysis reveals that the temperature significantly increases near the inlet section (Z < ~10 mm), indicating that the most intense heat exchange occurs in this region. As the height increases, the rate of temperature rise gradually decreases, suggesting that heat transfer is approaching an equilibrium state. Notably, in the PB−5 model, the temperature exhibits a more rapid increase compared to the PB−4 model, reducing the axial height required to achieve heat transfer equilibrium by about 44%, while in the PB−6 model, this reduction reaches 58%. This demonstrates that as the D/d ratio increases, the bed’s sensitivity to the entrance effect decreases, thereby reducing the necessary height of the packing region to reach heat transfer equilibrium.
To analyze the radial temperature distribution characteristics at different heights in the inlet section of the packed bed, the cylinder is divided into three height planes at Z = 2 mm, Z = 6 mm, and Z = 10 mm, creating a series of evenly spaced radial concentric cylindrical rings. The average temperature distributions for these rings are computed for each height plane, as depicted in Figure 10.
Significant oscillations in the radial temperature distribution are observed at the Z = 2 mm plane across all three packed beds, likely due to initial resistance and disturbances from the spherical walls at the inlet. The regular arrangement of the first layer of particles results in a highly uneven porosity distribution, which impacts temperature uniformity.
At Z = 6 mm, distinct differences in the radial temperature distribution among the three packed beds become apparent. The PB−4 model, with its smaller D/d ratio, shows a highly oscillatory temperature distribution curve. In contrast, the PB−5 model exhibits diminishing oscillation amplitude, especially near the core region. The PB−6 model shows a clear divergence from the first two, with a significantly reduced range of fluctuation and smoother oscillations.
At Z = 10 mm, the temperature curves of PB−5 and PB−6 exhibit a flattened pattern, indicating a near-equilibrium state of heat transfer. Conversely, PB−4 still shows significant fluctuations, particularly in the central region. The pronounced decrease in temperature at the center of PB−4 is caused by the presence of fluid channels near the inlet, which exacerbates temperature non-uniformity and decrease the heat transfer efficiency.
4.3. The Influence of the Wall Effect
Figure 11 illustrates the relationship between radial velocity and porosity in the three different packed bed models, revealing that the radial velocity distribution generally follows the porosity distribution, though with a delay. Specifically, local porosity reaches its lowest at location ((R − r)/dp = 0.5) due to the regular arrangement of spherical particles near the tube wall. From previous analysis, it is evident that there are pronounced variations in the flow and temperature fields along the radial direction, characterized by significant differences in flow and heat transfer performance between the fluid near the wall and that in the central region.
To further explore these differences, this study divides the packed bed into the near-wall and core regions along the radial direction, based on the packing structure and flow characteristics. According to Cheng and Wong [29], the near-wall region is defined as the region where (R − r)/dp ≤ 0.5, with the rest being the core region. In the near-wall region, velocity peaks at specific locations (e.g., at 0.25dp) are partly due to the velocity gradient caused by fluid viscosity right next to the tube wall and local high porosity forming flow channels. In the core region of PB−4, significant flow channels result in a notable increase in flow velocity, while the velocity fluctuations in the core regions of PB−5 and PB−6 are relatively insignificant.
To delve into how the near-wall and core regions affect heat transfer characteristics, temperature distribution curves for both regions along the axial direction are plotted, as shown in Figure 12. This involves calculating the average temperature of each region.
In all three types of packed beds, temperature curves for the near-wall regions exhibit clear oscillations. In the front half of the packing region, temperatures in the near-wall regions are significantly lower than in the core regions. As the heat transfer approaches equilibrium, the temperatures of both regions gradually align and stabilize.
The core region of PB−4, as shown in Figure 12a, undergoes a significant temperature drop at approximately one particle diameter’s height, which leads to pronounced oscillations. This temperature drop is primarily due to the presence of a large fluid channels in the center of PB−4, which significantly affect the temperature profile. Similarly, for the PB−5 and PB−6 models, the temperature curves at the same height exhibit variations in temperature decrease. This variation can be attributed to the regular arrangement of particles in the bottom area, which results in a sharp increase in local porosity, influencing the temperature dynamics.
4.4. Analysis of Local High-Speed Fluid Channels
Figure 13 shows the high-speed regions (over 3 m/s) in PB−4 and PB−6. PB−4 exhibits the formation of continuous channels in the center of the bed, where high-speed fluid areas are observed (see Figure 13a). In contrast, PB−6 shows scattered high-speed areas throughout the bed, with few continuous channels and similar high-speed, low-temperature regions near the tube walls (see Figure 13b). This pattern suggests that a higher D/d ratio disrupts the formation of continuous fluid channels due to a denser particle arrangement, thereby reducing the occurrence of high-speed, low-temperature areas. This disruption impacts the overall fluid dynamics and thermal characteristics of the bed, as the denser packing limits the fluid’s ability to form stable, fast-flowing pathways, ultimately affecting heat transfer efficiency.
4.5. Characteristics of Axial Local Nusselt Number in Packed Bed
To explore local heat transfer coefficients in the packed bed, this study divided the PB−5 bed axially into 200 sections, calculating the average temperature and particle surface area between sections to determine the axial local Nusselt number (Nu). Figure 14 displays the distributions of the axial local porosity and local Nusselt number. The axial local Nusselt number fluctuations in PB−5 are roughly inversely related to the axial porosity, indicating that as heat transfer progresses, the fluid temperature approaches the particle wall temperature, leading to a gradual decrease in the local Nu.
To verify the accuracy of the local Nusselt number, the calculated results are compared with empirical correlations from the literature [52,55,60,61]. The comparison shows that the oscillation trend of the calculated local Nu generally aligns with the empirical correlations, especially in the inlet region, where it matches well. However, deviations occur in the core region, possibly due to the reduced temperature difference between the hydrogen fluid and particle walls, which leads to decreased heat transfer efficiency and consequently lower local Nusselt numbers. Further analysis indicates that the correlation by Gunn et al. [61] is more sensitive to fluctuations in local porosity, effectively reflecting the impact of axial porosity changes on heat transfer within the packed bed. In contrast, the Nusselt number correlation by Ranz and Marshall [60] shows less sensitivity to bed porosity, with its amplitude remaining low and the trend nearly linear. These results highlight differences in how various correlations respond to changes in local porosity regarding the local Nusselt number.

4.6. Evaluation of Heat Transfer Coefficient for the Three Packed Beds
Figure 15 compares the heat transfer coefficients of the three types of packed beds at different inlet velocities. The graph clearly shows that the heat transfer coefficients for all models increase with the inlet velocity, a result that aligns with the fundamental principles of fluid dynamics and heat transfer, where higher flow velocities enhance turbulence and thereby promote convective heat transfer.
At specific inlet velocities, the heat transfer coefficient increases with the D/d ratio. This increase is likely due to the diversified flow paths and a more uniform heat distribution at larger ratios. However, when the velocity reaches 0.8 m/s, the heat transfer coefficient of PB−6 is 207.9 W∙m−2∙K−1, slightly lower than the 208.3 W∙m−2∙K−1 of PB−5 model at the same inlet velocity, despite the high D/d ratio. This discrepancy might be attributed to the large fluid channels present in the PB−6 model at high inlet velocities, which, as previously analyzed, can lead to uneven heat distribution in the packed bed, negatively affecting the overall heat transfer efficiency. With increasing inlet velocity, these large channels might exacerbate this effect, leading to a reduction in heat transfer efficiency. This unexpected result suggests that merely increasing the D/d ratio does not always guarantee improved heat transfer efficiency; instead, it depends significantly on the internal flow characteristics of the bed.
5. Conclusions
In this paper, three randomly packed beds with different D/d ratios (PB−4, PB−5, and PB−6) were generated. Considering temperature-dependent variations in thermal properties, the fluid flow and heat transfer of hydrogen in these packed beds were discussed. The major findings are as follows:
(1) With the increase in the D/d ratio, the sensitivity of the randomly packed beds to the entrance effect decreases. Specifically, the height required to achieve thermal equilibrium in PB−5 and PB−6 decreases by 44% and 58%, respectively, compared to PB−4. The increase of the D/d ratio also improves the heat transfer coefficient, yet the large-sized fluid channel inside PB−6 severely affects the heat transfer efficiency at a relatively high inlet velocity (0.8 m/s), resulting in a slightly lower heat transfer coefficient of PB−6 than that of PB−5.
(2) Randomly packed beds are divided into near-wall and core regions along the radial direction, based on their packing structure and flow characteristics, with the boundary between these regions occurring at 0.5dp from the wall. The wall effect significantly impacts the flow and temperature distribution in the packed bed, causing notable velocity and temperature oscillations in the near-wall region. In the near-wall region, the average temperature is lower than in the core region and the axial temperature profile exhibits more intense oscillations.
(3) Axial porosity exhibits severe oscillations in the first zone (from the bed base to twice the particle diameter). This is followed by the second zone, where these oscillations decrease to about one-third of the first zone, with a slight increase near the top of the packing region. The third zone, within one particle diameter from the top layer, exhibits a sharp increase in porosity. Furthermore, the axial local Nusselt number (Nu) not only exhibits an inverse relationship with the axial porosity distribution, but also matches its amplitude fluctuations.
These findings underscore the nuanced interplay between the structural features, flow, and heat transfer characteristics of hydrogen fluid within packed beds, which are critical for optimizing industrial applications such as hydrogen storage and hydrogen utilization.
Author Contributions
Methodology, Y.X.; software, Q.Z.; validation, Q.Z.; writing—original draft preparation, Q.Z.; writing—review and editing, Y.X. and Q.Z.; visualization, Q.Z.; supervision, Y.X., Z.C. and X.Q.; project administration, Y.X.; funding acquisition, Y.X. All authors have read and agreed to the published version of the manuscript.
Funding
This study was supported by the National Natural Science Foundation of China (Grant No. 51406123), the Key Project of Anhui Provincial University Research and Development (CN) (Grant No. 2023AH050188), and the University Synergy Innovation Program of Anhui Province (Grant No. GXXT-2022-017).
Data Availability Statement
The original/processed data required to reproduce these findings cannot be shared at this time as the data also forms part of an ongoing study.
Conflicts of Interest
The authors declare that they have no known competing financial interests or personal relationships that could have appeared to influence the work reported in this paper.
Nomenclature
| cp | specific heat at constant pressure (J/(kg∙K)) | Tf | fluid temperature (K) |
| Tin | inlet temperature (K) | ||
| D | tube diameter (mm) | Tout | outlet temperature (K) |
| db | bridge column diameter (mm) | Tp | particle surface temperature (K) |
| dh | hydraulic diameter (mm) | Greek symbols | |
| dp | particle diameter (mm) | ε | porosity |
| f | friction factor | λ | thermal conductivity (W/(m∙K)) |
| L1 | length of entrance region (mm) | μ | viscosity (kg/m·s) |
| L2 | length of packing region (mm) | ρ | density (kg/m3) |
| L3 | length of outlet region (mm) | Abbreviations | |
| Nu | Nusselt number | PB−4 | packed bed with a tube-to-particle diameter ratio of 4 |
| Pr | Prandtl number | PB−5 | packed bed with a tube-to-particle diameter ratio of 5 |
| R | radius of tube (mm) | PB−6 | packed bed with a tube-to-particle diameter ratio of 6 |
| Re | Reynolds number | Subscripts | |
| Rep | pore Reynolds number | b | bridge |
| r | radial coordinate (mm) | r | radial |
References
- Zhang, Z.Y.; Dong, Y.J.; Li, F.; Zhang, Z.M.; Wang, H.T.; Huang, X.J.; Li, H.; Liu, B.; Wu, X.X.; Wang, H.; et al. The Shandong Shidao bay 200 mwe high-temperature gas-cooled reactor pebble-bed module (HTR-PM) demonstration power plant: An engineering and technological innovation. Engineering 2016, 2, 112–118. [Google Scholar] [CrossRef]
- Huang, R.; Cheng, L.; Qiu, K.; Zheng, C.; Luo, Z. Low-calorific gas combustion in a two-layer porous burner. Energy Fuels 2016, 30, 1364–1374. [Google Scholar] [CrossRef]
- Zhang, B.; Dai, H.; Dai, H.; Wang, Z. Inhomogeneous packed bed burner for improving the utilization of low-concentration methane. Environ. Prog. Sustain. 2022, 41, e13921. [Google Scholar] [CrossRef]
- Kumar, A.; Saha, S.K. Performance analysis of a packed bed latent heat thermal energy storage with cylindrical-shaped encapsulation. Int. J. Energy. Res. 2021, 45, 13130–13148. [Google Scholar] [CrossRef]
- Guo, W.; He, Z.; Meng, Z.; Zhang, P. A comprehensive investigation of the mathematical models for a packed bed latent heat thermal energy storage system. Int. J. Energy. Res. 2021, 45, 15005–15021. [Google Scholar] [CrossRef]
- Berrhazi, S.; Ouammi, A.; Benchrifa, R. Thermo-physical effect of solid filler on the performance of a packed-bed thermal storage. Therm. Sci. Eng. Prog. 2020, 20, 100716. [Google Scholar] [CrossRef]
- Agalit, H.; Zari, N.; Maalmi, M.; Maaroufi, M. Numerical investigations of high temperature packed bed TES systems used in hybrid solar tower power plants. Sol. Energy 2015, 122, 603–616. [Google Scholar] [CrossRef]
- Jurtz, N.; Kraume, M.; Wehinger, G.D. Advances in fixed-bed reactor modeling using particle-resolved computational fluid dynamics (CFD). Rev. Chem. Eng. 2019, 35, 139–190. [Google Scholar] [CrossRef]
- Wehinger, G.D.; Flaischlen, S. Computational fluid dynamics modeling of radiation in a steam methane reforming fixed-bed reactor. Ind. Eng. Chem. Res. 2019, 58, 14410–14423. [Google Scholar] [CrossRef]
- Thaker, A.H.; Karthik, G.M.; Buwa, V.V. PIV measurements and CFD simulations of the particle-scale flow distribution in a packed bed. Chem. Eng. J. 2019, 374, 189–200. [Google Scholar] [CrossRef]
- Theuerkauf, J.; Witt, P.; Schwesig, D. Analysis of particle porosity distribution in fixed beds using the discrete element method. Powder Technol. 2006, 165, 92–99. [Google Scholar] [CrossRef]
- Wu, Y.; Hou, Q.; Yu, A. Pore-scale study of fluid flow and drag force in randomly packed beds of different porosities. Ind. Eng. Chem. Res. 2019, 58, 5041–5053. [Google Scholar] [CrossRef]
- Afgan, I.; Kahil, Y.; Benhamadouche, S.; Ali, M.; Alkaabi, A.; Sofiane Berrouk, A.; Sagaut, P. Cross flow over two heated cylinders in tandem arrangements at subcritical Reynolds number using large eddy simulations. Int. J. Heat. Fluid. Flow. 2023, 100, 109115. [Google Scholar] [CrossRef]
- Wu, J.; Li, L.; Yin, Z.; Li, Z.; Wang, T.; Tan, Y.; Tan, D. Mass transfer mechanism of multiphase shear flows and interphase optimization solving method. Energy 2024, 292, 130475. [Google Scholar] [CrossRef]
- Ge, M.; Zheng, G. Fluid–Solid Mixing Transfer Mechanism and Flow Patterns of the Double-Layered Impeller Stirring Tank by the CFD-DEM Method. Energies 2024, 17, 1513. [Google Scholar] [CrossRef]
- Wijesooriya, K.; Mohotti, D.; Lee, C.-K.; Mendis, P. A technical review of computational fluid dynamics (CFD) applications on wind design of tall buildings and structures: Past, present and future. J. Build. Eng. 2023, 74, 106828. [Google Scholar] [CrossRef]
- Calis, H.P.A.; Nijenhuis, J.; Paikert, B.C.; Dautzenberg, F.M.; van den Bleek, C.M. CFD modelling and experimental validation of pressure drop and flow profile in a novel structured catalytic reactor packing. Chem. Eng. Sci. 2001, 56, 1713–1720. [Google Scholar] [CrossRef]
- Guardo, A.; Coussirat, M.; Larrayoz, M.A.; Recasens, F.; Egusquiza, E. CFD flow and heat transfer in nonregular packings for fixed bed equipment design. Ind. Eng. Chem. Res. 2004, 43, 7049–7056. [Google Scholar] [CrossRef]
- Kuroki, M.; Ookawara, S.; Street, D.; Ogawa, K. High-fidelity CFD modeling of particle-to-fluid heat transfer in packed bed reactors. In Proceedings of the European Congress of Chemical Engineering (ECCE-6), Copenhagen, Denmark, 16–20 September 2007; pp. 16–21. [Google Scholar]
- Eppinger, T.; Seidler, K.; Kraume, M. DEM-CFD simulations of fixed bed reactors with small tube to particle diameter ratios. Chem. Eng. J. 2011, 166, 324–331. [Google Scholar] [CrossRef]
- Dixon, A.G.; Nijemeisland, M.; Stitt, E.H. Systematic mesh development for 3D CFD simulation of fixed beds: Contact points study. Comput. Chem. Eng. 2013, 48, 135–153. [Google Scholar] [CrossRef]
- Bu, S.S.; Yang, J.; Zhou, M.; Li, S.Y.; Wang, Q.W.; Guo, Z.X. On contact point modifications for forced convective heat transfer analysis in a structured packed bed of spheres. Nucl. Eng. Des. 2014, 270, 21–33. [Google Scholar] [CrossRef]
- Fernengel, J.; Hinrichsen, O. Influence of material properties on voidage of numerically generated random packed beds. Chem. Eng. Sci. 2021, 233, 116406. [Google Scholar] [CrossRef]
- Dong, Y.; Sosna, B.; Korup, O.; Rosowski, F.; Horn, R. Investigation of radial heat transfer in a fixed-bed reactor: CFD simulations and profile measurements. Chem. Eng. J. 2017, 317, 204–214. [Google Scholar] [CrossRef]
- Guo, Z.; Sun, Z.; Zhang, N.; Ding, M.; Zhou, Y. Influence of flow guiding conduit on pressure drop and convective heat transfer in packed beds. Int. J. Heat Mass Transf. 2019, 134, 489–502. [Google Scholar] [CrossRef]
- Liu, H.B.; Zhao, C.Y. Effect of radial porosity oscillation on the thermal performance of packed bed latent heat storage. Engineering 2021, 7, 515–525. [Google Scholar] [CrossRef]
- Cohen, Y.; Metzner, A.B. Wall effects in laminar flow of fluids through packed beds. AIChE J. 1981, 27, 705–715. [Google Scholar] [CrossRef]
- Yang, J.; Wu, J.; Zhou, L.; Wang, Q. Computational study of fluid flow and heat transfer in composite packed beds of spheres with low tube to particle diameter ratio. Nucl. Eng. Des. 2016, 300, 85–96. [Google Scholar] [CrossRef]
- Cheng, L.-C.; Wong, S.-C. Pore-scale numerical simulation and LTNE analysis for fully-developed forced convective heat transfer in packed beds of mono-sized rough spheres covering near-wall and core regions. Int. J. Heat Mass Transf. 2023, 208, 124047. [Google Scholar] [CrossRef]
- Guo, X.; Dai, R. Numerical simulation of flow and heat transfer in a random packed bed. Particuology 2010, 8, 293–299. [Google Scholar] [CrossRef]
- Jadidi, M.; Param, H.K.; Revell, A.; Mahmoudi, Y. Large eddy simulations of turbulent heat transfer in packed bed energy storage systems. J. Energy Storage 2023, 59, 106449. [Google Scholar] [CrossRef]
- Liu, L.; Deng, J.; Zhang, D.; Wang, C.; Qiu, S.; Su, G.H. Experimental analysis of flow and convective heat transfer in the water-cooled packed pebble bed nuclear reactor core. Prog. Nucl. Energy 2020, 122, 103298. [Google Scholar] [CrossRef]
- Zhang, S.; Zhao, L.; Zhang, M.; Feng, J.; Dong, H. Experimental investigation of flow and exergy transfer characteristics in the air-cooled randomly packed particle bed based on second law analysis. Int. J. Heat Mass Transf. 2022, 185, 122360. [Google Scholar] [CrossRef]
- Al-Hasan, M.; Al-Odat, M.Q.; Al-Busoul, M. An experimental investigation of forced convection heat transfer from a coiled heat exchanger embedded in a packed bed. Exp. Heat Transf. 2012, 25, 363–376. [Google Scholar] [CrossRef]
- Wu, Z.; Wu, Y.; Wang, C.; Tang, S.; Liu, D.; Qiu, S.; Su, G.H.; Tian, W. Experimental and numerical study on helium flow characteristics in randomly packed pebble bed. Ann. Nucl. Energy 2019, 128, 268–277. [Google Scholar] [CrossRef]
- Dawood, F.; Anda, M.; Shafiullah, G.M. Hydrogen production for energy: An overview. Int. J. Hydrog. Energy 2020, 45, 3847–3869. [Google Scholar] [CrossRef]
- Griffiths, S.; Sovacool, B.K.; Kim, J.; Bazilian, M.; Uratani, J.M. Industrial decarbonization via hydrogen: A critical and systematic review of developments, socio-technical systems and policy options. Energy Res. Soc. Sci. 2021, 80, 102208. [Google Scholar] [CrossRef]
- Ma, Y.; Wang, X.R.; Li, T.; Zhang, J.; Gao, J.; Sun, Z.Y. Hydrogen and ethanol: Production, storage, and transportation. Int. J. Hydrog. Energy 2021, 46, 27330–27348. [Google Scholar] [CrossRef]
- Gibreel, M.; Zhang, X.; Elmouazen, H. Enhancement of heat transfer and hydrogen fuel flow characteristics in a wavy cooling channel with secondary branch design. Int. J. Therm. Sci. 2023, 193, 108513. [Google Scholar] [CrossRef]
- Sakamoto, Y.; Kobayashi, H.; Naruo, Y.; Takesaki, Y.; Sato, T. Investigation of boiling hydrogen heat transfer characteristics under low-pressure conditions. Cryogenics 2023, 131, 103652. [Google Scholar] [CrossRef]
- Tong, J.; Fu, W.; Yang, W.; Wang, S.; Shen, F.; Zhou, B.; Lin, L.; Yu, C.; Zheng, H.; Yao, C.; et al. Numerical simulation of heat transfer characteristics of supercritical liquid hydrogen through triangular U-tube in moderator. Cryogenics 2023, 132, 103698. [Google Scholar] [CrossRef]
- Huber, M.L.; Lemmon, E.W.; Bell, I.H.; McLinden, M.O. The NIST REFPROP Database for highly accurate properties of industrially important fluids. Ind. Eng. Chem. Res. 2022, 61, 15449–15472. [Google Scholar] [CrossRef] [PubMed]
- Fang, Y.; Yu, Q.; Wang, C.; Tian, W.; Su, G.; Qiu, S. Heat transfer of hydrogen with variable properties in a heated tube. Int. J. Heat Mass Transf. 2023, 209, 124128. [Google Scholar] [CrossRef]
- Johnson, K.L. Contact Mechanics; Cambridge University Press: Cambridge, UK, 1987. [Google Scholar]
- Dixon, A.G.; Walls, G.; Stanness, H.; Nijemeisland, M.; Stitt, E.H. Experimental validation of high Reynolds number CFD simulations of heat transfer in a pilot-scale fixed bed tube. Chem. Eng. J. 2012, 200–202, 344–356. [Google Scholar] [CrossRef]
- Bear, J.; Corapcioglu, M.Y. Fundamentals of Transport Phenomena in Porous Media; Springer Science & Business Media: Boston, MA, USA, 1984; Volume 82, pp. 201–258. [Google Scholar]
- Hassanpouryouzband, A.; Joonaki, E.; Edlmann, K.; Heinemann, N.; Yang, J. Thermodynamic and transport properties of hydrogen containing streams. Sci. Data 2020, 7, 222. [Google Scholar] [CrossRef] [PubMed]
- Lemmon, E.W.; Bell, I.H.; Huber, M.L.; McLinden, M.O. NIST Standard Reference Database 23: Reference Fluid Thermodynamic and Transport Properties-REFPROP, Version 10.0; National Institute of Standards and Technology, Standard Reference Data Program: Gaithersburg, MD, USA, 2018. [Google Scholar] [CrossRef]
- Romkes, S.J.P.; Dautzenberg, F.M.; van den Bleek, C.M.; Calis, H.P.A. CFD modelling and experimental validation of particle-to-fluid mass and heat transfer in a packed bed at very low channel to particle diameter ratio. Chem. Eng. J. 2003, 96, 3–13. [Google Scholar] [CrossRef]
- Mueller, G.E. Radial void fraction distributions in randomly packed fixed beds of uniformly sized spheres in cylindrical containers. Powder Technol. 1992, 72, 269–275. [Google Scholar] [CrossRef]
- de Klerk, A. Voidage variation in packed beds at small column to particle diameter ratio. AIChE J. 2003, 49, 2022–2029. [Google Scholar] [CrossRef]
- Wakao, N.; Kaguei, S.; Funazkri, T. Effect of fluid dispersion coefficients on particle-to-fluid heat transfer coefficients in packed beds. Chem. Eng. Sci. 1979, 34, 325–336. [Google Scholar] [CrossRef]
- Tavassoli, H.; Kriebitzsch, S.H.L.; van der Hoef, M.A.; Peters, E.A.J.F.; Kuipers, J.A.M. Direct numerical simulation of particulate flow with heat transfer. Int. J. Multiph. Flow 2013, 57, 29–37. [Google Scholar] [CrossRef]
- Chen, Y.; Müller, C.R. Lattice Boltzmann simulation of gas-solid heat transfer in random assemblies of spheres: The effect of solids volume fraction on the average Nusselt number for Re ≤ 100. Chem Eng J. 2019, 361, 1392–1399. [Google Scholar] [CrossRef]
- Sun, B.; Tenneti, S.; Subramaniam, S. Modeling average gas–solid heat transfer using particle-resolved direct numerical simulation. Int. J. Heat Mass Transf. 2015, 86, 898–913. [Google Scholar] [CrossRef]
- Foumeny, E.A.; Benyahia, F.; Castro, J.A.A.; Moallemi, H.A.; Roshani, S. Correlations of pressure drop in packed beds taking into account the effect of confining wall. Int. J. Heat Mass Transf. 1993, 36, 536–540. [Google Scholar] [CrossRef]
- Carman, P.C. Fluid flow through granular beds. Chem. Eng. Res. Des. 1997, 75, S32–S48. [Google Scholar] [CrossRef]
- Ergun, S. Fluid flow through packed columns. Chem. Eng. Prog. 1952, 48, 89. [Google Scholar]
- Harrison, L.D.; Brunner, K.M.; Hecker, W.C. A combined packed-bed friction factor equation: Extension to higher reynolds number with wall effects. AIChE J. 2013, 59, 703–706. [Google Scholar] [CrossRef]
- Ranz, W. Evaporation from drops: Part II. Chem. Eng. Prog. 1952, 48, 173–180. [Google Scholar]
- Gunn, D.J. Transfer of heat or mass to particles in fixed and fluidised beds. Int. J. Heat Mass Transfer. 1978, 21, 467–476. [Google Scholar] [CrossRef]
Figure 1.
Schematic of packed beds with varied D/d ratios.

Figure 2.
Meshing scheme: Red dashline for the local zoom of typical mesh.

Figure 3.
Mesh independence validation.

Figure 4.
Comparison between simulation results and empirical correlations from Mueller [50] and de Klerk [51] on radial porosity distribution: (a) PB−4; (b) PB−5; (c) PB−6.


Figure 6.
Friction factors of three packed beds with literature results from Ergun [58], Carman [57], Harrison et al. [59], Foumeny et al. [56]: (a) PB−4; (b) PB−5; (c) PB−6.

Figure 7.
Local velocity and temperature distribution in three packed beds: (a) velocity distribution; (b) temperature distribution.
Figure 7.
Local velocity and temperature distribution in three packed beds: (a) velocity distribution; (b) temperature distribution.

Figure 8.
Axial porosity and velocity distribution in three packed beds: (a) PB−4; (b) PB−5; (c) PB−6.
Figure 8.
Axial porosity and velocity distribution in three packed beds: (a) PB−4; (b) PB−5; (c) PB−6.

Figure 9.
Axial distribution of temperature in three packed beds: (a) PB−4; (b) PB−5; (c) PB−6.

Figure 10.
Radial temperature distribution at different heights: (a) PB−4; (b) PB−5; (c) PB−6.


Figure 11.
The near-wall region and the core region: (a) PB−4; (b) PB−5; (c) PB−6.
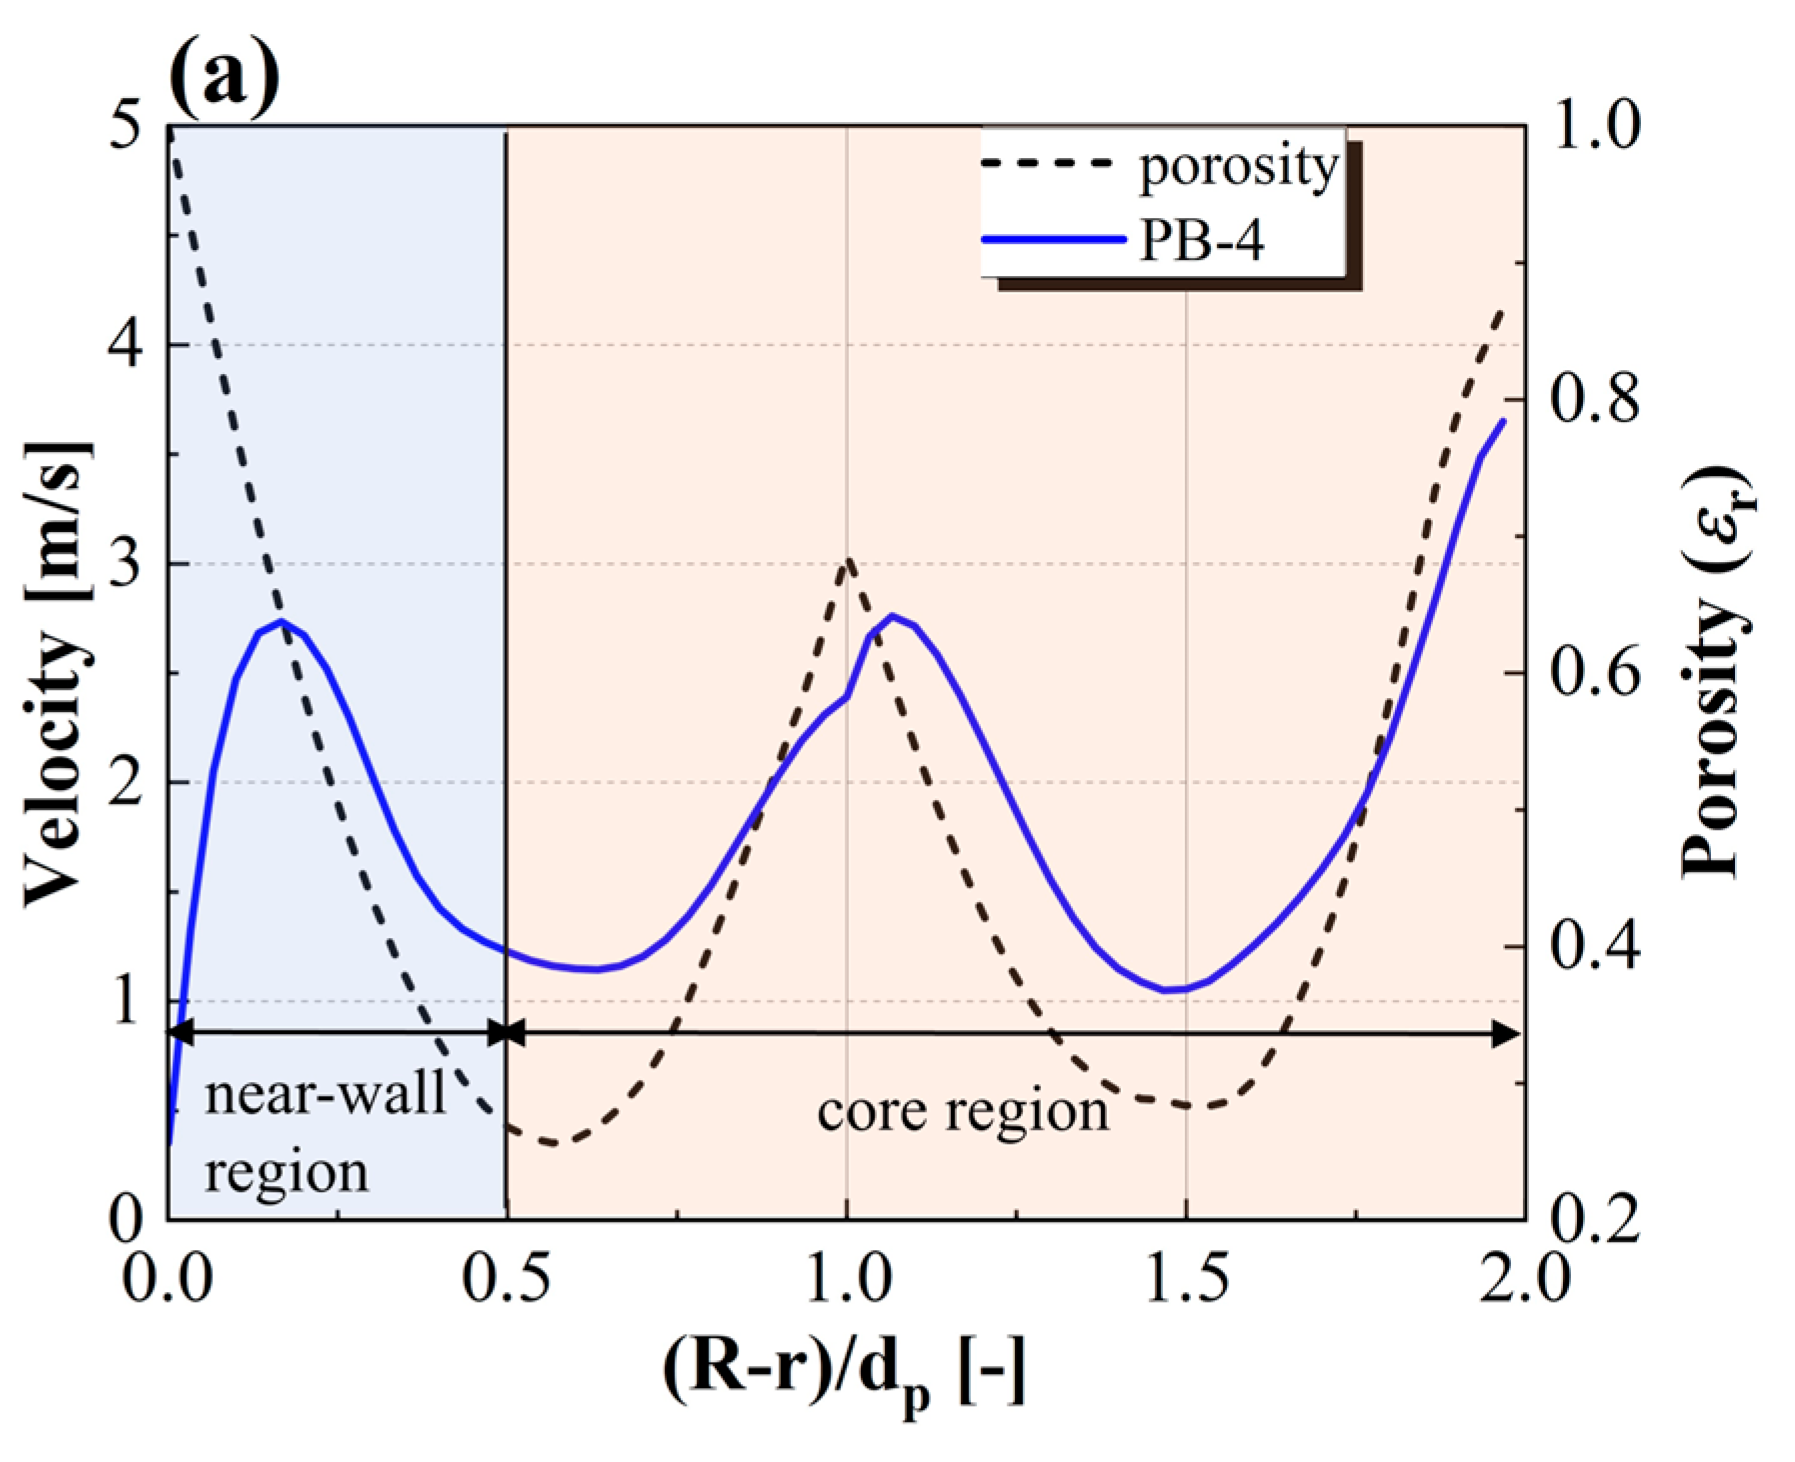

Figure 12.
Axial temperature distribution in the near-wall region and the core region: (a) PB−4; (b) PB−5; (c) PB−6.
Figure 12.
Axial temperature distribution in the near-wall region and the core region: (a) PB−4; (b) PB−5; (c) PB−6.

Figure 13.
High speed fluid channel inside the packed bed: (a) PB−4; (b) PB−6.

Figure 15.
Comparison of heat transfer coefficients for three packed beds at different inlet velocities.
Figure 15.
Comparison of heat transfer coefficients for three packed beds at different inlet velocities.


Table 1.
Particle properties used for simulation.
| Property | Unit | Value |
|---|---|---|
| Particle diameter | m | 0.0005, 0.006, 0.0075 |
| Poisson ratio | - | 0.24 |
| Density | kg/m3 | 3750 |
| Shear Modulus | pa | 1.37E9 |
| Coefficient of Restitution | - | 0.5 |
| Coefficient of Static Friction | - | 0.154 |
| Coefficient of Rolling Friction | - | 0.1 |
| Specific heat at constant | J/(kg∙K) | 780 |
| Thermal conductivity | W/(m·K) | 30 |
Disclaimer/Publisher’s Note: The statements, opinions and data contained in all publications are solely those of the individual author(s) and contributor(s) and not of MDPI and/or the editor(s). MDPI and/or the editor(s) disclaim responsibility for any injury to people or property resulting from any ideas, methods, instructions or products referred to in the content. |
© 2024 by the authors. Licensee MDPI, Basel, Switzerland. This article is an open access article distributed under the terms and conditions of the Creative Commons Attribution (CC BY) license (https://creativecommons.org/licenses/by/4.0/).
Share and Cite
MDPI and ACS Style
Zhang, Q.; Xia, Y.; Cheng, Z.; Quan, X. DEM-CFD Simulation Analysis of Heat Transfer Characteristics for Hydrogen Flow in Randomly Packed Beds. Energies 2024, 17, 2226. https://doi.org/10.3390/en17092226
AMA Style
Zhang Q, Xia Y, Cheng Z, Quan X. DEM-CFD Simulation Analysis of Heat Transfer Characteristics for Hydrogen Flow in Randomly Packed Beds. Energies. 2024; 17(9):2226. https://doi.org/10.3390/en17092226
Chicago/Turabian StyleZhang, Quanchen, Yongfang Xia, Zude Cheng, and Xin Quan. 2024. "DEM-CFD Simulation Analysis of Heat Transfer Characteristics for Hydrogen Flow in Randomly Packed Beds" Energies 17, no. 9: 2226. https://doi.org/10.3390/en17092226
Note that from the first issue of 2016, this journal uses article numbers instead of page numbers. See further details here.