


Assessment of the Susceptibility of Urban Flooding Using GIS with an Analytical Hierarchy Process in Hanoi, Vietnam

1
Faculty of Environmental Engineering, The University of Kitakyushu, Kitakyushu 8080135, Japan
2
Faculty of Political Economy, Academy of Journalism and Communication, Hanoi 11300, Vietnam
*
Author to whom correspondence should be addressed.
Sustainability 2024, 16(10), 3934; https://doi.org/10.3390/su16103934
Submission received: 16 February 2024
/
Revised: 30 April 2024
/
Accepted: 6 May 2024
/
Published: 8 May 2024
(This article belongs to the Special Issue Climate Change Adaptation and Disaster Risk Assessments)
Abstract
:The incidence of floods is rapidly increasing globally, causing significant property damage and human losses. Moreover, Vietnam ranks as one of the top five countries most severely affected by climate change, with 1/3 of residents facing flood risks. This study presents a model to identify flood susceptibility using the analytic hierarchy process (AHP) in the GIS environment for Hanoi, Vietnam. Nine flood-conditioning factors were selected and used as initial data. The AHP analysis was utilized to determine the priority levels of these factors concerning flood susceptibility and to assess the consistency of the obtained results to develop a flood-susceptibility map. The performance of the model was found to be significant based on the AUC value for the obtained receiver operating characteristic (ROC) curve. The flood-susceptibility map has five levels of flood susceptibility: the area with a very high susceptibility to flooding accounts for less than 1% of the map, high- susceptibility areas for nearly 11%, moderate-susceptibility areas for more than 65%, low- susceptibility areas for about 22%, and very low-susceptibility areas for 2%. Most of Hanoi has a moderate level of flood susceptibility, which is expected to increase with urban expansion due to the impacts of urbanization. Our findings will be valuable for future research involving urban planners, and disaster management authorities and will enable them to make informed decisions aimed at reducing the impact of urban flooding and enhancing the resilience of urban communities.
1. Introduction
Flooding is the most common form of natural disaster and has serious consequences globally [1,2]. The frequency and duration of floods are increasing, with floods having quadrupled in tropical regions from 1985 to 2015 [3]. Moreover, the estimated risk of floods escalated by 20 to 24% during the period from 2000 to 2018 [4]. In addition, between 1970 and 2019, floods accounted for 44% of all documented natural disasters and were the cause of 31% of the total economic losses [5] (pp. 16–21), with 1298 major flood incidents recorded worldwide between the years 2010 and 2019 alone [6] (pp. 50–55). Many previous studies have shown that heavy rainfall is not the only significant factor that influences flooding; other factors such as unplanned urban growth [7], the ecological environment [8], changes in land use/land cover [9], inadequate drainage infrastructure [10], and green infrastructure management [11] also play crucial roles. Harsh weather conditions resulting from the impact of local climate change and various uncontrolled anthropogenic activities such as urbanization and population growth have become additional primary causes of flood disasters [2,12].
Flood disasters are almost inevitable, and there are few ways to prevent or mitigate the losses caused by flooding. However, by raising awareness of the risks, developing early warning plans [13], evaluating hazardous situations [14], and assessing prediction, control, and monitoring capabilities [15], future risks and damages can be reduced. Traditional research on water-related disasters is often limited in its approach and resolution, mainly focusing on imminent threats and recovery after floods [6]. In recent years, the development of flood susceptibility and risk forecasting models has become a crucial strategy for devising appropriate adaptation pathways, minimizing human and property losses, and fostering sustainable urban development. However, there are numerous challenges in the process of effective flood model construction as there are many complex factors to consider [2,16,17].
To address complex urban issues related to the susceptibility and risk of urban ecosystems to natural disasters and to develop effective models, researchers have used various methods, such as numerical modeling, statistical analysis, geographic information systems, machine learning and artificial intelligence, field measurements, and forecasting modeling. For example, Siam Alam et al. utilized the storm water management model (SWMM) to design urban drainage systems for urban flood mitigation [18]; Latt, Z.Z. et al. compared stepwise multiple linear regression and artificial neural networks to improve flood forecasting in a developing country [19]; Xiao. T. and colleagues, Liu, L.L. et al. explained and assessed the susceptibility to landslides using different machine learning classification methods [20,21] while Trošelj, J. et al. researched methods to accurately predict flash floods in real time to develop early warning systems [22]. Recently, Guan, F. modeled and resolved complex urban characteristics by analyzing images, urban structures, and semantic dimensions [23]. These research methods have been applied in assessing susceptibility and risk as well as informing effective mitigation strategies for urban development.
In addition, the utilized multi-criteria decision support system methods combined with geographic information system (GIS) applications have also been used by many researchers to manage and analyze the large amounts of data necessary [24]. The analytic hierarchy process (AHP) [25] is a widely used method to optimize decision-making and compare complex factors within a set [24]. It has been demonstrated to be successful in numerous studies, including those related to disaster prediction, flood-susceptibility assessment, and risk management. For instance, L. Chinh and colleagues employed the GIS and AHP, among other techniques, to construct a flood risk assessment framework in Quang Binh, Vietnam [26]. They utilized historical flood mark data and high-resolution digital elevation models to delineate flood inundation. Similarly, Chen and colleagues applied a comparable approach to delineate flood-prone areas for two cities in Taiwan in 2011 [27]. The AHP was also used to allocate weights to seven factors related to flood risk in Greece in 2015 [28]. The AHP is predominantly utilized to ascertain the relative weights of flood-sensitive factors, with the selection of influencing factors dependent on the area’s location, survey methodologies, and the researcher’s evaluations.
With global climate warming [29], urbanization [24], and greenhouse gas emissions [30,31], both the intensity and frequency of floods are expected to increase. Climate change is forecasted to elevate sea levels along with the frequency and severity of floods in Southeast Asia and around the world [32,33]. Given the concentration of population and economic assets in vulnerable areas, Vietnam ranks among the top five countries most severely affected by climate change [34,35], with one-third of its population currently exposed to flood risks [36]. Rapid urbanization in Vietnam is exacerbating environmental issues in urban settings, which is compounded by the growing unpredictability of extreme weather events [37]. Hanoi, one of the largest and most densely populated cities in Vietnam, has witnessed increasingly intricate and challenging urban flooding in recent years [38,39]. There have been several studies utilizing various methods and approaches to urban flooding in Hanoi. Among them, Luo and colleagues presented a calibrated flood model using reference images to assess the impact of four extreme rainfall events on water depth and flooded areas in downtown Hanoi [40]. An assessment of future tangible flood damage in the urban basin of the To Lich River, Hanoi, was conducted by Kefi and colleagues using spatial analysis methods and the integration of multiple datasets related to flooding [41]. Additionally, Nguyen Hieu and colleagues assessed the status of historical flooding events that occurred at the end of 2008 through satellite image analysis, the GIS, and terrain characteristics [42]. Recently, Loi assessed vulnerability to flooding using the AHP based on pre-event characteristics in the Hoan Kiem district, Hanoi [43]. Each study has its strengths and limitations, but collectively, they enhance our awareness and understanding of the damage caused by urban flooding in Hanoi.
Utilizing a multi-criteria approach, in this study, we crafted a flood-susceptibility map tailored to Hanoi city to bolster flood-warning initiatives and enrich overall assessment frameworks. In doing so, we hope to aid in the development of flood-mitigation strategies for urban development planning in the region. In this study, we identified nine criteria related to the local context. Moreover, based on consultation with six experts, we incorporated the AHP and GIS methodologies to assess flood susceptibility. In addition to natural elements such as elevation and precipitation, the research also scrutinizes anthropogenic factors such as land usage and proximity to roadways, which are recognized as pivotal contributors to urban inundation [44]. Receiver operating characteristic (ROC) curves and historical flood data were employed to evaluate the model efficacy and validate its outcomes.
2. Study Area
Hanoi, located between latitude 20°34′ to 21°18′ N and longitude 105°17′ to 106°02′ E, is Vietnam’s largest centrally administered city, spanning an area of 3359.82 square kilometers and hosting a population of 8.4 million people (Figure 1a). It ranks as the nation’s second most populous urban center and has the second highest population density, albeit with an uneven demographic distribution. The majority of residents live in the 12 central districts, while those in the 17 suburban districts are predominantly engaged in agricultural pursuits. Geographically, Hanoi’s terrain gradually descends from north to south and from west to east, mirroring the natural flow patterns of its principal rivers (Figure 1b). The city can be divided into two regions: low and fairly flat plains, accounting for most of the city area, and mountainous areas concentrated in the northern and western suburbs of Hanoi. The city is located in a typical hot and humid monsoon climate zone, where temperatures increase from April to June, while substantial rainfall occurs from June to September (Figure 2), leading to frequent flooding [45]. The average annual precipitation is 1760 mm, with an average of around 114 rainy days per year [39].
Hanoi is characterized by an abundance of lakes and rivers. The prominent Red River is particularly noteworthy, spanning 1183 km and originating from China through the Gulf of Tonkin. Many areas within Hanoi’s historic core, including the Ba Dinh, Dong Da, Hai Ba Trung, and Hoan Kiem districts, exhibit notably lower elevations than the average level of the Red River [46]. Rapid urbanization since 1990 has led to a significant deterioration in the quality of Hanoi’s lakes and rivers, with many now experiencing severe pollution. Flooding frequently occurs in various parts of the city during the rainy season, which is typically from May to October. For instance, in the extensive flooding in Hanoi in 2008, there were at least 92 deaths [40] and over 55,000 houses were damaged, with further significant property damage and 40,000 people being displaced [47]. In recent years, urbanization and city expansion coupled with climate change have led to more frequent flooding in Hanoi, increasing concern among residents during the rainy season.
3. Materials and Methods
3.1. Data Preparation
After systematically reviewing various sources, including field observations, group discussions, literature reviews, and data from government agencies and expert opinions, we selected and established nine relevant susceptibility factors for the Hanoi area: topographic wetness index (TWI), elevation, slope, land use/land cover (LULC), normalized difference vegetation index (NDVI), precipitation, distance from roads, distance from streams, and drainage density. The initial flood-susceptibility data for the research area were selected and the feasibility of data collection was carefully assessed based on recommendations from previous studies (Table A1 in Appendix A) [48,49,50,51]. Subsequently, these data were cleaned and preprocessed ready for analysis. This involved format conversion, error checking and adjustment, and the creation of usable data layers for the analysis. These factors were subsequently characterized based on field surveys and long-term flood records in Hanoi and processed within a GIS framework. A digital elevation model (DEM) and 30-m resolution Shuttle Radar Topography Mission (SRTM) data were employed for mapping terrain factors. Indices for vegetation, water, and land use were derived from Landsat 8 imagery obtained from the United States Geological Survey (USGS). Annual average precipitation data were obtained from the high-resolution gridded datasets provided by the Climatic Research Unit (CRU). Further details regarding data sources are shown in Table 1.
3.1.1. Flood Inventory Mapping
Detailed flood inventory mapping, involving a database of historical flood events in an area, is crucial for mapping flood susceptibility [52]. The quality of historical flood data determines the accuracy of the predictions regarding flood occurrence in the research area [51]. Over the past decades, the scarcity of flood data has been addressed through remote sensing and explored in the field of citizen science. The importance of citizen contributions in data augmentation of integrated modeling technologies has been demonstrated [53]. Based on the available data from annual flood reports and studies on flooding in Hanoi, our inventory map was constructed with 148 flood points (Figure 1c) from the period from 2012 to 2018 [39]. The locations representing flood-affected areas were adjusted, confirmed, and mapped using GPS points collected during field surveys. Flood-related data in this study, such as flood depth, duration, and frequency, were verified in the respective areas through on-site interviews with local residents during the survey.
3.1.2. Flood-Conditioning Factors
In the present study, a pixel-based analysis was conducted to assess the attributes of the used models. The sensitivity factors were resampled into a 30 m × 30 m grid, which was consistent with the size of the available DEM pixels. All vector-format factors were converted into raster format with uniform grid dimensions. All maps of the 9 elements were prepared and converted to the WGS_1984_UTM_Zone 48N coordinate system with a resolution of 30 m × 30 m, ensuring consistency in spatial resolution. The map of the component elements with units was classified into five layers using native Jenks classification in ArcGIS (www.arcgis.com) and manual classification. Through surveys, analyses, literature reviews, and consultation with experts, these five layers were re-ranked into five levels of influence on flood susceptibility (Table 2): 1—very low; 2—low; 3—moderate; 4—high; and 5—very high.
- 1.
- Topographic Wetness Index (TWI)
The TWI, representing spatial moisture variations within an area, is a crucial factor in constructing flood-susceptibility models. It helps to calculate the potential of water permeability in each region [54]. Areas with a high TWI are capable of retaining water and have a higher susceptibility to flooding [55]. The TWI is typically constructed based on information about the slope and flow accumulation of a region, as shown in Equation (1).
where α represents the flow accumulation, indicating the ability to channel water from a point on the map to the main drainage point; β is the slope of each grid cell in the model, calculated using elevation data. In this study, the TWI was computed based on the SRTM DEM map of Hanoi, and five layers of TWI values were considered and ranked. Among them, areas with TWI values greater than 2 had a very high flood susceptibility and values from (−6) to 2 had a high flood susceptibility; TWI values from (−6) to (−13), (−13) to (−16), and less than (−16) ranked as moderate, low, and very low flood susceptibility, respectively. This is depicted in Figure 3a.
- 2.
- Elevation and Slope
Elevation and slope represent two primary factors that influence flood occurrence within any given region [56]. Typically, areas prone to flooding exhibit low surface slopes and are situated at lower elevations, as evidenced by the elevation classifications commonly used in flood-mapping studies [48,57,58]. Regions at lower elevations are more susceptible to flooding due to the ease with which rainfall can flow from higher to lower areas under natural conditions [48]. Hanoi is a city in a flat plain area, with most of its territory lacking significant elevation differences. However, due to the gradual decrease in the terrain height and the influence of dense river and lake networks, surface water tends to flow from north to south. According to the research results, five elevation layers were considered for the flood-susceptibility assessment and were ranked from very low to very high. The areas with elevations of 8 m or lower relative to sea level were considered to have a high and very high flooding susceptibility. The northern area with elevations ranging from 8 to 31 m was assessed as moderate, while areas with elevations above 31 m were considered to have a low and very low flood susceptibility.
A specific slope is defined as the percentage ratio of elevation model variance across different regions; similar gradings have been assigned to the percentage slope in various studies, with higher rankings typically attributed to areas with lower slopes and vice versa [58,59]. Based on the survey results and expert opinions, areas with slopes of 2 degrees or less were classified as having high and very high flood susceptibility. In addition, areas with slopes ranging from 2 to 5 degrees had moderate flood susceptibility, and slopes above 5 degrees had low and very low flood susceptibility. Figure 3b,c illustrate the level of flood susceptibility based on the assessment of elevation and slope distribution.
- 3.
- Precipitation
Figure 3d presents the corresponding flood-susceptibility levels based on the average annual precipitation in the study area. The accumulation of rainfall in an area over a long period can increase the susceptibility to flooding, particularly when groundwater levels cannot drain away quickly enough. The probability of flooding rises with higher levels of rainfall [24]. Being located in a tropical monsoon region, Hanoi receives a significant amount of annual precipitation. This is characterized by heavy downpours and intense rain mainly from June to September during the monsoon season. The total rainfall during the rainy season can account for 80–85% of the total annual rainfall, and the maximum daily rainfall can reach 350 to 400 mm (Vietnam Magazine National Hydrometeorology 2016; vnmha.gov.vn), leading to recurrent flooding. In this study, a precipitation map was generated based on Hanoi’s 2020 weather data. It was classified from low to high values corresponding to very low to very high flooding susceptibility.
- 4.
- Land Use/Land Cover (LULC)
The land use/land cover model is closely linked to the frequent incidence of urban flooding, as it pertains to the infiltration rate in which forested areas allow for greater infiltration than paved surfaces in urbanized regions [60,61]. Urbanized and developed surfaces produce increased runoff and thus experience a reduced capacity for absorption over time. Consequently, they tend to have a higher susceptibility to flooding compared to abandoned land and land with vegetative cover [62]. Using a supervised classification method with various features on the images collected from Google Earth and field surveys, Landsat images from 2023 with a spatial resolution of 30 m were analyzed to generate the LULC map. The resulting map depicted the distribution of five primary land types: agricultural land, vegetation, settlement land, vacant land, and water bodies. Considering that the urbanization process potentially generates more surface runoff compared to vacant land and land with vegetative cover, settlement areas were assigned relatively high weights in this study. Considering expert guidance and the results of field surveys, water bodies and settlement land were identified as having a very high and high level of susceptibility to flooding, respectively. In Hanoi, agricultural land in suburban zones covers a significant area. Despite their susceptibility to flooding, these agricultural production areas drain more effectively than settlement areas. Vacant land and vegetation were assessed as being areas with a low and very low susceptibility to flooding, respectively (Figure 3e).
- 5.
- Normalized difference vegetation index (NDVI)
The NDVI, which is widely used to identify flood events [63,64], is a coefficient for assessing vegetation health and density. Vegetative cover plays a crucial role in mitigating flood susceptibility by interrupting water flow, increasing delay times, and reducing flood hazards, whereas deforested areas can intensify water force and soil erosion, consequently elevating flood susceptibility [65]. Therefore, areas with lower vegetation indices are prone to higher flood susceptibility compared to those with higher vegetation indices. In the current study, the NDVI was computed using the Landsat 8 dataset represented by Equation (2).
where and are near-infrared bands and red bands, respectively. According to the research results, areas in Hanoi with an NDVI lower than 0.1 are more prone to flooding. Most urban settlement areas in Hanoi have a low NDVI, with very few areas exhibiting an NDVI below 0.01 which represents a very high flood susceptibility. Moreover, areas with an NDVI ranging from 0.1 to 0.2 were considered to have moderate levels of susceptibility. Areas with low and very low flood susceptibility have NDVI values ranging from 0.2 to 0.3 and greater than 0.3, respectively. Figure 3f shows the calculated NDVI of the study area.
- 6.
- Distance from streams
Areas situated near stream networks tend to have a higher susceptibility to flooding compared to those located farther away, largely due to their proximity to the flow path of surface runoff [24]. The relationship between flood susceptibility and distance from the stream network can be somewhat subjective and varies based on the specific conditions of the study area. For instance, Mahmoud and Gan categorized areas within a 200-m radius of streams as highly susceptible to flooding in arid regions in the Middle East, while areas beyond 2000 m were considered less susceptible [24]. Conversely, in Markham, Sa-manta and colleagues suggested that areas at distances of less than 1000 m and 1000–2000 m from a stream network exhibited very high and high flood susceptibility, with those beyond 6000 m showing a low susceptibility [66]. Additionally, in Kathmandu, Chaulagain and colleagues identified areas within a 126-m range from river networks as having a very high flood susceptibility [67]. Numerous studies have shown an inverse relationship between flood susceptibility and distance from stream networks [28,68]. Drawing from historical flood data in Hanoi, areas within a 250-m radius of streams were classified as highly susceptible to flooding, while those at distances of 500, 1000, 10,000, and more than 10,000 m from streams were assessed to have a high, moderate, low, and very low flood susceptibility, respectively (Figure 3g).
- 7.
- Distance from roads
Road construction results in an increase in impermeable surfaces, alters topography, and induces changes in the hydrological patterns in areas near the roads [54]. For flood-susceptibility modeling, proximity to roads serves as a significant regulatory factor, impacting surface-water flow dynamics or accumulation patterns [69,70]. Drawing from historical flood events in Hanoi, areas prone to frequent and severe annual flooding tend to cluster around major intersections or densely populated regions. In this study, areas within 100 m of roads were classified as very highly susceptible to flooding, those within 100–500 m were deemed highly susceptible, while areas located between 1500 m to 5000 m and beyond 5000 m from roads were considered to have low and very low flood susceptibility (Figure 3h).
- 8.
- Drainage density
A drainage density map is created by dividing the total length of all streams in a watershed by the total area it covers [71]. In our study, the drainage density map was generated using GIS density analysis tools. A higher drainage density leads to larger surface-water flows, increasing flood susceptibility, while a lower density indicates lower flood susceptibility [72]. Thus, the expansion of the drainage network is crucial in creating surface-water flows [73], which, in turn, increases the susceptibility to flooding [24]. In this study, the drainage density of Hanoi was divided into five classes. Areas with drainage densities ranging from 0.75 to 1 and greater than 1 were identified as having a high and very high flood susceptibility, respectively. In addition, drainage densities lower than 0.25, ranging from 0.25 to 0.5, and ranging from 0.5 to 0.75 were considered to have a very low, low, and moderate impact on flood susceptibility, respectively. Figure 3i illustrates the drainage density map of the study area.
3.2. Methods
The methodology applied in this study included calculating the flood-susceptibility index (FSI), weighting the conditioning factors for the entire study area, and evaluating them spatially using AHP techniques in the GIS environment. The main objective of this GIS-based multi-criteria decision analysis was to quantify the flood-prone area of Hanoi across five flood-susceptibility zones (very high, high, moderate, low, and very low).
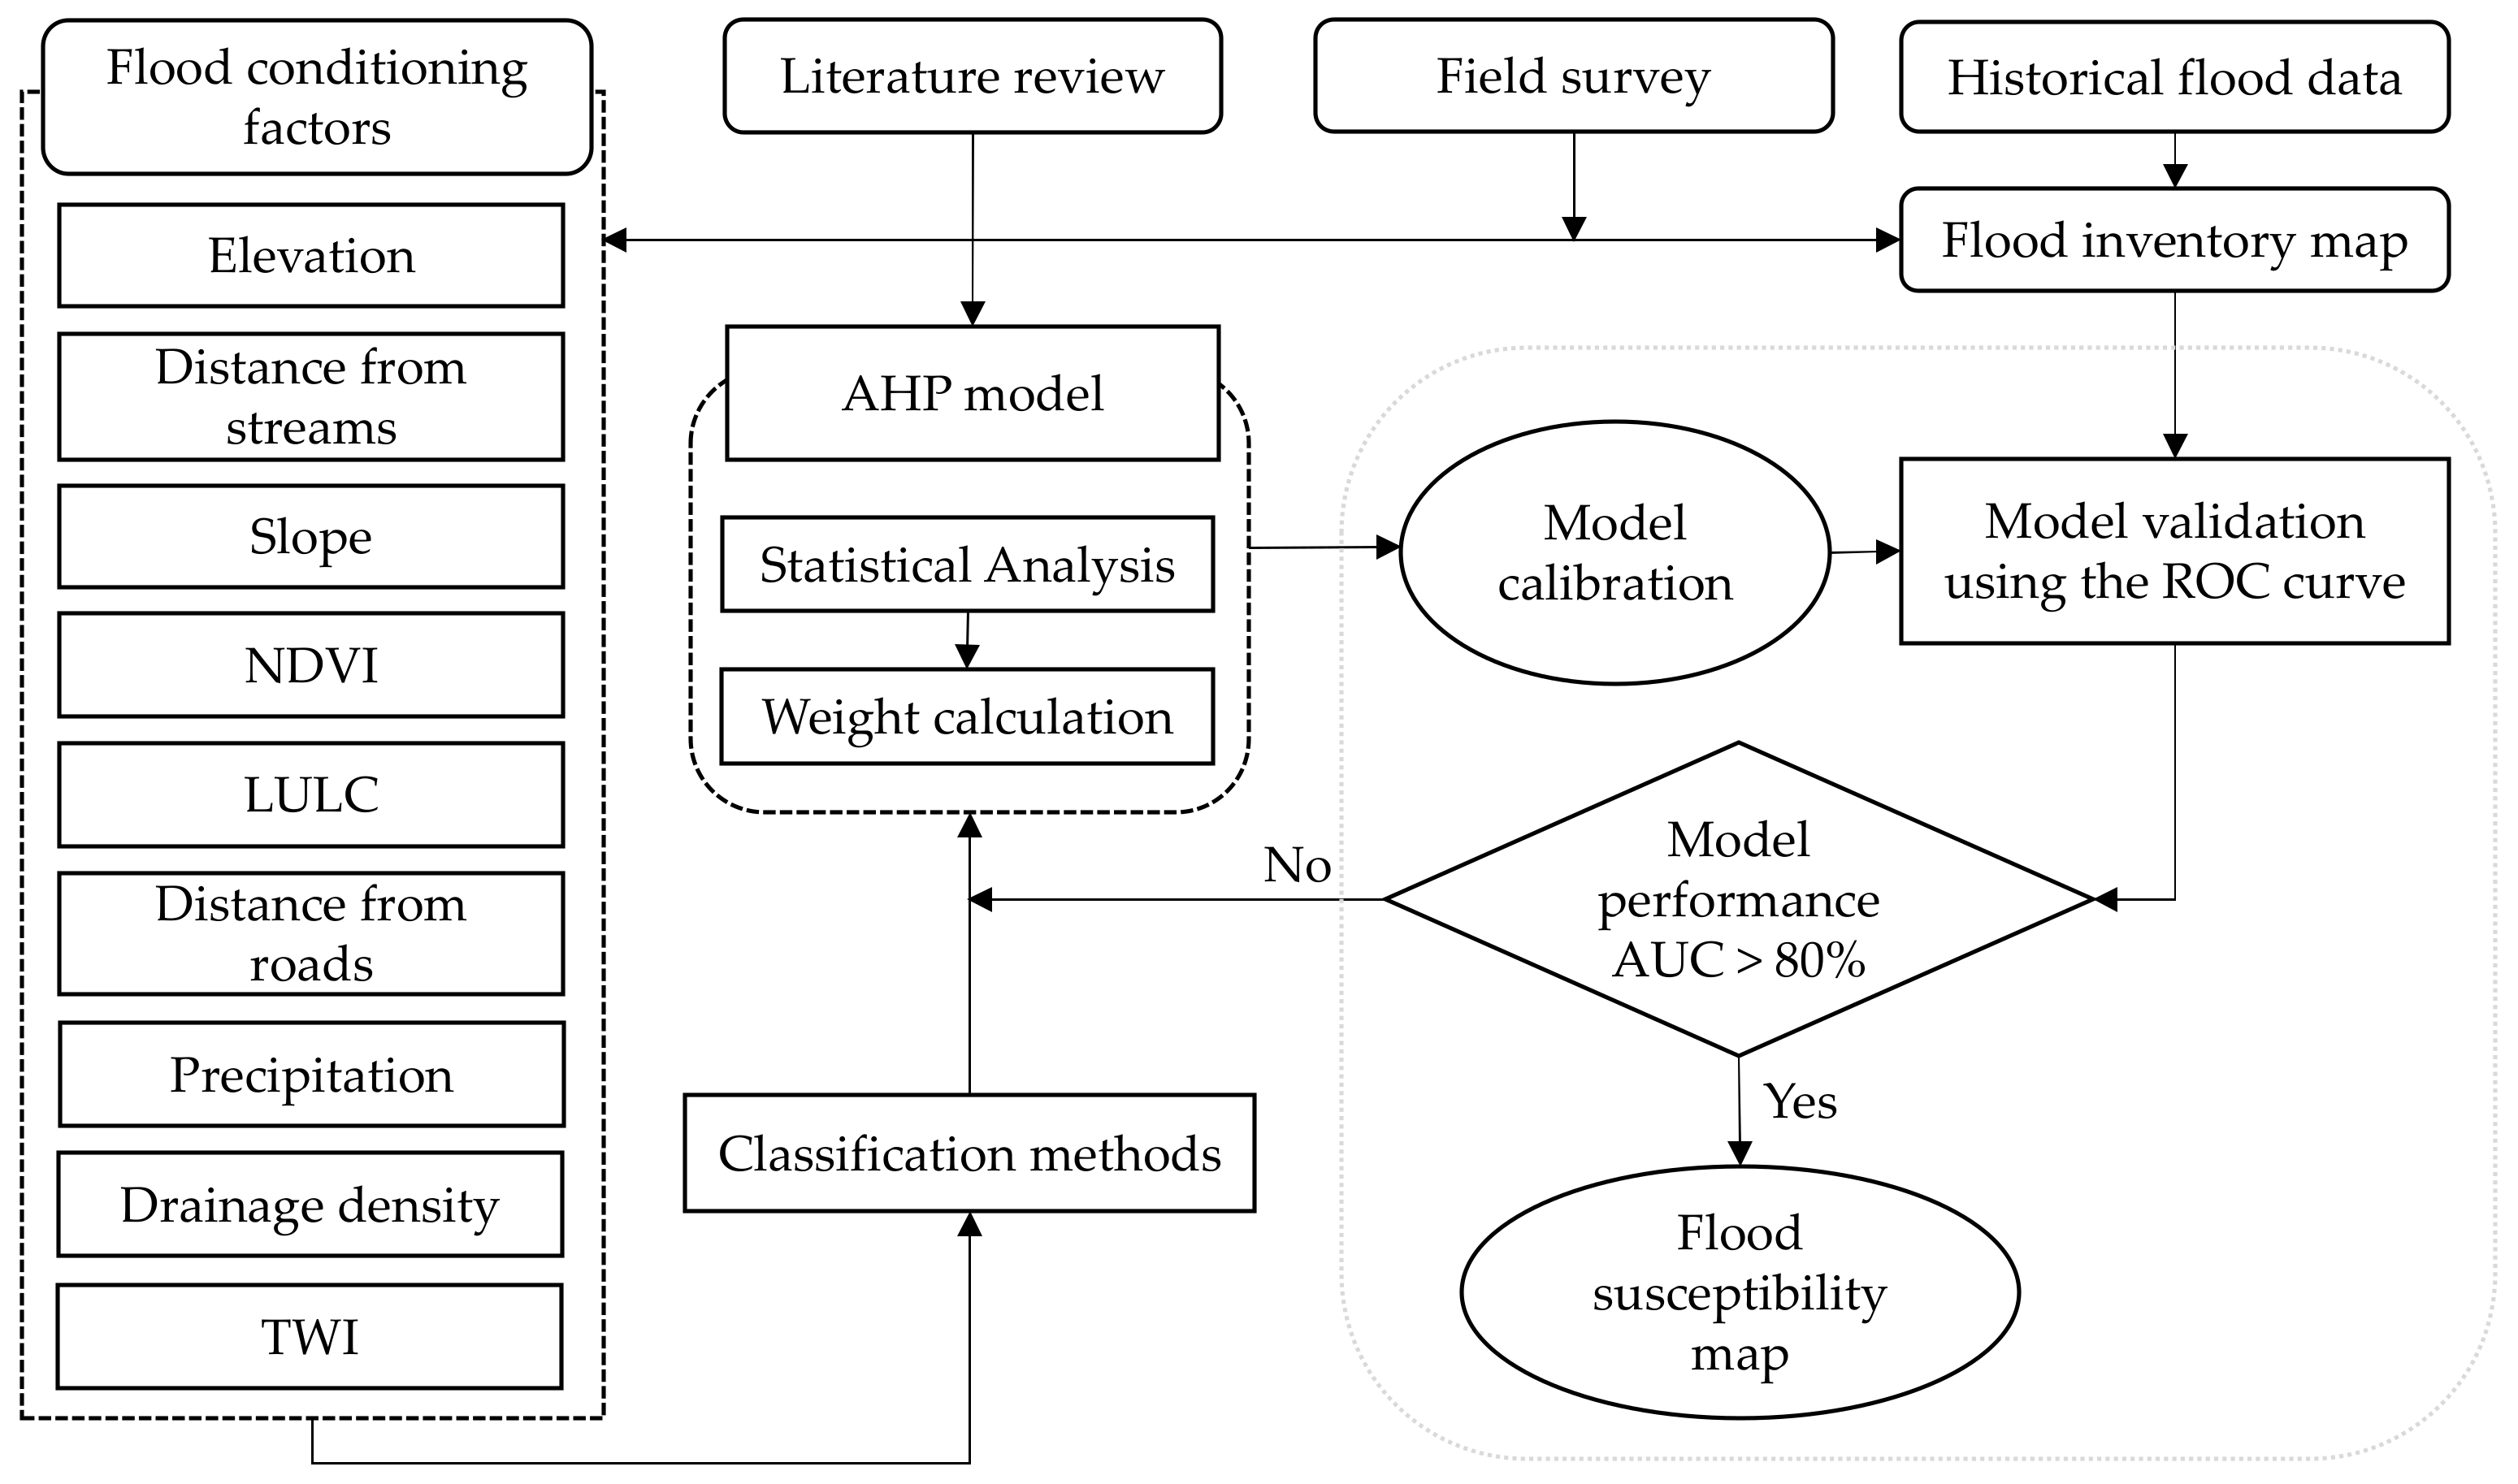
The workflow implemented in the current study comprised four main stages as shown in Figure 4. These stages included the following:
- 1.
- A literature review, data collection, and preprocessing of the geographic spatial data, including field surveys and a compilation of historical flood points for the historical flood-inventory map;
- 2.
- The identification and selection of sensitive factors, followed by their evaluation and classification; then, weights were assigned to the factors using the AHP model;
- 3.
- Overlay analysis and the creation of the flood-susceptibility map using the GIS map overlay method;
- 4.
- Evaluation and validation of the effectiveness of the flood-susceptibility map using the ROC curve.
Figure 4.
Research flow.
3.2.1. Analytic Hierarchy Process (AHP)
The analytic hierarchy process (AHP) is a decision-making system that involves multiple criteria and determines the weights of each trait grounded on the knowledge and experience of experts [74]. The AHP allows the evaluation of quantitative, qualitative, and complex criteria and factors on the same scale [75]. Assaying the experts’ order of priority helps organize a complex problem into a hierarchical structure of lower problems, making it easier to approach [76,77]. Within this, the pairwise comparison method is a powerful tool that helps decision-makers subjectively determine the significance weights of each criterion in a study, thus creating a common system for decision-making processes grounded on multiple attributes [78]. AHP has been used in flood disaster management [79] and ranking projects for disaster recovery [78].
The AHP was used to compare each pair of factors on a 9-point scale (Table A2). In this, when two factors were of equal importance, a value of 1 was assigned; a value of 9 determined the greatest importance for a factor [74,80]. The compared values were organized as a diagonal matrix. Then, the 9 × 9 square comparison matrix and the relative score of each factor were determined by the diagonal matrix and its inverse matrix, in which the diagonal elements had a value of 1 to ensure that each factor was compared with itself. The comparison matrix is represented by Equation (3).
Consistency is an important factor in the AHP as it ensures that choices and rankings are made consistently and logically. Therefore, checking the consistency of the comparison matrix is an important part of the AHP process. Saaty’s method is one of the most common ways in which to do this [25]; it produces a consistency index and consistency ratio (CR, Equation (4)).
where CI is the consistency index, which can be calculated based on Equation (5), and RI is the random inconsistency index value, which is dependent on the number of factors used in the pairwise matrix (Table 3).
where is the maximum eigenvalue of the judgment matrix and n is the total number of factors (Equation (6)).
The CR value < 0.1 implies an acceptable accuracy for the computed matrix in the AHP analysis [74]. In this study, calculating the weights of factors using the AHP was conducted based on preliminary surveys of local residents and the opinions of six experts in Hanoi city.
3.2.2. Survey of Experts and AHP Calculation
Our expert survey was conducted through online discussions with six experts in Hanoi in the second quarter of 2022. The experts included a researcher in the field of geography (R1) and a researcher in natural geography (R2) at Hanoi University of Natural Sciences; two environmental engineering researchers at the Vietnam Academy of Science and Technology (R3) and Hanoi University of Science and Technology (R4); a lecturer in urban management at Hanoi Architectural University (R5); and an urban planning architect at the Hanoi City Planning Institute (R6).
In this study, the relative importance of flood-conditioning factors was determined based on priority levels collected from residents during field surveys. Subsequently, the nine selected calculation component factors were accepted by the six experts. A pairwise comparison matrix was established from each expert (Figure A1), which resulted from the AHP pairwise comparisons after weighting and CR testing. For CR > 0.1, respondents were asked to reconsider and adjust their answers.
After obtaining acceptable CR values in the pairwise comparison matrices from each expert, the average input values of the six experts were calculated to produce a single pairwise comparison matrix (Table 4). Table 5 presents the normalized values from Table 4, which were used to calculate the weights of each conditioning factor and check the CR. The final pairwise comparison matrix was adjusted under the direction of the experts to achieve an acceptable CR and refine the weights of the conditioning factors.
After calculating the weights, a flood-susceptibility map was prepared using the weighted sum and overlay approach in a GIS environment, where each factor was multiplied by its factor weight using Equation (7).
where is the weight of factor I, and is the classes of flood-conditioning factor i.
Calibration within the expert acceptance range was again performed to achieve a high-performance model (AUC > 0.8).
3.2.3. Validation of Model
The accuracy assessment of the models employed is paramount to presenting study outcomes. Various statistical measures have been utilized by different scholars [81]. Among these, the area under the curve (AUC) stands out as the most reliable method for evaluating the proficiency of the multi-criteria decision analysis (MCDA) model due to its straightforward design, comprehensive nature, and equitable predictive characteristics. In the current study, we utilized the AUC as a crucial indicator of the ROC curve. The ROC values demonstrate the model’s ability to accurately differentiate between positive and negative observations in the validation sample [82] (Equations (8) and (9)).
where TN and FN are true negatives and false negatives, respectively; TP and FP are true positives and false positives, respectively. The quantitative–qualitative relationship between the AUC and model performance accuracy, which ranges from 0 to 1 [83], is shown in Figure 5.
4. Results
In this study, a flood-susceptibility map was developed using the widely accepted and extensively utilized AHP model in a GIS environment through the assessment and combination of flood-regulating factors, as discussed previously (Section 3.2). The consistency ratio value for the pairwise comparison matrix was 0.049, indicating that the derived weights of the conditioning factors were consistent.
4.1. Flood-Susceptibility Assessment
The relative weights of flood-conditioning factors derived from the pairwise comparison matrix are presented in Table 6, the susceptibility map is shown in Figure 6. These reflect the estimated contributions of each factor to flooding susceptibility in Hanoi and include the TWI (13%), elevation (7.5%), slope (5.9%), precipitations (8%), LULC (18.5%), NDVI (10.3%), distance from streams (13.2%), distance from roads (18%), and drainage density (5.5%). Spatial factors with higher weights contribute more significantly to urban flooding susceptibility compared to those with lower weights.
As depicted in Figure 6, the susceptibility map illustrates flooding susceptibility classified into five levels: very high, high, moderate, low, and very low. The area estimated to have a very high susceptibility to flooding constitutes a minute proportion (0.653 ), representing less than 1% of Hanoi’s total area. However, more than 65% (2412.57 ) of the city’s territory faces a moderate susceptibility to flooding, while areas with a high susceptibility cover 10.5% (388.314 ) of the city. Areas with a low susceptibility and very low susceptibility account for about 22% (814.986 ) and 2% (74.717 of the city, respectively. As a result of rapid urbanization, the central districts are highly susceptible to flooding during prolonged heavy rainfall.
4.2. Model Validation
A critical step in ensuring the reliability of any model is accuracy evaluation [61]. In this study, the AUC was computed based on flood occurrence points (148 locations) collected through field surveys in flood-prone areas, city reports, and a literature review. The ROC curve evaluates the success rate and the prediction accuracy of a model by plotting training and validation dataset pairs. The AUC value of the success rate curve (Figure 7) indicates that the success rate of our model is 87.3% (AUC = 0.873), i.e., our model has a very good accuracy.
5. Discussion
5.1. Flood-Susceptibility Area
The results in Table 6 show that the average LULC, with a weighted score of 0.185, and distance from roads, with a weighted score of 0.18, have the highest priority among all the factors in this study, i.e., these two factors were identified as the primary factors contributing to flooding. Based on historical flooding experience, flood-prone areas are predominantly concentrated in the 12 central districts of Hanoi, where there is a high population density and high impervious surface coefficients. Slope and drainage density play lesser roles in flooding susceptibility in the study area. Figure 3c illustrates that, apart from the highlands in the West, the majority of Hanoi’s terrain contains slopes ranging from 1–5 degrees. This suggests that the influence of slopes or topographic factors is widespread across the city, resulting in a uniform susceptibility to flooding in most areas. Areas with a drainage density greater than one are mainly concentrated on agricultural land, which is primarily used for rice and flower cultivation.
According to on-site surveys in the 12 central districts, flood-prone areas often coincide with major intersections or are densely populated zones. They are characterized by high impervious surface coverage and the flooding is exacerbated by antiquated drainage systems [84]. This impedes water infiltration into the soil, resulting in surface runoff during heavy rainfall events. The ongoing urbanization process in Hanoi is expected to rapidly expand impervious surface areas. Moreover, there is a positive correlation between road density and flooding frequency, with high-susceptibility flood areas typically located within 500 m of roads. Conversely, flood-safe areas encompass only 24% (889,703 ) of the total area and are primarily concentrated in highland regions in the northwest. In recent years, in addition to recurrent flooding hotspots, Hanoi has witnessed the emergence of new flood-prone locations in expanding urban areas.
5.2. Analysis of General Flood-Susceptibility Planning
Hanoi is bifurcated into two parts (Figure 1c), the high-density central districts (Figure A2) and the expansive suburban districts, which encompass nearly 60% of the city’s land area dedicated to agriculture (Figure A3). These suburban districts are pivotal to the city’s food security, contributing significantly to the sustenance of the urban populace. Notably, a natural event that does not affect human communities is considered a natural event rather than a threat [85]. Therefore, the suburban districts of Hanoi, characterized by their sparse population, receive limited attention and resources. Flood-response strategies seem to be focused and catered predominantly to the central districts, despite the higher susceptibility of the suburban areas to flooding.
In urban areas of Southeast Asia that rely heavily on agriculture, the sparsely populated areas often dedicated to agriculture and forestry are particularly vulnerable to flooding. This vulnerability can lead to substantial harm to agricultural productivity, disrupt harvests, and adversely affect the livelihoods of the local populace. The 2018 flood in Hanoi serves as a stark reminder of the devastation that can be wrought upon agricultural-dependent regions in Southeast Asia. According to preliminary statistics from Lao Dong newspaper, in Chuong My district alone, the deluge resulted in extensive damage to agricultural assets, including 1348.2 hectares of rice paddies, 277.9 hectares of vegetable crops, 605.6 hectares of aquaculture, and 187.6 hectares of fruit orchards. The calamity also claimed the lives of 339 livestock, led to the loss of 55,629 poultry, and caused the collapse of 4855 square meters of livestock shelters, alongside significant property damage. Therefore, underscoring the imperative of identifying and fortifying flood-prone zones, even those sparsely populated, enables effective urban planning and long-term agricultural resilience.
According to the Hanoi City Committee, the city’s goal is to achieve an urbanization rate of approximately 60–62% by 2025 and around 65–75% by 2030. Based on the analysis of Hanoi’s urban planning map for 2030, the city’s development is directed in three basic areas: urban residential areas, agricultural landscape areas, and landscape areas that need protection (Figure 8a). Among these, the agricultural landscape area has the highest susceptibility to flooding. According to the Department of Agriculture and Rural Development, Hanoi will focus on developing urban agriculture in parallel with urbanization. Developing agriculture in these areas is considered a suitable direction to ensure food security. These green areas also serve as the lungs of the city. However, as these areas are those with the highest flood susceptibility, they require appropriate irrigation systems, canal networks, and rivers to retain water for agriculture during the dry season and drain surface water during the rainy season.
The central districts of Hanoi are divided into two parts: the Old Quarter and the urban residential center. Among these, the area with moderate flood susceptibility accounts for 71.7%, while areas with high and very high flood susceptibility make up nearly 20%. In contrast, areas with a low flood susceptibility comprise just over 8% (Table 7). The Old Quarter, which is the heart of Hanoi, is characterized by outdated and deteriorating urban infrastructure and is difficult to redevelop. According to the Hanoi Statistical Yearbook 2022, the highest concentration of historical flooding points is in this area, spanning the four central districts of Hoan Kiem, Dong Da, Ba Dinh, and Hai Ba Trung, with population densities ranging from 24,000 to 40,000 people/. With a high proportion of concrete surfaces and only 5% green space [43], Hoan Kiem District is prone to frequent flooding, especially during prolonged heavy rainfall. These areas mainly exhibit a moderate susceptibility to flooding (Figure 8b). Based on the investigation results, this is due to prolonged heavy rainfall overwhelming the outdated drainage system and causing flooding in low-lying residential areas and/or water concentrated at traffic intersections. In addition, field observations revealed numerous lakes and ponds in this area, most of which are concrete-lined, isolated, and not connected to the river network. These water bodies do not effectively retain rainwater and can contribute to flooding as water can only drain through the urban surface-water drainage system.
According to Hanoi’s urban planning map for 2030, there are plans to develop green corridors and intersperse green spaces within urban residential areas. Using the flood-susceptibility map, areas prone to flooding can be identified for the appropriate design of these. This approach will help regulate rainfall and make efficient use of surface water, thereby minimizing flooding in residential areas. As a result, the next phase of flood research in Hanoi will focus on specific areas and on calculating the flood risk for various aspects at each specific location.
5.3. Regional Relevance
Southeast Asian countries are located in the humid tropics, with formations and cultures deeply attached to water. Large cities are mostly concentrated in low-altitude coastal areas, influenced by the sea or large rivers [86]. In the process of rapid transformation from agriculture to industry, many cities in this area are facing many environmental, public health, and political problems, and are especially vulnerable to the impact of climate change as natural disasters increase.
In recent decades, the Association of Southeast Asian Nations (ASEAN) has witnessed rapid urbanization and is projected to continue urbanizing for many years to come (Figure A4). Although half of the ASEAN region’s population was already urbanized by 2020, this figure is expected to escalate to 55.6% by 2030 [87]. While many second- and third-tier urban areas in Southeast Asia are experiencing robust growth, urban planning and management have not been systematically implemented, posing significant challenges in preserving water resources sustainability and mitigating the impacts of climate change and natural disasters [88]. Persistent urban inequality and a host of other issues across the ASEAN region, including environmental degradation and the proliferation of informal settlements, impede the synchronous development of urban infrastructure [88]. In addition, the government’s natural disaster prevention initiatives often fall short of efficacy in the absence of comprehensive multi-sectoral and community engagement.
Through regional policy cooperation [89] and shared contextual similarities, Southeast Asian cities are collaboratively addressing the challenges of climate change and natural disaster risk mitigation. By applying an established theoretical framework and empirical findings, we evaluated the flood susceptibility in Hanoi, a typical example of urban areas in Southeast Asia. Our methodology, which is straightforward and cost-effective, can be flexibly applied to other similar urban areas in the region. Moreover, the strategy of gathering expert opinions from diverse fields can facilitate a comprehensive consideration of flood-related problems from multiple perspectives, gradually marking a departure from the traditionally single-disciplinary approach.
6. Conclusions
Flood-susceptibility maps are widely utilized in flood-related fields and urban development projects [90]. This study integrated the analytic hierarchy process (AHP) within a geographic information system (GIS) environment to map flood susceptibility at various spatial analysis scales. Nine spatial factors that affect flood susceptibility, including the topographic wetness index (TWI), elevation, slope, precipitation, land use and land cover (LULC), normalized difference vegetation index (NDVI), distance from streams, distance from roads, and drainage density, were selected as input data based on overview documents. The study area is Hanoi, Vietnam.
The AHP process involved input from experts in relevant fields, such as management, urban planning, physical geography, and environmental engineering, to create a comprehensive and stable estimation method. The research findings indicate that LULC and distance from roads are the most influential factors in regulating flood susceptibility, while slope and drainage density have a lower priority in relation to flood susceptibility in this area.
In the flood-susceptibility map, a majority of the study area is classified as having a moderate susceptibility to flooding, accounting for 65%, and a very small portion is classified as having a very high susceptibility to flooding. The performance of the method was evaluated using the ROC curve and the AUC value. The AUC result of 87.3% demonstrates that the model can reasonably predict the level of flood susceptibility in the study area.
Despite producing an effective analysis and significant validation results in mapping flood-susceptibility areas with limited flood data, the study has several limitations regarding data preparation and the specificity of urban locations. Therefore, future steps will address these challenges and limitations via further detailed studies in areas with different characteristics. The development of geographic information systems and global climate models is also valuable for analyzing and predicting flood scenarios in areas where data collection is lacking or difficult.
This research not only enhances our understanding of the complex dynamics of urban flooding, but it also provides valuable insights for the development of effective flood-susceptibility mitigation strategies and innovative initiatives in urban planning, particularly in vulnerable urban areas like Hanoi.
Author Contributions
Conceptualization, H.N.N. and M.N.N.; methodology, H.N.N. and H.F.; software, H.N.N.; validation, H.N.N., M.N.N. and H.F.; formal analysis, H.N.N. and M.N.N.; investigation, H.N.N. and M.N.N.; resources, H.N.N. and M.N.N.; data curation, H.N.N.; writing—original draft preparation, H.N.N.; writing—review and editing, H.F.; visualization, H.N.N.; supervision, H.F. All authors have read and agreed to the published version of the manuscript.
Funding
This research received no external funding.
Institutional Review Board Statement
We conducted this study based on the guidelines and checklist provided by the Research Ethics Review Board of the University of Kitakyushu. The checklist emphasized that studies need ethical consideration if they are invasive and collect personal information. According to the checklist, our research did not fall within the scope of ethical review as it was non-invasive and did not gather private information from participating individuals. To ensure transparency and respect for ethics, we adhered to all guidelines and ethical standards applicable throughout the conduct of this research, including collecting data only from publicly available sources and not disclosing the personal information of any individuals.
Informed Consent Statement
We obtained informed consent from all study participants, ensuring they were fully informed about the study’s purpose, procedures, and their rights.
Data Availability Statement
All data are contained within this paper.
Conflicts of Interest
The authors declare no conflicts of interest.
Appendix A

Table A1.
Relevant references illustrate the impact of nine factors on the susceptibility to flooding.
Table A1.
Relevant references illustrate the impact of nine factors on the susceptibility to flooding.
| Elevation | Slope | Drainage Density | TWI | Precipitation | LULC | NDVI | Distance from Streams | Distance from Roads | |
|---|---|---|---|---|---|---|---|---|---|
| Mahmoud, S.H. et al. [24] | x | x | x | x | x | x | |||
| Tehrany, M.S. et al. [51] | x | x | x | x | x | ||||
| Bera, S. et al. [52] | x | x | x | x | x | x | |||
| Nguyen, D.L. et al. [54] | x | x | x | x | x | x | x | x | |
| Costache, R. et al. [55] | x | x | x | x | x | x | |||
| Ali, S.A. et al. [63] | x | x | x | x | x | x | x | x | |
| Samanta, S. et al. [66] | x | x | x | ||||||
| Chaulagain, D. et al. [67] | x | x | x | x | x | x | |||
| Band, S.S. et al. [69] | x | x | x | x | x | ||||
| Nachappa, T.G. et al. [70] | x | x | x | x | x | x | x | x | |
| Zhao, G. et al. [91] | x | x | x | ||||||
| Arabameri, A. et al. [92] | x | x | x | x | x | x | x | ||
| Hong, H. et al. [93] | x | x | x | x | |||||
| Abinet Addis [94] | x | x | x | x | x | x | x | x | |
| Razavi-Termeh, S.V. et al. [95] | x | x | x | x | x | x |
Table A2.
Saaty’s scale for pairwise comparison [80].
Table A2.
Saaty’s scale for pairwise comparison [80].
| Intensity of Importance | Explanation |
|---|---|
| 1 | Equal importance |
| 3 | Slightly importance of one factor over another |
| 5 | Essential importance |
| 7 | Demonstrated importance |
| 9 | Absolute importance |
| 2,4,6,8 | Intermediate values between two adjacent judgments when compromise is required. |
Appendix B. Paired Comparison Results of Six Experts Using the AHP
Figure A1.
Paired comparison results of six experts (R1–R6). TWI—topographic wetness index; EL—elevation; SL—slope; PR—precipitation; LULC—land use/land cover; NDVI—normalized difference vegetation index; DS—distance from streams; DR—distance from roads; and DD—drainage density.
Figure A1.
Paired comparison results of six experts (R1–R6). TWI—topographic wetness index; EL—elevation; SL—slope; PR—precipitation; LULC—land use/land cover; NDVI—normalized difference vegetation index; DS—distance from streams; DR—distance from roads; and DD—drainage density.

Appendix C
Figure A2.
Population density (person/km2) by the districts of Hanoi in 2022. Source: Hanoi Statistical Yearbook 2023. Central districts: 1—Ba Dinh; 2—Hoan Kiem; 3—Dong Da; 4—Cau Giay; 5—Thanh Xuan; 6—Hai Ba Trung; 7—Tay Ho; 8—Long Bien; 9—Hoang Mai; 10—Bac Tu Liem; 11—Nam Tu Liem; 12—Ha Dong. Suburban districts: 13—Soc Son; 14—Dong Anh; 15—Gia Lâm; 16—Thanh Trì; 17—Mê Linh; 18—Son Tay; 19—Ba Vi; 20—Phu Tho; 21—Dan Phuong; 22—Hoai Duc; 23—Quoc Oai; 24—Thach That; 25—Thanh Oai; 26—Chuong My; 27—Thuong Tin; 28—Phu Xuyen; 29—Ung Hoa; 30—My Duc.

Figure A3.
Land use status by the districts of Hanoi in 2022 (Ha). Source: Hanoi Statistical Yearbook 2023.
Figure A3.
Land use status by the districts of Hanoi in 2022 (Ha). Source: Hanoi Statistical Yearbook 2023.

Figure A4.
Annual percentage (%) of urban population at mid-year, by ASEAN member state, 2015–2030 [87].
Figure A4.
Annual percentage (%) of urban population at mid-year, by ASEAN member state, 2015–2030 [87].

References
- Ruan, J.; Chen, Y.; Yang, Z. Assessment of temporal and spatial progress of urban resilience in Guangzhou under rainstorm scenarios. Int. J. Disaster Risk Reduct. 2021, 66, 102578. [Google Scholar] [CrossRef]
- Nkeki, F.N.; Bello, E.I.; Agbaje, I.G. Flood risk mapping and urban infrastructural susceptibility assessment using a GIS and analytic hierarchical raster fusion approach in the Ona River Basin, Nigeria. Int. J. Disaster Risk Reduct. 2022, 77, 103097. [Google Scholar] [CrossRef]
- Najibi, N.; Devineni, N. Recent trends in the frequency and duration of global floods. Earth Syst. Dyn. 2018, 9, 757–783. [Google Scholar] [CrossRef]
- Tellman, B.; Sullivan, J.A.; Kuhn, C.; Kettner, A.J.; Doyle, C.S.; Brakenridge, G.R.; Erickson, T.A.; Slayback, D.A. Satellite imaging reveals increased proportion of population exposed to floods. Nature 2021, 596, 80–86. [Google Scholar] [CrossRef] [PubMed]
- World Meteorological Organization. WMO Atlas of Mortality and Economic Losses from Weather, Climate and Water Extremes (1970–2019); World Meteorological Organization: Geneva, Switzerland, 2021; pp. 16–21. [Google Scholar]
- International Federation of Red Cross and Red Crescent Societies (IFRC). World Disasters Report 2020: Come Heat or High Water; International Federation of Red Cross and Red Crescent Societies (IFRC): Geneva, Switzerland, 2020; pp. 50–55. [Google Scholar]
- Dhiman, R.; VishnuRadhan, R.; Eldho, T.I.; Inamdar, A. Flood risk and adaptation in Indian coastal cities: Recent scenarios. Appl. Water Sci. 2019, 9, 5. [Google Scholar] [CrossRef]
- Shao, Z.; Ding, L.; Li, D.; Altan, O.; Huq, E.; Li, C. Exploring the relationship between urbanization and ecological environment using remote sensing images and statistical data: A case study in the Yangtze River Delta, China. Sustainability 2020, 12, 5620. [Google Scholar] [CrossRef]
- Quan, R.S.; Liu, M.; Lu, M.; Zhang, L.J.; Wang, J.J.; Su, S.Y. Waterlogging risk assessment based on land use/cover change: A case study in Pudong New Area, Shanghai. Environ. Earth Sci. 2010, 61, 1113–1121. [Google Scholar] [CrossRef]
- Li, J.; Burian, S.J. Evaluating real-time control of stormwater drainage network and green stormwater infrastructure for enhancing flooding resilience under future rainfall projections. Resour. Conserv. Recycl. 2023, 198, 107123. [Google Scholar] [CrossRef]
- Li, L.; Uyttenhove, P.; Van Eetvelde, V.E. Planning green infrastructure to mitigate urban surface water flooding risk–A methodology to identify priority areas applied in the city of Ghent. Landsc. Urban Plan. 2020, 194, 103703. [Google Scholar] [CrossRef]
- Tramblay, Y.; Mimeau, L.; Neppel, L.; Vinet, F.; Sauquet, E. Detection and attribution of flood trends in Mediterranean basins. Hydrol. Earth Syst. Sci. 2019, 23, 4419–4431. [Google Scholar] [CrossRef]
- Ringo, J.; Sabai, S.; Mahenge, A. Performance of early warning systems in mitigating flood effects. A review. J. Afr. Earth Sci. 2023, 210, 105134. [Google Scholar] [CrossRef]
- Jose Moises, D.; Kunguma, O. Improving flood early warning systems in Kabbe, Namibia: A situational analysis approach. Int. J. Disaster Risk Reduct. 2023, 93, 103765. [Google Scholar] [CrossRef]
- Horita, F.E.A.; de Albuquerque, J.P.; Marchezini, V. Understanding the decision-making process in disaster risk monitoring and early-warning: A case study within a control room in Brazil. Int. J. Disaster Risk Reduct. 2018, 28, 22–31. [Google Scholar] [CrossRef]
- Darabi, H.; Choubin, B.; Rahmati, O.; Haghighi, A.T.; Pradhan, B.; Kløve, B. Urban flood risk mapping using the GARP and QUEST models: A comparative study of machine learning techniques. J. Hydrol. 2019, 569, 142–154. [Google Scholar] [CrossRef]
- Chen, J.; Hill, A.A.; Urbano, L.D. A GIS-based model for urban flood inundation. J. Hydrol. 2009, 373, 184–192. [Google Scholar] [CrossRef]
- Alam, S.; Rahman, A.; Yunus, A. Designing Stormwater Drainage Network for Urban Flood Mitigation using SWMM: A Case Study on Dhaka City of Bangladesh. Am. J. Water Resour. 2023, 11, 65–78. [Google Scholar] [CrossRef]
- Latt, Z.Z.; Wittenberg, H. Improving Flood Forecasting in a Developing Country: A Comparative Study of Stepwise Multiple Linear Regression and Artificial Neural Network. Water Resour. Manag. 2014, 28, 2109–2128. [Google Scholar] [CrossRef]
- Xiao, T.; Segoni, S.; Chen, L.; Yin, K.; Casagli, N. A step beyond landslide susceptibility maps: A simple method to investigate and explain the different outcomes obtained by different approaches. Landslides 2020, 17, 627–640. [Google Scholar] [CrossRef]
- Liu, L.L.; Zhang, Y.L.; Xiao, T.; Yang, C. A frequency ratio–based sampling strategy for landslide susceptibility assessment. Bull. Eng. Geol. Environ. 2022, 81, 360. [Google Scholar] [CrossRef]
- Trošelj, J.; Lee, H.S.; Hobohm, L. Enhancing a Real-Time Flash Flood Predictive Accuracy Approach for the Development of Early Warning Systems: Hydrological Ensemble Hindcasts and Parameterizations. Sustainability 2023, 15, 13897. [Google Scholar] [CrossRef]
- Guan, F.; Fang, Z.; Zhang, X.; Zhong, H.; Zhang, J.; Huang, H. Using street-view panoramas to model the decision-making complexity of road intersections based on the passing branches during navigation. Comput. Environ. Urban Syst. 2023, 103, 101975. [Google Scholar] [CrossRef]
- Mahmoud, S.H.; Gan, T.Y. Multi-criteria approach to develop flood susceptibility maps in arid regions of Middle East. J. Clean. Prod. 2018, 196, 216–229. [Google Scholar] [CrossRef]
- Saaty, T.L. The Analytic Hierarchy Process: Planning, Priority Setting, Resource Allocation, 2nd ed.; McGraw-Hill International Book Company: New York, NY, USA, 1980. [Google Scholar]
- Luu, C.; Tran, H.X.; Pham, B.T.; Al-Ansari, N.; Tran, T.Q.; Duong, N.Q.; Dao, N.H.; Nguyen, L.P.; Nguyen, H.D.; Ta, H.T.; et al. Framework of spatial flood risk assessment for a case study in Quang Binh province, Vietnam. Sustainability 2020, 12, 3058. [Google Scholar] [CrossRef]
- Chen, Y.R.; Yeh, C.H.; Yu, B. Integrated application of the analytic hierarchy process and the geographic information system for flood risk assessment and flood plain management in Taiwan. Nat. Hazards 2011, 59, 1261–1276. [Google Scholar] [CrossRef]
- Kazakis, N.; Kougias, I.; Patsialis, T. Assessment of flood hazard areas at a regional scale using an index-based approach and Analytical Hierarchy Process: Application in Rhodope-Evros region, Greece. Sci. Total Environ. 2015, 538, 555–563. [Google Scholar] [CrossRef] [PubMed]
- Schiermeier, Q. Increased flood risk linked to global warming. Nature 2011, 470, 316. [Google Scholar] [CrossRef] [PubMed]
- Nilawar, A.P.; Waikar, M.L. Impacts of climate change on streamflow and sediment concentration under RCP 4.5 and 8.5: A case study in Purna river basin, India. Sci. Total Environ. 2019, 650, 2685–2696. [Google Scholar] [CrossRef] [PubMed]
- Intergovernmental Panel on Climate Change (IPCC). Sections. In Climate Change 2023: Synthesis Report; Intergovernmental Panel on Climate Change (IPCC): Geneva, Switzerland, 2023; pp. 35–115. [Google Scholar] [CrossRef]
- Intergovernmental Panel on Climate Change (IPCC). Climate Change 2014: Impacts, Adaptation, and Vulnerability. Part A: Global and Sectoral Aspects; Cambridge University Press: New York, NY, USA, 2014; p. 1132. [Google Scholar]
- The Wold Bank. Turn Down the Heat: Climate Extremes, Regional Impacts, and the Case for Resilience; The World Bank: Washington, DC, USA, 2013; p. 213. [Google Scholar]
- Global Facility for Disaster Reduction and Recovery (GFDRR). Vulnerability, Risk Reduction, and Adaptation to Climate Change Viet Nam. In Climate Risk and Adaptation Country Profile; The World Bank: Washington, DC, USA, 2011; pp. 1–15. [Google Scholar]
- Global Facility for Disaster Reduction and Recovery (GFDRR). Country Profile: Vietnam; The World Bank: Washington, DC, USA, 2015. [Google Scholar]
- Bangalore, M.; Smith, A.; Veldkamp, T. Exposure to Floods, Climate Change, and Poverty in Vietnam. Econ. Disasters Clim. Change 2018, 3, 79–99. [Google Scholar] [CrossRef]
- Nguyen, H.; Tran, P. 9–Urban Disaster Risk Reduction in Vietnam: Gaps, Challenges, and Approaches. In Urban Disasters and Resilience in Asia; Elsevier: Amsterdam, The Netherlands, 2016; pp. 123–140. [Google Scholar] [CrossRef]
- Tran, D.; Xu, D.; Alwah, A.A.Q.; Liu, B. Research of Urban Suitable Ecological Land Based on the Minimum Cumulative Resistance Model: A Case Study from Hanoi, Vietnam. IOP Conf. Ser. Earth Environ. Sci. 2019, 300, 032084. [Google Scholar] [CrossRef]
- Tran, D.; Xu, D.; Dang, V.; Alwah, A.A.Q. Predicting urban waterlogging risks by regression models and internet open-data sources. Water 2020, 12, 879. [Google Scholar] [CrossRef]
- Luo, P.; Mu, D.; Xue, H.; Ngo-Duc, T.; Dang-Dinh, K.; Takara, K.; Nover, D.; Schladow, G. Flood inundation assessment for the Hanoi Central Area, Vietnam under historical and extreme rainfall conditions. Sci. Rep. 2018, 8, 12623. [Google Scholar] [CrossRef] [PubMed]
- Kefi, M.; Mishra, B.K.; Kumar, P.; Masago, Y.; Fukushi, K. Assessment of tangible direct flood damage using a spatial analysis approach under the effects of climate change: Case study in an urban watershed in Hanoi, Vietnam. ISPRS Int. J. Geo-Inf. 2018, 7, 29. [Google Scholar] [CrossRef]
- Hieu, N.; Hieu, T.; Kinh Bac, D.; Phương, T. Assessment of Flood Hazard in Hanoi City. VNU J. Earth Environ. Sci. 2013, 29, 26–37. [Google Scholar]
- Loi, D.T. Assessment of Urban Flood Vulnerability Using Integrated Multi-parametric AHP and GIS. Int. J. Geoinform. 2023, 19, 1–16. [Google Scholar]
- Seneviratne, S.I.; Zhang, X.; Adnan, M.; Badi, W.; Dereczynski, C.; Di Luca, A.; Ghosh, S.; Iskandar, I.; Kossin, J.; Lewis, S.; et al. Weather and Climate Extreme Events in a Changing Climate. In Climate Change 2021: The Physical Science Basis; Chan, J., Sorteberg, A., Vera, C., Eds.; Cambridge University Press: Cambridge, UK; New York, NY, USA, 2021; pp. 1513–1766. [Google Scholar] [CrossRef]
- van Horen, B. Hanoi. Cities 2005, 22, 161–173. [Google Scholar] [CrossRef]
- Pham, A.T.; Shannon, K.; Meulder, B.D. Water Urbanism in Hanoi, Vietnam: An Investigation into Possible Interplays of Infrastructure, Urbanism and Landscape of the City’s Dyke System. Ph.D. Thesis, Katholieke Universiteit Leuven, Leuven, The Netherlands, 22 April 2013. [Google Scholar]
- Chen, T.C.; Yen, M.C.; Tsay, J.D.; Thanh, N.T.T.; Alpert, J. Synoptic development of the Hanoi heavy rainfall event of 30–31 October 2008: Multiple-scale processes. Mon. Weather Rev. 2012, 140, 1219–1240. [Google Scholar] [CrossRef]
- Tang, X.; Shu, Y.; Lian, Y.; Zhao, Y.; Fu, Y. A spatial assessment of urban waterlogging risk based on a Weighted Naïve Bayes classifier. Sci. Total Environ. 2018, 630, 264–274. [Google Scholar] [CrossRef] [PubMed]
- Lai, C.; Chen, X.; Chen, X.; Wang, Z.; Wu, X.; Zhao, S. A fuzzy comprehensive evaluation model for flood risk based on the combination weight of game theory. Nat. Hazards 2015, 77, 1243–1259. [Google Scholar] [CrossRef]
- Zou, Q.; Zhou, J.; Zhou, C.; Song, L.; Guo, J. Comprehensive flood risk assessment based on set pair analysis-variable fuzzy sets model and fuzzy AHP. Stoch. Environ. Res. Risk Assess. 2013, 27, 525–546. [Google Scholar] [CrossRef]
- Tehrany, M.S.; Pradhan, B.; Jebur, M.N. Spatial prediction of flood susceptible areas using rule based decision tree (DT) and a novel ensemble bivariate and multivariate statistical models in GIS. J. Hydrol. 2013, 504, 69–79. [Google Scholar] [CrossRef]
- Bera, S.; Das, A.; Mazumder, T. Evaluation of machine learning, information theory and multi-criteria decision analysis methods for flood susceptibility mapping under varying spatial scale of analyses. Remote Sens. Appl. Soc. Environ. 2022, 25, 100686. [Google Scholar] [CrossRef]
- Assumpção, T.H.; Popescu, I.; Jonoski, A.; Solomatine, D.P. Citizen observations contributing to flood modelling: Opportunities and challenges. Hydrol. Earth Syst. Sci. 2018, 22, 1473–1489. [Google Scholar] [CrossRef]
- Nguyen, D.L.; Chou, T.Y.; Chen, M.H.; Hoang, T.V.; Tran, T.P.; Ngo, T.S.; Do Thi, N.A.; Bui, T.H.; Nguyen, Q.H. Flood Susceptibility Assessment in Central Region of Vietnam Based on Ensemble Fuzzy Logic and Multivariate Analysis. Urban. Archit. Constr. 2022, 13, 29–44. [Google Scholar]
- Costache, R.; Țîncu, R.; Elkhrachy, I.; Pham, Q.B.; Popa, M.C.; Diaconu, D.C.; Avand, M.; Costache, I.; Arabameri, A.; Bui, D.T. New neural fuzzy-based machine learning ensemble for enhancing the prediction accuracy of flood susceptibility mapping. Hydrol. Sci. J. 2020, 65, 2816–2837. [Google Scholar] [CrossRef]
- Pradhan, B. Flood susceptible mapping and risk area delineation using logistic regression, GIS and remote sensing. J. Spat. Hydrol. 2010, 9, 1–18. [Google Scholar]
- Fernández, D.S.; Lutz, M.A. Urban flood hazard zoning in Tucumán Province, Argentina, using GIS and multicriteria decision analysis. Eng. Geol. 2010, 111, 90–98. [Google Scholar] [CrossRef]
- Dahri, N.; Abida, H. Monte Carlo simulation-aided analytical hierarchy process (AHP) for flood susceptibility mapping in Gabes Basin (southeastern Tunisia). Environ. Earth Sci. 2017, 76, 302. [Google Scholar] [CrossRef]
- Mahmoud, S.H.; Tang, X. Monitoring prospective sites for rainwater harvesting and stormwater management in the United Kingdom using a GIS-based decision support system. Environ. Earth Sci. 2015, 73, 8621–8638. [Google Scholar] [CrossRef]
- Seejata, K.; Yodying, A.; Wongthadam, T.; Mahavik, N.; Tantanee, S. Assessment of flood hazard areas using Analytical Hierarchy Process over the Lower Yom Basin, Sukhothai Province. Procedia Eng. 2018, 212, 340–347. [Google Scholar] [CrossRef]
- Roy, S.; Bose, A.; Chowdhury, I.R. Flood risk assessment using geospatial data and multi-criteria decision approach: A study from historically active flood-prone region of Himalayan foothill, India. Arab. J. Geosci. 2021, 14, 999. [Google Scholar] [CrossRef]
- Saha, A.K.; Agrawal, S. Mapping and assessment of flood risk in Prayagraj district, India: A GIS and remote sensing study. Nanotechnol. Environ. Eng. 2020, 5, 11. [Google Scholar] [CrossRef]
- Ali, S.A.; Parvin, F.; Pham, Q.B.; Vojtek, M.; Vojteková, J.; Costache, R.; Nguyen, T.T.L.; Nguyen, H.Q.; Ahmad, A.; Ghorbani, M.A. GIS-based comparative assessment of flood susceptibility mapping using hybrid multi-criteria decision-making approach, naïve Bayes tree, bivariate statistics and logistic regression: A case of Topľa basin, Slovakia. Ecol. Indic. 2020, 117, 106620. [Google Scholar] [CrossRef]
- Pantaleoni, E.; Engel, B.A.; Johannsen, C.J. Identifying agricultural flood damage using Landsat imagery. Precis. Agric. 2007, 8, 27–36. [Google Scholar] [CrossRef]
- Parvin, F.; Ali, S.A.; Calka, B.; Bielecka, E.; Nguyen, T.T.L.; Pham, Q.B. Urban flood vulnerability assessment in a densely urbanized city using multi-factor analysis and machine learning algorithms. Theor. Appl. Climatol. 2022, 149, 639–659. [Google Scholar] [CrossRef]
- Samanta, S.; Pal, D.K.; Palsamanta, B. Flood susceptibility analysis through remote sensing, GIS and frequency ratio model. Appl. Water Sci. 2018, 8, 66. [Google Scholar] [CrossRef]
- Chaulagain, D.; Rimal, P.R.; Ngando, S.N.; Nsafon, B.E.K.; Suh, D.; Huh, J.S. Flood susceptibility mapping of Kathmandu metropolitan city using GIS-based multi-criteria decision analysis. Ecol. Indic. 2023, 154, 110653. [Google Scholar] [CrossRef]
- Mahmoud, S.H.; Gan, T.Y. Urbanization and climate change implications in flood risk management: Developing an efficient decision support system for flood susceptibility mapping. Sci. Total Environ. 2018, 636, 152–167. [Google Scholar] [CrossRef] [PubMed]
- Band, S.S.; Janizadeh, S.; Pal, S.C.; Saha, A.; Chakrabortty, R.; Melesse, A.M.; Mosavi, A. Flash flood susceptibility modeling using new approaches of hybrid and ensemble tree-based machine learning algorithms. Remote Sens. 2020, 12, 3568. [Google Scholar] [CrossRef]
- Nachappa, T.G.; Piralilou, S.T.; Gholamnia, K.; Ghorbanzadeh, O.; Rahmati, O.; Blaschke, T. Flood susceptibility mapping with machine learning, multi-criteria decision analysis and ensemble using Dempster Shafer Theory. J. Hydrol. 2020, 590, 125275. [Google Scholar] [CrossRef]
- Elkhrachy, I. Flash Flood Hazard Mapping Using Satellite Images and GIS Tools: A case study of Najran City, Kingdom of Saudi Arabia (KSA). Egypt. J. Remote Sens. Space Sci. 2015, 18, 261–278. [Google Scholar] [CrossRef]
- Kumar, P.K.D.; Gopinath, G.; Seralathan, P. Application of remote sensing and GIS for the demarcation of groundwater potential zones of a river basin in Kerala, southwest coast of India. Int. J. Remote Sens. 2007, 28, 5583–5601. [Google Scholar] [CrossRef]
- Ogden, F.L.; Raj Pradhan, N.; Downer, C.W.; Zahner, J.A. Relative importance of impervious area, drainage density, width function, and subsurface storm drainage on flood runoff from an urbanized catchment. Water Resour. Res. 2011, 47, W12503. [Google Scholar] [CrossRef]
- Saaty, T.L. Decision making with the analytic hierarchy process. Int. J. Serv. Sci. 2008, 1, 83–97. [Google Scholar] [CrossRef]
- Hoang, L.H.G.; Kato, T. Use of analytic hierarchy process and four-component instructional design for improving emergency response exercises. Int. J. Disaster Risk Reduct. 2023, 87, 103583. [Google Scholar] [CrossRef]
- Cabrera, J.S.; Lee, H.S. Flood-prone area assessment using GIS-based multi-criteria analysis: A case study in Davao Oriental, Philippines. Water 2019, 11, 2203. [Google Scholar] [CrossRef]
- Saaty, T.L. Decision Making for Leaders: The Analytical Hierarchy Process for Decisions in a Complex World, 3rd ed.; RWS Publications: Pittsburgh, PA, USA, 2012. [Google Scholar]
- Yadollahi, M.; Rosli, M.Z. Development of the Analytical Hierarchy Process (AHP) method for rehabilitation project ranking before disasters. WIT Trans. Built Environ. 2011, 119, 209–220. [Google Scholar] [CrossRef]
- Nivolianitou, Z.; Synodinou, B.; Manca, B. Flood Disaster Management with the Use of Ahp. Int. J. Multicriteria Decis. Mak. 2015, 5, 152–164. [Google Scholar] [CrossRef]
- Saaty, T.L. How to make a decision: The Analytic Hierarchy Process. Eur. J. Oper. Res. 1990, 48, 9–26. [Google Scholar] [CrossRef]
- Avand, M.; Moradi, H.; Lasboyee, M.R. Spatial modeling of flood probability using geo-environmental variables and machine learning models, case study: Tajan watershed, Iran. Adv. Space Res. 2021, 67, 3169–3186. [Google Scholar] [CrossRef]
- Arabameri, A.; Rezaei, K.; Cerdà, A.; Conoscenti, C.; Kalantari, Z. A comparison of statistical methods and multi-criteria decision making to map flood hazard susceptibility in Northern Iran. Sci. Total Environ. 2019, 660, 443–458. [Google Scholar] [CrossRef]
- Yesilnacar, E.; Topal, T. Landslide susceptibility mapping: A comparison of logistic regression and neural networks methods in a medium scale study, Hendek region (Turkey). Eng. Geol. 2005, 79, 251–266. [Google Scholar] [CrossRef]
- Tran, D.; Xu, D.; Dang, V.; Fadelelseed, S. Exploring the Relationships between Impervious Surface Percentage and Frequency of Urban Waterlogging: A Case Study in Hanoi, Vietnam. IOP Conf. Ser. Earth Environ. Sci. 2020, 440, 052073. [Google Scholar] [CrossRef]
- Burton, I.; Kates, R.W.; White, G.F. The Environment as Hazard, 2nd ed.; Oxford University Press: Oxford, UK; University of California: Los Angeles, CA, USA, 1993. [Google Scholar]
- Chuan, G.K. The Climate of Southeast Asia. In the Physical Geography of Southeast Asia; Gupta, A., Ed.; Oxford University Press: Oxford, UK; New York, NY, USA, 2005. [Google Scholar] [CrossRef]
- Association of Southeast Asian Nations (ASEAN). Asean Sustainable Urbanisation Report: Sustainable Cities Towards 2025 and Beyond; ASEAN Secretariat Community Relations Division (CRD): Jakarta, Indonesia, 2022. [Google Scholar]
- Dekker, G.; Gutterer, B.; McNamara, I.; Westermann, J.; Wilk-Pham, A. Responding to Urban Water Challenges in Southeast Asia: Introducing Polycentric Management Approaches to Create Resilient, Water-Sensitive Cities; Gutterer, B., Misselwitz, P., Ribbe, L., Eds.; BORDA e.V.: Bremen, Germany, 2021. [Google Scholar]
- Association of Southeast Asian Nations (ASEAN). Towards Strengthening Cooperation for Urban Resilience in ASEAN: Scoping Paper Focusing on Aspects of Climate Change Adaptation, Disaster Risk Management, and Sustainable Urban Development; ASEAN Secretariat Community Relations Division (CRD): Jakarta, Indonesia, 2024. [Google Scholar]
- Makonyo, M.; Msabi, M.M. Identification of groundwater potential recharge zones using GIS-based multi-criteria decision analysis: A case study of semi-arid midlands Manyara fractured aquifer, North-Eastern Tanzania. Remote Sens. Appl. Soc. Environ. 2021, 23, 100544. [Google Scholar] [CrossRef]
- Zhao, G.; Pang, B.; Xu, Z.; Yue, J.; Tu, T. Mapping flood susceptibility in mountainous areas on a national scale in China. Sci. Total Environ. J. 2018, 615, 1133–1142. [Google Scholar] [CrossRef] [PubMed]
- Arabameri, A.; Danesh, A.S.; Santosh, M.; Cerda, A.; Pal, S.C.; Ghorbanzadeh, O.; Roy, P.; Chowdhuri, I. Flood susceptibility mapping using meta-heuristic algorithms. Geomat. Nat. Hazards Risk 2022, 1, 949–974. [Google Scholar] [CrossRef]
- Hong, H.; Tsangaratos, P.; Ilia, I.; Liu, J.; Zhu, A.X.; Chen, W. Application of fuzzy weight of evidence and data mining techniques in construction of flood susceptibility map of Poyang County, China. Sci. Total Environ. 2018, 625, 575–588. [Google Scholar] [CrossRef] [PubMed]
- Abinet, A. GIS-based flood susceptibility mapping using frequency ratio and information value models in upper Abay river basin, Ethiopia. Nat. Hazards Res. J. 2023, 3, 247–256. [Google Scholar] [CrossRef]
- Razavi-Termeh, S.V.; Seo, M.B.; Sadeghi-Niaraki, A.; Choi, S.M. Flash flood detection and susceptibility mapping in the Monsoon period by integration of optical and radar satellite imagery using an improvement of a sequential ensemble algorithm. Weather. Clim. Extrem. 2023, 41, 100595. [Google Scholar] [CrossRef]
Figure 1.
(a) Location of study area in Vietnam. (b) Surface-water system of the study area. (c) Historic flood locations (2012–2018).
Figure 1.
(a) Location of study area in Vietnam. (b) Surface-water system of the study area. (c) Historic flood locations (2012–2018).

Figure 2.
Average monthly rainfall and humidity in Hanoi in 2018.

Figure 3.
Flood-conditioning factors: (a) TWI. (b) elevation. (c) slope. (d) precipitation. (e) LULC. (f) NDVI. (g) distance from streams. (h) distance from roads. (i) drainage density.
Figure 3.
Flood-conditioning factors: (a) TWI. (b) elevation. (c) slope. (d) precipitation. (e) LULC. (f) NDVI. (g) distance from streams. (h) distance from roads. (i) drainage density.

Figure 5.
Evaluation of the model based on the AUC value.

Figure 6.
Flood-susceptibility map of Hanoi.

Figure 7.
AUC value of the model.

Figure 8.
(a) Analysis of Hanoi’s urban planning map for 2030. (b) Flood-susceptibility map in Hanoi’s 12 central districts.
Figure 8.
(a) Analysis of Hanoi’s urban planning map for 2030. (b) Flood-susceptibility map in Hanoi’s 12 central districts.

Table 1.
Data sources for the study.
| № | Dataset | Source | Classification Methods |
|---|---|---|---|
| 1 | SRTM DEM | https://earthexplorer.usgs.gov/, accessed on 1 May 2023. | |
| 2 | Elevation | https://earthexplorer.usgs.gov/, accessed on 20 May 2023. | Natural break |
| 3 | Distance from streams | SRTM DEM | Supervised classification |
| 4 | Slope | SRTM DEM | Supervised classification |
| 5 | NDVI | Landsat 8 The United States Geological Survey (http://www.usgs.gov/, accessed on 1 June 2023) | Natural break |
| 6 | LULC | https://earthexplorer.usgs.gov/, accessed on 31 May 2023. | Supervised classification |
| 7 | Distance from roads | Open street map/Field survey | Manual |
| 8 | Precipitation | High-resolution gridded datasetsClimatic Research Unit (CRU) | Natural break |
| 9 | Drainage density | SRTM DEM | Natural break |
| 10 | TWI | SRTM DEM | Natural break |
Table 2.
Classes and rating of the flood-conditioning factors.
| Class Rating | Factor | ||||||||
|---|---|---|---|---|---|---|---|---|---|
| TWI | Elevation | Slope | Precipitation | LULC | NDVI | Distance from Streams | Distance from Roads | Drainage Density | |
| 1 | <−16 | >59 | >28 | <16 | Vegetation | >0.3 | >10,000 | >5000 | <0.25 |
| 2 | −16–(−13) | 31–59 | 5–28 | 16–16.2 | Base soil | 0.2–0.3 | 1000–10,000 | 1500–5000 | 0.25–0.5 |
| 3 | −13–(−6) | 8–31 | 2–5 | 16.2–16.4 | Agriculture | 0.1–0.2 | 500–1000 | 500–1500 | 0.5–0.75 |
| 4 | −6–2 | −6–8 | 1–2 | 16.4–16.6 | Settlements | 0.01–0.1 | 250–500 | 100–500 | 0.75–1 |
| 5 | >2 | <−6 | <1 | >16.6 | Water body | <0.01 | <250 | <100 | >1 |
Table 3.
Random consistency indices for randomly generated matrices [19].
Table 3.
Random consistency indices for randomly generated matrices [19].
| n | 3 | 4 | 5 | 6 | 7 | 8 | 9 | 10 | 11 |
|---|---|---|---|---|---|---|---|---|---|
| RI | 0.58 | 0.9 | 1.12 | 1.24 | 1.32 | 1.41 | 1.45 | 1.49 | 1.51 |
Table 4.
Classes and ratings of the flood-conditioning factors.
| TWI | Elevation | Slope | Precipitation | LULC | NDVI | Distance from Streams | Distance from Roads | Drainage Density | |
|---|---|---|---|---|---|---|---|---|---|
| TWI | 1 | 1 | 3 | 1 | 1 | 1 | 1 | 1 | 3 |
| Elevation | 1 | 1 | 2 | 1/2 | 1/3 | 1/2 | 1/2 | 1/3 | 2 |
| Slope | 1/3 | 1/2 | 1 | 1/2 | 1/3 | 1/3 | 1 | 1/2 | 1 |
| Precipitation | 1 | 2 | 2 | 1 | 1/3 | 1/2 | 1/2 | 1/3 | 1 |
| LULC | 1 | 3 | 3 | 3 | 1 | 2 | 2 | 1 | 3 |
| NDVI | 1 | 2 | 3 | 2 | 1/2 | 1 | 1/2 | 1/3 | 1 |
| Distance from streams | 1 | 2 | 1 | 2 | 1/2 | 2 | 1 | 1 | 3 |
| Distance from roads | 1 | 3 | 2 | 3 | 1 | 3 | 1 | 1 | 4 |
| Drainage density | 1/3 | 1/2 | 1 | 1 | 1/3 | 1 | 1/3 | 1/4 | 1 |
Table 5.
Normalized pairwise comparison matrix.
| TWI | Elevation | Slope | Precipitation | LULC | NDVI | Distance from Streams | Distance from Roads | Drainage Density | |
|---|---|---|---|---|---|---|---|---|---|
| TWI | 0.130 | 0.067 | 0.167 | 0.071 | 0.188 | 0.088 | 0.128 | 0.174 | 0.158 |
| Elevation | 0.130 | 0.067 | 0.111 | 0.036 | 0.063 | 0.044 | 0.064 | 0.058 | 0.105 |
| Slope | 0.043 | 0.033 | 0.056 | 0.036 | 0.063 | 0.029 | 0.128 | 0.087 | 0.053 |
| Precipitation | 0.130 | 0.133 | 0.111 | 0.071 | 0.063 | 0.044 | 0.064 | 0.058 | 0.053 |
| LULC | 0.130 | 0.200 | 0.167 | 0.214 | 0.188 | 0.176 | 0.255 | 0.174 | 0.158 |
| NDVI | 0.130 | 0.133 | 0.167 | 0.143 | 0.094 | 0.088 | 0.064 | 0.058 | 0.053 |
| Distance from streams | 0.130 | 0.133 | 0.056 | 0.143 | 0.094 | 0.176 | 0.128 | 0.174 | 0.158 |
| Distance from roads | 0.130 | 0.200 | 0.111 | 0.214 | 0.188 | 0.265 | 0.128 | 0.174 | 0.211 |
| Drainage density | 0.043 | 0.033 | 0.056 | 0.071 | 0.063 | 0.088 | 0.043 | 0.043 | 0.053 |
Table 6.
Weight and rank of flood-conditioning factors.
| Factors | Weight | Rank |
|---|---|---|
| TWI | 0.130 | 4 |
| Elevation | 0.075 | 7 |
| Slope | 0.059 | 8 |
| Precipitation | 0.08 | 6 |
| LULC | 0.185 | 1 |
| NDVI | 0.103 | 5 |
| Distance from streams | 0.132 | 3 |
| Distance from roads | 0.18 | 2 |
| Drainage density | 0.055 | 9 |
Table 7.
Flood-susceptibility classification of Hanoi’s 12 central districts.
| Level | Low | Moderate | High | Very High | Total |
|---|---|---|---|---|---|
| Area (km2) | 47.158 | 401.407 | 110.897 | 0.334 | 559.796 |
Disclaimer/Publisher’s Note: The statements, opinions and data contained in all publications are solely those of the individual author(s) and contributor(s) and not of MDPI and/or the editor(s). MDPI and/or the editor(s) disclaim responsibility for any injury to people or property resulting from any ideas, methods, instructions or products referred to in the content. |
© 2024 by the authors. Licensee MDPI, Basel, Switzerland. This article is an open access article distributed under the terms and conditions of the Creative Commons Attribution (CC BY) license (https://creativecommons.org/licenses/by/4.0/).
Share and Cite
MDPI and ACS Style
Nguyen, H.N.; Fukuda, H.; Nguyen, M.N. Assessment of the Susceptibility of Urban Flooding Using GIS with an Analytical Hierarchy Process in Hanoi, Vietnam. Sustainability 2024, 16, 3934. https://doi.org/10.3390/su16103934
AMA Style
Nguyen HN, Fukuda H, Nguyen MN. Assessment of the Susceptibility of Urban Flooding Using GIS with an Analytical Hierarchy Process in Hanoi, Vietnam. Sustainability. 2024; 16(10):3934. https://doi.org/10.3390/su16103934
Chicago/Turabian StyleNguyen, Hong Ngoc, Hiroatsu Fukuda, and Minh Nguyet Nguyen. 2024. "Assessment of the Susceptibility of Urban Flooding Using GIS with an Analytical Hierarchy Process in Hanoi, Vietnam" Sustainability 16, no. 10: 3934. https://doi.org/10.3390/su16103934
Note that from the first issue of 2016, this journal uses article numbers instead of page numbers. See further details here.