
Study on Early Identification of Rainfall-Induced Accumulation Landslide Hazards in the Three Gorges Reservoir Area

1
Wuhan Center, China Geological Survey (Geosciences Innovation Center of Central South China), Wuhan 430205, China
2
Institute of Geological Survey, China University of Geosciences (Wuhan), Wuhan 430074, China
3
Hubei Key Laboratory of Operation Safety of High Dam and Large Reservoir (China Three Gorges Corporation), Yichang 443133, China
*
Author to whom correspondence should be addressed.
Remote Sens. 2024, 16(10), 1669; https://doi.org/10.3390/rs16101669
Submission received: 19 March 2024
/
Revised: 1 May 2024
/
Accepted: 2 May 2024
/
Published: 8 May 2024
(This article belongs to the Special Issue Advancements in Remote Sensing and Artificial Intelligence for Geohazards)
Abstract
:The early identification of potential hazards is crucial for landslide early warning and prevention and is a key focus and challenging issue in landslide disaster research. The challenges of traditional investigation and identification methods include identifying potential hazards of landslides triggered by heavy rainfall and mapping areas susceptible to landslides based on rainfall conditions. This article focuses on the problem of early identification of rainfall-induced accumulation landslide hazards and an early identification method is proposed, which is “first identifying the accumulation that is prone to landslides and then determining the associated rainfall conditions”. This method is based on identifying the distribution and thickness of accumulation, analyzing the rainfall conditions that trigger landslides with varying characteristics, and establishing rainfall thresholds for landslides with different accumulation characteristics, ultimately aiming to achieve early identification of accumulation landslide hazards. In this study, we focus on the Zigui section of the Three Gorges Reservoir as study the area, and eight main factors that influence the distribution and thickness of accumulation are extracted from multi-source data, then the relative thickness information extraction model of accumulation is established by using the BP neural network method. The accumulation distribution and relative thickness map of the study area are generated, and the study area is divided into rocky area (less than 1 m), thin (1 to 5 m), medium (5 to 10 m), and thick area (thicker than 10 m) according to accumulation thickness. Rainfall is a significant trigger for landslide hazards. It increases the weight of the sliding mass and decreases the shear strength of soil and rock layers, thus contributing to landslide events. Data on 101 rainfall-induced accumulation landslides in the Three Gorges Reservoir area and rainfall data for the 10 days prior to each landslide event were collected. The critical rainfall thresholds corresponding to a 90% probability of landslide occurrence with different characteristics were determined using the I-D threshold curve method. Prediction maps of accumulation landslide hazards under various rainfall conditions were generated by analyzing the rainfall threshold for landslides in the Three Gorges Reservoir area, serving as a basis for early identification of rainfall-induced accumulation landslides in the region. The research provides a method for the early identification of landslides caused by heavy rainfall, delineating landslide hazards under different rainfall conditions, and providing a basis for scientific responses, work arrangements, and disaster prevention and mitigation of landslides caused by heavy rainfall.
1. Introduction
The Three Gorges Reservoir area is highly prone to geological disasters in China, especially landslides. Rainfall is the main triggering factor for geological disasters, as evidenced by the flood seasons of 1981, 1982, 1998, 2014, and 2017, all characterized by extreme rainfall. Rainfall not only induces deformation or even reactivation and remobilization of old landslides but also generates a large number of new landslides. For example, on 31 August 2014, according to NASA’s global rainfall observation data, the maximum daily rainfall reached 214 mm. A total of 2340 geological disasters occurred in five districts and counties: Yunyang, Fengjie, Wushan, Wuxi, and Kaixian. About 90% of these were new landslides, which were not under the control of geological disaster monitoring and early warning systems, potentially resulting in mass fatalities and injuries, as illustrated by the Yunyang Huangsabao landslide that claimed 11 lives.
The early identification of potential landslide hazards is of great practical significance for disaster early warning and prevention [1]. In recent years, modern remote sensing technology has played an important role in the identification of geological hazards [2]. Multi-source remote sensing techniques, such as InSAR, optical remote sensing, and LiDAR, are the primary methods for early landslide identification. InSAR technology identifies potential geological hazards by capturing subtle ground surface deformations over a wide area. This capability makes it a crucial tool for identifying potential hazards. Ran et al. [3] identified active landslides using Small Baseline Subset InSAR (SBAS-InSAR) and ascending and descending Sentinel-1 data. Zhang et al. [4] used SBAS-InSAR and PS-InSAR time series processing methods to identify landslide hazards. However, InSAR technology faces challenges in effectively detecting landslide hazards with rapid deformation rates, and identifying landslide hazards without deformation features is even more challenging.
Optical remote sensing interpretation extracts geological environmental information about landslides from remote sensing image features and retrieves information such as their location, morphology, boundary range, and other characteristics [5]. Xu et al. [6] obtained comprehensive post-earthquake multi-source remote sensing images in the study area and used visual interpretation methods to identify seismic secondary geological disasters such as collapses, landslides, and debris flows. Kyriou et al. [7], based on the Markov random field, used digital processing technology (PCA, ICA) and automatic change detection procedures to monitor land surface changes to identify landslides. The optical remote sensing interpretation method can identify landslides with more distinct geomorphic features, and it is particularly effective in identifying landslides that have recently occurred. Nevertheless, identifying landslide hazards becomes more challenging when there are minimal signs of surface deformation or high vegetation cover [8].
LiDAR technology identifies and monitors hazardous areas through the measurement of surface elevation changes and the classification of point cloud data. The focus lies on identifying hazardous areas within vegetation-covered regions. By removing the vegetation, surface topography and geomorphological features become more accurately visible. Moar [9] presents a method based on fusion probability change detection and landslide surface feature extraction and uses a multi-temporal LiDAR-derived digital elevation model (DEM) to map land surface changes showing landslide activity. LiDAR mapping operations face harsh and costly conditions, making it challenging to conduct comprehensive geologic hazard identification [10].
Integrating multiple technology tools and diverse data sources enhances the effectiveness of landslide hazard identification. Xu et al. [2] proposed organically combining traditional geological surveys with modern technologies (LiDAR, airborne geophysical exploration, semi-airborne geophysical exploration, etc.), which improves the identification efficiency and accuracy of instability slopes that are most difficult to find. Ge et al. [11], from the perspective of optical remote sensing, InSAR, LiDAR, and other integrated remote sensing measurements, put forward the observation content of “morphology, deformation, situation “, qualitatively identifying the location of disaster hazard, quantitatively monitoring the magnitude of deformation magnitudes, and relying on the integrated remote sensing dynamic monitoring data to enhance the ability to identify the geologic hazards. Wang et al. [12] practiced the integrated space–air–ground integrated synthetic aperture radar Interferometry (InSAR) and laser detection and ranging (LiDAR) techniques for landslide hazard identification in the Jiuzhaigou area and verified the accuracy and reliability of the integrated use of InSAR and LiDAR techniques for identifying and analyzing high-level landslide hazards. Currently, the application of machine learning for identifying geological hazards has emerged as a prominent research focus [2]. Wu et al. [13] developed a high-performance loess landslide early identification model based on convolutional neural networks (CNNs). Chen et al. [14] used ZY-3 high spatial resolution (HSR) satellite images to establish an object-oriented landslide mapping model based on random forest (RF) and mathematical methods to finally determine the landslide boundary. Zheng et al. [1] used different machine learning methods to identify potentially active landslides in the Jinshajiang River, characterizing the morphology and texture features of landslides by combining 17 landslide influencing factors, and obtained that Normalized Difference Vegetation Index (NDVI), slope and weathering degree play an integral role in machine learning and identification of landslide hazards, and identifying potentially active landslides sites more accurately.
The assessment of soil thickness plays a primary role in different areas of the geosciences, including landslide hazards and soil erosion assessment [15]. There are various types of soil thickness prediction models. Geomorphology, statistical methods, and machine learning have all been studied for predicting soil thickness. Various authors have used geomorphology (slope, curvature, or elevation) to predict soil thickness (Catani et al., 2010, Salciarini et al., 2006) [16,17]. Additionally, many authors have predicted soil thickness through improved geomorphological models (Soldato et al., 2018, Vita et al., 2013) [18,19] and applied it to an area with pyroclastic soil cover. Authors have also used multivariate statistical models to predict soil thickness (Basharat et al., 2018, Tsai et al., 2001) [20,21], and used machine learning algorithms to predict soil thickness maps at different scales (Lagomarsino et al., 2017, Lacoste et al., 2016) [22,23].
The current mainstream landslide hazard identification methods and tools primarily rely on surface features, which are not always evident or present for the early identification of new landslide hazards. There are landslide hazards that go undetected and cannot be used directly as a means of early identification of new landslides. This study presents a novel method for the early identification of rainfall-induced accumulation landslide hazards. According to comprehensive literature, few studies have utilized multi-source data to predict soil thickness, particularly remote sensing image data. This article constructs an accumulation classification model based on multi-source data, integrates geological, topographic, and remote sensing image data, and uses machine learning models to effectively predict the distribution and relative thickness of accumulation. Conducting a combined analysis of the relative thickness of accumulation and rainfall thresholds for landslides in different accumulation types to identify areas of accumulation with a higher probability of landslides under various rainfall conditions. The paper presents a novel method for predicting the relative thickness of accumulation, which is scientifically reasonable for early identification of rainfall-induced landslides and partially addresses the issue of undiscovered landslide areas.
2. Research Methods
2.1. Technical Route
Under heavy rainfall conditions, the distribution and thickness of accumulation are decisive factors affecting slope stability. The primary and crucial challenge in identifying accumulation landslide hazards is to obtain spatial information on the distribution and thickness of accumulation. Due to the scattered and small-scale distribution of accumulation, they are not reflected on existing geological maps at a scale of 1:50,000. This study is built upon the research theory proposed by Johnson et al. [24] (2005), which conceptualizes the thickness of the accumulation as a result of deepening processes, buildup, and removals. Multi-source data including geological maps, topographic maps, and remote sensing images were utilized to extract the distribution and relative thickness evaluation factors of accumulation in the study area. The accumulation distribution zoning model was constructed using the BP neural network classification method, and a spatial distribution map of the relative thickness of accumulation was generated. This map classified the study area into areas of rocky area (less than 1 m), thin (1 to 5 m), medium (5 to 10 m), and thick area (thicker than 10 m) to delineate potential locations of rainfall-induced accumulation landslide hazards.
Subsequently, the rainfall characteristics of landslides induced by different types of accumulation were studied to determine the rainfall conditions conducive to landslides induced by accumulation with different characteristics. The profiles of rainfall-induced landslides in the study area were collected along with their rainfall monitoring data. The expressions of I-D threshold curves for rainfall-induced landslides with varying probabilities of occurrence were fitted to derive the rainfall thresholds for landslides with a 90% probability of occurrence, considering different sizes, lithologies, and slope conditions. Finally, by integrating the spatial distribution of the relative thickness of accumulation, spatial distribution maps of areas susceptible to accumulation landslide hazards under different rainfall conditions were obtained and analyzed. The aim is to determine the rainfall conditions under which accumulation landslides occur with different characteristics.
Figure 1 illustrates the technical process of extracting accumulation distribution and thickness information based on multi-source data, as well as the prediction of accumulation landslide hazards under different rainfall-induced conditions. The research process is outlined as follows.
- Collect remote sensing image data, such as digital mapping camera (DMC) image data and Landsat image data, landslide ground survey and exploration data, topographic maps, geological maps, and historical rainfall data in the study area;
- Organize and analyze data and obtain sample accumulation distribution and thickness data through remote sensing interpretation and survey information. The stratigraphic lithology, elevation, slope, aspect, Normalized Difference Vegetation Index (NDVI), water system multi-ring buffer zone, brightness in image spectral features, and gray-level co-occurrence matrix contrast (GLCM contrast) in image texture features were used as slope thickness evaluation factors;
- Develop a BP neural network classification model for determining the relative thickness of accumulation, estimate the relative thickness across the study area, and create a spatial distribution map illustrating the relative thickness variations within the study area;
- Rainfall thresholds for various landslide characteristics and a 90% probability of occurrence for different rainfall durations were derived by fitting the reservoir landslide characterization data;
- The predictive outcomes of the spatial distribution of relative accumulation thickness in the study area were combined with the findings on rainfall thresholds to determine the potential hazards of accumulation landslides, with a 90% probability of occurrence under varying rainfall conditions.
2.2. BP Neural Networks
The BP neural network, a multilayer feedforward neural network, features fully connected neurons between layers, with no connections between neurons within each layer. This algorithm, proposed by David Runelhart et al. in 1986, stands as one of the most widely utilized machine learning algorithms [25,26].
The learning algorithm of the BP neural network employs the steepest descent method to iteratively update the network’s weights and thresholds via backpropagation, aiming to minimize the classification error rate. Its primary characteristic lies in the forward propagation of signals coupled with the backward propagation of errors. Through iterative weight adjustments across layers via this propagation process, the neural network undergoes training. The training continues until the network reaches either the predetermined number of training iterations or an acceptable performance threshold, resulting in a BP neural network trained on the provided samples.
As an example of a single hidden layer of a BP neural network (Figure 2), the principle is as follows:
- Initialize the network: initialize the input and hidden layers, as well as the connection weights and between neurons in the output layer, initialize the hidden layer and the output thresholds a, b, and set the learning rate and activation function;
- Calculate the implied layer output: , a are the connection weights between the input layer and the implied layer and the implied layer threshold, respectively, and the implied layer output H is calculated as:
- ƒ is the implicit layer activation function;
- Calculate the output layer: H is the output of the hidden layer, and the predicted output Y of the BP network is:
- Calculation of the error: the error e is calculated as:
- where is the actual expected value;
- Update weights:
- η is the learning rate and is the external input data;
- Threshold update: Update the thresholds a,b of the network according to the prediction error e:
- Determine if the iteration can end. If the iteration has not ended, return to step 2 until the algorithm ends. Here, steps 1 to 3 represent the feed-forward process of the signal, while steps 4 to 7 represent the process of updating the parameters of the neural network in reverse.
2.3. I-D Rainfall Threshold
Rainfall is one of the most important external factors inducing landslides in reservoir areas, and the rainfall threshold is the key to landslide early warning and prediction. The effective rainfall of landslides occurring in the preceding period is calculated according to the effective rainfall formula proposed by Crozier (1986) [27], which is:
where is the effective rainfall; is the rainfall on the day of the landslide; n is the number of days before the landslide, is the rainfall n days before the landslide, and is the effective rainfall coefficient. The effective rainfall coefficient is taken as an empirical value of 0.84.
The rainfall intensity–rainfall duration (I-D) relationship threshold can be expressed by the following equation [28]:
where is the intensity of rainfall (mm/h); the peak rainfall intensity is taken for short duration, and the average rainfall is taken for long duration; is the rainfall holding time (h); , are statistical parameters; and ≥ 0.
The rainfall duration and intensity of landslides were plotted in an I-D double logarithmic coordinate system, and rainfall threshold curves were fitted according to different probabilities of landslide occurrence. Using the landslide rainfall threshold curve expression, the critical rainfall amount for landslides with different probabilities of occurrence can be calculated for different geologic features and different rainfall calendar times.
3. Accumulation Distribution and Relative Thickness Extraction
3.1. Study Area
This work takes the Zigui section of the Three Gorges Reservoir area as an example. The study area is located in the mountainous area of Western Hubei Province, in the transition zone from the second to the third step of China’s topography. The geographic location of the study area is shown in Figure 3. It is the confluence of the Eastern Sichuan fold and the Western Hubei mountainous area, and is characterized by a medium and low mountain erosion canyon landform [29]. The strata in the study area were relatively well developed, and the Aurignacian to Quaternary strata were exposed. The strata in this area are diverse in lithology and complex in structure, providing conditions for the development of geological disasters, and some strata (such as the Badong Formation and Jurassic strata) are known as slip-prone strata [30,31]. In the study area east of the Xiangxi River, strata older than the Triassic, predominantly carbonate rocks are continuously exposed. West of the Xiangxi River, the exposed strata are primarily from the Middle Triassic to Jurassic (T_2-J), consisting predominantly of clastic rocks including sandstone, siltstone, and shale. In the study area, the Xintan landslide took place in 1985, the Qianjiangping landslide in 2003 [32,33], as well as the Yangjiawan landslide and the Shanshucao landslide that occurred during heavy rainfall in 2014, and the Yanguan landslide and the Bobao landslide that occurred during prolonged rainfall in 2017.
3.2. Relative Thickness Evaluation Factor Extraction
Under the condition of heavy rainfall, the distribution of accumulation and thickness are the decisive factors affecting the stability of slopes, and for the identification of the potential hazards of new landslides, the primary and key issue is to obtain information on the distribution of the accumulation and estimate its thickness from space. Based on the research theory of Johnson et al. (2005), accumulation thickness can be generalized as a function of deepening processes, upbuilding, and removals [24].
Deepening refers to the process of accumulation of thickness increase from the bottom down due to the weathering of the bottom bedrock. Upbuilding refers to the process of increasing the accumulation thickness from the surface layer upwards due to sedimentation and organic matter accumulation. Removals refer to the process of accumulation erosion and other effects that cause the accumulation to be lost or dissolved, resulting in quality loss. The weathering characteristics of different lithological strata vary greatly, and this variation controls the speed of accumulation deepening. The landslides in the study area mainly occurred in clastic rock formations, especially in the Jurassic sand–shale interbedded rock group, which had low rock strength and weak weathering resistance, forming a relatively thick accumulation overburden. Secondly, the sloping terrain in mountainous areas controls the removal and upbuilding process of accumulation, and the gentle slope area is conducive to the upbuilding of rock-weathered debris, forming a relatively thick loose accumulation. Weathered material generally undergoes a downward removal process along slopes. Thus, the back edge of the slope is dominated by weathering and denudation with relatively thin accumulation; the front edge is dominated by accumulation with relatively thick accumulation. In addition, steep slopes are dominated by denudation with a thin accumulation cover, while gentle slopes are dominated by accumulation with a greater accumulation thickness. Furthermore, land use type or human engineering activities also affect the removals, upbuilding, and even the bottom weathering process of the accumulation. Remote sensing images effectively record the surface land use type and human activity characteristics. Therefore, this paper obtains the zoning factors of accumulation distribution from geological maps, topographic maps, and remote sensing images, and extracts a total of eight main factors that control and affect accumulation distribution and thickness. Combined with landslide exploration information, ground exploration, high-resolution remote sensing interpretation, etc., accumulation distribution and thickness samples were obtained for machine learning and model construction.
3.2.1. Geological Factor Map
Lithology is one of the controlling factors for the thicknesses of accumulation. Carbonate rocks are exposed in the study area east of the Xiangxi River, exhibiting high rock strength and resistance to weathering, with a thin accumulation cover and even bedrock outcrops. West of the Xiangxi River, clastic rocks dominate, comprising sandstone, siltstone, and shale lithologies. With low rock strength and weak resistance to weathering, the rocks form a relatively thick accumulation cover. Therefore, this study considers the engineering geological rock group as the evaluation factor and divides the study area into clastic rocks and carbonate rocks.
3.2.2. Topographic Factor Map
Accumulation removals and upbuilding are influenced by the terrain slope, with gentle slopes promoting the accumulation of rock weathering debris, facilitating the formation of a thicker accumulation cover. Soil thickness values exhibit an inverse proportionality with slope gradient. This principle is widely accepted (Saulnier et al. 1997; Blesius et al. 2009) [34,35]. Steep slopes are characterized by denudation, resulting in a thin accumulation cover, often exposing bedrock outcroppings in steep ridges or cliffs. Consequently, it was chosen as one of the factors for evaluating accumulation thickness. Accumulation in the study area is primarily distributed in slope areas below 35°, predominantly consisting of medium and gentle slopes. Slopes exceeding 60° typically expose bedrock. Soil thickness values are inversely proportional to the elevation (Saulnier et al. 1997) [34]. Elevation changes indirectly impact bedrock weathering and the distribution of slope deposit accumulation. Accelerated weathering and soil development on slopes with different slope aspects have been explored (Jason et al. 2001) [36]. Slopes with varying aspects receive different levels and durations of solar radiation exposure, resulting in variations in water evaporation, vegetation coverage, and mountain rock mass weathering, consequently influencing the distribution of accumulation thickness. The debris on slopes undergoes a process of removal and upbuilding from top to bottom. In general, the overburden also has a tendency to thicken from top to bottom, so the multi-ring buffer zone of the water system is used as one of the evaluation factors of accumulation thickness.
In conjunction with the above analysis of topographic factors influencing the control of accumulation removal and upbuilding, four topographic factor thematic maps were produced using topographic maps with topographic factors such as slope, aspect, elevation, and multi-ring buffer zone of the water system extracted in ArcGIS.
3.2.3. Remote Sensing Factor Map
Surface objects and their combined characteristics can reflect the distribution and thickness of accumulation. The thin and rocky area of the study area is usually covered by high vegetation, while cultivated land, bare land, and residential areas, with little or no vegetation, are medium and thick accumulation areas. Yang et al. (2020) concluded that, in general, the thickness of the Quaternary cover becomes progressively thinner with increasing NDVI values [37]. Ye et al. (2021) concluded that the degree of landslide development was positively correlated with the change in land use intensity, and the land use intensity in the landslide area was higher than that in the non-landslide area [38].
NDVI can indicate the regional vegetation cover, so Landsat near-infrared band (Band4) and red light band (Band3) data were selected to extract the NDVI data of the study area through band calculation. The combination of cultivated land, bare land, and residential areas in remote sensing images exhibit distinct spectral and textural characteristics that correspond to specific land cover types. Image segmentation and object-oriented information extraction techniques study the relationship between accumulation thickness and the feature combination. The multi-scale segmentation algorithm effectively captures the spatial relationship between image neighborhoods and offers a more flexible representation, making it highly valuable for refining image information [39]. The principle involves adaptively simulating and clustering the neighborhood relationship (context content) of each pixel through multi-scale strategies [40]. The multi-scale segmentation algorithm is used to cluster pixels with similar spectral and texture features into one object, and the brightness in the spectral features of the segmented objects and the gray-level co-occurrence matrix contrast (GLCM contrast) in the texture features are selected and calculated as accumulation distribution and thickness zoning factors. The classification method is the natural breaks (jenks) classification, which identifies the classification intervals that most appropriately group similar values and maximize the differences between classes. The evaluation factors and reclassification results are shown in Figure 4.
The thickness and distribution locations of accumulation were obtained from 52 landslide survey data in the study area, visually interpreted using DMC aerial image data with a spatial resolution of 0.2 m and combined with field investigations to obtain the sample data from thin and rock areas. The total area of the study area was 304.33 (excluding the river area), of which the total area of accumulation thickness training samples was 14.67 , which was 4.82% of the total area of the study area. Sample locations and relative thicknesses of accumulation are shown in Figure 5.
Factors were extracted to compare and analyze the variability of each eigenvalue in regions with different accumulation thicknesses and the corresponding factor ranges shown in Table 1.
- Analyzing Table 1 yields the following conclusions:
- The extracted factors influencing accumulation thickness generally exhibit differences. These factors’ values vary significantly across various accumulation thickness areas. For example, the lithology factor shows a higher percentage of clastic rocks in medium and thick accumulation areas compared to rocky and thin accumulation areas, whereas the opposite is true for carbonate rocks.
- Among these factors, NDVI, brightness, elevation, lithology, slope, and distance to water exhibit significant differences among each accumulation thickness type, which are crucial for constructing the classification model for accumulation relative thickness. The aspect and GLCM contrast do not show significant differences among the four types of accumulation, but the differences are higher in rocky areas and thick accumulation areas, hence they can be used for the establishment of classification models.
- Regarding lithological factors, the percentage of clastic rocks gradually increases, while carbonates gradually decrease across the four regions. Most of the medium and thick accumulation areas in the elevation factor lie below 388m, whereas rocky areas are predominantly situated above this elevation. Thin accumulation areas are distributed across all three elevation ranges, with the majority located below 650 m. The majority of rocky areas in the slope factor exhibit slopes higher than 35°, whereas slopes in the other three areas mostly fall below 35°. The aspect factor generally exhibits a moderate level of influence, with the percentage of sunny and shady slopes being similar across all factors. However, there are some differences in slope direction between rocky areas and thick accumulation areas. The majority of areas in the medium and thick accumulation areas in the distance to water factor are situated within 400 m of water, whereas rocky and thin areas are typically located beyond this distance. The NDVI factor generally exhibits small NDVI values in the medium and thick accumulation areas, whereas rocky and thin areas demonstrate high NDVI values, often exceeding 0.5. The brightness factor plot in Table 1 illustrates that medium and thick accumulation areas exhibit higher brightness values, whereas rocky and thin accumulation areas show lower brightness values. The GLCM contrast factor generally influences the model, but the values in rocky areas are significantly smaller than those in thick accumulation areas, contributing to the model’s accuracy.
- Selecting factors with greater disparities can improve predictive modeling, as the larger the disparity for each factor, the greater the model accuracy will be.
3.3. Accumulation Relative Thickness and Spatial Distribution Information Extraction
The thickness sample is divided into two parts: training and validation. Utilizing the accumulation thickness samples (Figure 5) and the eight accumulation thickness evaluation factors derived from the aforementioned analysis, the thickness samples are randomly partitioned using the BP neural network classification algorithm in the SPSS software, allocating 70% of the samples for model training and 30% for model verification. A BP neural network model with 1 hidden layer is established, utilizing the logistic activation function, a learning rate of 0.1, 1000 iterations, and 100 hidden layer neurons, and using 5-fold cross-validation. The training dataset was divided into five equal parts, out of which four were used as training sets, a separate one was used as a validation set, and the whole process was repeated five times. Maximum reuse of the data in the training set, each of which has been both trained and tested, maximizes the confidence in the model’s performance and obtaining reliable and stable models. The results of the model prediction accuracy evaluation are shown in Table 2.
The estimation results for the relative thickness of accumulation in the study area were generated and presented in Table 3. Additionally, the spatial distribution map of the relative thickness of accumulation in the study area was created using ArcGIS software (Figure 6).
By comparing Figure 6, we conclude that the thickness of the accumulation and its spatial distribution in the area follow the following patterns:
- The spatial distribution is bounded by the Xiangxi–Tongzhuang River in the north–south direction, rocky and thin accumulation area distribution in the east, and the distribution of medium and thick accumulation areas in the west.
- Medium and thick accumulation areas: Xintan section of the main stream of the Yangtze River, the south bank of the Shuping–Fanjiaping section and the Dongmentou–Chuwangjing section, as well as the right bank of the major tributary Xiangxi, and the banks of the Qinggan, Tongzhuang, and Guizhou Rivers.
- Thin accumulation and rock areas: canyon area (Bingshubaojian Gorge and Niuganmafei Gorge), the section from the mouth of Guizhou River to Niukou on the left bank of the Yangtze River, the section from Qinggan River estuary to Chuwangjing on the right bank of the Yangtze River, and the left bank of Xiangxi River.
3.4. Validation of Prediction Results
For validating the accumulation distribution and its thickness estimation results, some thickness samples were selected to validate the accuracy of the prediction results, where Figure 7 illustrates a sample plot of different accumulation thicknesses and a comparison of relative thickness predictions.
- The predicted relative thicknesses of the slope compared to the actual thicknesses of the samples showed high levels of accuracy. The rocky areas showed complete agreement, the medium and thick accumulation areas were accurate, and in major parts, the thin accumulation areas were correctly predicted in terms of relative thicknesses, but incorrectly predicted in a small number of areas.
- Rocky area: carbonate rock type, high elevation, steep slopes, shaded slopes, long distance to water, high NDVI values, low brightness, and GLCM contrast.
- The thin accumulation areas of the predicted relative thicknesses show greater accuracy compared to the samples, and the relative thicknesses are correctly predicted for the main portion, which has a carbonate rock type lithology, higher elevations, steeper slopes, greater distance from water, higher NDVI values, and lower brightness and GLCM contrast. The areas with lower elevations, gentler slopes, and closer proximity to water were predicted to be areas of medium and thick accumulation areas. Nevertheless, the predictions were generally accurate.
- The medium and thick accumulation areas in the predicted relative thickness show higher accuracy compared to the sample, which has a clastic rock type lithology, with low elevations, gentle slopes, distribution across shaded and sunny slopes, short distance to water, low NDVI values, and high brightness and contrast.
Thickness validation results show that the accumulation distribution and relative thickness classification results based on the BP neural network with multi-source data are relatively accurate and can be used for subsequent research. From the results of the accumulation thickness classification and sample validation, it can be concluded:
Strata lithology and slope structure are the primary factors determining the spatial distribution and thickness of accumulation. The medium accumulation coverage area is mainly distributed in the west of Xiangxi River, mainly Triassic and Jurassic strata, which are clastic rock areas. The thin accumulation coverage area and rocky area are mainly distributed in the east of Xiangxi River, mainly older strata below the Triassic system are predominant and the lithology is carbonate formation. The eastern area, spanning from the Bingshubaojian Gorge to Niuganmafei in the Xintan section, exhibits medium to thick accumulation coverage primarily influenced by stratigraphic lithology, characterized by Silurian clastic rock formations. Stable medium and thick accumulation areas are mainly distributed in the consequent slope sections, such as the section from Shuping to Fanjiaping, and major tributaries such as the Guizhou River and the Qinggan River. The distribution of accumulation on reverse slopes is relatively stable, mainly in areas of medium and thick accumulation (right bank of Xiangxi River) or thin and rocky areas (section of the main stream of the Yangtze River from Xietan to Niukou). The horizontal slope consists primarily of thin accumulation and rocky areas, with scattered small areas of medium and thick accumulation.
Topographic features affect the spatial distribution and thickness variation of accumulation, mainly in the local or detailed, slope unit or microgeomorphic scale. Accumulating accumulation in local areas with high elevation, distant from water systems, or located at the back edge of the slope is challenging, resulting in thin accumulation and coverage by rock and thin accumulation. The area at the foot of a slope, characterized by flat terrain and high elevation, typically exhibits a medium thickness of accumulation.
External forces impact rock weathering processes. In areas subjected to intense external forces, such as shore sections, weathering occurs rapidly, resulting in greater accumulation thickness. Additionally, the strength of external forces correlates with accumulation thickness to some degree. Accumulation distribution and slope relative thickness correlate with NDVI, spectral, and texture characteristics of the image. Medium and thick accumulation areas are primarily found in residential, cultivated, bare, and sparsely vegetated areas. Rocky and thin accumulation areas are located in alpine areas with high vegetation cover.
4. Prediction of Areas Prone to Rainfall-Induced Accumulation Landslide Hazards
4.1. Study on Rainfall Threshold for Rainfall-Induced Landslides
This study examines 101 cases of rainfall-induced landslides in the Three Gorges Reservoir area to analyze their developmental characteristics. It investigates the rainfall intensity and duration data preceding landslides of various scales, lithologies, and slopes, within a 10-day period. From this analysis, the study derives the landslide I-D threshold curve and expresses the rainfall threshold curve. The critical rainfall for landslides is calculated under the influence of various landslide scales, lithologies, and slopes, with a 90% probability of occurrence (Table 4) [41].
4.2. Prediction of Accumulation Landslide Hazards in the Study Area
The analysis of rainfall thresholds for rainfall-induced landslides revealed that landslides predominantly occur in areas with medium and thick accumulation areas. Moreover, slopes with surface inclinations ranging from 20° to 40° are susceptible to sliding and deformation damage. Utilizing the prediction results of the relative thickness of accumulation in the study area, a prediction map depicting the landslide hazards is generated, as shown in Figure 8.
The prediction map of accumulation landslide hazards in the study area has the following characteristics:
- The landslide hazards in the region predominantly encompass clastic rock formations and exhibit wide distribution. The region with carbonate rock formations exhibits scattered occurrences, primarily composed of collapsed debris deposits. Landslide hazards in this region are primarily concentrated in the west of the Xiangxi River, characterized by a high accumulation thickness and steep terrain slopes. Extensive exposure of carbonate strata is observed east of the Xiangxi River, and the accumulation has a small thickness, making it less susceptible to landslide hazards. The landslide hazards are predominantly concentrated in the Silurian clastic rock region, with localized occurrence of collapsed debris deposits in carbonate rock areas.
- The hazards extend below 650 m above sea level, with elevated local elevation. The slopes are mostly gentle, ranging between 20° and 35°, and are situated close to the river. The distribution degree of hazards on slopes is similar, with slightly more exposure on sunny slopes compared to shaded slopes. The area is predominantly covered by agricultural and urban land.
- The hazards for landslide in the region are primarily concentrated in the nearshore areas of rivers. These regions experience strong external dynamic forces, and significant thickness of accumulation, and are predisposed to becoming landslide hazards. This is particularly true in agricultural and residential areas, as well as in locations with low NDVI values, high image brightness values, and complex texture features.
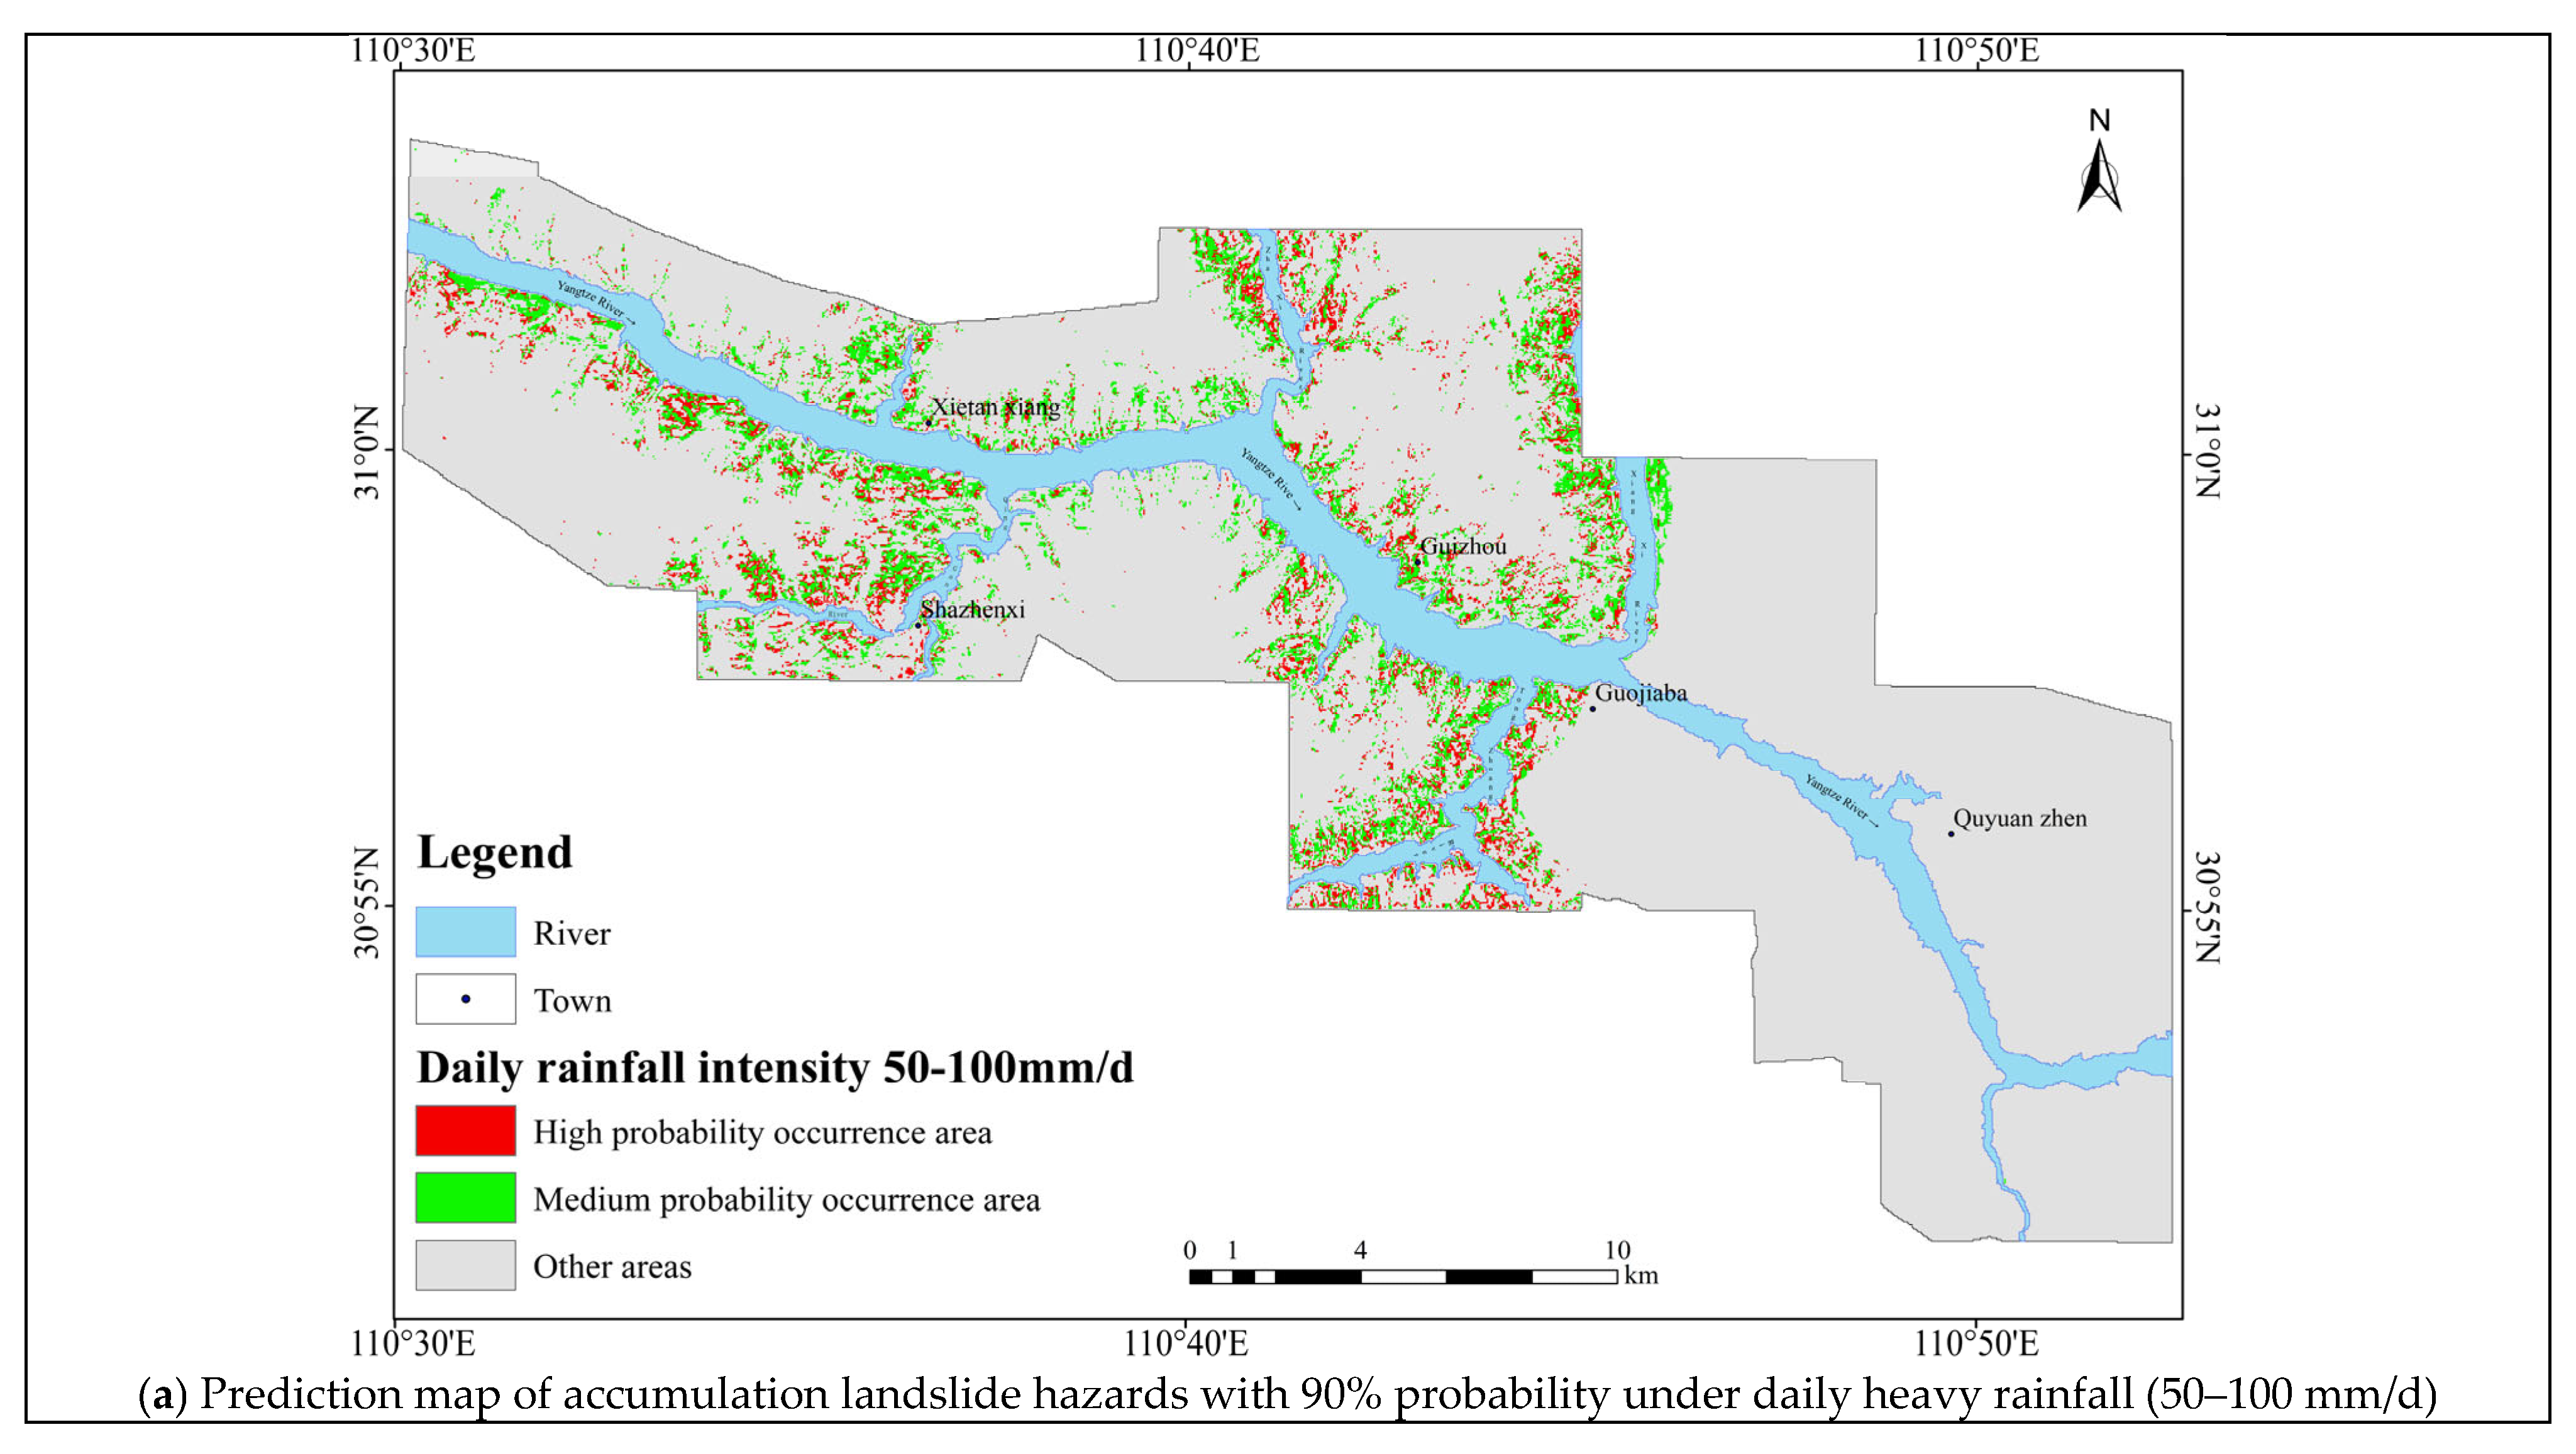
According to the analysis results of landslide rainfall thresholds in the study area, Figure 9 illustrates the prediction of landslide hazards under different rainfall probabilities of 90% within 1 day, 5 days, and 9 days.
Through the comparative analysis of the prediction maps above, it can be concluded that the spatial distribution of rainfall-induced accumulation landslide hazards in the area follows certain patterns.
- The accumulation landslide hazards with a 90% probability, induced by daily heavy rainfall intensity (50–100 mm/d), mainly develops in the Triassic Badong Formation and Jurassic strata, characterized by clastic rock lithology, and is distributed in the west of the Xiangxi River. Areas with slopes of 20°–25° are highly susceptible to landslide hazards. The area with a slope of 25°–35° is a medium probability of occurrence area for landslides.
- The accumulation landslide hazards area with a 90% probability, induced by daily heavy rainfall intensity (100–250 mm/d), is located in areas with clastic rock lithology. The area of high susceptibility to landslide hazards lies to the west of the Xiangxi River, with smaller areas to the east, having slopes between 20° and 35°. The middle probability occurrence area lies to the west of the Xiangxi River, with a slope of more than 35°.
- The area with a 90% probability of inducing accumulation of landslide hazards due to rainfall within a 5-day period in the district lies in areas with clastic rock lithology. Areas with Triassic and Silurian clastic rock formations and slopes having 20° to 25° are susceptible to landslide hazards at lower rainfall thresholds (140–160 mm). As rainfall continues to increase, landslide probability increases in areas with slopes between 25° and 35°. In the landslide hazard of the Jurassic strata, when rainfall reaches 180 mm, the area with slopes between 20° and 35° is the first to experience landslides. As rainfall continues to increase, landslides will occur in areas with slopes above 35° as well.
- The area with a 90% probability of inducing accumulation of landslide hazards due to rainfall within a 9-day period in this area is consistent with that induced by rainfall within a 5-day period. At 190 mm of rainfall, landslides first occur in the Triassic and other strata, with slopes having 20°–35°. At rainfall exceeding 230 mm, the area with slopes of 20°–35° in the Jurassic strata becomes susceptible. As rainfall increases, the probability of occurrence increases in areas with clastic rock lithology and slopes above 35°.
- In the distribution of accumulation landslide hazards over 5-day and 9-day periods, carbonate rock areas are prone to occur due to their high gravel content in accumulation, large particle size, high permeability, and the requirement of substantial rainfall within a short time frame to trigger landslides. Therefore, during the 5 and 9 days, landslides occur only when short-duration rainfall reaches the critical threshold, making them less likely under continuous and low daily rainfall conditions. Conversely, in regions with interbedded siltstone and sandstone, accumulation has smaller particle sizes and poorer permeability, often necessitating substantial rainfall to induce landslides over the 5 and 9 days.
- Summarizing the observed patterns, we found that landslide hazards in the study area are consistent across different amounts and durations of rainfall, with landslide hazards primarily located in the Triassic and Jurassic strata, and in areas with surface slopes ranging from 20° to 40°. As rainfall increases, areas with low rainfall susceptibility in the study area gradually become more susceptible to landslides, and landslides tend to occur in clusters. As rainfall increases, the probability of landslides increases in areas with steeper slopes. This is mainly because as the slope increases, the accumulation transitions from residual accumulation to collapsed debris deposits, resulting in an increase in particle size and crushed stone content, while also enhancing water permeability. Thus, the effective rainfall or rainfall threshold that induces landslides will increase as the slope increases.
- The predicted accumulation landslide hazard results were similar for both 5-day and 9-day periods, and the order of landslides in the study area was consistent, starting with the most susceptible Silurian clastic rock area, to the Triassic Badong Formation strata, and then to the Jurassic strata with clastic rock, with the rainfall threshold for landslides gradually increasing.
5. Conclusions
This study focuses on the Zigui section of the Three Gorges Reservoir area and extracts eight factors for accumulation thickness classification from multiple data sources, including geological maps, topographic maps, and remote sensing images. We utilize the BP neural network classification model to generate the relative thickness and distribution map of accumulation in the study area. Based on the collection of 101 examples of rainfall-induced landslides in the reservoir area, we analyzed and determined the rainfall threshold for inducing landslides with different geological characteristics. Drawing from the distribution of medium and thick accumulation areas in the study area, we developed a predictive map of landslide hazards under various rainfall conditions. This achieved early identification of landslide hazards induced by rainfall and provided a foundation for warning of rainfall-induced landslides. The early identification approach for rainfall-induced accumulation landslide hazards proposed in this paper can be applicable to other regions with different geological and climatic conditions. Integrating the material conditions of landslides with the triggering factors is a scientifically reasonable method for landslide early identification.
- The BP neural network classification model was used to obtain the relative thickness distribution map of the accumulation in the study area, and the sample validation revealed that the results were relatively accurate. This study demonstrates that lithology and slope structure are the main controlling factors for accumulation distribution and thickness, while terrain characteristics and external dynamic forces influence accumulation removals and upbuilding processes, thereby impacting changes in accumulation distribution and spatial thickness. Geological maps, topographic maps, and remote sensing images serve as effective sources of information for determining accumulation thickness and distribution.
- Through analysis of the rainfall thresholds for rainfall-induced landslides with various geological characteristics, in conjunction with the relative thickness and distribution map of accumulation, we identified areas prone to landslide hazards under various rainfall conditions. Areas characterized by medium and thick accumulation cover and gentle terrain slopes are susceptible to rainfall-induced landslides. In varying rainfall conditions, landslide hazards primarily occur in areas characterized by Triassic Badong Formation and Jurassic strata with clastic rock lithology, and ground surface slopes ranging from 20° to 40°. The rainfall thresholds for triggering landslides vary, with the most susceptible areas being the Silurian clastic region, followed by the Triassic Badong Formation strata, and the Jurassic clastic region. Moreover, an increase in slope correlates with an increase in the rainfall threshold.
- This study developed an accumulation identification model using multi-source data fusion, which effectively identifies the distribution and relative thickness of accumulation. This was complemented by an analysis of historical landslide events in the Three Gorges Reservoir area to determine rainfall thresholds, thus obtaining conditions under which rainfall induces landslides in different accumulation types and identifying areas prone to landslides under varying rainfall intensity and duration. This provided a foundation for guiding landslide prevention and control measures in response to extreme rainfall events, enabling proactive deployment and preparation, and facilitating scientifically based disaster prevention and mitigation efforts.
Author Contributions
Conceptualization, Z.W. and R.Y.; methodology, R.Y.; software, Z.W.; validation, Z.W., R.Y., J.H. and Y.C.; formal analysis, Z.W.; investigation, Z.W., R.Y. and Y.C.; resources, R.Y.; data curation, Z.W., S.Y. and T.W.; writing—original draft preparation, Z.W.; writing—review and editing, R.Y.; visualization, Z.W.; supervision, R.Y.; project administration, R.Y.; funding acquisition, R.Y. All authors have read and agreed to the published version of the manuscript.
Funding
This research was funded by the Three Gorges Follow-up Work Geological Hazard Prevention and Control Project 0001212022CC60001;0001212020CC60002 and 0001212024CC60003; National Natural Science Foundation of China Project U21A2031; Hubei Key R&D Program Project 2021BAA040.
Data Availability Statement
The data that support the findings of this study were obtained from Google Earth (https://earth.google.com/, accessed on 10 November 2023) and the Chinese Meteorological Administration (CMA) (https://data.cma.cn/, accessed on 10 November 2023). They are available from the Z.W. and R.Y., upon reasonable request.
Conflicts of Interest
The authors declare no conflicts of interest.
References
- Zheng, X.; He, G.; Wang, S.; Wang, Y.; Wang, G.; Yang, Z.; Yu, J.; Wang, N. Comparison of Machine Learning Methods for Potential Active Landslide Hazards Identification with Multi-Source Data. ISPRS Int. J. Geo-Inf. 2021, 10, 253. [Google Scholar] [CrossRef]
- Xu, Q. Understanding and Consideration of Related Issues in Early Identification of Potential Geohazards. Geomat. Inf. Sci. Wuhan Univ. 2020, 45, 1651–1659. [Google Scholar] [CrossRef]
- Ran, P.; Li, S.; Zhuo, G.; Wang, X.; Meng, M.; Liu, L.; Chen, Y.; Huang, H.; Ye, Y.; Lei, X. Early Identification and Influencing Factors Analysis of Active Landslides in Mountainous Areas of Southwest China Using SBAS−InSAR. Sustainability 2023, 15, 4366. [Google Scholar] [CrossRef]
- Zhang, J.; Gong, Y.; Huang, W.; Wang, X.; Ke, Z.; Liu, Y.; Huo, A.; Adnan, A.; Abuarab, M.E.-S. Identification of Potential Landslide Hazards Using Time-Series InSAR in Xiji County, Ningxia. Water 2023, 15, 300. [Google Scholar] [CrossRef]
- Wang, Z. Remote Sensing for Landslide; Science Press: Beijing, China, 2012. [Google Scholar]
- Xu, C.; Dai, F.; Chen, J.; Tu, X.; Xu, L.; Li, W.; Tian, W.; Cao, Y.; Yao, X. Fine interpretation of remote sensing of secondary geological hazards in the Wenchuan Ms8.0 earthquake-stricken area. Natl. Remote Sens. Bull. 2009, 13, 754–762. [Google Scholar] [CrossRef]
- Kyriou, A.; Nikolakopoulos, K.G. Landslide mapping using optical and radar data: A case study from Aminteo, Western Macedonia Greece. Eur. J. Remote Sens. 2020, 53, 17–27. [Google Scholar] [CrossRef]
- Lu, H.; Li, W.; Xu, Q.; Dong, X.; Dai, C.; Wang, D. Early Detection of Landslides in the Upstream and Downstream Areas of the Baige Landslide, the Jinsha River Based on Optical Remote Sensing and InS-AR Technologies. Geomat. Inf. Sci. Wuhan Univ. 2019, 44, 1342–1354. [Google Scholar] [CrossRef]
- Mora, O.; Lenzaro, M.; Toth, C.; Grejner-Brzezinska, D.A.; Fayne, J.V. Landslide change detection based on multi-temporal airborne LiDAR-derived DEMs. Geosciences 2018, 8, 23. [Google Scholar] [CrossRef]
- Zhang, Q.; Zhao, C.; Chen, X. Technical progress and development trend of geological ha-zards early identification with multi-source remote sensing. Acta Geod. Cartogr. Sin. 2022, 51, 885–896. [Google Scholar]
- Ge, D.; Dai, K.; Guo, Z.; Li, Z. Early Identification of Serious Geological Hazards with Integrated Remote Sensing Technologies: Thoughts and Recommendations. Geomat. Inf. Sci. Wuhan Univ. 2019, 44, 949–956. [Google Scholar] [CrossRef]
- Wang, Z.; Tang, W.; Ma, Z.; Li, Y.; Yang, B.; Li, W.; Li, Y. Early identification of ridge-top landslide hazards in Jiuz-haigou area using InSAR-LiDAR method. Bull. Surv. Mapp. 2023, 5, 9–15. [Google Scholar] [CrossRef]
- Wu, J.; Li, Y.; Zhang, S.; Oualembo Mountou, J.C.J. Early identification of potential loess landslide using convolutional neural networks with skip connection: A case study in northwest Lvliang City, Shanxi Province, China. Georisk Assess. Manag. Risk Eng. Syst. Geohazards 2024, 18, 159–171. [Google Scholar] [CrossRef]
- Chen, T.; Trinder, J.; Niu, R.Q. Object-oriented landslide mapping using ZY-3 satellite imagery, random forest and mathematical morphology, for the three-gorges reservoir, China. Remote Sens. 2017, 9, 333. [Google Scholar] [CrossRef]
- Forte, G.; Massaro, L.; De Falco, M.; Pirone, M.; Santo, A. Empirical relationship for the estimate of pyroclastic soil thickness using slope steepness. Catena 2023, 231, 107356. [Google Scholar] [CrossRef]
- Catani, F.; Segoni, S.; Falorni, G. An empirical geomorphology-based approach to the spatial prediction of soil thickness at catchment scale. Water Resour. Res. 2010, 46, W05508. [Google Scholar] [CrossRef]
- Salciarini, D.; Godt, J.W.; Savage, W.Z.; Conversini, P.; Baum, R.L.; Michael, J.A. Modeling regional initiation of rainfall-induced shallow landslides in the eastern Umbria Region of central Italy. Landslides 2006, 3, 181–194. [Google Scholar] [CrossRef]
- Del Soldato, M.; Pazzi, V.; Segoni, S.; De Vita, P.; Tofani, V.; Moretti, S. Spatial modeling of pyroclastic cover deposit thickness (depth to bedrock) in peri-volcanic areas of Campania (southern Italy). Earth Surf. Proc. Land. 2018, 43, 1757–1767. [Google Scholar] [CrossRef]
- De Vita, P.; Nappi, M. Regional Distribution of Ash-Fall Pyroclastic Soils for Landslide Susceptibility Assessment. In Landslide Science and Practice, Spatial Analysis and Modelling, Vol. 3; Margottini, C., Canuti, P., Sassa, K., Eds.; Springer: Berlin/Heidelberg, Germany, 2013; pp. 103–109. [Google Scholar] [CrossRef]
- Basharat, M.; Qasim, M.; Shafique, M.; Hameed, N.; Riaz, M.T.; Khan, M.R. Regolith thickness modeling using a GIS approach for landslide distribution analysis, NW Himalayas. J. Mt. Sci. 2018, 15, 2466–2479. [Google Scholar] [CrossRef]
- Tesfa, T.K.; Tarboton, D.G.; Chandler, D.G.; McNamara, J.P. Modeling soil depth from topographic and land cover attributes. Water Resour. Res. 2009, 45, W10438. [Google Scholar] [CrossRef]
- Lagomarsino, D.; Tofani, V.; Segoni, S.; Catani, F.; Casagli, N. A Tool for Classification and Regression Using Random Forest Methodology: Applications to Landslide Susceptibility Mapping and Soil Thickness Modeling. Environ. Model. Assess. 2017, 22, 201–214. [Google Scholar] [CrossRef]
- Lacoste, M.; Mulder, V.L.; Richer-de-Forges, A.C.; Martin, M.P.; Arrouays, D. Evaluating large-extent spatial modeling approaches: A case study for soil depth for France. Geoderma Reg. 2016, 7, 137–152. [Google Scholar] [CrossRef]
- Domier, J.; Johnson, D. Animating the biodynamics of soil thickness using process vector analysis: A dynamic denudation approach to soil formation. Geomorphology 2005, 67, 23–46. [Google Scholar]
- Yi, Q.; Zeng, H.; Huang, H. Reservoir landslide deformation forecast using BP neural network. Hydrogeol. Eng. Geol. 2013, 40, 124–128. [Google Scholar]
- Yan, Z. Research and Application on BP Neural Network Algorithm. In Proceedings of the 2015 International Industrial Informatics and Computer Engineering Conference, Xi’an, China, 10–11 January 2015; pp. 1444–1447. [Google Scholar]
- Crozier, M.J. Landslides: Causes, Consequences and Environment; Routledge Kegan&Paul: London, UK, 1986. [Google Scholar]
- Guzztti, F.; Peruccacci, S.; Rossi, M.; Stark, C.P. Rainfall thresholds for the initiation of landslides. Meteorol. Atmos. Phys. 2007, 98, 239–267. [Google Scholar] [CrossRef]
- Compilation Group of the Ministry of Geology and Mineral Resources. Study on the Stability of the Reservoir Bank of the Three Gorges Project of the Yangtze Rive; Geology Press: Beijing, China, 1988. [Google Scholar]
- Yin, Y.; Hu, R. Engineering geological characteristics of purplish-red mudstone of middle tertiary formation at the three gorges reservoir. J. Eng. Geol. 2004, 12, 124–135. [Google Scholar]
- Lu, H.; Chen, C.; Ruan, C.; Yu, H.D.; Shen, Q. Analysis of failure mechanism of banong red bed soft rock gently inclined bedding slope. Chin. J. Rock Mech. Eng. 2010, 29, 3569–3577. [Google Scholar]
- Huang, Z.; Law, K.T.; Liu, H.; Jiang, T. The chaotic characteristics of landslide evolution: A case study of Xintan landslide. Environ. Geol. 2009, 56, 1585–1591. [Google Scholar] [CrossRef]
- Wang, F.; Zhang, Y.; Huo, Z.; Matsumoto, T.; Huang, B.-L. The July 14, 2003 Qianjiangping landslide, Three Gorges Reservoir, China. Landslides 2004, 1, 157–162. [Google Scholar] [CrossRef]
- Saulnier, G.-M.; Beven, K.; Obled, C. Including spatially variable effective soil depths in TOPMODEL. J. Hydrol. 1997, 202, 158–172. [Google Scholar] [CrossRef]
- Blesius, L.; Weirich, F. The use of high-resolution satellite imagery for deriving geotechnical parameters applied to landslide susceptibility. In Proceedings of the ISPRS Hannover Workshop 2009, Hannover, Germany, 2–5 June 2009. [Google Scholar]
- Rech, J.A.; Reeves, R.W.; Hendricks, D.M. The influence of slope aspect on soil weathering processes in the Springerville volcanic field, Arizona. Catena 2001, 43, 49–62. [Google Scholar] [CrossRef]
- Yang, K.; Ye, R.; Fu, X.; Niu, R. Estimation of peak shearing strength parameters of rock mass based on GSI value. Yangtze River 2020, 51, 119–124+136. [Google Scholar]
- Ye, R.; Li, S.; Guo, F.; Fu, X.; Niu, R. Rs and Gis Analysis on Relationship betwee-N Landslide Susceptibility and Land Use Change in Three Gorges Re-Servoir Area. J. Eng. Geol. 2021, 29, 724–733. [Google Scholar] [CrossRef]
- Li, X.; Zheng, T. Image multi-scale random tree segmentation based on spectral clustering. Sci. Sin. 2007, 37, 1073–1085. [Google Scholar]
- Bruzzone, L.; Carlin, L. A multilevel context-based system for classification of very high spatial resolution images. IEEE Trans. Geosci. Remote Sens. 2006, 44, 2587–2600. [Google Scholar] [CrossRef]
- Yang, S.; Ye, R.; Fu, X.; Wu, R.; Xiong, N.; Wen, T. Study on Early Warning Rainfall Threshold of Rainfall Induced Landslide in the Three Gorges Reservoir Area. South China Geol. 2023, 39, 445–454. [Google Scholar]
Figure 1.
Technical flowchart.
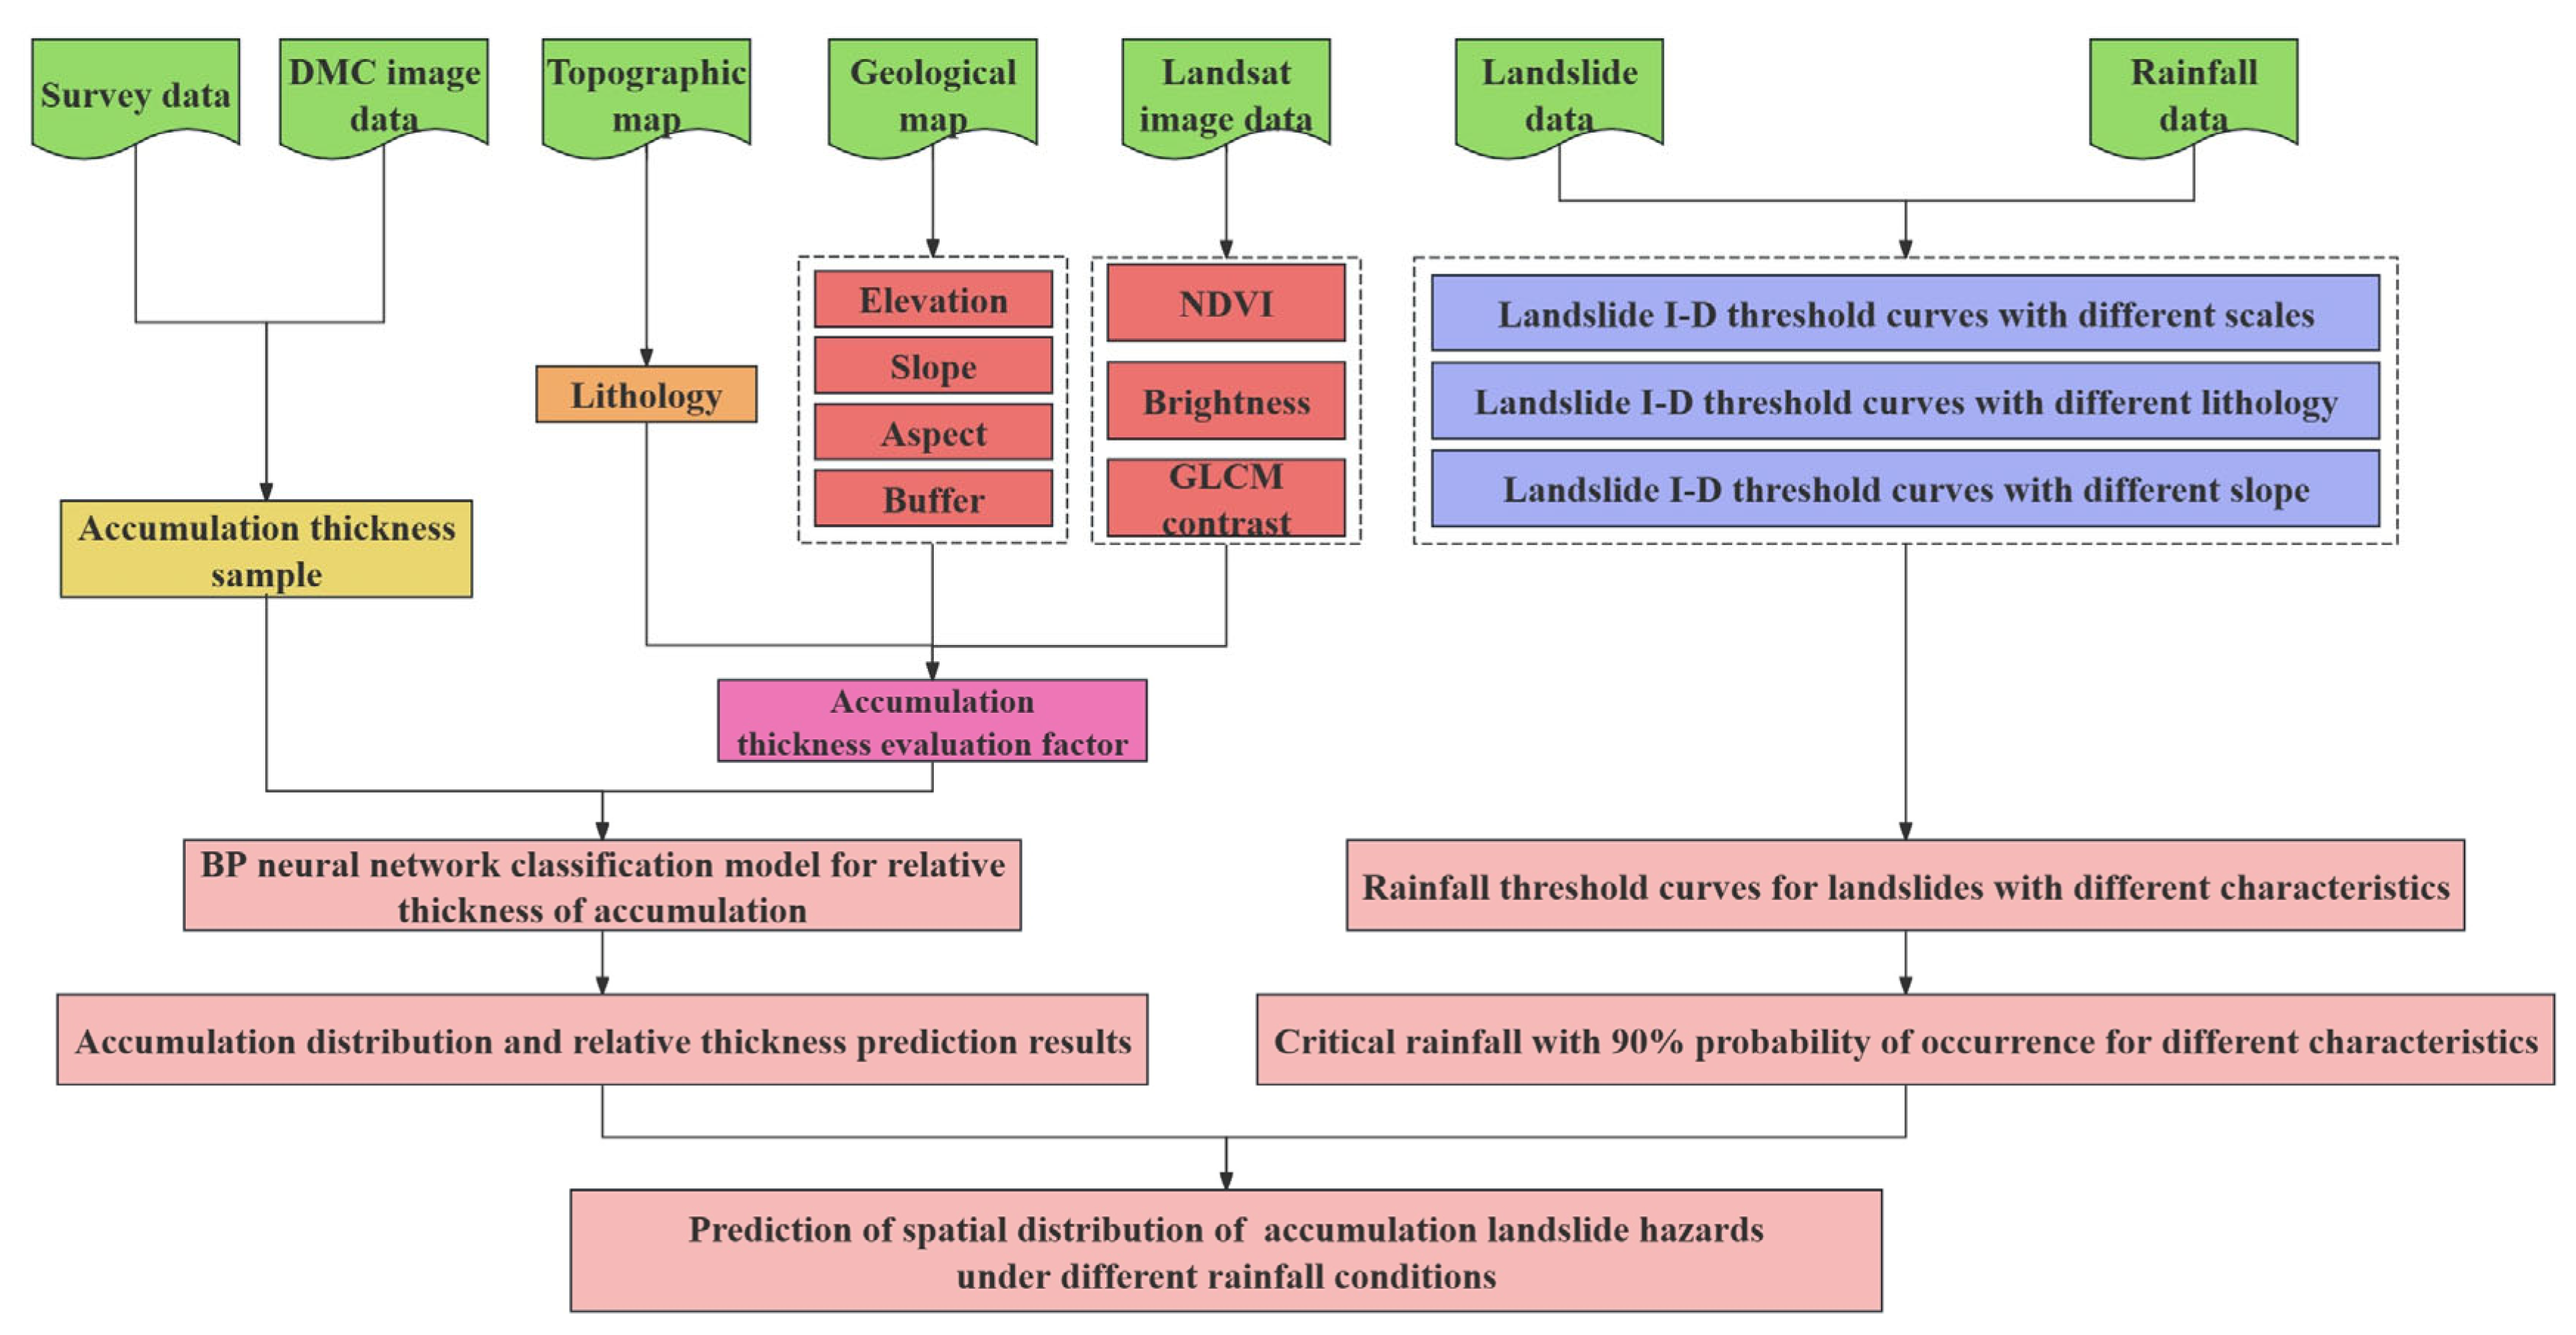
Figure 2.
Structure of BP neural network with single hidden layer.
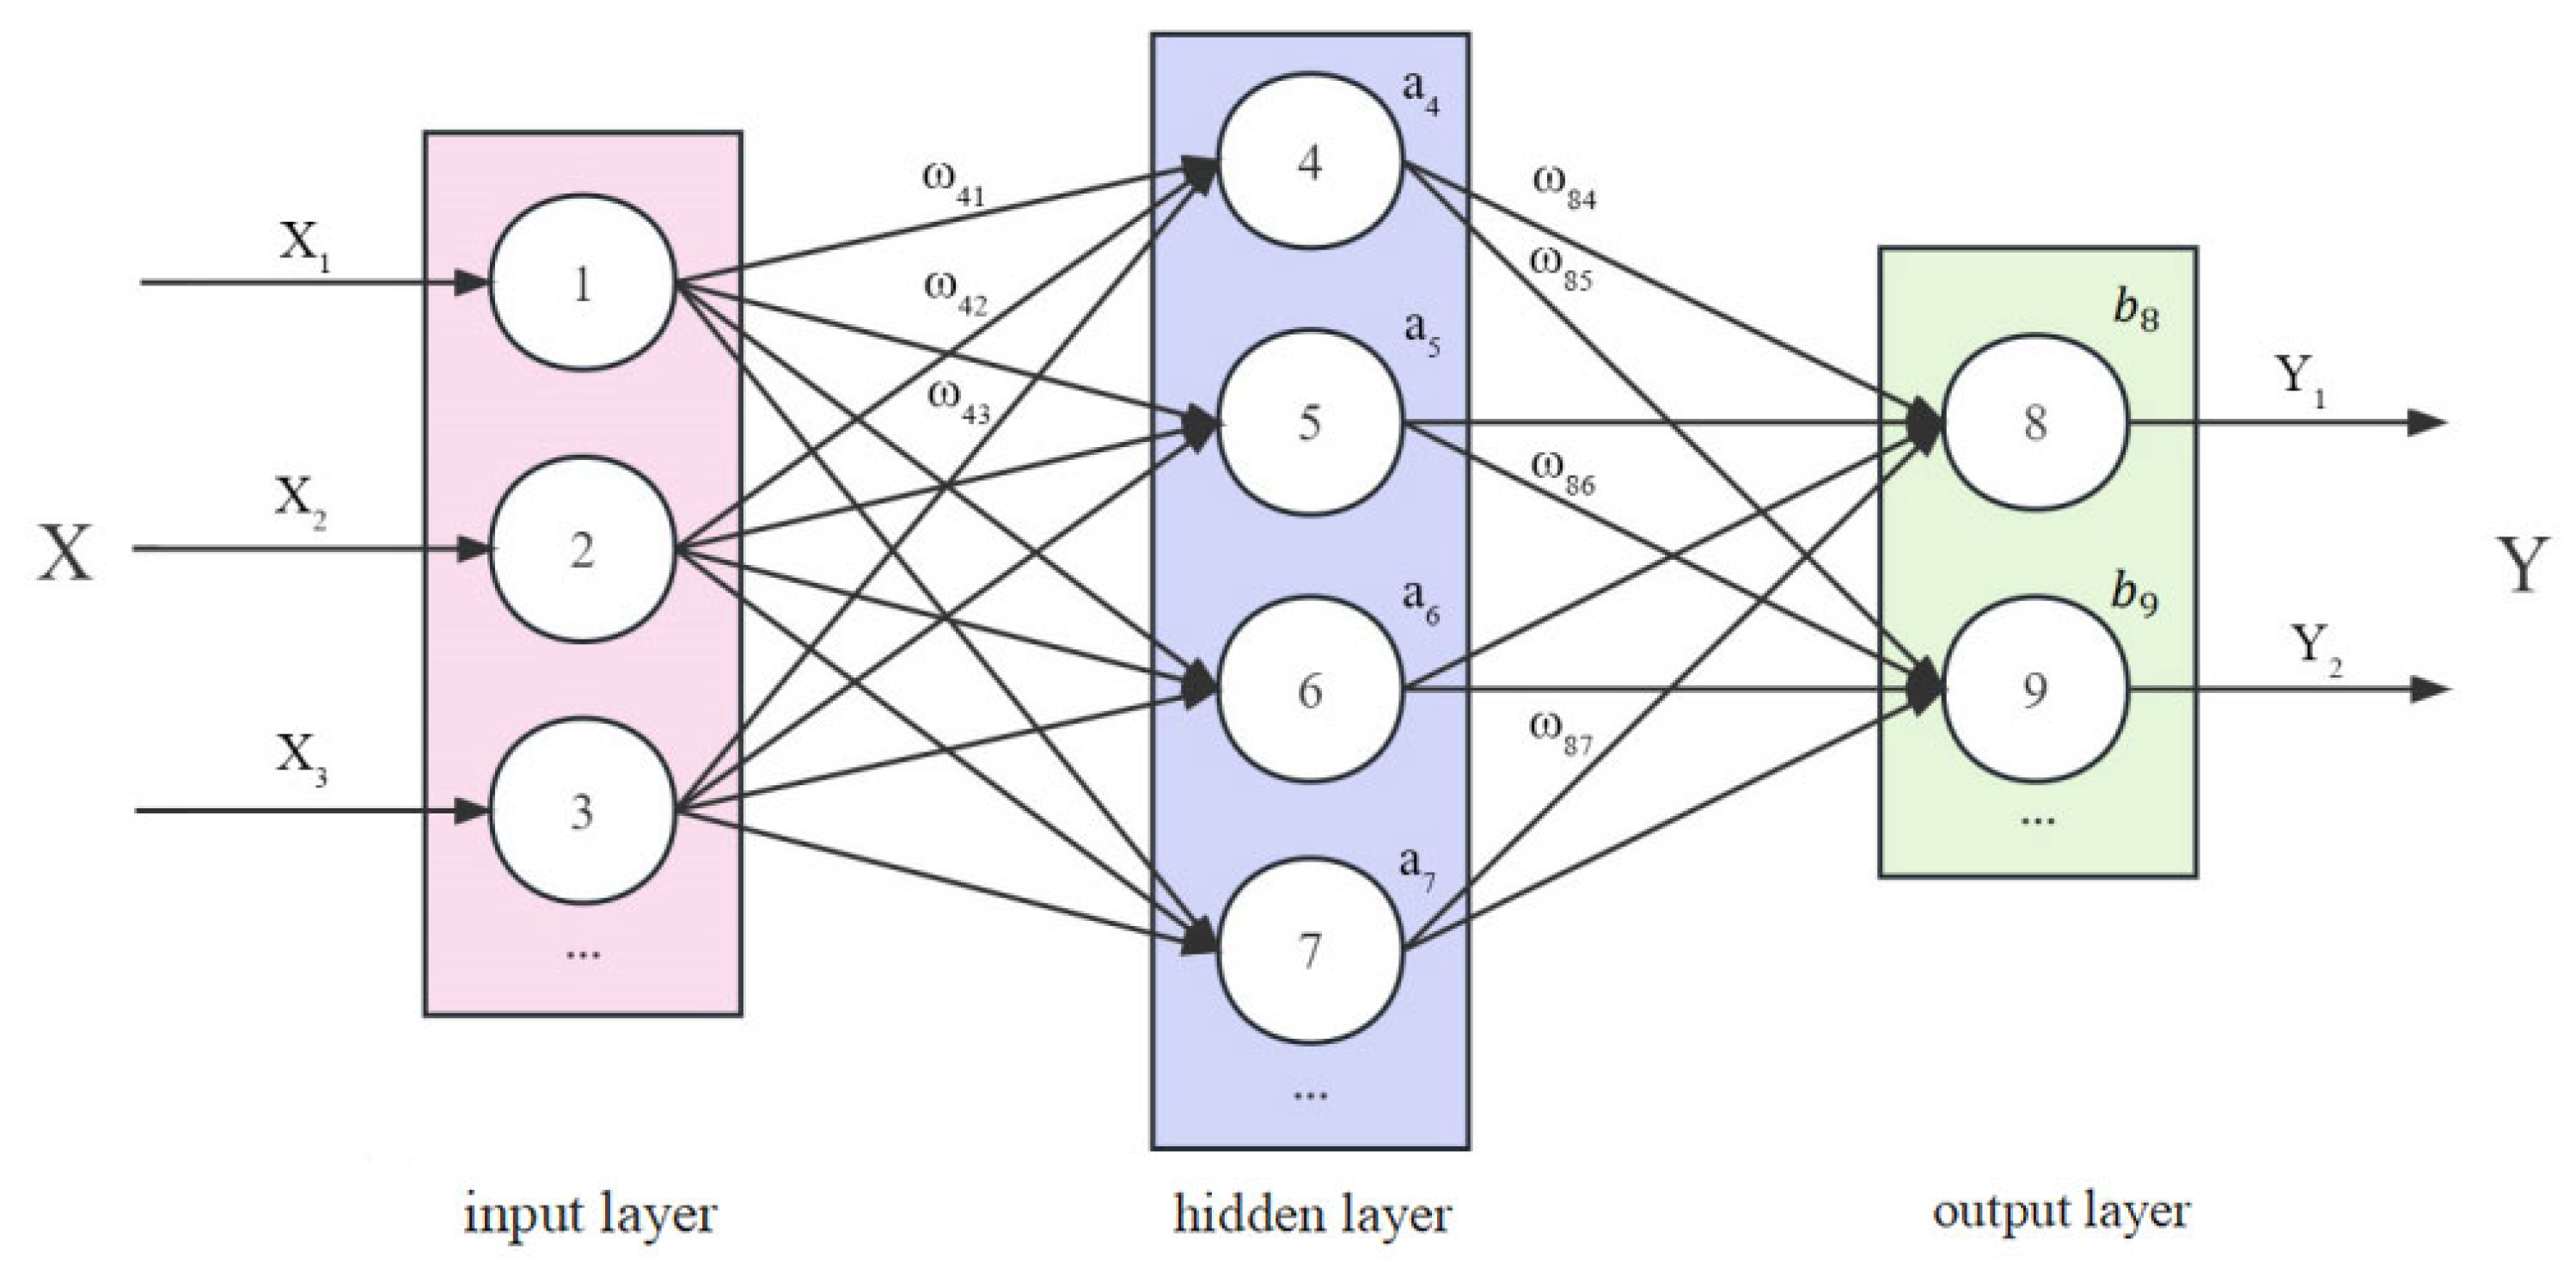
Figure 3.
Geographic location of the study area and major towns.

Figure 4.
Map of accumulation thickness estimating factors.


Figure 5.
Accumulation thickness samples.

Figure 6.
Map of spatial distribution for accumulation relative thickness and the bedrock.

Figure 7.
Comparison chart of accumulation relative thickness samples and prediction.

Figure 8.
Prediction map of accumulation landslide hazards in the study area.
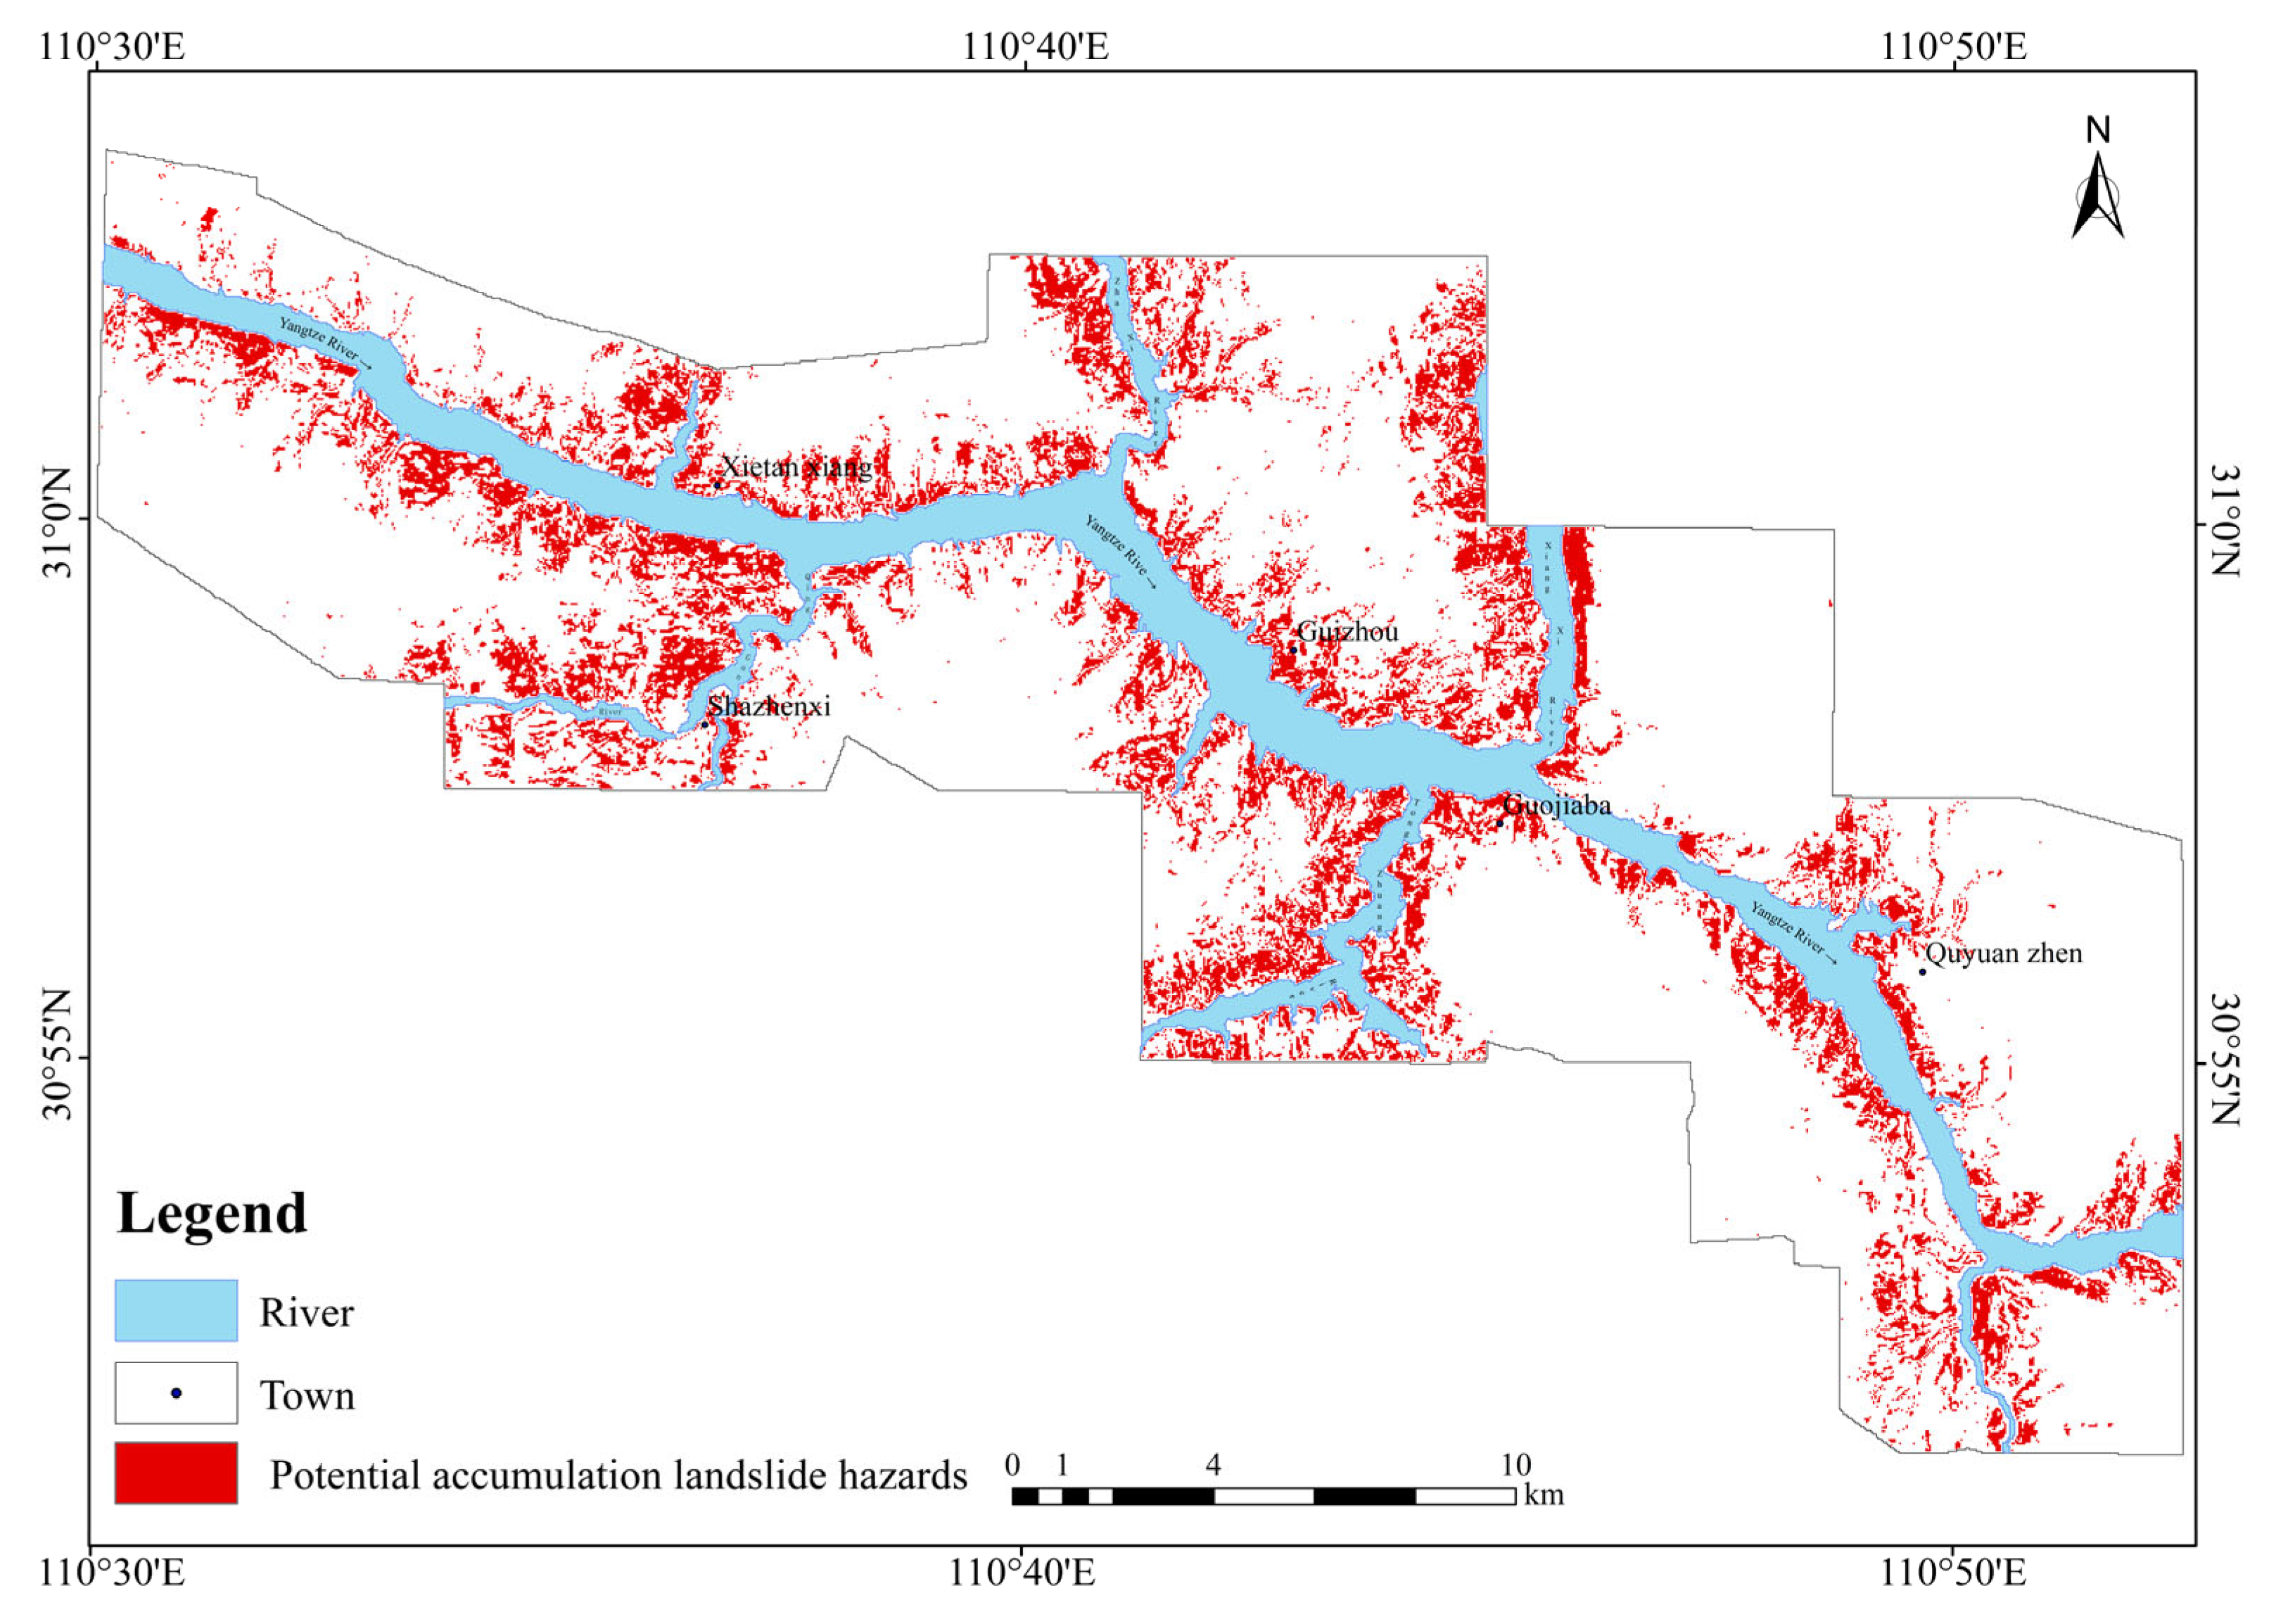
Figure 9.
Prediction map of accumulation landslide hazards induced with 90% probability of rainfall within 1, 5, and 9 days.
Figure 9.
Prediction map of accumulation landslide hazards induced with 90% probability of rainfall within 1, 5, and 9 days.


Table 1.
Sample factor range comparison of different accumulation thicknesses.
| Category | Rocky | Thin | Medium | Thick | Differences | |
|---|---|---|---|---|---|---|
| Lithology | Clastic rocks | 42% | 62% | 79% | 95% | High |
| Carbonate rocks | 58% | 38% | 21% | 5% | ||
| Elevation | Min–388 m | 8% | 55% | 100% | 86% | High |
| 388–650 m | 12% | 30% | 0% | 14% | ||
| 650m–Max | 80% | 15% | 0% | 0% | ||
| Slope | Min–35° | 28% | 82% | 91% | 95% | High |
| 35°–60° | 65% | 12% | 1% | 4% | ||
| 60°–Max | 7% | 0% | 0% | 0% | ||
| Aspect | Shady slopes | 40% | 64% | 40% | 65% | Normal |
| Sunny slopes | 60% | 36% | 60% | 35% | ||
| Distance to water | Min–400 m | 6% | 31% | 98% | 72% | High |
| 400–1000 m | 15% | 46% | 2% | 26% | ||
| 1000m–Max | 79% | 23% | 0% | 3% | ||
| NDVI | Min–0.5 | 2% | 70% | 96% | 85% | High |
| 0.5–Max | 98% | 30% | 4% | 15% | ||
| Brightness | Min–1221 | 54% | 42% | 27% | 13% | High |
| 1221–1469 | 42% | 52% | 40% | 74% | ||
| 1469–Max | 4% | 7% | 34% | 14% | ||
| GLCM contrast | Min–1716 | 89% | 86% | 33% | 64% | Normal |
| 1716–Max | 11% | 14% | 67% | 36% |
Table 2.
Model evaluation results.
| Accuracy | Recall | Precision | F1 | |
|---|---|---|---|---|
| Training set | 0.971 | 0.971 | 0.971 | 0.97 |
| Cross-validation set | 0.952 | 0.952 | 0.953 | 0.952 |
| Test set | 0.948 | 0.948 | 0.948 | 0.947 |
Table 3.
Statistics of extraction results of accumulation relative thickness information (excluding the river area).
Table 3.
Statistics of extraction results of accumulation relative thickness information (excluding the river area).
| The Relative Thickness of the Accumulation | Area/km2 | Percentage of Total Study Area/% |
|---|---|---|
| Thick | 68.17 | 22.40 |
| Medium | 7.8 | 2.56 |
| Thin | 124.01 | 40.75 |
| Rocky | 104.35 | 34.29 |
Table 4.
Critical rainfall for landslide occurrence.
| Category | Classify | Critical Rainfall for Different Rainfall Durations/mm | ||
|---|---|---|---|---|
| 90%Probability of Occurrence | ||||
| 1 Day | 5 Days | 9 Days | ||
| size | Small-sized | 55.3 | 110.9 | 143.0 |
| Medium-sized | 113.5 | 187.2 | 224.8 | |
| Large-sized | 172.5 | 199.0 | 209.7 | |
| Extra-large-sized | 211.0 | 211.3 | 211.5 | |
| Lithology | Sand–shale stone | 90.5 | 182.6 | 235.9 |
| Siltstone | 88.4 | 139.4 | 164.6 | |
| Carbonate rocks | 102.7 | 129.7 | 141.3 | |
| Slope | <25° | 67.5 | 146.5 | 194.5 |
| [25°,35°) | 76.0 | 159.8 | 209.7 | |
| ≥35° | 160.3 | 226.9 | 257.7 | |
Disclaimer/Publisher’s Note: The statements, opinions and data contained in all publications are solely those of the individual author(s) and contributor(s) and not of MDPI and/or the editor(s). MDPI and/or the editor(s) disclaim responsibility for any injury to people or property resulting from any ideas, methods, instructions or products referred to in the content. |
© 2024 by the authors. Licensee MDPI, Basel, Switzerland. This article is an open access article distributed under the terms and conditions of the Creative Commons Attribution (CC BY) license (https://creativecommons.org/licenses/by/4.0/).
Share and Cite
MDPI and ACS Style
Wu, Z.; Ye, R.; Yang, S.; Wen, T.; Huang, J.; Chen, Y. Study on Early Identification of Rainfall-Induced Accumulation Landslide Hazards in the Three Gorges Reservoir Area. Remote Sens. 2024, 16, 1669. https://doi.org/10.3390/rs16101669
AMA Style
Wu Z, Ye R, Yang S, Wen T, Huang J, Chen Y. Study on Early Identification of Rainfall-Induced Accumulation Landslide Hazards in the Three Gorges Reservoir Area. Remote Sensing. 2024; 16(10):1669. https://doi.org/10.3390/rs16101669
Chicago/Turabian StyleWu, Zhen, Runqing Ye, Shishi Yang, Tianlong Wen, Jue Huang, and Yao Chen. 2024. "Study on Early Identification of Rainfall-Induced Accumulation Landslide Hazards in the Three Gorges Reservoir Area" Remote Sensing 16, no. 10: 1669. https://doi.org/10.3390/rs16101669
Note that from the first issue of 2016, this journal uses article numbers instead of page numbers. See further details here.