
Elemental Uptake by Different Calcite Crystal Faces: An In Situ Study
by
 , , , and
Mustafa Rezaei
1, 
Rinat Gabitov
1,*,
Aleksey Sadekov
2,
Alberto Perez-Huerta
3,
Chiara Borrelli
4 and
Andrea Stiles
1 1
Department of Geosciences, Mississippi State University, Starkville, MS 39762, USA
2
Department of Engineering and Mathematical Science, The University of Western Australia, Perth, WA 6009, Australia
3
Department of Geological Sciences, The University of Alabama, Tuscaloosa, AL 35487, USA
4
Department of Earth and Environmental Sciences, University of Rochester, Rochester, NY 14627, USA
*
Author to whom correspondence should be addressed.
Crystals 2024, 14(5), 442; https://doi.org/10.3390/cryst14050442
Submission received: 28 March 2024
/
Revised: 30 April 2024
/
Accepted: 2 May 2024
/
Published: 7 May 2024
(This article belongs to the Special Issue Crystallization Process and Simulation Calculation, Second Edition)
Abstract
:This study aims to evaluate relationships between elemental signatures in calcite and the crystallographic orientation of its planes. The ability of calcite (a widespread calcium carbonate mineral) to entrap various trace and minor elements in its structure is the foundation of multiple methods (also called proxies) to reconstruct paleoenvironment conditions (e.g., temperature, pH, and marine chemistry). Although several element-to-calcium ratios (E/Ca) are routinely measured in marine carbonates and are widely used in paleoclimate studies, some of the controls on the incorporation of these elements are still unclear. Here, we examine the effect of crystallography on (E/Ca)calcite by growing thin layers of calcite on differently oriented Iceland Spar substrates immersed in modified seawater solution. Newly grown calcite layers were examined with Laser Ablation Inductivity–Coupled Plasma Mass Spectrometry (LA-ICP-MS), Backscattered Electron Imaging (BSE), and Energy Dispersive X-ray Spectroscopy (EDS). We propose that the crystallographic orientation might slightly influence the incorporation of lithium (Li), sodium (Na), magnesium (Mg), sulfur (S), and barium (Ba) into the studied calcite faces and have no impact on the incorporation of boron (B), potassium (K), and strontium (Sr) at least under the conditions of our experiment.
1. Introduction
Calcite is a calcium carbonate mineral that occurs in marine environments via geological history. Calcite precipitates directly or indirectly from seawater and sediment porewaters inorganically or under biological activity. Biogenic calcite is present in the skeletons of several marine organisms: e.g., planktonic foraminifera [1,2,3,4,5,6], mollusks [7,8,9], echinoids [10,11], deep-sea corals [12,13,14], and ostracods [15,16,17,18]. The ratios of trace (minor) elements to Ca in calcite [(E/Ca)calcite] are being widely used as paleoproxies in the reconstruction of marine paleoenvironments. The evolution of E/Ca in ancient seawater [(E/Ca)fluid] depends on various geological events and affects (E/Ca)calcite, which can serve as paleoproxies for various processes including midocean spreading (through Mg/Ca) [19,20], weathering of continental rocks (through Li isotopes) [21,22] and marine circulation (through Ba/Ca) [15], etc. In addition, (Mg/Ca)calcite and (Sr/Ca)calcite help with reconstructing of seawater temperature [23,24] and B/Ca is being used for pH assessment [25,26,27,28]. However, interpreting (E/Ca)calcite is often challenging as multiple factors can affect elemental incorporation. To evaluate these factors, empirical relationships between trace elements in calcite and fluid have been developed in different crystallization environments. It was shown that elemental incorporation into calcite very often occurs at non-equilibrium conditions. For example, experimental studies, with variable fluid Mg/Ca, showed that Mg partition coefficients (KMg = (Mg/Ca)calcite/(Mg/Ca)fluid) decrease with increasing (Mg/Ca)fluid [29]. Another important factor is the crystal growth rate. Multiple experimental and cultured studies demonstrated that elemental uptake by calcite or coccolithophores depends on the precipitation rate of crystal bulk [30,31,32,33,34]. In addition, the growth rate effect on KE was found in in situ experimental studies, where the extension rate of individual crystals was considered instead of the bulk crystal precipitation rate [35,36,37].
Sectoral zoning is another phenomenon that was reported within individual crystal faces for sectors with non-equivalent surface geometry [38]. There obtuse and acute angles at calcite growth steps were identified with atomic force microscopy at the surface of the crystals. Line scans via these non-equivalent sectors conducted with electron or ion microprobes identified the substantial difference in Mg and Sr [38], Sr and Ba [39], and B [40]. Specifically, Sr, which has an ionic radius larger than that of Ca (rSr > rCa) [41], showed selective incorporation into calcite sectors with obtuse growth steps [38,42]. On the contrary, small Mg (rMg < rCa) was observed to be more compatible with sectors with sharper (acute) growth angles [38,43]. The pattern of boron incorporation was different due to its preference for calcite sectors with acute steps, despite the sizes of its oxyanions being bigger than CO32− [44]. Another phenomenon of selective incorporation was observed along c-axes of calcite crystals [45]. They found that the addition of malonic acid into growth media promoted the growth of obtuse kink sites and increased Sr incorporation in the crystals elongated along the c-axis.
To compare the incorporation of Li, B, Na, Mg, S, K, Sr, and Ba into different crystallographic faces of calcite, experiments of calcite growth on the Iceland spar substrate were conducted in this study. Cleavage fragments of Iceland spar consist of three pairs of parallel and equally sized faces (1 and 2, 4 and 5, 3 and 6) (Figure 1). The values of (E/Ca)calcite were determined in the newly grown thin layers of calcite that formed on each of the aforementioned faces with the LA-ICP-MS depth profiling technique.
2. Materials and Methods
2.1. Crystallization Experiments
The crystallization experiment was conducted in a 50 mL plastic tube on an orbital shaker at room temperature. A few calcite cleavage fragments (about 50 mm in size) were used as substrates for the growth of new layers of calcite (overgrowths). These cleavage fragments were prepared by breaking the large Iceland Spar crystal (Ward’s Science); one crystal was randomly cut with a diamond saw. Each calcite fragment was rinsed with distilled water, treated with a 30% hydrogen peroxide (H2O2) solution for one minute, followed by another distilled water rinse, and a brief (a few seconds) immersion in a 5% hydrochloric acid (HCl) solution. The final stage included two additional rinses in distilled water. Once cleaned, the fragments were securely mounted on glass, which was cleaned following the same protocol, using a small drop of epoxy to prevent displacement during experiments.
To suppress aragonite crystallization and promote calcite growth, Ca-dopped seawater was used as a growth medium. The solution was prepared by dissolving 29.75 g of seawater salt mix (Instant Ocean) in 850 g of distilled water, which resulted in 3.72 wt% of mixed salt concentration. The expected Ca concentration in this seawater mix is 399.5 ppm, which was confirmed by ICP-MS analyses of the solution prepared from Instant Ocean salt in the study of Gabitov et al. [46]. The solution was stirred for 15 min to ensure complete dissolution of the salt and was then pumped through a 0.2 µm Nalgene filter to remove organic molecules from the growth medium. The concentration of Ca was elevated by the addition of 0.29 g of CaCl2·2H2O salt, so the calcite growth medium contained five times more Ca (Ca × 5) than prepared seawater, i.e., 1981 ppm. To promote the growth of calcite on the substrates and suppress its nucleation elsewhere, small aliquots of 0.1 M Na2CO3 were introduced into the growth medium to elevate calcite supersaturation and achieve a pH of ~8.4. Measurements were conducted daily with a Hana Instrument pH probe (Figure 2). Every few days, the growth medium was replaced with a freshly prepared batch of fluid to maintain a consistent chemical composition of the solution and minimize variations in the (E/Ca)fluid during the crystallization of calcite. Each fluid replacement was immediately followed by the addition of a rare earth elemental (REE) spike and another aliquot of 0.1 M Na2CO3. This procedure promoted the growth of calcite in layers, each layer being bracketed by a particular REE spike (i.e., lanthanum (La), neodymium (Nd), terbium (Tb), praseodymium (Pr), and samarium (Sm). Each of the REE spikes was individually introduced into the growth medium at 12, 15, 21, 28, and 31 days, respectively, from the start of the experiment, which was concluded on the 37th day.
2.2. Analytical Techniques
2.2.1. LA-ICP-MS (Depth Profiling)
At the end of each experiment, the cleavage fragments were analyzed with LA-ICP-MS in the direction of calcite growth in (i.e., perpendicular to the substrate). Measurements were conducted in the Department of Engineering and Mathematical Science, University of Western Australia. The newly formed calcite was examined across different depth levels perpendicular to the calcite fragment’s faces, at a submicron spatial resolution. This approach allowed for the collection of E/Ca from the surface of the overgrowth down to the substrate (Figure 3A). The vertically directed laser ablated calcite overgrowth reached the substrate after 50 s of ablation. Isotopes of 7Li, 11B, 23Na, 25Mg, 32S, 43Ca, 39K, 88Sr, 137Ba, 139La, 141Pr, 147Sm, 146Nd, 159Tb, and 163Dy were measured to evaluate (E/Ca)calcite by using E/Ca, which were measured in NIST 614 glass standard (Li/Ca, B/Ca, K/Ca, Ba/Ca, and REE/Ca) and eYel carbonate standard (Na/Ca, Mg/Ca, S/Ca, and Sr/Ca). Each measurement proceeded for 60–70 s at an ablation speed of 0.15 µm/s, yielding 70 data points per profile.
2.2.2. SEM
To identify newly formed layer of calcite, the rim calcite cleavage fragments were mapped with SEM equipped with Backscattered Electron (BSE) and Energy Dispersive X-ray Spectroscopy (EDS). Samples were prepared by mounting cleavage fragments in epoxy with an orientation perpendicular to the calcite growth and the depth profiles. The calcite fragments were successively polished using 600, 800, and then 1200 grit SiC paper (Buehler, Chipping Norton, Australia), and 1 µm Al2O3 powder (Mark V Lab company, East Granby, CT, USA). Imaging was performed at the Alabama Analytical Research Center (AACR) of The University of Alabama using a JEOL 7000 field-emission SEM. Prior to the Measurements were conducted in the Department of Engineering and Mathematical Science, University of Western Australiacharacterization, the samples were coated with a thin (10 nm) layer of gold. The working distance was set up at 11 mm, the voltage at 20 kV, and a probe current of 14 nA. EDS analyses revealed elemental maps with the distribution of Ca, Mg, and S.
3. Results and Discussions
3.1. Calcite Growth and Compositions
The pH varied between 8.4 and 7.9 in each cycle, i.e., during calcite growth between replacements of the growth medium. No nucleation occurred on the walls or bottoms of the containers, suggesting that all calcite precipitated on the substrate. (E/Ca)fluid is not expected to change much during each crystallization cycle, nor during the whole experiment. In a previous study, where little nucleation was observed on the container walls and fluid/air interface, the (E/Ca)fluid generally increased by less than 11% [46]. We anticipate this (E/Ca)fluid change to be smaller in our experiments because no calcite growth (other than on the substrate) was observed. Furthermore, constant replacement of the fluid is expected to reduce changes in (E/Ca)fluid.
The newly formed calcite was identified as thin overgrowth layers on the substrate. The box marked on the BSE map area (Figure 3A) was mapped with EDS and showed a slightly lower content of Ca and higher contents of Mg and S in the overgrowth compared to the substrate (Figure 3B–D). This was explained by a high concentration of Mg and S in the growth medium and its incorporation into calcite overgrowth. Replacing Ca by Mg in calcite structure caused relative depletion of Ca in the overgrowth relative to the substrate. In addition, the textural difference between overgrowth and substrate (Figure 3A) could explain Ca depletion in the overgrowth (Figure 3B).
3.2. Evaluation of Growth Rate
The existence of the overgrowth, which was evaluated using SEM, was confirmed with LA-ICP-MS depth profiling, which showed a gradual (rather than sharp) transition of E/Ca while crossing the boundary between overgrowth and substrate (Figure 4). Typically, these profiles show three distinct groups of data, corresponding to the calcite overgrowth, the calcite substrate, and a mixing area. This mixing zone is likely a result of micro-asperities at the junction of the substrate and overgrowth.
The growth rate of calcite was determined by measuring REE/Ca change with distance between the surface and substrate. The REE spiking sequence was preserved in calcite overgrowth (Figure 5). REE contents in the Iceland Spar substrate were higher than the background but lower than the REE/Ca spike-peak values as measured in the calcite overgrowth. After the introduction of the spike, the REE/Ca rapidly decreased as dissolved REE was consumed by the growing crystal due to the high affinity of REE to calcite [48,49,50,51]. The selected spike distances were used in the calculation of the growth rate of each marked zone. Figure 5 shows REE/Ca data of profile 1 (face 3 or 6), where Tb/Ca and Pr/Ca peaks represent the addition of Tb and Pr spikes into the growth medium. There, the interval between the Pr peak and the sample surface (1.53 − 0 = 1.53 µm) and the interval between the Pr addition and the end of the experiment (37 − 21 = 16 days) correspond to the growth rate (V) of 0.09 µm/day (Figure 5). This V value is higher than the V determined in the previous study (0.0283 µm/day) [46], likely because we periodically replaced the fluid and doped solution with Na2CO3 aliquot, which elevated the calcite supersaturation state in the growth media. Averaged V values are presented in Table 1, where most of the growth rates of individual pairs of crystal faces were determined in detected Pr-end zones. In one profile (no. 1, face 3 or 6), where Tb and Pr were detected, V was calculated in the Tb-Pr zone (0.09 µm/day). V values from these two zones (Tb-Pr and Pr-end) overlap with each other, considering calculated standard errors. Data for all of the individual profiles are presented in supplementary materials as individual spreadsheets.
3.3. Elemental Uptake by Calcite
The ratios of E/Ca were examined against distance from the surface of the newly formed calcite layer (0 µm). Figure 6 shows an example of Mg/Ca and Sr/Ca depth profiles, where overgrowth is enriched in Mg/Ca and Sr/Ca compared to the substrate, which is consistent with our previous findings [46,52]. In this figure, the overgrowth layer is defined from 0 to 2.7 µm (19 s of ablation time), and therefore, average values of Mg/Ca and S/Ca collected in this layer (0 to 2.7 µm) represent the average values of the overgrowth. A monotonic decrease in Mg/Ca and S/Ca after 19 s of ablation likely corresponds to the mixing zone, followed by substrate, where both ratios dropped to near-constant values.
The values of E/Ca averaged for each depth profile, are presented in Figure 7. Although almost all of the E/Ca values overlap with each other, there are some variabilities between the average E/Ca values of different crystallographic faces (Table 2). Faces 3, 6 are enriched in Li/Ca and Mg/Ca but depleted in Na/Ca and Ba/Ca compared to other faces. The ratio of S/Ca is highest in faces 1 and 4 and lowest in the randomly cut calcite, which is also depleted in Ba/Ca. The largest E/Ca differences (20–21%) were observed for monovalent cations (Na and Li) between two pairs of faces (4, 5 and 3, 6). The other significant deviations in Mg/Ca, Ba/Ca, and S/Ca (marked with a star in Table 2) are between 3 and 9%. These E/Ca variabilities could not be explained by the growth rate, as V values on different pairs of faces overlap with each other (Table 1), suggesting the presence of a crystallographic effect on selected E/Ca. However, the observed variations in E/Ca (up to 21%) are comparable to the variabilities for individual pairs of crystal faces (up to 16%) (Figure 7), and therefore, interpretation of the obtained data toward face-selective incorporation of Na, Li, S, and especially Mg and Ba (where variability is relatively small) should be used with caution. No crystallography effect was found for K, Sr, and B (Table 2, Figure 7), which demonstrates a lack of systematic relationships in the incorporation of monovalent cations (Li, Na, K), divalent cations (Mg, Sr, Ba), and anions (SO42− and B(OH)4−) into different crystallographic faces of calcite.
As no systematic face-selective incorporation was observed, we suggest that there is a minor or no crystallographic effect on the incorporation of the study elements. To the best of our knowledge, this is the first study where E/Ca data were obtained directly at microscales. Our findings somewhat contradict the study of Payne et al. [45], who found that Sr incorporation is preferential to calcite crystals that were elongated along the c-axis. This elongation was achieved by adding malonic acid to the solution to promote the growth of calcite obtuse kink sites, which caused Sr uptake to increase by up to a factor of six. However, a direct comparison of our data with those of Payne et al. [45] is vague because of a drastic difference in the solution compositions, as no organic compounds were used in our experiment. Moreover, Payne et al. [45] relayed the bulk analyses of Sr/Ca in calcite crystals, which is different from our in situ technique we applied.
Studies of element incorporation into different calcite faces are limited to Payne et al. [45]. The phenomenon (sectoral zoning) of the selective elemental incorporation into the sectors of individual calcite faces was described in several studies [38,39,40,53]. To explore the possibility of sectoral zoning appearance in our samples, the obtained E/Ca variabilities within individual faces were compared with inter-sectoral E/Ca differences from other studies. Table 3 shows that E/Ca variabilities in calcite from our experiment are far less than those observed in sectoral zoning in the aforementioned studies. Therefore, the presence of sectoral zoning in our experiments is unlikely.
4. Summary
This study revealed in situ data on the uptake of Li, B, Na, Mg, S, K, Sr, and Ba by crystallographic faces of calcite grown at known rates. Somewhat different values of Mg/Ca, Ba/Ca, Li/Ca, and Na/Ca were observed in the pair of parallel crystal faces 3, 6 compared to other faces. S/Ca also varies across the faces and random cuts. However, the observed differences are comparable to the variability of these ratios within individual pairs of faces. In addition, most of the E/Ca values overlap with each other regardless of crystallographic orientation. Therefore, we suggest that crystallographic orientation may have a minor effect on Li, Na, Mg, Ba, and S and no effect on Sr, B, and K incorporation into examined calcite faces, at least at the conditions of our experiment.
Supplementary Materials
The following supporting information can be downloaded at: https://www.mdpi.com/article/10.3390/cryst14050442/s1, All individual profiles are available as LA-ICP-MS supplementary data.
Author Contributions
Conceptualization, M.R. and R.G.; methodology, R.G.; investigation, M.R. and R.G.; validation, R.G and M.R.; data curation, M.R.; writing—original draft preparation, M.R., R.G., A.S. (Aleksey Sadekov), A.P.-H. and C.B.; writing—review and editing, A.S. (Aleksey Sadekov), A.P.-H., C.B. and A.S. (Andrea Stiles); formal analysis, A.S. (Aleksey Sadekov), A.P.-H. and C.B.; project administration, M.R. and R.G and A.S. (Andrea Stiles); supervision, R.G. All authors have read and agreed to the published version of the manuscript.
Funding
This research was funded by Mississippi State University.
Data Availability Statement
The original contributions presented in the study are included in the article; further inquiries can be directed to the corresponding author.
Conflicts of Interest
The authors declare no conflict of interest.
References
- Elderfield, H.; Ganssen, G. Past temperature and δ18O of surface ocean waters inferred from foraminiferal Mg/Ca ratios. Nature 2000, 405, 442–445. [Google Scholar] [CrossRef] [PubMed]
- Vázquez Riveiros, N.; Govin, A.; Waelbroeck, C.; Mackensen, A.; Michel, E.; Moreira, S.; Bouinot, T.; Caillon, N.; Orgun, A.; Brandon, M. Mg/Ca thermometry in planktic foraminifera: Improving paleotemperature estimations for G. bulloides and N. pachyderma left. Geochem. Geophys. Geosyst. 2016, 17, 1249–1264. [Google Scholar] [CrossRef]
- Pacho, L.; de Nooijer, L.; Reichart, G.-J. Element/Ca Ratios in Nodosariida (Foraminifera) and Their Potential Application for Paleoenvironmental Reconstructions. Biogeosciences 2023, 20, 4043–4056. [Google Scholar] [CrossRef]
- John, E.H.; Staudigel, P.T.; Buse, B.; Lear, C.H.; Pearson, P.N.; Slater, S.M. Revealing Their True Stripes: Mg/Ca Banding in the Paleogene Planktonic Foraminifera Genus Morozovella and Implications for Paleothermometry. Paleoceanogr. Paleoclimatology 2023, 38, e2023PA004652. [Google Scholar] [CrossRef]
- Salmon, K.H.; Anand, P.; Sexton, P.F.; Conte, M. Calcification and Growth Processes in Planktonic Foraminifera Complicate the Use of B/Ca and U/Ca as Carbonate Chemistry Proxies. Earth Planet. Sci. Lett. 2016, 449, 372–381. [Google Scholar] [CrossRef]
- Lombard, F.; Labeyrie, L.; Michel, E.; Spero, H.J.; Lea, D.W. Modelling the Temperature Dependent Growth Rates of Planktic Foraminifera. Mar. Micropaleontol. 2009, 70, 1–7. [Google Scholar] [CrossRef]
- Wanamaker Jr, A.D.; Kreutz, K.J.; Wilson, T.; Scourse, J.D.; Heinemeier, J.; Hughes, A.L.C.; Eiríksson, J.; Wild, B. Experimentally determined Mg/Ca and Sr/Ca ratios in juvenile bivalve calcite for Mytilus edulis: Implications for paleotemperature reconstructions. Geo-Mar. Lett. 2008, 28, 359–368. [Google Scholar] [CrossRef]
- Schleinkofer, N.; Raddatz, J.; Evans, D.; Gerdes, A.; Flögel, S.; Voigt, S.; Büscher, J.V.; Wisshak, M. Compositional variability of Mg/Ca, Sr/Ca, and Na/Ca in the deep-sea bivalve Acesta excavata (Fabricius, 1779). PLoS ONE 2021, 16, e0245605. [Google Scholar] [CrossRef] [PubMed]
- Strasser, C.A.; Mullineaux, L.S.; Thorrold, S.R. Temperature and salinity effects on elemental uptake in the shells of larval and juvenile softshell clams Mya arenaria. Mar. Ecol. Prog. Ser. 2008, 370, 155–169. [Google Scholar] [CrossRef]
- Dickson, J.A.D. Fossil Echinoderms As Monitor of the Mg/Ca Ratio of Phanerozoic Oceans. Science 2002, 298, 1222–1224. [Google Scholar] [CrossRef] [PubMed]
- Riechelmann, S.; Mavromatis, V.; Buhl, D.; Dietzel, M.; Hoffmann, R.; Jöns, N.; Kell-Duivestein, I.; Immenhauser, A. Echinoid skeletal carbonate as archive of past seawater magnesium isotope signatures—Potential and limitations. Geochim. Cosmochim. Acta 2018, 235, 333–359. [Google Scholar] [CrossRef]
- Case, D.H.; Robinson, L.F.; Auro, M.E.; Gagnon, A.C. Environmental and biological controls on Mg and Li in deep-sea scleractinian corals. Earth Planet. Sci. Lett. 2010, 300, 215–225. [Google Scholar] [CrossRef]
- Saenger, C.; Gabitov, R.I.; Farmer, J.; Watkins, J.; Stone, R. Linear correlations in bamboo coral d13C and d18O sampled by SIMS and micromill: Evaluating paleoceanographic potential and biomineralization mechanisms using d11B and ∆47 variability. Chem. Geol. 2017, 454, 1–14. [Google Scholar] [CrossRef]
- Gagnon, A.C.; Adkins, J.F.; Fernandez, D.P.; Robinson, L.F. Sr/Ca and Mg/Ca vital effects correlated with skeletal architecture in a scleractinian deep-sea coral and the role of Rayleigh fractionation. Earth Planet. Sci. Lett. 2007, 261, 280–295. [Google Scholar] [CrossRef]
- Börner, N.; De Baere, B.; Yang, Q.; Jochum, K.P.; Frenzel, P.; Andreae, M.O.; Schwalb, A. Ostracod Shell Chemistry as Proxy for Paleoenvironmental Change. Quat. Int. 2013, 313–314, 17–37. [Google Scholar] [CrossRef]
- Rodríguez, M.; Not, C. Calibration of Mg/Ca and Sr/Ca in coastal marine ostracods as a proxy for temperature. Biogeosciences 2021, 18, 1987–2001. [Google Scholar] [CrossRef]
- Wansard, G.; De Deckker, P.; Julia, R. Variability in ostracod partition coefficients D Sr and D Mg: Implications for lacustrine palaeoenvironmental reconstructions. Chem. Geol. 1998, 146, 39–54. [Google Scholar] [CrossRef]
- Elmore, A.C.; Sosdian, S.; Rosenthal, Y.; Wright, J.D. A Global Evaluation of Temperature and Carbonate Ion Control on Mg/Ca Ratios of Ostracoda Genus Krithe. Geochem. Geophys. Geosyst. 2012, 13, Q09003. [Google Scholar] [CrossRef]
- Coggon, R.M.; Teagle, D.A.; Smith-Duque, C.E.; Alt, J.C.; Cooper, M.J. Reconstructing past seawater Mg/Ca and Sr/Ca from mid-ocean ridge flank calcium carbonate veins. Science 2010, 327, 1114–1117. [Google Scholar] [CrossRef] [PubMed]
- Ligi, M.; Bonatti, E.; Cuffaro, M.; Brunelli, D. Post-Mesozoic Rapid Increase of Seawater Mg/Ca due to Enhanced Mantle-Seawater Interaction. Sci. Rep. 2013, 3, 2752. [Google Scholar] [CrossRef] [PubMed]
- Kısakürek, B.; James, R.H.; Harris, N.B.W. Li and δ7Li in Himalayan rivers: Proxies for silicate weathering? Earth Planet. Sci. Lett. 2005, 237, 387–401. [Google Scholar] [CrossRef]
- Hathorne, E.C.; James, R.H. Temporal record of lithium in seawater: A tracer for silicate weathering? Earth Planet. Sci. Lett. 2006, 246, 393–406. [Google Scholar] [CrossRef]
- Katz, A. The Interaction of Magnesium with Calcite during Crystal Growth at 25–90 °C and One Atmosphere. Geochim. Cosmochim. Acta 1973, 37, 1563–1586. [Google Scholar] [CrossRef]
- Mucci, A. Influence of temperature on the composition of magnesian calcite overgrowths precipitated from seawater. Geochim. Cosmochim. Acta 1987, 51, 1977–1984. [Google Scholar] [CrossRef]
- Spivack, A.J.; You, C.-F.; Smith, H.J. Foraminiferal boron isotope ratio as a proxy for surface ocean pH over the past 21 Myr. Nature 1993, 363, 149–151. [Google Scholar] [CrossRef]
- Sanyal, A.; Hemming, N.G.; Hanson, G.N.; Broecker, W.S. Evidence for a higher pH in the glacial ocean from boron isotopes in foraminifera. Nature 1995, 373, 234–236. [Google Scholar] [CrossRef]
- Sanyal, A.; Hemming, N.G.; Broecker, W.S.; Lea, D.W.; Spero, H.J.; Hanson, G.N. Oceanic pH control on the boron isotopic composition of foraminifera: Evidence from culture experiments. Paleoceanogr. Paleoclimatol. 1996, 11, 513–517. [Google Scholar] [CrossRef]
- Foster, G.L. Seawater pH, pCO2 and [CO32−] variations in the Caribbean Sea over the last 130 Kyr: A boron isotope and B/Ca study of planktic foraminifera. Earth Planet. Sci. Lett. 2008, 271, 254–266. [Google Scholar] [CrossRef]
- Mucci, A.; Morse, J.W. The incorporation of Mg2+ and Sr2+ into calcite overgrowths: Influences of growth rate and solution composition. Geochim. Cosmochim. Acta 1983, 47, 217–233. [Google Scholar] [CrossRef]
- Lorens, R.B. Sr, Cd, Mn, and Co distribution coefficients in calcite as a function of calcite precipitation rate. Geochim. Cosmochim. Acta 1981, 45, 553–561. [Google Scholar] [CrossRef]
- Tesoriero, A.J.; Pankow, J.F. Solid solution partition of Sr2+, Ba2+, and Cd2+ to calcite. Geochim. Cosmochim. Acta 1996, 60, 1053–1063. [Google Scholar] [CrossRef]
- Stoll, H.M.; Rosenthal, Y.; Falkowski, P. Climate proxies from Sr/Ca of coccolith calcite: Calibrations from continuous culture of Emiliania huxleyi. Geochim. Cosmochim. Acta 2002, 66, 927–936. [Google Scholar] [CrossRef]
- Tang, J.; Köhler, S.J.; Dietzel, M. Sr2+/Ca2+ and 44Ca/40Ca fractionation during inorganic calcite formation: I. Sr incorporation. Geochim. Cosmochim. Acta 2008, 72, 3718–3732. [Google Scholar] [CrossRef]
- Mavromatis, V.; Gautier, Q.; Bosc, O.; Schott, J. Kinetics of Mg partition and Mg stable isotope fractionation during its incorporation in calcite. Geochim. Cosmochim. Acta 2013, 114, 188–203. [Google Scholar] [CrossRef]
- Gabitov, R.I.; Watson, E.B. Partitioning of strontium between calcite and fluid. Geochem. Geophys. 2006, 7, Q11004. [Google Scholar] [CrossRef]
- Gabitov, R.I.; Rollion-Bard, C.; Tripati, A.; Sadekov, A. In situ study of boron partitioning between calcite and fluid at different crystal growth rates. Geochim. Cosmochim. Acta 2014, 137, 81–92. [Google Scholar] [CrossRef]
- Gabitov, R.I.; Sadekov, A.; Leinweber, A. Crystal growth rate effect on Mg/Ca and Sr/Ca partitioning between calcite and fluid: An in-situ approach. Chem. Geol. 2014, 367, 70–82. [Google Scholar] [CrossRef]
- Paquette, J.; Reeder, R.J. Relationship between surface structure, growth mechanism, and trace element incorporation in calcite. Geochim. Cosmochim. Acta 1995, 59, 735–749. [Google Scholar] [CrossRef]
- Reeder, R.J. Interaction of divalent cobalt, zinc, cadmium, and barium with the calcite surface during layer growth. Geochim. Cosmochim. Acta 1996, 60, 1543–1552. [Google Scholar] [CrossRef]
- Hemming, N.G.; Hanson, G.N. Boron isotopic composition and concentration in modern marine carbonates. Geochim. Cosmochim. Acta 1992, 56, 537–543. [Google Scholar] [CrossRef]
- Shannon, R.D. Study on Revised Effective Ionic Radii in Halides and Chalcogenides. Acta Crystallogr. Sect. A Found. Crystallogr. 1976, A32, 751–767. [Google Scholar]
- Wasylenki, L.E.; Dove, P.M.; Wilson, D.S.; De Yoreo, J.J. Nanoscale effects of strontium on calcite growth: An in situ AFM study in the absence of vital effects. Geochim. Cosmochim. Acta 2005, 69, 3017–3027. [Google Scholar] [CrossRef]
- Wasylenki, L.E.; Dove, P.M.; Wilson, D.S.; De Yoreo, J.J. Effects of temperature and transport conditions on calcite growth in the presence of Mg2+: Implications for geothermometry. Geochim. Cosmochim. Acta 2005, 69, 4227–4236. [Google Scholar] [CrossRef]
- Hemming, N.G.; Reeder, R.J.; Hart, S.R. Growth-step selective incorporation of boron on the calcite surface. Geochim. Cosmochim. Acta 1998, 62, 2915–2922. [Google Scholar] [CrossRef]
- Payne, V.E.; Rickaby, R.E.M.; Benning, L.G.; Shaw, S. Calcite crystal growth orientation: Implications for trace metal uptake into coccoliths. Miner. Mag. 2008, 72, 269–272. [Google Scholar] [CrossRef]
- Gabitov, R.I.; Borrelli, C.; Buettner, J.; Kirkland, B.; Skarke, A.; Trail, D.; Garner, B.; Testa, M.; Wahidi, M.; Hoff, C.; et al. Characterization of Carbonate Crust from Methane Seep on North Atlantic Margin. Minerals 2019, 9, 138. [Google Scholar] [CrossRef]
- Gabitov, R.; Sadekov, A.; Perez-Huerta, A.; Borrelli, C.; Rezaei, M. Elemental uptake by individual calcite crystals. In Proceedings of the 2022 Goldschmidt Conference, Honolulu, HI, USA, 11–15 July 2022. [Google Scholar]
- Zhong, S.; Mucci, A. Partitioning of rare earth elements (REEs) between calcite and seawater solutions at 25 °C and 1 atm, and high dissolved REE concentrations. Geochim. Cosmochim. Acta 1995, 59, 443–453. [Google Scholar] [CrossRef]
- Toyama, K.; Terakado, Y. Experimental study of rare earth element partitioning between calcite and sodium chloride solution at room temperature and pressure. Geochem. J. 2014, 48, 463–477. [Google Scholar] [CrossRef]
- Voigt, M.; Mavromatis, V.; Oelkers, E.H. The experimental determination of REE partition coefficients in the water-calcite system. Chem. Geol. 2017, 462, 30–43. [Google Scholar] [CrossRef]
- Gabitov, R.I.; Sadekov, A.; Migdisov, A. REE incorporation into calcite individual crystals as one time spike addition. Minerals 2017, 7, 204. [Google Scholar] [CrossRef]
- Rezaei, M.; Gabitov, R.; Sadekov, A. Crystallographic influence on elemental uptake by calcite from artificial seawater. In Proceedings of the GSA Connects 2023, Pittsburgh, PA, USA, 15–18 October 2023; Geological Society of America: Boulder, CO, USA, 2023. Paper No. 254-11. [Google Scholar]
- Gabitov, R.I.; Sadekov, A.; Dyer, J.; Perez-Huerta, A.; Xu, H.; Migdisov, A. Sectoral and growth rate control on elemental uptake by individual calcite crystals. Chem. Geol. 2021, 585, 120589. [Google Scholar] [CrossRef]
Figure 1.
A calcite crystal with various faces labeled as “Face 1 or 2”, “Face 4 or 5”, and “Face 3 or 6”.
Figure 1.
A calcite crystal with various faces labeled as “Face 1 or 2”, “Face 4 or 5”, and “Face 3 or 6”.

Figure 2.
Evolution of pH in the experimental solution. This solution was replaced after the end of each growth cycle, i.e., a few minutes before REE spike and Na2CO3 aliquot were introduced.
Figure 2.
Evolution of pH in the experimental solution. This solution was replaced after the end of each growth cycle, i.e., a few minutes before REE spike and Na2CO3 aliquot were introduced.

Figure 3.
SEM BSE (A) and EDS (B–D) imaging of the substrate and newly formed calcite. (A) An example of an SEM BSE map of the substrate and newly formed calcite. The arrow shows the direction of laser ablation. The elapsed ablation time scale is positioned on the map, showing that the overgrowth/substrate boundary was reached after 50 s of ablation. (B–D) Brighter colors on EDS maps indicate higher concentrations of Mg and S in calcite overgrowth. These BSE and EDS maps were collected during the development of the calcite growth method (Gabitov et al. [47]).
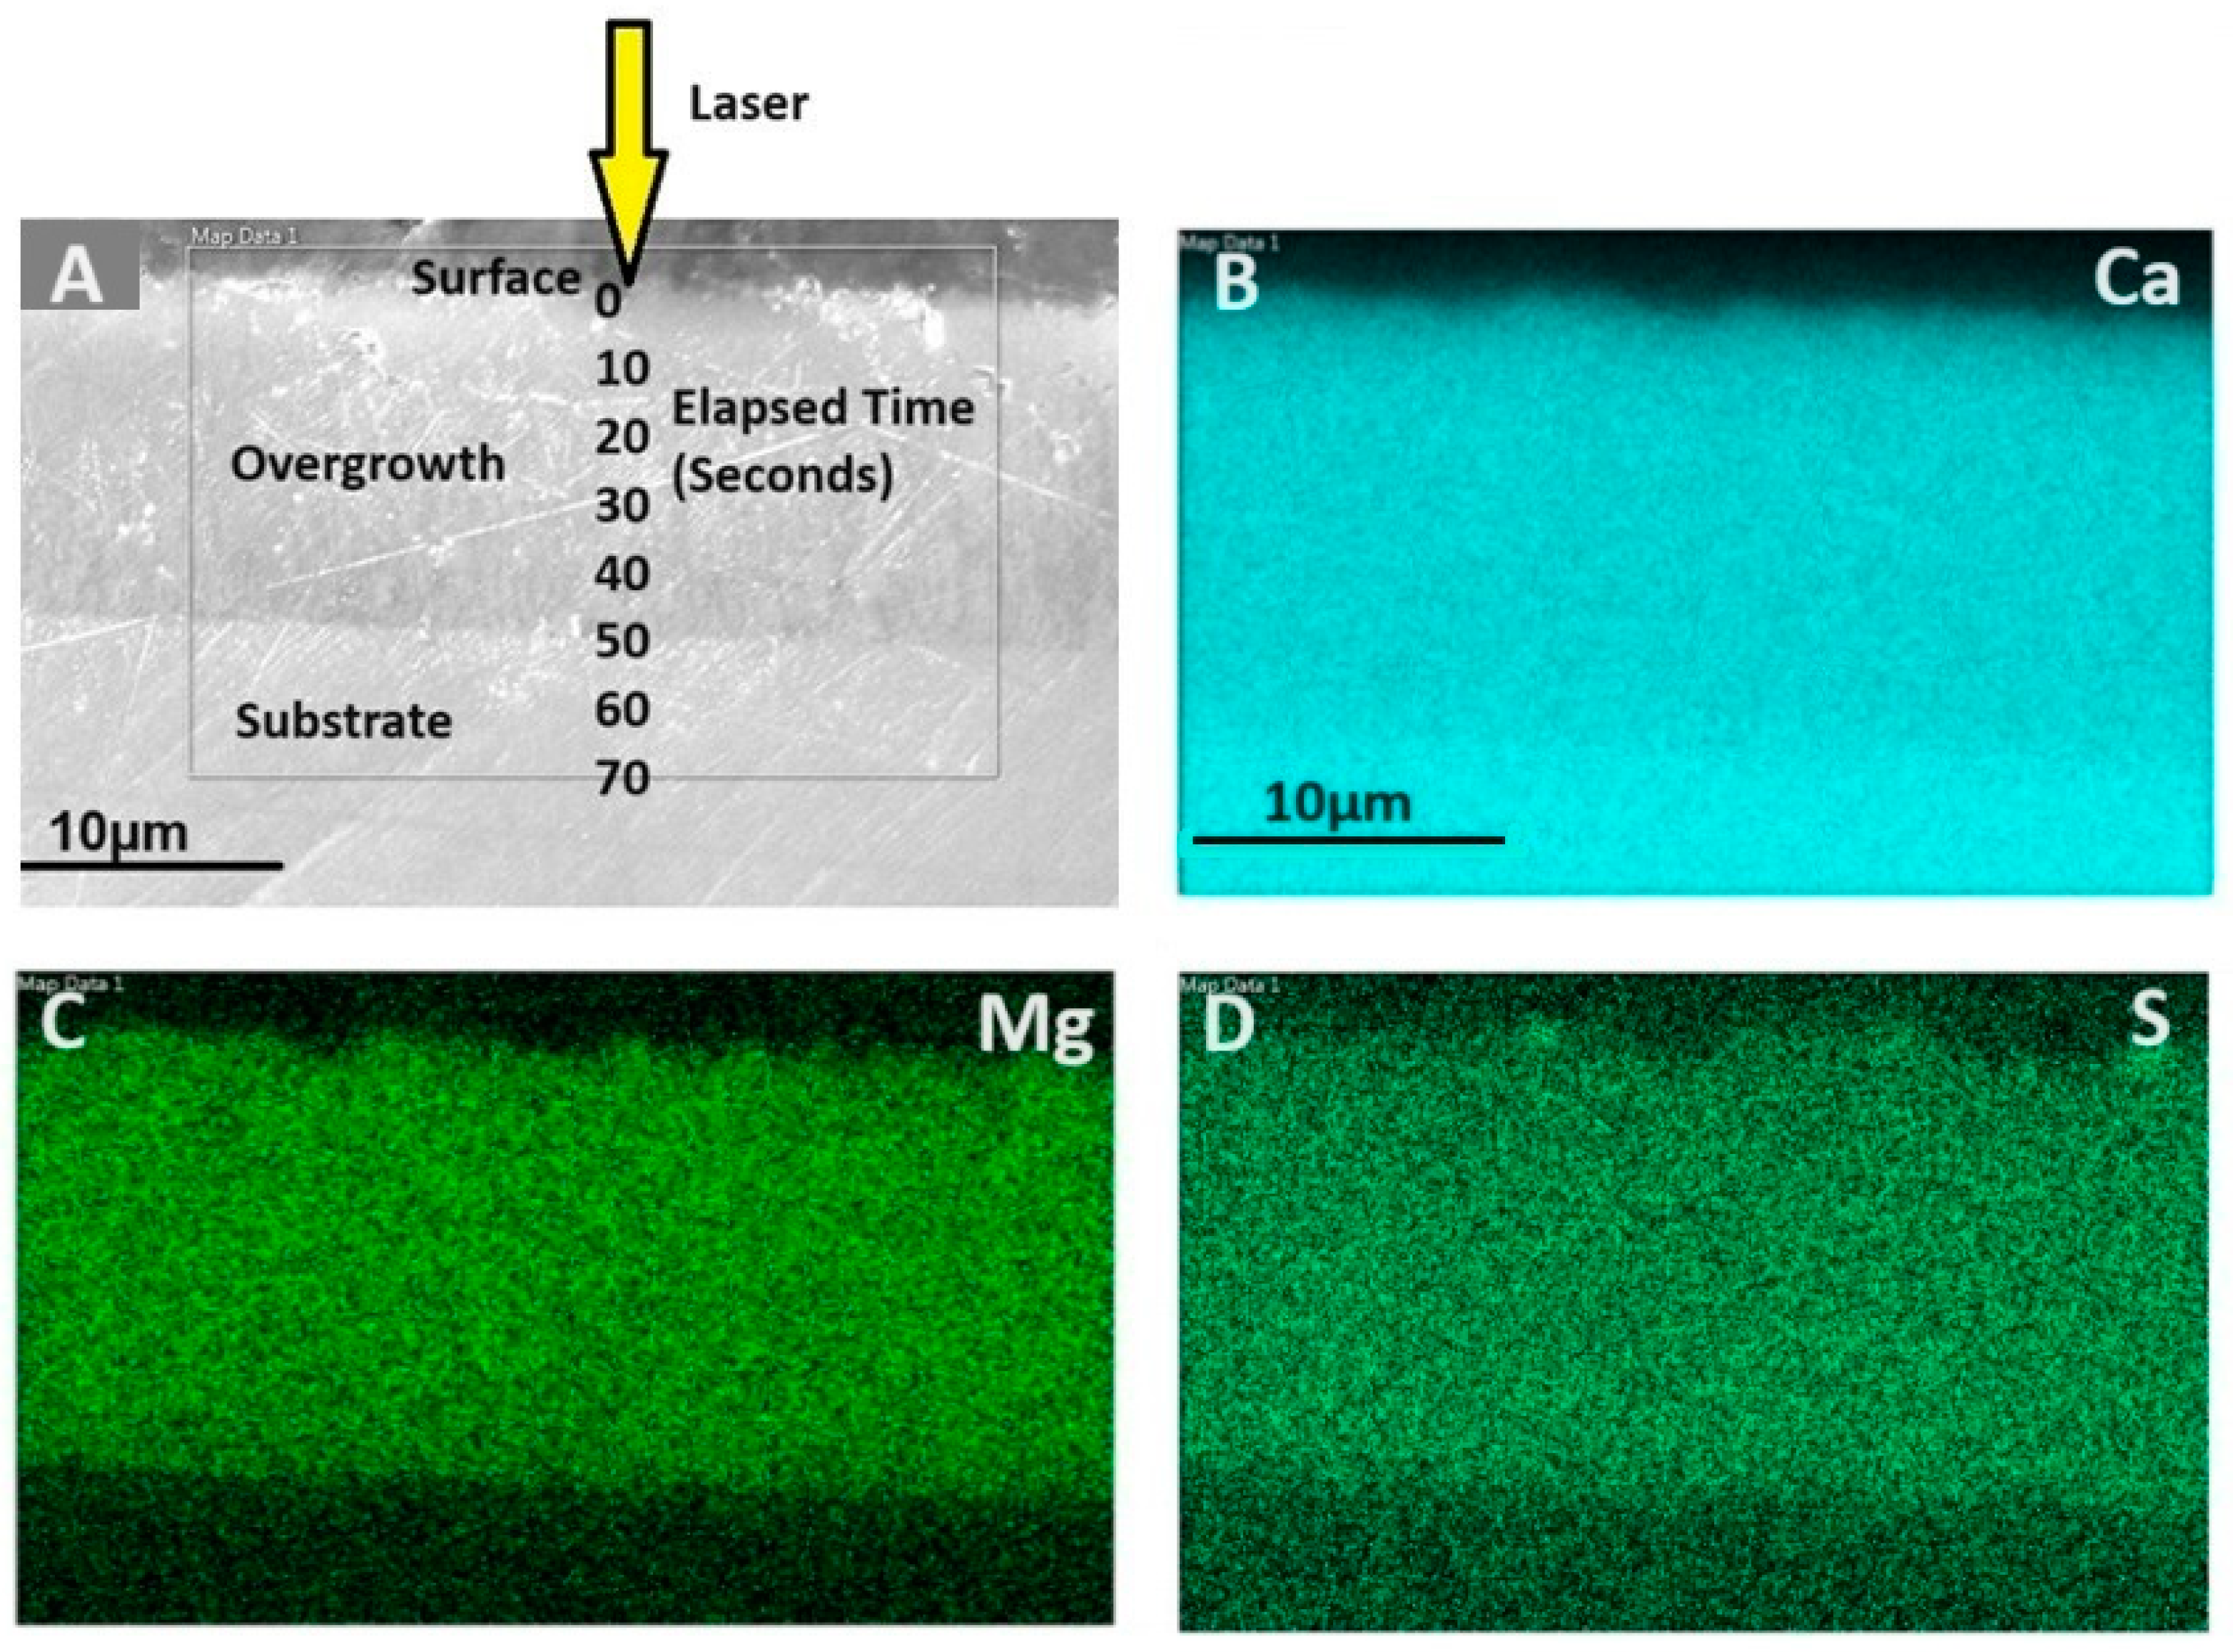
Figure 4.
Example of identification of calcite overgrowth, substrate, and mixing zone using S/Ca and Mg/Ca ratios measured using LA-ICP-MS. The data are sourced from depth profile 1 of the calcite fragments oriented on either face 1 or 2.
Figure 4.
Example of identification of calcite overgrowth, substrate, and mixing zone using S/Ca and Mg/Ca ratios measured using LA-ICP-MS. The data are sourced from depth profile 1 of the calcite fragments oriented on either face 1 or 2.

Figure 5.
Example of REE patterns determined via LA-ICP-MS in calcite overgrowth: Each graph displays a peak indicating the spike of REE to the growth medium. These plots are associated with profile 1, face 3, or 6.
Figure 5.
Example of REE patterns determined via LA-ICP-MS in calcite overgrowth: Each graph displays a peak indicating the spike of REE to the growth medium. These plots are associated with profile 1, face 3, or 6.

Figure 6.
An example of S/Ca and Mg/Ca plots against ablation time (i.e., distance from the overgrowth surface toward the substrate). This plot is based on the data collected on cleavage fragment via profile 1, on face 4 or 5.
Figure 6.
An example of S/Ca and Mg/Ca plots against ablation time (i.e., distance from the overgrowth surface toward the substrate). This plot is based on the data collected on cleavage fragment via profile 1, on face 4 or 5.

Figure 7.
Sr/Ca, Mg/Ca, B/Ca, Ba/Ca, S/Ca, Na/Ca, K/Ca, and Li/Ca on different calcite faces. Each rectangular box displays a group of profiles for a specific pair of faces. The error bars represent the standard error of the E/Ca in individual profiles.
Figure 7.
Sr/Ca, Mg/Ca, B/Ca, Ba/Ca, S/Ca, Na/Ca, K/Ca, and Li/Ca on different calcite faces. Each rectangular box displays a group of profiles for a specific pair of faces. The error bars represent the standard error of the E/Ca in individual profiles.


Table 1.
Growth rates (V) of individual pairs of calcite faces.
| n | V Face 1, or 2 (µm/day) | s.e. | n | V Face 4 or 5 (µm/day) | s.e. | n | V Face 3 or 6 (µm/day) | s.e. | n | V, Cut (µm/day) | s.e. | n | V Total µm/day | s.e. |
|---|---|---|---|---|---|---|---|---|---|---|---|---|---|---|
| 4 | 0.097 | 0.019 | 5 | 0.121 | 0.015 | 5 | 0.111 | 0.004 | 3 | 0.119 | 0.010 | 17 | 0.112 | 0.027 |
Standard error s.e. = s.d/√n, where s.d. = standard deviation; n is the number of LA-ICP-MS depth profiles.
Table 2.
Average values of Mg/Ca, Sr/Ca, S/Ca, Ba/Ca, Li/Ca, Na/Ca, and K/Ca for different pairs of faces and randomly cut sections.
Table 2.
Average values of Mg/Ca, Sr/Ca, S/Ca, Ba/Ca, Li/Ca, Na/Ca, and K/Ca for different pairs of faces and randomly cut sections.
| E/Ca (mmol/mol) | Face 1, 2 | s.e. | Face 4, 5 | s.e. | Face 3, 6 | s.e. | Cut | s.e. |
|---|---|---|---|---|---|---|---|---|
| Mg/Ca | 26.6470 | 0.1494 | 27.0829 | 0.5174 | 29.0462 * | 0.2989 | 26.9673 | 0.1955 |
| Sr/Ca | 0.9128 | 0.0122 | 0.8963 | 0.0056 | 0.8924 | 0.0068 | 0.8901 | 0.0162 |
| S/Ca | 44.7119 * | 0.3714 | 42.2531 | 0.4903 | 42.7114 | 0.6431 | 40.0656 * | 0.5528 |
| Ba/Ca | 0.0323 | 0.0004 | 0.0320 | 0.0004 | 0.0301 * | 0.0005 | 0.0297 * | 0.0011 |
| B/Ca | 0.0863 | 0.0031 | 0.0857 | 0.0027 | 0.0906 | 0.0015 | 0.0845 | 0.0017 |
| Li/Ca | 0.0103 | 0.0016 | 0.0103 | 0.0003 | 0.0132 * | 0.0004 | 0.0127 | 0.0006 |
| Na/Ca | 7.6817 | 0.6613 | 9.4596 | 1.4902 | 6.1757 * | 0.2046 | 6.9840 | 0.8160 |
| K/Ca | 0.9384 | 0.0548 | 0.9777 | 0.0626 | 0.9826 | 0.0261 | 0.8907 | 0.0403 |
(*)—E/Ca are different than the rest of the dataset. The standard error (s.e.) is based on the analyses of 3 to 5 profiles per pair of faces or random cut.
Table 3.
Comparison of variation in E/Ca in individual calcite faces.
| Experiment | Li/Ca | B/Ca | Mg/Ca | Sr/Ca | S/Ca | Ba/Ca | Na/Ca | K/Ca |
|---|---|---|---|---|---|---|---|---|
| F 1, or 2 | ×1.83 | ×1.17 | ×1.02 | ×1.06 | ×1.04 | ×1.05 | ×1.49 | ×1.32 |
| F 4, or 5 | ×1.16 | ×1.18 | ×1.11 | ×1.03 | ×1.07 | ×1.06 | ×2.18 | ×1.37 |
| F 3, or 6 | ×1.20 | ×1.09 | ×1.06 | ×1.04 | ×1.08 | ×1.08 | ×1.21 | ×1.15 |
| Cut | ×1.17 | ×1.07 | ×1.03 | ×1.06 | ×1.05 | ×1.13 | ×1.41 | x1.17 |
| Gabitov et al., 2021 [53] | ×10 | ×10 | ×3 | ×2 | - | - | - | - |
| Reeder, 1996 [39] | - | - | - | ×2 | - | ×2 | - | - |
| Hemming et al., 1998 [44] | - | ×9 | - | - | - | - | - | - |
| Paquette and Reeder, 1995 [38] | - | - | x7 | ×2 | - | - | - | - |
Disclaimer/Publisher’s Note: The statements, opinions and data contained in all publications are solely those of the individual author(s) and contributor(s) and not of MDPI and/or the editor(s). MDPI and/or the editor(s) disclaim responsibility for any injury to people or property resulting from any ideas, methods, instructions or products referred to in the content. |
© 2024 by the authors. Licensee MDPI, Basel, Switzerland. This article is an open access article distributed under the terms and conditions of the Creative Commons Attribution (CC BY) license (https://creativecommons.org/licenses/by/4.0/).
Share and Cite
MDPI and ACS Style
Rezaei, M.; Gabitov, R.; Sadekov, A.; Perez-Huerta, A.; Borrelli, C.; Stiles, A. Elemental Uptake by Different Calcite Crystal Faces: An In Situ Study. Crystals 2024, 14, 442. https://doi.org/10.3390/cryst14050442
AMA Style
Rezaei M, Gabitov R, Sadekov A, Perez-Huerta A, Borrelli C, Stiles A. Elemental Uptake by Different Calcite Crystal Faces: An In Situ Study. Crystals. 2024; 14(5):442. https://doi.org/10.3390/cryst14050442
Chicago/Turabian StyleRezaei, Mustafa, Rinat Gabitov, Aleksey Sadekov, Alberto Perez-Huerta, Chiara Borrelli, and Andrea Stiles. 2024. "Elemental Uptake by Different Calcite Crystal Faces: An In Situ Study" Crystals 14, no. 5: 442. https://doi.org/10.3390/cryst14050442
Note that from the first issue of 2016, this journal uses article numbers instead of page numbers. See further details here.