Article

Structural, Dielectric, Electrical, and Magnetic Characteristics of Bi0.8Ba0.1Er0.1Fe0.96Cr0.02Mn0.02O3 Nanoparticles

1
Laboratoire de Physique Appliquée, Faculté des Sciences, Université de Sfax, B.P. 1171, Sfax 3000, Tunisia
2
University of Coimbra, CFisUC, Physics Department, Rua Larga, 3004-516 Coimbra, Portugal
3
I3N and Physics Department, University of Aveiro, 3810-193 Aveiro, Portugal
4
Physics Department, College of Science, Jouf University, Sakaka P.O. Box 2014, Saudi Arabia
*
Authors to whom correspondence should be addressed.
Crystals 2024, 14(5), 445; https://doi.org/10.3390/cryst14050445
Submission received: 14 March 2024 / Revised: 2 May 2024 / Accepted: 5 May 2024 / Published: 7 May 2024

Abstract

:
Bi0.8Ba0.1Er0.1Fe0.96Cr0.02Mn0.02O3 (BBEFCMO) multiferroic ceramic was synthesized through the sol-gel route. The impact of incorporating various dopants into both A and B sites of the BiFeO3 was investigated, and structural, Raman, dielectric, electric, and magnetic properties were studied. X-ray diffraction analysis and Raman spectroscopy revealed a rhombohedral structure with the R3c space group for the doped material (BBEFCMO). Dielectric properties were examined across a frequency range of 102–106 Hz. The present multiferroic material exhibits a colossal dielectric constant and minimal dielectric loss tangent, making it suitable for applications in energy storage. Furthermore, the Cole-Cole type of relaxation was deduced from the imaginary part of the modulus for both grain and boundary-grain contributions. Overall, this study indicates that substituting ions in both A and B sites of BiFeO3 significantly enhances its multiferroic properties, as evidenced by dielectric and magnetic measurements.

1. Introduction

The multiferroic compounds with an ABO3 formula have drawn the attention of researchers thanks to their unique properties and their various technological applications over the past decades in fields such as sensors, optoelectronic devices, spintronics, and transducers [1,2,3,4]. As a material extensively researched for its multiferroic properties, BiFeO3 exhibits a rhombohedral structure with the R3c space group, displaying ferroelectricity, ferro-elastic, and anti-ferromagnetism properties simultaneously at room temperature [5,6,7,8].
While the ferroelectricity behavior of this compound emanates from the distortion of 6s2 of the Bi3+ ions, their magnetic characteristics are linked to the super-exchange Fe-O-Fe interaction [9]. However, the significant leakage current densities, the weak anti-ferromagnetic behavior, and the poor ferroelectric hysteresis block their application. Unfortunately, the reduced polarization value is ascribed to the existence of secondary phases for the BiFeO3 compound [10].
To address these drawbacks and enhance the characteristics of undoped BiFeO3, researchers have explored partial substitution of Bi3+ (A-site doping) or Fe3+ (B-site doping), potentially leading to a highly dielectric constant, improvement of ferroelectric and ferromagnetic (FM) characteristics, and the elimination of the small impurity phase of the BiFeO3 [11,12,13].
G. Catalan et al. [14] showed that the magnetic Néel temperature increased in the Ca-doped BiFeO3 sample. Furthermore, the substitution of the Bi3+ ions for Ba2+ ones led to a pronounced ferromagnetic hysteresis loop for the BiFeO3 sample [15].
The replacement of Iron (3+) ions by other transition metal ones, such as Mn ones, increases not only the Iron–Oxygen–Iron angle, but also the super-exchange interaction between Iron ions, and, therefore, enhances the magnetic properties [16].
Moreover, the concurrent substitutions of A and B ions with Er, Ba, Cr, and Mn ions exhibit an enhancement impact on dielectric, electric, and magnetic properties, as has recently been proven by the studies on Ba/Cr [17,18], Ba/Mn [19,20], Er/Mn [21], and Ba/Er [22] co-doped BFO materials. Furthermore, V.R. Palkar et al. [23] observed an improvement in the magnetization of the La/Mn co-doped BiFeO3. Conversely, some reports have demonstrated that the incorporation of Eu3+ and Co3+ ions into the A-site and B-site of the BiFeO3 boosts the saturation magnetization (MS) and coercivity (HC) (20 times more than the pure BiFeO3) [24].
Indeed, over the last decade, researchers have adopted a new strategy for further enhancing the ferromagnetic and ferroelectric properties in BFO multiferroic material. This involves the simultaneous doping of both A and B sites with more than two ions [25,26,27,28]. It is worth noting that only a few studies have focused on the co-doping of multiple elements into both A and B sites of BiFeO3 materials. This approach fosters increased ferromagnetic interactions and, concurrently, regulates structural transition and oxygen vacancy concentrations, thus obtaining the perfect parameters of ferroelectric properties, such as the high remnant polarization, the small coercive field, and reduced leakage current, etc. [29].
In our recent investigation, we explored the structural, morphological, ac-electrical, and dielectric characteristics of the (Bi0.8Ba0.1Er0.1)(Fe0.96Cr0.02Co0.02)O3 nanoparticles synthesized through the sol-gel method. We have reported that the substitution of Lanthanum and Calcium enhances the magnetization (10 times higher than the BiFeO3 sample) [30].
The present study accounts for the synthesis of Bi0.8Ba0.1Er0.1Fe0.96Cr0.02Mn0.02O3 (BBEFCMO) nanoparticles via the sol-gel method, followed by calcination at 800 °C. It explores the impact of Cr3+ and Mn3+ ion incorporation into the B site on structural, dielectric, electric, and magnetic properties. Remarkably, BBEFCMO material demonstrates interesting dielectric and magnetic characteristics, making it a potential candidate for diverse technological applications, particularly in energy storage.

2. Materials and Methods

Bismuth, Barium, Erbium, Iron, Chromium, and Manganese nitrates (from Sigma-Aldrich) have been used to prepare Bi0.8Ba0.1Er0.1Fe0.96Cr0.02Mn0.02O3 (BBEFCMO) nanoparticles with respect to the sol-gel Pechini method [31,32]. According to the respective stoichiometric proportion, sufficient quantities of each nitrate were mixed and dissolved in distilled water. Subsequently, citrate acid (C6H8O7) was introduced as a chelating agent into the mixture of all nitrates, ensuring the specified molar ratio n(metal ions):n(citric) = 1:2. The solution was kept at 70 °C under magnetic stirring until the obtention of a brown viscose gel. The gel was heated at 170 °C to get a dark powder, which was ground-heated at 300 °C for 12 h in order to eliminate all organic entities. Later, the obtained powder was finely ground and then compressed into small cylindrical forms, measuring roughly 8 mm in diameter and about 3 mm in thickness. These pellets were subsequently heated at 800 °C for a duration of 4 h.
A Bruker 8D Advance X-ray powder diffractometer (Karlsruhe, Germany) was employed to study the phase and structural properties by adjusting the RXD pattern with FullProf software (version: September-20) [33].
Transmission electron microscopy (TEM) (Hitachi H-800, Tokyo, Japan) was conducted in a FEI Tecnai G2 microscope employing an accelerating voltage of 200 kilovolts. For TEM observations, the powder was dispersed in ethanol by sonication and dropped on carbon-coated copper grids.
Mössbauer spectroscopy was used to record spectra at room temperature using a WissEl (Germany) conventional transmission geometry spectrometer and a 57Co/Rh source.
Raman spectroscopy (Horiba, Vénissieux, France) at room temperature (RT) was conducted with backscattering geometry, utilizing a Jobin Yvon HR 800 system and employing an excitation wavelength of 473 nm.
Dielectric measurements were conducted across a temperature range of 120 to 400 K, employing a cryostat setup with a nitrogen bath. During conducting measurements, the materials were maintained in a Helium atmosphere to reduce thermal gradients, and the sample temperature was regulated using an Oxford Research IT-C4 system in conjunction with a platinum sensor. We measured the impedance of the samples using an Agilent 4294 Network Analyzer, which operated in the range of 100 Hz to 1 MHz, with a configuration involving capacitance in parallel with resistance (Cp–Rp configuration) [34,35,36].
Hysteresis loops (M vs. µ0H) were recorded at room temperature, subject to an applied field ranging from −10 to 10 Tesla. The measurements were conducted using a VSM system from Cryogenics, with the sample axis aligned parallel to the direction of the applied magnetic field.

3. Results and Discussion

3.1. Structural Properties

3.1.1. Powder X-ray Diffraction (XRD)

Figure 1a presents the XRD pattern of the (Bi0.8Ba0.1Er0.1)(Fe0.96Cr0.02Mn0.02)O3 compound. As expected, the highest reflection peaks in the pattern precisely correspond to those documented and recognized for the rhombohedral crystal structure of the BiFeO3 (JCPDS file no. 71-2494) [37]. The pronounced intensities of these diffraction peaks indicate the good crystallization of the compound under investigation. Nevertheless, supplementary peaks with low intensities were observed and analyzed with Xpert-height score software. The presence of the triclinic Bi4O7 (P-1 space group) and Ba2FeO4 (P12/c1 space group) secondary phases were identified. These impurities emanate from the volatility of bismuth ions that were identified in doped BiFeO3 materials [38,39]. To further analyze the substitution effect on structural properties, we executed a Rietveld refinement using FullProf software. We began by refining the profile, adjusting the lattice parameters for all phases. Subsequently, atomic positions, the Biso, and the corresponding occupancy of all atoms were individually adjusted for accuracy and enhancement of the structure. As presented in Figure 1a, the observed (Yobs) data aligned closely with the refined XRD data (Ycal), giving almost a linear behavior of their differences (Yobs–Ycal: blue line). The various resulting parameters of all phases are listed in Table 1.
As regards the quantitative phase compositions of the R3c, P-1, and P12/c1 phases in the studied compound, they were found to be around 95.30%, 2.63%, and 2.07%, respectively. It is worth mentioning that the c lattice parameter and cell volume V were observed to be slightly lower than values reported in an earlier study about the Bi0.8Ba0.1Er0.1Fe0.96Cr0.02Co0.02O3 nanoparticles [30], which can be attributed to the smaller ionic radius of Mn3+ ions compared to Co2+ ones. Figure 1b presents the 3D schematic representation of the crystal structure of the studied sample using the Vista software, according to the structural refinement results. It is evident that the substitution in both the A site and B site of the BiFeO3 oxide induces a tilt and a compaction of the Octahedron FeO6.
On the other side, we analyzed the average crystallite size of the studied compound according to the Williamson–Hall formalism (Equation (1)) [40].
β h k l c o s ( θ ) = 0.9 × λ D W H + 4 × ε × s i n ( θ )
ε represents the strain attributed to the nanoparticles, θ denotes the peak position, DW-H indicates the crystallite size (measured in nanometers), λ stands for the wavelength of the X-ray radiation source (which is 1.5406 angstroms), and β refers to the integral width. The average calculated crystallite size was found to be equal to 52 nm.

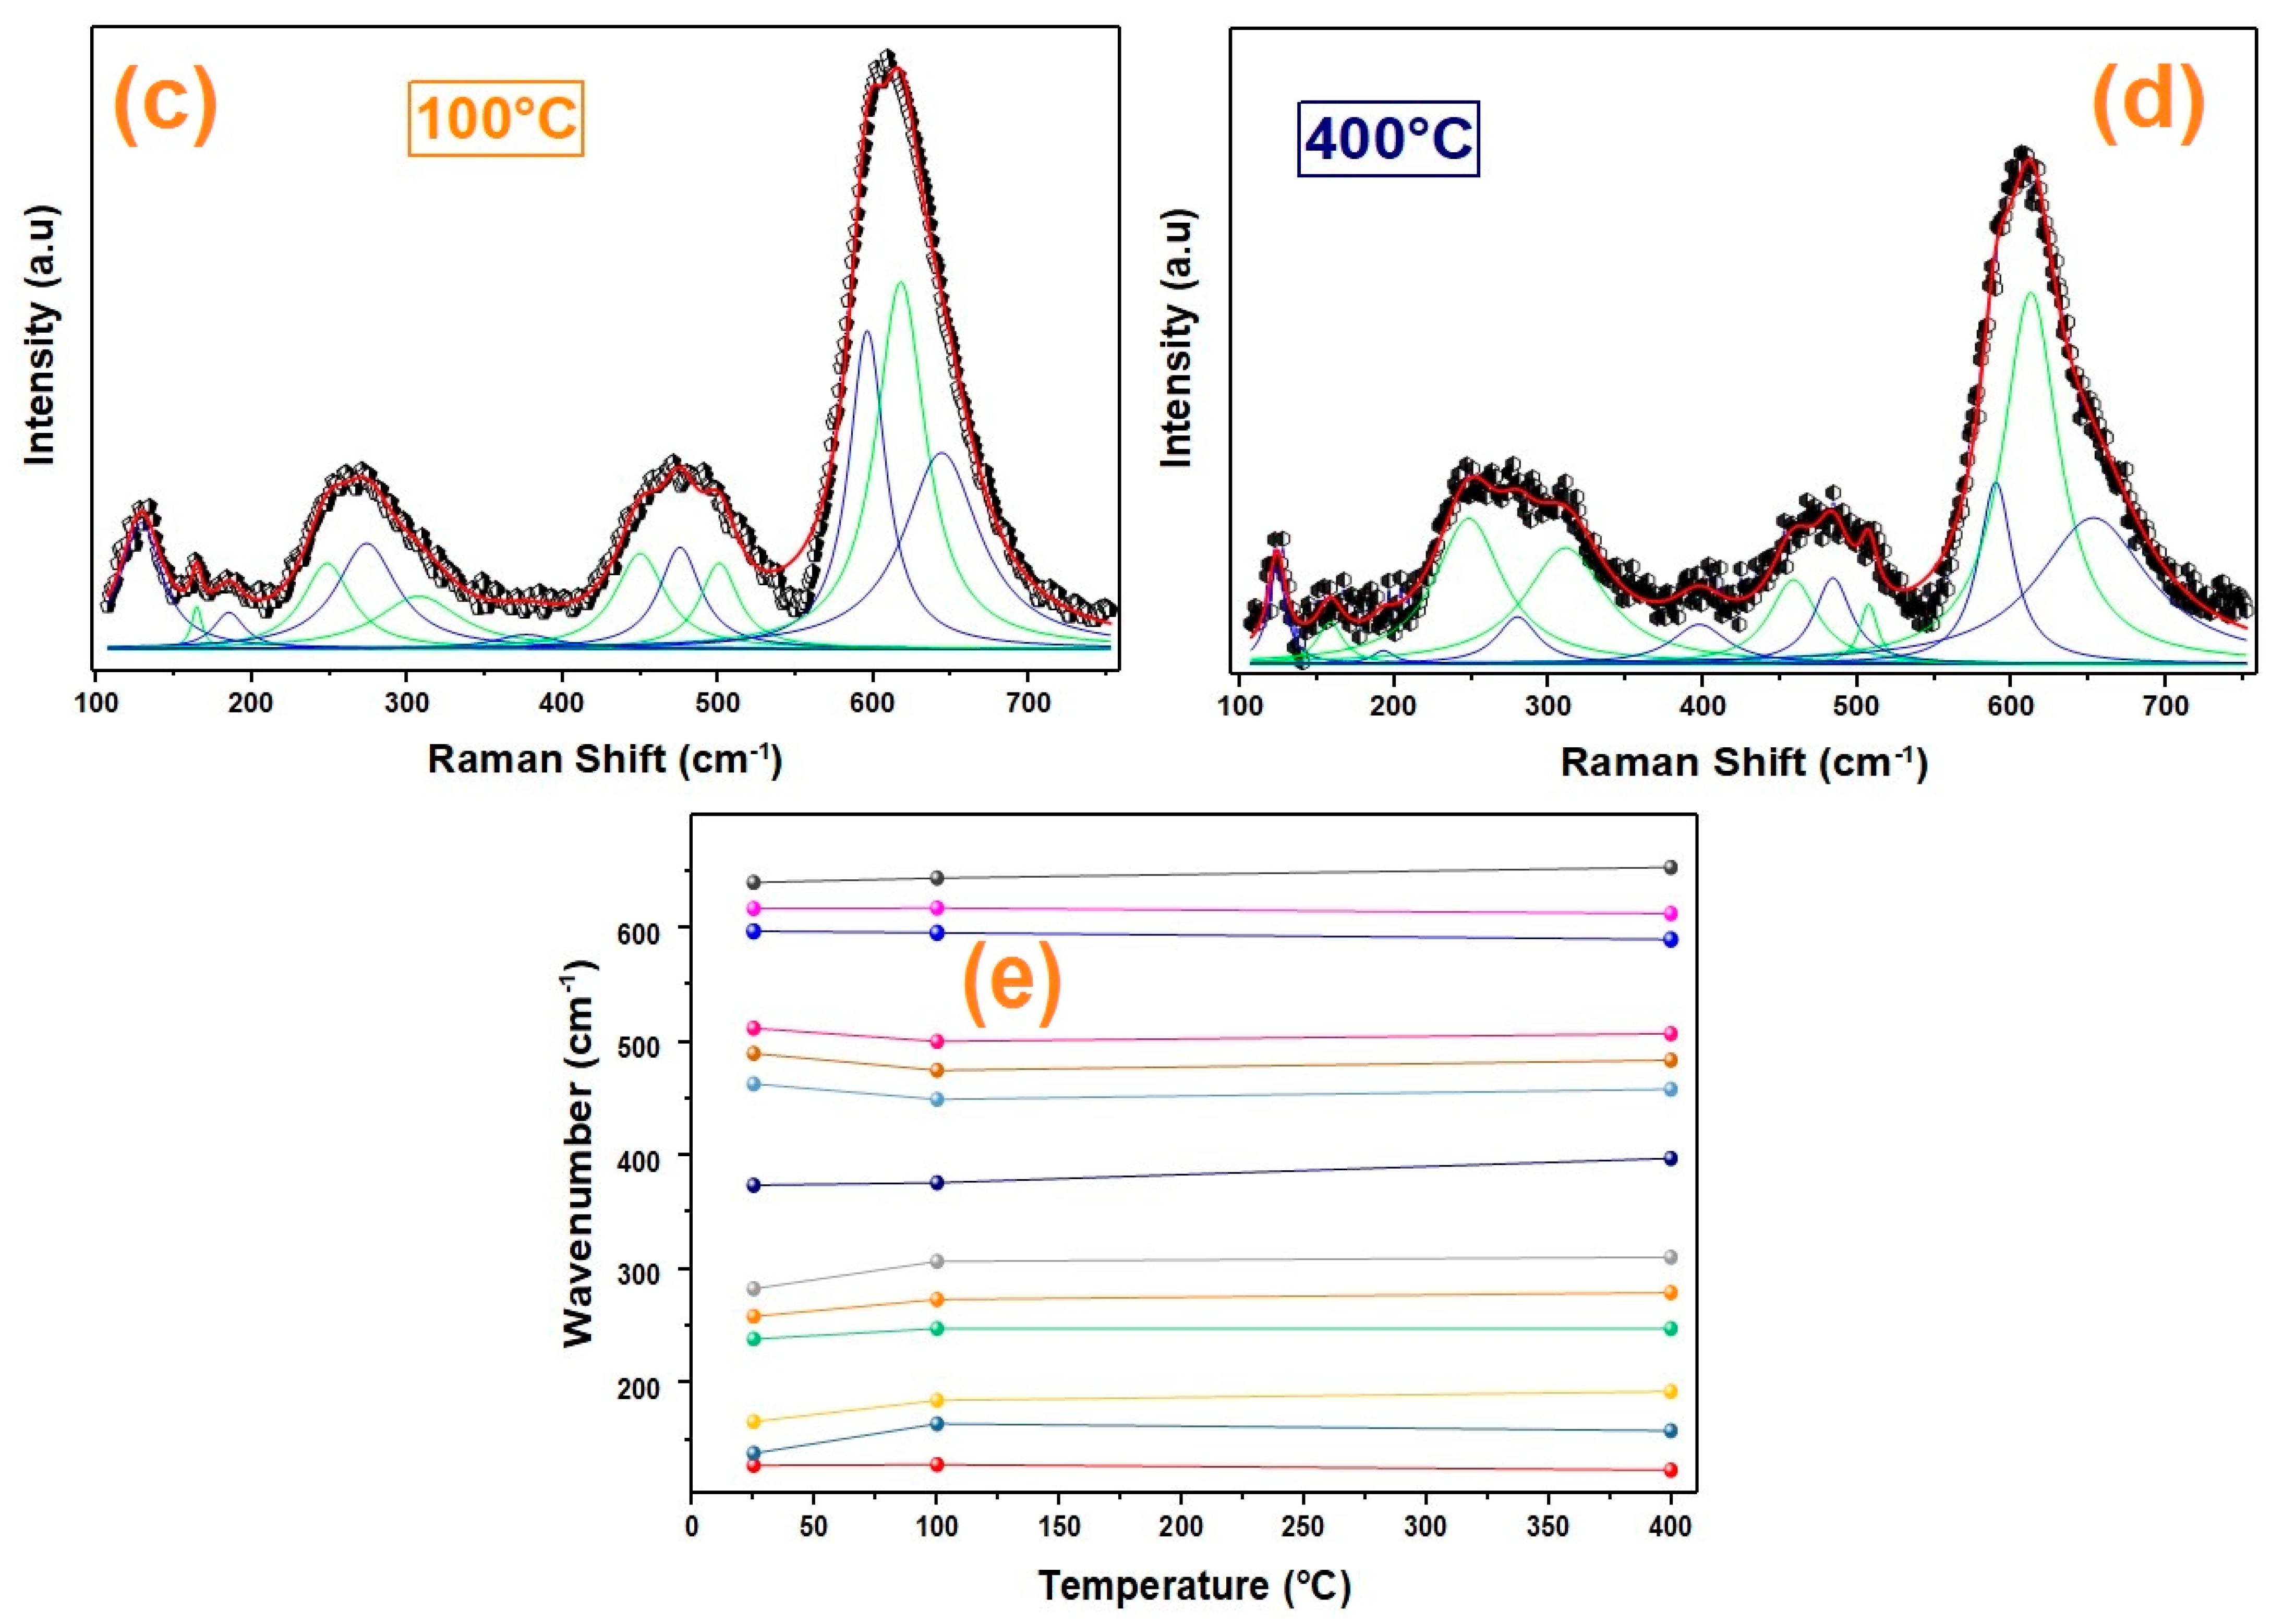
3.1.2. Raman Spectroscopy

Research findings indicate that in pure BiFeO3 exhibiting rhombohedral distortion and the R3c space group, there are eighteen optical modes that can be represented as follows [41,42]:
Γ= 4A1+ 5A2 + 9E
where the A1 mode and E mode are Raman active and IR. Conversely, A2 modes exhibit Raman inactivity.
The Raman spectra of the Bi0.8Ba0.1Er0.1Fe0.96Cr0.02Mn0.02O3 (BBEFCMO) sample with an excitation wavelength of 532 nm at different temperatures (25 °C, 100 °C, and 400 °C) are shown in Figure 2a. The experimental Raman spectra of the prepared sample were fitted using the Lorentzian approach. The adjustment results are shown in Figure 2b–d, and the peak positions are collected in Table 2.
It can be clearly seen that the Raman spectra obtained for the BBEFCMO ceramic are consistent with previously reported findings in the literature for undoped BiFeO3 [43]. Moreover, the observed spectra accord well with the Raman active modes identified for the Er, Ba, Cr, and Co-doped BiFeO3 reported in our previous research [30].
In the low Raman range, A1 modes are related to the Bi-O vibration [44]. Compared to BiFeO3, we can plainly observe a shift in these modes. The change in this Bi-O vibration can be explained by the effect of the Ba and Er substitution in the A site. Moreover, the Er-O bond (606 KJ/mol) and Ba-O bond (562 ± 13.4 KJ/mol) are stronger than the Bi-O bond (337.2 ± 12.6 KJ/mol), which induces more displacement in the center of the BiFeO3 sample [45].
Furthermore, the high-frequency E modes are attributed to the Fe-O vibrations [46]. The shift of the modes in this range is due to the introduction of the Mn and Cr atoms in the Fe site which form more stable Cr-O and Mn-O bonds, thus causing significant distortion of FeO6 octahedra [47].
We will discuss the evolution of the Raman peaks of our sample around the anti-ferromagnetic phase transition TN (≈643 K) of the non-doped BiFeO3. In this regard, Figure 2d shows the mode frequencies of the Raman modes as a function of temperature for the Bi0.8Ba0.1Er0.1Fe0.96Cr0.02Mn0.02O3 ceramic, obtained from Lorentzian fittings.
We can confirm that the overall spectral signature remains consistent within the temperature range of 25 °C and 400 °C, suggesting that our sample maintains its room temperature structure up to 400 °C. However, it is worth noting that, upon heating, there is a noticeable alteration in both spectra shape and intensity. Furthermore, a distinct step-like evolution of the wave number for several bands is clearly observed.

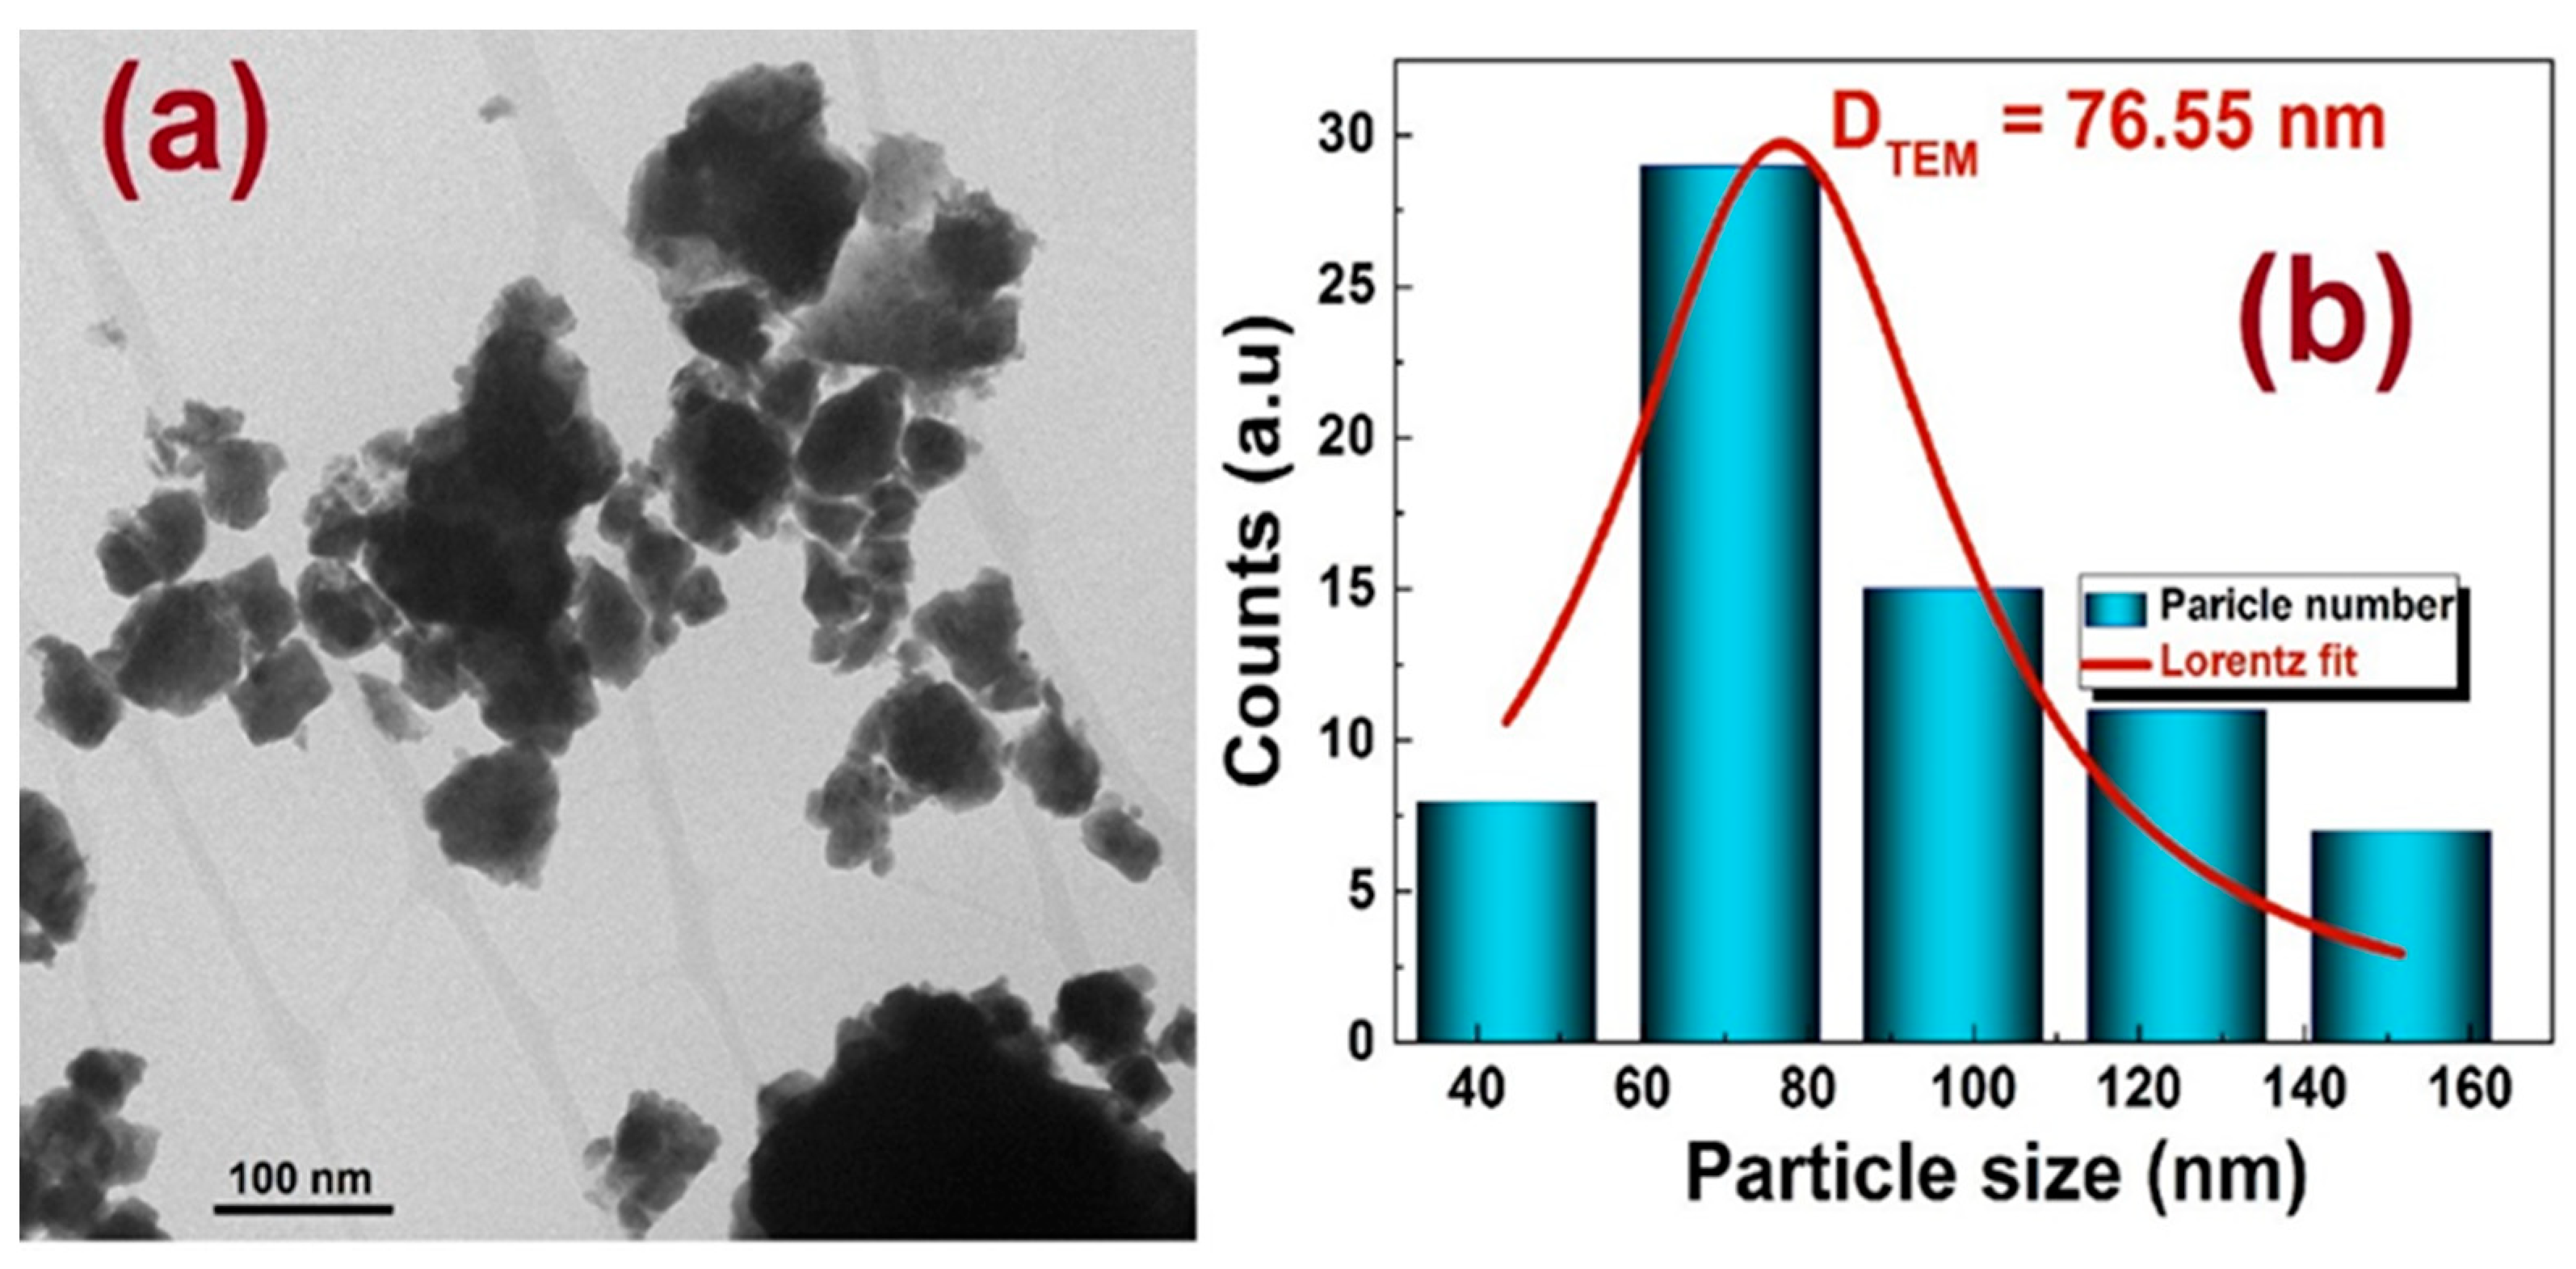
3.1.3. Transmission Electron Microscopy (TEM)

Figure 3a displays a selected micrograph obtained from transmission electron microscopy (TEM) of the synthesized BBEFCMO compound. Nanoparticles with a combination of spherical and rectangle shapes are observed in Figure 3a. The distribution profile of the particles size was obtained using Image-J software and is presented in Figure 3b. The average size of the BBEFCMO particles was found to be around 76 nm, which accords well with the crystallites size found from the Williamson–Hall formalism.

3.2. Magnetic Properties

Figure 4a presents the magnetic hysteresis loops of the BBEFCMO nanoparticles in an applied field in the range of −10 T to 10 T, measured at 7 K and 300 K. The magnetization data displayed a significant hysteresis loop, indicating finite values for both coercive and remanent magnetization (MS), and importantly an unsaturated magnetization under high fields. The unsaturated behavior indicates an antiferromagnetic (AFM) behavior [48,49,50]. Moreover, the important remanent magnetization value (nonzero), below which the magnetization sharply increased, serves as evidence for the presence of a ferromagnetic (FM) contribution presence within the compound [51]. As reported by D. Lebeugle et al., it is worth mentioning that the M(H) plots of the pure BiFeO3 (BFO) depict an almost unsaturated linear behavior, indicating a G-type antiferromagnetic (AFM) configuration with the pitching of Fe3+ ions [52]. In the present work, the magnetization of the BBEFCMO compound was found to be around 27 times higher than what was found for the undoped BFO system [53,54], and 1.5 times higher than what was found for the (Bi0.8Er0.1Ba0.1)(Fe0.96Cr0.02Co0.02)O3 compound [55], which is essentially due to the presence of Manganese ions, as was previously reported [56,57,58]. Moreover, it was confirmed that the introduction of small quantities of Manganese ions in the BiFeO3 system induces a John–Teller distortion which would enhance the magnetization [58].
To confirm and quantify the ferromagnetic contribution in the Bi0.8Er0.1Ba0.1Fe0.96Cr0.02Mn0.02O3 compound, the M-H magnetic loop was adjusted according to the following equation [59,60]:
M ( H ) = { 2 M F M S π tan 1 ( ( H ± H c i H c i ) tan ( π × M F M R 2 × M F M S ) ) } + { χ H }
where the first term is related to the ferromagnetic contribution, while the second one represents the linear behavior from the antiferromagnetic contribution (AFM). M F M S , M F M R , and Hci are the ferromagnetic saturation magnetization, remnant magnetization, and intrinsic coercive field, respectively. The resulting adjusted curves are presented in Figure 4b together with the experimental data showing a good adjustment quality. From the adjusted magnetic parameters (Table 3), the ferromagnetic contribution was found to be equal to 40.37%. With the replacement of Cobalt ions by Manganese ones, the magnetization increased from 5.068 to 8.05 emu/g, which is related to a 2.05% increase in the ferromagnetic contribution.
On the other hand, Figure 5 illustrates the room temperature Mössbauer spectrum of the BBEFCMO compound. The spectrum was fitted with three Fe3+ sextets and a Fe3+ doublet, as in the case of the replacement of Mn by Co [55]. The fitted parameters are tabulated in Table 4. The presence of a doublet is likely to emanate from the Bi2FeO9 impurity phase (5.3%). Indeed, despite being non-magnetic, it could be associated with the pure BFO compound, as well as the first sextet. The second sextet with a hyperfine field of 49.3 T, accounting for 47%, is attributed to Fe3+ ions in the tetrahedral coordination and AFM ordering in the pure BFO compound. The first and third sextets are ascribed to Fe3+ at octahedral environments and are related to FM. Together, their relative amounts total 47.5%, representing 45% of the magnetic part of the sample.
Compared to the Mössbauer results of the (Bi0.8Er0.1Ba0.1)(Fe0.96Cr0.02Co0.02)O3 compound, the introduction of Mn ions induces a reduction in the third sextet and a slight change in its isomer shift. This sextet has the lowest hyperfine field (41.5 T), and its relative area decrease is related to a higher saturation magnetization of the sample, compared with the one with Co2+ in the B site.

3.3. Dielectric Study

3.3.1. Dielectric Constant and Dielectric Loss Tangent tg(δ)

In Figure 6a,b, we plot the frequency and temperature dependence of the dielectric constant ε′ of the Bi0.8Ba0.1Er0.1Fe0.96Cr0.02Mn0.02O3 (BBEFCMO) compound. At low frequencies, ε′ presents extraordinarily high values (≈8 × 10⁵), indicating a colossal dielectric constant nature of the studied compound. This can be explained by a potential barrier generated by space charge polarization at the grain boundaries inducing a charge accumulation. Such materials with a high value of ε′ are candidates for energy storage devices [61].
Furthermore, it was observed that the dielectric constant rises as temperature increases, primarily ascribed to the increase in various polarization contributions, resulting from thermally activated charge carriers [62]. The presented curves of the dielectric constant show 3 plateaus (with a slight dependence on frequency) at around 400, 104, and 3 × 10⁵, between which the curves decrease rapidly with increasing frequency. It is also important to mention that the step-like decrease shifted to high frequencies with the rise in temperature, indicating a thermally activated relaxation process [63]. These observations confirm that the studied compound is composed of three different contributions.
To further confirm the presence of different relaxation processes from dielectric constant curves, we calculated the logarithmic derivative of the dielectric constant component (known as the Kramers–Kronig transformation [64,65,66]) and we plotted the results at different temperatures in Figure 6c. The appearance of three different relaxation peaks aligns well with the presence of three different contributions.
On the other hand, typically, the step-like decrease in the dielectric constant is accompanied by a relaxation peak in the dielectric loss tangent tg(δ). We plotted in Figure 7a the frequency dependence of the dielectric loss tangent for the temperature range between 120 K and 400 K. In fact, it was observed that the dielectric loss tangent exhibits two distinct and well-defined relaxation peaks at low and high frequencies for each temperature. Moreover, a third relaxation peak is almost hidden in the intermediate frequency region, which is clear in the Kramers–Kronig transformation of the dielectric loss tangent at 170 K, as presented in Figure 6c. The dielectric relaxations at low and high frequencies are associated with the electrode and grain contributions, respectively, while the dielectric relaxation at intermediate frequencies is due to the grain boundary contribution. Figure 7b shows the temperature dependence of the relaxation frequency behavior of both relaxations at low and high frequencies, which obeys the linear Arrhenius law between Ln(fmax) and 1/T. The calculated activation energies obtained for electrode and grain contributions are equal to 0.553 eV and 0.319 eV, respectively.

3.3.2. Imaginary Part of Modulus

The complex modulus study has been adapted to investigate the dielectric relaxation behavior and to differentiate the grain, the grain boundaries, and the electrode contributions in our sample.
Figure 8a shows a 3D presentation of the imaginary part M″ of the complex modulus of the prepared compound. A close inspection of the M″ plot shows the appearance of two peaks, the first of which is located at a low-frequency region and the second one appears at a high-frequency range, which implies the existence of a relaxation process in this material [67]. The low frequency side of the peaks presents the range in which the ions are mobile over long distances and perform successful hopping from one site to the neighboring one. Furthermore, at the high frequency side, the ions are confined to their wells and can execute only localized motion [68].
We can clearly confirm that the peaks gradually shift to high frequencies and temperature, as shown in Figure 8b. This behavior suggests that the relaxation is thermally activated [69].
To better study the dielectric relaxation processes, a model function of Havriliak–Negami (HN) given by (Equation (3)) [70] is adopted to fit the experimental data of the imaginary part of Modulus M″.
M ( ω ) = M + M 0 M [ 1 + ( j ω τ H N ) α ] β
where τHN is the average relaxation time, the parameters α (0 < α < 1) and β (0 < α < 1) are the shape factors related to the width of the relaxation and the asymmetry of curves, and M and M0 are the dielectric modulus at low and high frequency sides of the relaxation.
L.C. Brazzano et al. [71] have confirmed that the HN function is obtained by a simple generalization of a single time relaxation, which illustrates the response of a Debye process when α = β = 1. Nevertheless, if β = 1 (α ≠ 1) or α = 1 (β ≠ 1), the relaxation process is according to Cole-Cole [72] and Cole-Davidson [73] models, respectively. The result of the adjustment is plotted in Figure 8b.
The obtained parameters are used to identify the model of the dielectric relaxation. Figure 9a presents the temperature dependence of α and β parameters. We can deduce that the Cole-Cole model fits well with both the low and high-frequency ranges, which are accredited to boundary grains and grains, respectively. These results are in good agreement with those obtained in our previous work for the Bi0.8(La0.8Ca0.2)0.2FeO3 compound [32].
Furthermore, the obtained HN relaxation time parameters were used to calculate the activation energies. The logarithmic variation in the relaxation time Ln(τHN) as a function of the 1000/T in terms of the Arrhenius law is depicted in Figure 9b, from which it can be inferred that the activation energy of the boundary grains exceeds those of the grains. On the other hand, the obtained values are very close to those previously calculated from the permittivity plots.

3.4. Electrical Investigation

3.4.1. DC Conductivity

Figure 10a presents the variation in the Ln(ρ/T) versus 1/T of the BBEFCMO sample. It is found that the resistivity decreases rapidly with the increase in temperature until reaching a slow variation above T = 363 K. This behavior implies a rise in material conductivity, reaching a saturation value at this temperature, indicating a semiconductor behavior. Beyond 370 K, the temperature-independence conductivity may be explained by the stability of the parameters governing the microstructure of the material (inter-site or inter-gain distances, the resistance of the insulating barrier). Additionally, the saturation of σdc can be attributed to the stability of the factors affecting the transfer of a small polaron between two sites (the jump and disorder energies, the radius of the polaron, the resistance of the grains, and the mobility of the charge carriers and their concentrations).
However, below 363 K, the conductivity steadily increases with temperature increases. This suggests that the DC conduction is described by the variable range-hopping (VRH) process at lower temperatures and transitions to a thermal activation by the small polaron-hopping (SPH) process at higher temperatures [74].
To verify the validity of SPH conduction model, we plotted the variation in Ln (σdc.T) versus the inverse of temperature according to the Arrhenius law. This plot exhibits three distinct slopes corresponding to three different activation energies. According to Mott-theory, in the high-temperature region above θD/2, where the obtained activation energy is around 338 meV, the conduction process is typically characterized by thermally activated SPH conduction. This activation energy, Ea, arises from polaron formation via a banding energy (EP = EH/2; EH: polaron-hopping energy) and the disorder energy (ED) due to the variations in the local arrangements of ions [75,76,77]. Conversely, at the low-temperature region, the Mott revealed that the conduction is purely governed by the disorder energy, which is approximately 33 meV, with negligible hopping and banding energies.
In light of these findings, the temperature dependence of the DC conductivity of the present sample can be described by the following expression [78,79]:
σ d c = σ 0 T . e ( E a k B T )
where σ0 is a pre-exponential factor, T is the absolute temperature, and kB is the Boltzmann constant.
The activation energy is given by
E a { E a = E H + E D 2       f o r   T > θ D 2 E a = E D                           f o r     T < θ D 4
where EH and ED are the polaron-hopping energy and the disorder energy, respectively. As can be seen from Figure 10b, describing the dependence of Ln (σdc) on T−1/4. This figure clearly proves a linear slope at lower temperatures (below θD/4), confirming the validity of the Mott-VRH model to describe the transport process of the studied material at the low-temperature region, by the following expression of DC conductivity [80]:
σ d c = A e ( B T 1 / 4 )
where A and B are constants and B is given by
B = 2.1 ( α 3 k B N ( E F ) ) 1 / 4
where N(EF) is the density of the state at the Fermi level.
Furthermore, in the intermediate temperature range, the DC conductivity is not considered a Mott-VRH Model. As shown in Figure 10c, Greaves revealed that the DC conductivity can be investigated based on the following expression [79]:
σ d c T 2 = A e ( B T 1 / 4 )

3.4.2. AC Conductivity

Figure 11a reveals the frequency dependence of the AC conductivity in the temperature range from 120 K to 400 K. It is clearly seen that σac is affected only at the high-frequency region, attesting a dispersion behavior due to the ionic relaxation after the particles’ movement, following the universal power law of S [80].
According to the temperature dependence of the already-discussed dielectric features, it is clear that only one dispersion behavior is observed in the low-temperature region and a second one is detected in the high-temperature region. These findings reveal that the conductivity enhancement is likely to emanate from that of the hopping probability of charge carriers by the frequency rise.
On the other hand, the Ln(σac × T) vs. 1000/T curves at different frequencies are plotted in Figure 11b. As it can be clearly seen, the curves show two different regions in which the electric conductivity behaves differently. While at high temperatures, the conductivity seems to depend only on temperature, at the low-temperature region, it becomes frequency and temperature dependent. The activation energy in the high-temperature region was calculated to be equal to 0.431 eV, which is close to that found for the boundary grains contribution (M″ vs. frequency curves).
Meanwhile, the AC conductivity curves have been fitted (red lines in Figure 11a) by the following relation [81]:
σ a c ( ω ) = [ σ s 1 + τ 2 ω 2 + σ τ 2 ω 2 1 + τ 2 ω 2 ] + A . ω s
Here, σS represents the conductivity at low frequencies, while σ denotes the conductivity at high frequencies. ω stands for the angular frequency, τ signifies the relaxation time, A denotes a constant influenced by temperature, and s represents an exponent characterizing the interaction degree between mobile ions and their surrounding environment.
Figure 11c proves the evolution of the exponent s in the studied temperature range. The behavior of this exponent under temperature variation presents a great indicator of the origin of the conduction process. As previously observed, the decrease in this exponent between 120 K and 230 K indicates the correlated barrier-hopping (CBH) conduction mechanism while in the region above 240 K, the power law exponent s changes without any obvious trend. This is due to the fact that the AC conductivity at high temperatures is frequency independent, as deduced previously.

4. Conclusions

The synthesis of a multi-doped Bi0.8Ba0.1Er0.1Fe0.96Cr0.02Mn0.02O3 nanomaterial was carried out using the sol-gel Pechini method. The characterization revealed that these nanoparticles (DTEM = 76 nm) crystalized in the cubic structure with the R3c space group as confirmed by X-ray diffraction and Raman spectroscopy. Notably, the compound exhibited significant magnetization, primarily attributed to the 40.37% of ferromagnetic contribution from the total magnetization. Furthermore, the BBEFCMO compound displayed a colossal dielectric constant (>5.105), coupled with minimal dielectric loss tangent values, thus confirming its promising potential for energy storage applications. Three different relaxation processes were identified for the compound, related to electrode, boundary grains, and grain contributions.
Moreover, the conduction processes were studied through analysis of DC and AC conductivity values, proving that the conduction is due essentially to the polaron hopping between Iron states.

Author Contributions

Conceptualization, A.T., A.B. (A. Benali) and B.F.O.C.; methodology, A.B. (A. Benali), B.F.O.C. and E.M.B.; validation, A.B. (A. Benali) and B.F.O.C.; formal analysis, E.M.B., A.B. (A. Bougoffa), A.B. (A. Benali) and B.F.O.C.; investigation, E.M.B., A.B. (A. Bougoffa), A.B. (A. Benali), M.P.G. and B.F.O.C.; writing—original draft preparation, A.T., A.B. (A. Benali), E.M.B. and A.B. (A. Bougoffa); writing—review and editing, B.F.O.C., E.D., M.P.G. and M.A.V.; supervision, A.B. (A. Benali) and B.F.O.C.; funding acquisition, B.F.O.C. All authors have read and agreed to the published version of the manuscript.

Funding

This work was funded by the Deanship of Graduate Studies and Scientific Research at Jouf Univer-sity under grant No. (DGSSR-2023-02-02428). This work was also supported by national funds from FCT within the projects UIDB/04564/2020 (DOI: DOI 10.54499/UIDB/04564/2020) and UIDP/04564/2020 (DOI: 10.54499/UIDP/04564/2020).

Data Availability Statement

The data presented in this study are available upon request from the corresponding author due to privacy.

Acknowledgments

This work was funded by the Deanship of Graduate Studies and Scientific Research at Jouf University under grant No. (DGSSR-2023-02-02428). Access to the TAIL-UC facility funded under the QREN-Mais Centro Project No. ICT_2009_02_012_1890 is gratefully acknowledged.

Conflicts of Interest

The authors declare no conflicts of interest.

References

  1. Cheong, S.W.; Mostovoy, M. Multiferroics: A magnetic twist for ferroelectricity. Nat. Mater. 2007, 6, 13–20. [Google Scholar] [CrossRef] [PubMed]
  2. Prellier, W.; Singh, M.; Murugavel, P. The single-phase multiferroic oxides: From bulk to thin film. J. Phys. Condens. Matter. 2005, 17, 803. [Google Scholar] [CrossRef]
  3. Kumar, N.; Shukla, A.; Kumar, N.; Choudhary, R.N.P. Structural, electrical and magnetic properties of eco-friendly complex multiferroic material: Bi(Co0.35Ti0.35Fe0.30)O3. Ceram. Int. 2019, 45, 822–831. [Google Scholar] [CrossRef]
  4. Kumar, N.; Shukla, A.; Behera, C.; Choudhary, R.N.P. Structural, electrical and magnetic properties of Bi(Ni0.45Ti0.45Fe0.1)O3. J. Alloys Compd. 2016, 688, 858–869. [Google Scholar] [CrossRef]
  5. Arora, M.; Sati, P.C.; Chauhan, S.; Chhoker, S.; Panwar, A.K.; Kumar, M.J. Structural, Optical and Multiferroic Properties of BiFeO3 Nanoparticles Synthesized by Soft Chemical Route. Supercond. Nov. Magn. 2013, 26, 443. [Google Scholar] [CrossRef]
  6. Dutta, D.P.; Mandal, B.P.; Naik, R.; Lawes, G.; Tyagi, A.K. Magnetic, Ferroelectric, and Magnetocapacitive Properties of Sonochemically Synthesized Sc-Doped BiFeO3 Nanoparticles. J. Phys. Chem. C 2013, 117, 2382. [Google Scholar] [CrossRef]
  7. Fiebig, M. Revival of the magnetoelectric effect. J. Phys. D: Appl. Phys. 2005, 38, 123. [Google Scholar] [CrossRef]
  8. Shaheen, N.; Chen, Z.; Nong, Y.; Su, T.; Yousaf, M.; Lu, Y.; Li, L. Enhancing ORR Catalytic Activity and Electrochemical Investigation of La1−2xBaxBixFeO3 Cathode for Low-Temperature Solid Oxide Fuel Cell. Crystals 2023, 13, 822. [Google Scholar] [CrossRef]
  9. Sati, P.C.; Kumar, M.; Chhoker, S. Phase Evolution, Magnetic, Optical, and Dielectric Properties of Zr-Substituted Bi0.9Gd0.1FeO3 Multiferroics. J. Am. Ceram. Soc. 2015, 98, 1884–1890. [Google Scholar] [CrossRef]
  10. Ederer, C.; Spaldin, N.A. Influence of strain and oxygen vacancies on the magnetoelectric properties of multiferroic bismuth ferrite. Phys. Rev. B 2005, 71, 224103. [Google Scholar] [CrossRef]
  11. Das, S.R.; Choudhary, R.N.P.; Bhattacharya, P.; Katiyar, R.S. Structural and multiferroic properties of La-modified BiFeO3 ceramics. J. Appl. Phys. 2007, 101, 034104-7. [Google Scholar] [CrossRef]
  12. Sun, Q.; Fang, Y.; Wang, S.; Ma, W.; Zhang, Q.; Wang, J.; Wang, Y.; Lang, J.; Zhang, J.; Liu, Y.; et al. Mn dopant-enabled BiFeO3 with enhanced magnetic and photoelectric properties. Mater. Sci. Eng. B 2024, 299, 116921. [Google Scholar] [CrossRef]
  13. Yu, B.; Li, M.; Hu, Z.; Pei, L.; Guo, D.; Zhao, X.; Dong, S. Enhanced multiferroic properties of the high-valence Pr doped BiFeO3 thin film. Appl. Phys. Lett. 2008, 93, 182909-3. [Google Scholar] [CrossRef]
  14. Catalan, G.; Sardar, K.; Church, N.S.; Scott, J.F.; Harrison, R.J.; Redfern, S.A.T. Effect of chemical substitution on the Néel temperature of multiferroic Bi1−xCaxFeO3. Phys. Rev. B 2009, 79, 212415. [Google Scholar] [CrossRef]
  15. Jayakumar, O.D.; Achary, S.N.; Girija, K.G.; Tyagi, A.K.; Sudakar, C.; Lawes, G.; Naik, R.; Nisar, J.; Peng, X.; Ahuja, R. Theoretical and experimental evidence of enhanced ferromagnetism in Ba and Mn cosubstituted BiFeO3. J. Appl. Phys. Lett. 2010, 96, 032903. [Google Scholar] [CrossRef]
  16. Kumar, P.; Kar, M. Effect of structural transition on magnetic and optical properties of Ca and Ti co-substituted BiFeO3 ceramics. J. Alloys Compd. 2014, 584, 566–572. [Google Scholar] [CrossRef]
  17. Puhan, A.; Bhushan, B.; Kumar, V.; Panda, H.S.; Priyam, A.; Das, D.; Rout, D. Tailoring the structural, optical and magnetic properties of BiFeO3 multiferroic nanoparticles by Ba, Cr co-doping. Mater. Sci. Eng. B 2019, 241, 48–54. [Google Scholar] [CrossRef]
  18. Hoque, M.M.; Islam, M.T.; Islam, M.R.; Zubair, M.A. Effective bandgap tuning with non-trivial modulation in room temperature magnetic and electrical responses of low level Ba–Cr co-substituted BiFeO3 nanoparticles. Ceram. Int. 2022, 48, 19583–19596. [Google Scholar] [CrossRef]
  19. Rout, J.; Choudhary, R.N.P. Structural transformation and multiferroic properties of Ba–Mn co-doped BiFeO3. Phys. Lett. A 2016, 380, 288–292. [Google Scholar] [CrossRef]
  20. Wen, X.L.; Chen, Z.; Liu, E.H.; Lin, X.; Chen, C.L. Effect of Ba and Mn doping on microstructure and multiferroic properties of BiFeO3 ceramics. J. Alloys Comp. 2016, 678, 511–517. [Google Scholar] [CrossRef]
  21. Liu, Y.; Tan, G.; Ren, X.; Li, J.; Xue, M.; Ren, H.; Xia, A.; Liu, W. Electric field dependence of ferroelectric stability in BiFeO3 thin films co-doped with Er and Mn. Ceram. Int. 2020, 46, 18690–18697. [Google Scholar] [CrossRef]
  22. Naeimi, A.S.; Dehghan, E.; Sanavi Khoshnoud, D.; Gholizadeh, A. Enhancment of ferromagnetism in Ba and Er co-doped BiFeO3 nanoparticles. J. Magn. Magn. Mater. 2015, 393, 502–507. [Google Scholar] [CrossRef]
  23. Palkar, V.R.; Kundaliya, D.C.; Malik, S.K. Effect of Mn substitution on magnetoelectric properties of bismuth ferrite system. J. Appl. Phys. 2003, 93, 4337–4339. [Google Scholar] [CrossRef]
  24. Chakrabarti, K.; Das, K.; Sarkar, B.; Ghosh, S.; De, S.K.; Sinha, G.; Lahtinen, J. Enhanced magnetic and dielectric properties of Eu and Co co-doped BiFeO3 nanoparticles. Appl. Phys. Lett. 2012, 101, 042401. [Google Scholar] [CrossRef]
  25. Liu, Y.; Tan, G.; Guo, M.; Chai, Z.; Lv, L.; Xue, M.; Ren, X.; Li, J.; Ren, H.; Xia, A. Multiferroic properties of La/Er/Mn/Co multi-doped BiFeO3 thin films. Ceram. Int. 2019, 45, 11765–11775. [Google Scholar] [CrossRef]
  26. Kebede, M.T.; Dillu, V.; Devi, S.; Chauhan, S. A comparative investigation of structural, magnetic and photocatalytic properties of pure, Ce-Ni and Cd-Ni co-doped BiFeO3 nanoparticles. Mater. Sci. Eng. B 2024, 301, 117188. [Google Scholar] [CrossRef]
  27. Dong, G.; Tan, G.; Luo, Y.; Liu, W.; Ren, H.; Xia, A. Influence of multi-element co-doping on structure and multiferroic properties of BiFeO3 thin films. Mater. Lett. 2014, 136, 314–317. [Google Scholar] [CrossRef]
  28. Liu, J.P.; Lv, Z.L.; Hou, Y.X.; Zhang, L.P.; Cao, J.P.; Wang, H.W.; Zhao, W.B.; Zhang, C.; Bai, Y.; Meng, K.K.; et al. Substantial reduction of leakage currents in La/Er/Zn/Ti multielement-doped BiFeO3 multiferroic thin films. Ceram. Int. 2022, 48, 17328–17334. [Google Scholar] [CrossRef]
  29. Chai, Z.; Tan, G.; Yue, Z.; Yang, W.; Guo, M.; Ren, H.; Xia, A.; Xue, M.; Liu, Y.; Lv, L. Ferroelectric properties of BiFeO3 thin films by Sr/Gd/Mn/Co multi-doping. J. Alloys Comp. 2018, 746, 677–687. [Google Scholar] [CrossRef]
  30. Benali, A.; Melo, B.M.G.; Prezas, P.R.; Bejar, M.; Dhahri, E.; Graça, M.P.F.; Valente, M.A.; Nogueira, B.A.; Costa, B.F.O. Structural, morphological, Raman and ac electrical properties of the multiferroic sol-gel made Bi0.8Er0.1Ba0.1Fe0.96Cr0.02Co0.02O3 material. J. Alloys Compd. 2019, 775, 304–315. [Google Scholar] [CrossRef]
  31. Bougoffa, A.; Benali, A.; Bejar, M.; Dhahri, E.; Graça, M.P.F.; Valente, M.A.; Bessais, L.; Costa, B.F.O. Mg-substitution effect on microstructure, dielectric relaxation and conduction phenomenon of Fe based perovskite nanomaterials. J. Alloys Compd. 2021, 856, 157425. [Google Scholar] [CrossRef]
  32. Benali, A.; Benali, E.M.; Gouadria, S.; Elhadi, M.; Dhahri, E.; Graça, M.P.F.; Valente, M.A.; Costa, B.F.O. Colossal dielectric constant with enhanced magnetization in the La3+ and Ca2+ co-doped BiFeO3 nanoparticles. J. Mater. Sci. Mater. Electron. 2022, 33, 16236–16250. [Google Scholar] [CrossRef]
  33. Rietveld, H.M. A profile refinement method for nuclear and magnetic structures. J. Appl. Crystallogr. 1969, 2, 65. [Google Scholar] [CrossRef]
  34. Bougoffa, A.; Benali, E.M.; Benali, A.; Bejar, M.; Dhahri, E.; Graça, M.P.F.; Valente, M.A.; Otero-Irurueta, G.; Costa, B.F.O. Investigation of temperature and frequency dependence of the dielectric properties of multiferroic (L0.8Ca0.2)0.4Bi0.6FeO3 nanoparticles for energy storage application. RSC Adv. 2022, 12, 6907–6917. [Google Scholar] [CrossRef]
  35. Benali, E.M.; Benali, A.; Bejar, M.; Dhahri, E.; Graca, M.P.F.; Valente, M.A.; Costa, B.F.O. Structural, morphological, Raman, dielectric and electrical properties of La1−2xBaxBixFeO3 (0.00 ≤ x ≤ 0.20) compounds. RSC Adv. 2021, 11, 36148–36165. [Google Scholar] [CrossRef] [PubMed]
  36. Horchani, M.; Omri, A.; Seif Eddine, M.; Benali, A.; Tozri, A.; Dhahri, E.; Pavani, K.; Costa, B.F.O.; Graca, M.F.P. Ni–Cu–Co ferrite synthesized using the sol-gel method: Effects of the Cr3+ ion concentration on its structural, electrical, and dielectric properties. Appl. Phys. A 2022, 128, 947. [Google Scholar] [CrossRef]
  37. Wang, Y.P.; Zhou, L.; Zhang, M.F.; Chen, X.Y.; Liu, J.M.; Liu, Z.G. Room-temperature saturated ferroelectric polarization in BiFeO3 ceramics synthesized by rapid liquid phase sintering. Appl. Phys. Lett. 2004, 84, 1731–1733. [Google Scholar] [CrossRef]
  38. Bernardo, M.S.; Jardiel, T.; Peiteado, M.; Mompean, F.J.; Garcia-Hernandez, M.; Garcia, M.A.; Villegas, M.; Caballero, A.C. Intrinsic compositional inhomogeneities in bulk Ti-doped BiFeO3: Microstructure development and multiferroic properties. Chem. Mater. 2013, 25, 1533. [Google Scholar] [CrossRef]
  39. Fisher, J.G.; Jang, S.H.; Park, M.S.; Sun, H.; Moon, S.H.; Lee, J.S.; Hussain, A. The Effect of niobium doping on the electrical properties of 0.4(Bi0.5 K0.5)TiO3-0.6BiFeO3 lead-free piezoelectric ceramics. Materials 2015, 8, 8183–8194. [Google Scholar] [CrossRef]
  40. Goncalves, N.S.; Carvalho, J.A.; Lima, Z.M.; Sasaki, J.M. Size–strain study of NiO nanoparticles by X-ray powder diffraction line broadening. Mater. Lett. 2012, 72, 36–38. [Google Scholar] [CrossRef]
  41. Nadeem, M.; Khan, W.; Khan, S.; Husain, S.; Ansari, A. Tailoring dielectric properties and multiferroic behavior of nanocrystalline BiFeO3 via Ni doping. J. Appl. Phys. 2018, 124, 164105. [Google Scholar] [CrossRef]
  42. Singh, M.K.; Jang, H.M.; Ryu, S.; Jo, M.H. Polarized Raman scattering of multiferroic BiFeO3 epitaxial films with rhombohedral R3c symmetry. J. Appl. Phys. Lett. 2006, 88, 42907. [Google Scholar] [CrossRef]
  43. Kothari, D.; Reddy, V.R.; Sathe, V.G.; Gupta, A.; Banerjee, A.; Awasthi, A.M. Raman scattering study of polycrystalline magnetoelectric BiFeO3. J. Magn. Magn. Mater. 2008, 320, 548–552. [Google Scholar] [CrossRef]
  44. Xue, X.; Tan, G.; Liu, W.; Ren, H. Mater. Nd doping effect on Bi1−xNdxFe0.97Co0.03O3 thin films: Microstructural, electrical, optical and enhanced multiferroic properties. Chem. Phys. 2014, 146, 183–191. [Google Scholar] [CrossRef]
  45. Kumar, M.; Sati, P.C.; Chhoker, S. Electron spin resonance study and improved magnetic and dielectric properties of Gd–Ti co-substituted BiFeO3 ceramics. J. Mater. Sci. 2014, 25, 5366–5374. [Google Scholar] [CrossRef]
  46. Manjusha, E.; Maneesh, C. Raman study of BiFeO3 nanostructures using different excitation wavelengths: Effects of crystallite size on vibrational modes. J. Phys. Chem. Solids 2023, 172, 111060. [Google Scholar] [CrossRef]
  47. Reetu, R.; Agarwal, A.; Sanghi, S.; Ashima, A.; Ahlawat, N.; Monica, M. Phase transformation, dielectric and magnetic properties of Nb doped Bi0.8Sr0.2FeO3 multiferroics. J. Appl. Phys. 2012, 111, 113917. [Google Scholar] [CrossRef]
  48. Arafat, S.S. Structural transition and magnetic properties of high Cr-doped BiFeO3 ceramic. Cerâmica 2020, 66, 114–118. [Google Scholar] [CrossRef]
  49. Kumar, A.; Yadav, K. Magnetic, magnetocapacitance and dielectric properties of Cr doped bismuth ferrite nanoceramics. Mater. Sci. Eng. B 2011, 176, 227–230. [Google Scholar] [CrossRef]
  50. Wang, B.; Tian, X.; Song, X.; Ma, L.; Yu, S.; Hao, C.; Chen, K.; Lie, Q. Smart electrorheological behavior of Cr-doped multiferroelectric FeBiO3 nanoparticles. Colloid Surf. A 2014, 461, 184. [Google Scholar] [CrossRef]
  51. Layek, S.; Verma, H.C. Magnetic and dielectric properties of Multiferroic BiFeO3 nanoparticles synthesized by a novel citrate combustion method. Adv. Mater. Lett. 2012, 3, 533–538. [Google Scholar] [CrossRef]
  52. Gu, Y.; Zhou, Y.; Zhang, W.; Guo, C.; Zhang, X.; Zhao, J.; Zhang, Y.; Zheng, H. Optical and magnetic properties of Sm-doped BiFeO3 nanoparticles around the morphotropic phase boundary region. AIP Adv. 2021, 11, 045223. [Google Scholar] [CrossRef]
  53. Vijayasundaram, S.V.; Suresh, G.; Mondal, R.A.; Kanagadurai, R. Substitution-driven enhanced magnetic and ferroelectric properties of BiFeO3 nanoparticles. J. Alloys Compd. 2016, 658, 726–731. [Google Scholar] [CrossRef]
  54. Mao, W.; Wang, X.; Chu, L.; Zhu, Y.; Wang, Q.; Zhang, J.; Yang, J.; Li, X.; Huang, W. Simultaneous enhancement of magnetic and ferroelectric properties in Dy and Cr co-doped BiFeO3 nanoparticles. Phys. Chem. Chem. Phys. 2016, 18, 6399–6405. [Google Scholar] [CrossRef] [PubMed]
  55. Benali, A.; Bejar, M.; Dhahri, E.; Hlil, E.; Graça, M.P.F.; Valente, M.A.; Costa, B.F.O. Assessment of the critical behavior in the multiferroic Bi0.8Ba0.1Er0.1Fe0.96Cr0.02Co0.02O3 material, multi-substitution effect on magnetic and Mössbauer properties. J. Magn. Magn. Mater. 2021, 524, 167640. [Google Scholar] [CrossRef]
  56. Awasthi, R.R.; Das, B. Structural transition and tunable optical, morphological and magnetic properties of Mn-doped BiFeO3 films. Optic 2019, 194, 162973. [Google Scholar] [CrossRef]
  57. Dong, G.H.; Tan, G.Q.; Luo, Y.Y.; Liu, W.L.; Xia, A.; Ren, H.J. Charge defects and highly enhanced multiferroic properties in Mn and Cu co-doped BiFeO3 thin films. Appl. Surf. Sci. 2014, 305, 55–61. [Google Scholar] [CrossRef]
  58. Zhang, M.; Liu, J.; Wang, C.; An, X.; Wang, Y.; Xu, W.; Gu, L. Magnetic and structure property correlations in Mn-doped BiFeO3 system. J. Mater Sci. Mater. Electron. 2020, 31, 13150–13157. [Google Scholar] [CrossRef]
  59. Shah, L.R.; Zhu, H.; Wang, W.G.; Ali, B.; Zhu, T.; Fan, X.; Song, Y.Q.; Wen, Q.Y.; Zhang, H.W.; Shah, S.I.; et al. Effect of Zn interstitials on the magnetic and transport properties of bulk Co-doped ZnO. J. Phys. D Appl. Phys. 2010, 43, 035002. [Google Scholar] [CrossRef]
  60. Kumar, P.; Shankhwar, N.; Srinivasan, A.; Kar, M. Oxygen octahedra distortion induced structural and magnetic phase transitions in Bi1−xCaxFe1−xMnxO3 ceramics. J. Appl. Phys. 2015, 117, 194103. [Google Scholar] [CrossRef]
  61. Bunget, I.; Popescu, M. Physics of Solid Dielectrics; Elsevier: Amsterdam, The Netherlands; Oxford, UK; New York, NY, USA; Tokyo, Japan, 1984. [Google Scholar]
  62. Hamam, K.J.; Salman, F. Dielectric constant and electrical study of solid-state electrolyte lithium phosphate glasses. Appl. Phys. A 2019, 125, 621. [Google Scholar] [CrossRef]
  63. Sinha, A.K.; Bhushan, B.; Jagannath; Sharma, R.K.; Sen, S.; Mandal, B.P.; Meena, S.S.; Bhatt, P.; Prajapat, C.L.; Priyam, A.; et al. Enhanced dielectric, magnetic and optical properties of Cr-doped BiFeO3 multiferroic nanoparticles synthesized by sol-gel route. Results Phys. 2019, 13, 102299. [Google Scholar] [CrossRef]
  64. Ke, S.; Fan, H.; Huang, H. Dielectric relaxation in A2FeNbO6 (A = Ba, Sr, and Ca) perovskite ceramics. J. Electroceram. 2007, 22, 252–256. [Google Scholar] [CrossRef]
  65. Ke, S.; Huang, H.; Fan, H.; Chan, H.L.W.; Zhou, L.M. Colossal dielectric response in barium iron niobate ceramics obtained by different precursors. Ceram. Int. 2008, 34, 1059–1062. [Google Scholar] [CrossRef]
  66. Jumpatam, J.; Thongbai, P.; Yamwong, T.; Maensiri, S. Effects of Bi3+ doping on microstructure and dielectric properties of CaCu3Ti4O12/CaTiO3 composite ceramics. Ceram. Int. 2015, 41, S498–S503. [Google Scholar] [CrossRef]
  67. Pribosic, I.; Makovec, D.; Drofenic, M. Electrical properties of donor and acceptor doped BaBi4Ti4O15. Eur. Ceram. Soc. 2001, 21, 1327–1331. [Google Scholar] [CrossRef]
  68. Matin, M.A.; Hossain, M.N.; Ali, M.A.; Hakim, M.A.; Islam, M.F. Enhanced dielectric properties of prospective Bi0.85Gd0.15Fe1−xCrxO3 multiferroics. Results Phys. 2019, 12, 1653–1659. [Google Scholar] [CrossRef]
  69. Liu, X.; Fang, B.J.; Deng, J.; Deng, H.; Yan, H.; Yue, Q.W.; Chen, J.W.; Li, X.B.; Ding, J.N.; Zhao, X.Y.; et al. Phase transition behavior and defect chemistry of [001]-oriented 0.15Pb(In½Nb½)O3−0.57Pb(Mg1/3Nb2/3)O3−0.28PbTiO3-Mn single crystals. J. Appl. Phys. 2015, 117, 244102. [Google Scholar] [CrossRef]
  70. Kremer, F.; Schonhals, A. Broadband Dielectric Spectroscopy; Springer: Berlin/Heidelberg, Germany, 2003. [Google Scholar]
  71. Brazzano, L.C.; Sorichetti, P.A.; Santiago, G.D.; González, M.G. Broadband dielectric characterization of piezoelectric poly (vinylidene fluoride) thin films between 278 K and 308 K. Polym. Test. 2013, 32, 1186–1191. [Google Scholar] [CrossRef]
  72. Cole, K.; Cole, R. Dispersion and absorption in dielectrics. I: Alternating current characteristics. J. Chem. Phys. 1941, 9, 341–352. [Google Scholar] [CrossRef]
  73. Davidson, D.; Cole, R. Dielectric relaxation in glycerol, propylene glycol, and n-propanol. J. Chem. Phys. 1951, 19, 1484–1490. [Google Scholar] [CrossRef]
  74. Moualhi, Y.; Nofal, M.M.; M’nassri, R.; Rahmouni, H.; Selmi, A.; Gassoumi, M.; Khirouni, K.; Cheikrouhou, A. Double Jonscher response and contribution of multiple mechanisms in electrical conductivity processes of Fe-PrCaMnO ceramic. Ceram. Int. 2020, 46, 1601. [Google Scholar] [CrossRef]
  75. Mott, N.F. The origin of some ideas on non-crystalline materials. J. Non-Cryst. Solids 1978, 28, 147. [Google Scholar] [CrossRef]
  76. Mott, N.F. Conduction in glasses containing transition metal ions. J. Non-Cryst. Solids 1968, 1, 1. [Google Scholar] [CrossRef]
  77. Austin, I.G.; Mott, N.F. Polarons in crystalline and non-crystalline materials. Adv. Phys. 1969, 18, 41. [Google Scholar] [CrossRef]
  78. Mott, N.F. Conduction in non-crystalline materials. Phil. Mag. 1969, 19, 835. [Google Scholar] [CrossRef]
  79. Mott, N.F. Polarons. Mater. Res. Bull. 1978, 13, 1389. [Google Scholar] [CrossRef]
  80. Greaves, G.N. Small polaron conduction in V2O5 P2O5 glasses. J. Non-Cryst. Solids 1973, 11, 427. [Google Scholar] [CrossRef]
  81. Jonscher, A.K. Universal Relaxation Law; Chelsea Dielectric Press: London, UK, 1996. [Google Scholar]
Figure 1. (a) Rietveld refined XRD patterns; (b) schematic representation of crystal structure of the BBEFCMO sample.
Crystals 14 00445 g001
Figure 2. (a) Three-dimensional Raman spectra of BBEFCMO sample at different temperatures; (b), (c), and (d) deconvolution of the Raman spectra of the sample at 25 °C, 100 °C, and 400 °C, respectively. (e) Temperature-dependent evolution of the Raman bands position for the studied compound.
Crystals 14 00445 g002aCrystals 14 00445 g002b
Figure 3. (a) TEM image of the BBEFCMO compound; (b) Lorentzian fit of the particles size distribution obtained using Image-J software.
Crystals 14 00445 g003
Figure 4. (a) Magnetic hysteresis loops at 7 K and 300 K, (b) adjusted room temperature hysteresis loop of the BBEFCMO compound.
Crystals 14 00445 g004
Figure 5. Fitted Mössbauer spectrum at room temperature of the BBEFCMO compound.
Crystals 14 00445 g005
Figure 6. Dielectric constant as a function of (a) frequency and (b) temperature. (c) the Kramers–Kronig transformed spectra of the BBEFCMO oxide.
Crystals 14 00445 g006
Figure 7. (a) Frequency dependence of the dielectric loss tangent tg(δ) of the BBEFCM compound. (b) The Arrhenius adjustments of the relaxations frequencies of grain and grain boundary contributions and the corresponding activation energies.
Crystals 14 00445 g007
Figure 8. (a) 3D plots of the M″ as function of frequency and temperature, and (b) the Havriliak–Negami adjustment results, for the BBEFCMO sample.
Crystals 14 00445 g008
Figure 9. (a) Temperature dependence of the Havriliak–Negami parameters, (b) the Arrhenius plots of τHN for the Bi0.8Ba0.1Er0.1Fe0.96Cr0.02Mn0.02O3 sample.
Crystals 14 00445 g009
Figure 10. Temperature dependence of the (a) electric resistance, (b) DC conductivity, and (c) Ln(σdc × T0.5).
Crystals 14 00445 g010
Figure 11. (a) Adjustment results of the AC conductivity of the BBEFCMO compound. (b) Arrhenius plot (Ln(σac × T) vs. 1000/T) with the activation energy value deduced from the linear behavior at low temperature, and (c) the temperature dependence of Jonscher power law “S”.
Crystals 14 00445 g011
Table 1. Refined structural parameters obtained for the BBEFCMO sample using rhombohedral crystal structure with R3c space group.
Lattice Parameters
a = b (Å)5.561 (3)
c (Å)13.769 (3)
V (Å3)368.818 (12)
Interatomic distances
Fe/Cr/MnO (Å)2.2861/1.8025
Bi/Er/BaO (Å)2.6444/2.1023
FeOFe (°)149.431
R-factors (%)
Rwp4.873
Rexp3.132
GOF1.555
χ22.420
Atomic position parameters
Atomxyz
Bi/Er/Ba000.2206
Fe/Cr/Mn000
O0.88120.65580.4533
Table 2. The Raman modes of the prepared BBEFCMO sample.
Raman Mode [21]25 °C/(cm−1)100 °C/(cm−1)400 °C/(cm−1)
A1-1127.90128.57123.67
A1-2138.22164.27158.15
A1-3166.28184.96192.74
A1-4238.88248.22248.15
E258.74273.73279.74
E283.14307.18310.92
E374.10376.39397.65
E463.25449.73458.66
E490.03475.36484.28
E512.37500.71507.51
E597.08595.86589.96
E617.02617.50612.65
E640.04643.85653.32
Table 3. Obtained adjusted parameters of the room temperature magnetic hysteresis loop of BBEFCMO compound.
Observed Magnetization (emu/g)AFM
Contribution (×105
emu*Oe/g)
FM Contribution
HCI (kOe)MFMS (emu/g)MFMR (emu/g)
8.0510.3254.2084.8011.947
Table 4. Hyperfine parameters resulted from the fitting procedure of the Mössbauer spectrum of the BBEFCMO compound. Isomer shifts are given relatively to α-Fe.
Siteδ (mm/s)Δ (mm/s)B (T)Γ (mm/s)%Coordination
Doublet0.23 (1)0.550 (1)-0.47 (1)5.3Fe3+
Sext 10.39 (1)0.034 (1)50.7 (1)0.45 (1)42.3Fe3+
Sext 20.38 (1)0.032 (1)49.3 (1)0.47 (1)47.2Fe3+
Sext 30.25 (1)0.049 (1)41.5 (1)0.67 (1)5.2Fe3+
Disclaimer/Publisher’s Note: The statements, opinions and data contained in all publications are solely those of the individual author(s) and contributor(s) and not of MDPI and/or the editor(s). MDPI and/or the editor(s) disclaim responsibility for any injury to people or property resulting from any ideas, methods, instructions or products referred to in the content.

