Article

Multitemporal Field-Based Maize Plant Height Information Extraction and Verification Using Solid-State LiDAR

1
Institute of Facility Agriculture, Guangdong Academy of Agricultural Sciences, Guangzhou 510640, China
2
College of Electronic Engineering, South China Agricultural University, Guangzhou 510642, China
3
Tea Research Institute, Guangdong Academy of Agricultural Sciences, Guangzhou 510640, China
4
College of Engineering, South China Agricultural University, Guangzhou 510642, China
*
Author to whom correspondence should be addressed.
Agronomy 2024, 14(5), 1069; https://doi.org/10.3390/agronomy14051069
Submission received: 19 April 2024 / Revised: 13 May 2024 / Accepted: 15 May 2024 / Published: 17 May 2024
(This article belongs to the Section Precision and Digital Agriculture)

Abstract

:
Plant height is regarded as a key indicator that is crucial for assessing the crop growth status and predicting yield. In this study, an advanced method based on solid-state LiDAR technology is proposed, which is specifically designed to accurately capture the phenotypic characteristics of plant height during the maize growth cycle. By segmenting the scanned point cloud of maize, detailed point cloud data of a single maize plant were successfully extracted, from which stem information was accurately measured to obtain accurate plant height information. In this study, we will concentrate on the analysis of individual maize plants. Leveraging the advantages of solid-state LiDAR technology in precisely capturing phenotypic information, the data processing approach for individual maize plants, as compared to an entire maize community, will better restore the maize’s original growth patterns. This will enable the acquisition of more accurate maize plant height information and more clearly demonstrate the potential of solid-state LiDAR in capturing detailed phenotypic information. To enhance the universality of the research findings, this study meticulously selected key growth stages of maize for data validation and comparison, encompassing the tasseling, silking, and maturity phases. At these crucial stages, 20 maize plants at the tasseling stage, 40 at the flowering stage, and 40 at the maturity stage were randomly selected, totaling 100 samples for analysis. Each sample not only included actual measurement values but also included plant height information extracted using point cloud technology. The observation period was set from 20 June to 20 September 2021. This period encompasses the three key growth stages of maize described above, and each growth stage included one round of data collection, with three rounds of data collection each, each spaced about a week apart, for a total of nine data collections. To ensure the accuracy and reliability of the data, all collections were performed at noon when the natural wind speed was controlled within the range of 0 to 1.5 m/s and the weather was clear. The findings demonstrate that the root mean square error (RMSE) of the maize plant height data, procured through LiDAR technology, stands at 1.27 cm, the mean absolute percentage error (MAPE) hovers around 0.77%, and the peak R2 value attained is 0.99. These metrics collectively attest to the method’s ongoing high efficiency and precision in capturing the plant height information. In the comparative study of different stem growth stages, especially at the maturity stage, the MAPE of the plant height was reduced to 0.57%, which is a significant improvement compared to the performance at the nodulation and sprouting stage. These results effectively demonstrate that the maize phenotypic information extraction method based on solid-state LiDAR technology is not only highly accurate and effective but is also effective on individual plants, which provides a reliable reference for applying the technique to a wider range of plant populations and extending it to the whole farmland.

1. Introduction

In the foreseeable future, the continuous growth of the population and the decrease in the per capita arable land area are expected to further increase the demand for food [1]. Moreover, the frequent occurrence of natural disasters, such as pests, floods, and droughts, poses a severe challenge to global food security [1]. As one of the three major staple crops worldwide, maize [2] plays a crucial role in this. Enhancing maize yield is not only essential for meeting the growing demand for food [3] but is also a key measure to ensuring food security [4]. Against this backdrop, breeding high-yield maize varieties becomes an important strategy to address the global food crisis [5,6]. Additionally, the detection and analysis of crop phenotypes are of significant importance for increasing maize yields [7]. Maize phenotypic information encompasses a massive number of growth parameters. Among them, the maize plant height is used to monitor the growth status of maize. It provides important indications of the growth, light use efficiency, and carbon stocks in agroecosystems [8]. Therefore, extracting the plant height phenotype is necessary to select dwarf maize with more kernels for improving maize yield and plays a major role in crop growth monitoring and yield estimation [9].
The traditional method of detecting maize height is usually manual, which has many disadvantages, including not only its high cost, low efficiency [10], and error-proneness but also its smaller scale, lower precision, and the damage it causes to crops. Therefore, detecting and studying mass maize phenotypes is currently in a bottleneck period. The development of sensor technology and image processing algorithms [11] has made it possible to obtain and analyze maize phenotypes in recent years [12,13,14]. Three-dimensional measuring devices [15] like 3D cameras [16], photogrammetric methods [17], or laser scanners [18] provide a non-contact and non-destructive 3D measurement method [19]. Niu et al. [20] used remote sensing images combined with ground control points (GCPs) to produce a high-precision digital surface model (DSM). The canopy heights of maize breeding material at each growth stage were obtained by calculating the difference in the DSM between different growth stages and verifying the precision. Hu et al. [21] estimated sorghum height using an unmanned aerial vehicle (UAV) equipped with a digital camera based on high-throughput phenotypic analysis. Zhu et al. [22] provided a method that extracted a maize plant point cloud skeleton from the Laplace algorithm to segment a variety of phenotypes. Qiu et al. [23] came up with a technique that quickly measures the maize stem diameter in fields based on an RGB-D camera.
From the above research results, the main methods that measure maize plant phenotypes are based on visible images [24], which costs less. However, only highly resolved and accurate 3D point clouds enable a valid description of the geometry of plant organs [25]. But the data quality of 3D cameras is susceptible to varying illumination, especially for some tall maize plants with large densities. The accuracy of maize phenotypic acquisition is comparatively low. Li et al. [26] introduced a technique for 3D reconstruction and phenotypic measurement of maize seedlings, based on a series of multi-view images. While this approach facilitates high-precision 3D reconstruction and phenotypic measurements of maize, it harbors a limitation: the implementation of this technique necessitates the construction of a dedicated photography platform, a constraint that renders large-scale data collection and 3D reconstruction onsite inconvenient.
Light Detection and Ranging is one of the 3D scanning technologies that could generate point clouds directly by scanning. Laser scanning results in huge point clouds with more than one hundred thousand data points for a whole plant or ten to thirty thousand points per plant organ [16], and it has the advantages of high-precision and strong disturbance resistance. This technique has been used in various studies for plant analysis widely [27], but Light Detection and Ranging is still rarely used in detecting crop phenotypes. Jin et al. [28] proposed an advanced technique for maize stalk and leaf segmentation and phenotypic trait extraction using ground-based LiDAR data. This technique focuses on the 3D modeling of maize plants and the automated decomposition of their 3D structures for stem and leaf segmentation. Although the study demonstrated its proof of concept, there is still the challenge of extracting maize stems and the in-depth analysis of their 3D phenotypic data.
This study utilized ground-based LiDAR technology to collect and reconstruct the point cloud data of maize in a field. This process encompassed complex post-processing steps such as the filtering, registration, and segmentation of point cloud data. By accurately extracting and measuring the maize stem, the phenotypic height data of the maize were obtained, and these data were then cross-verified with field measurement results. The results show that LiDAR measurements exhibit high accuracy and consistency at different stages of maize plant growth, with excellent accuracy and near-perfect coefficients of determination throughout the growth cycle. This highly efficient plant height measurement technology not only enhances the precision of data extraction but also offers novel avenues for the automated collection and management of plant phenotypic data. This technique is crucial for monitoring crop growth, the early identification of anomalies, the adjustment of management strategies, the optimization of resource utilization, the control of pests and diseases, and accurate yield prediction [29]. Simultaneously, it facilitates research into genetic and environmental interactions, accelerates breeding processes, and makes significant contributions to the fields of agricultural production and plant phenotypic analysis.

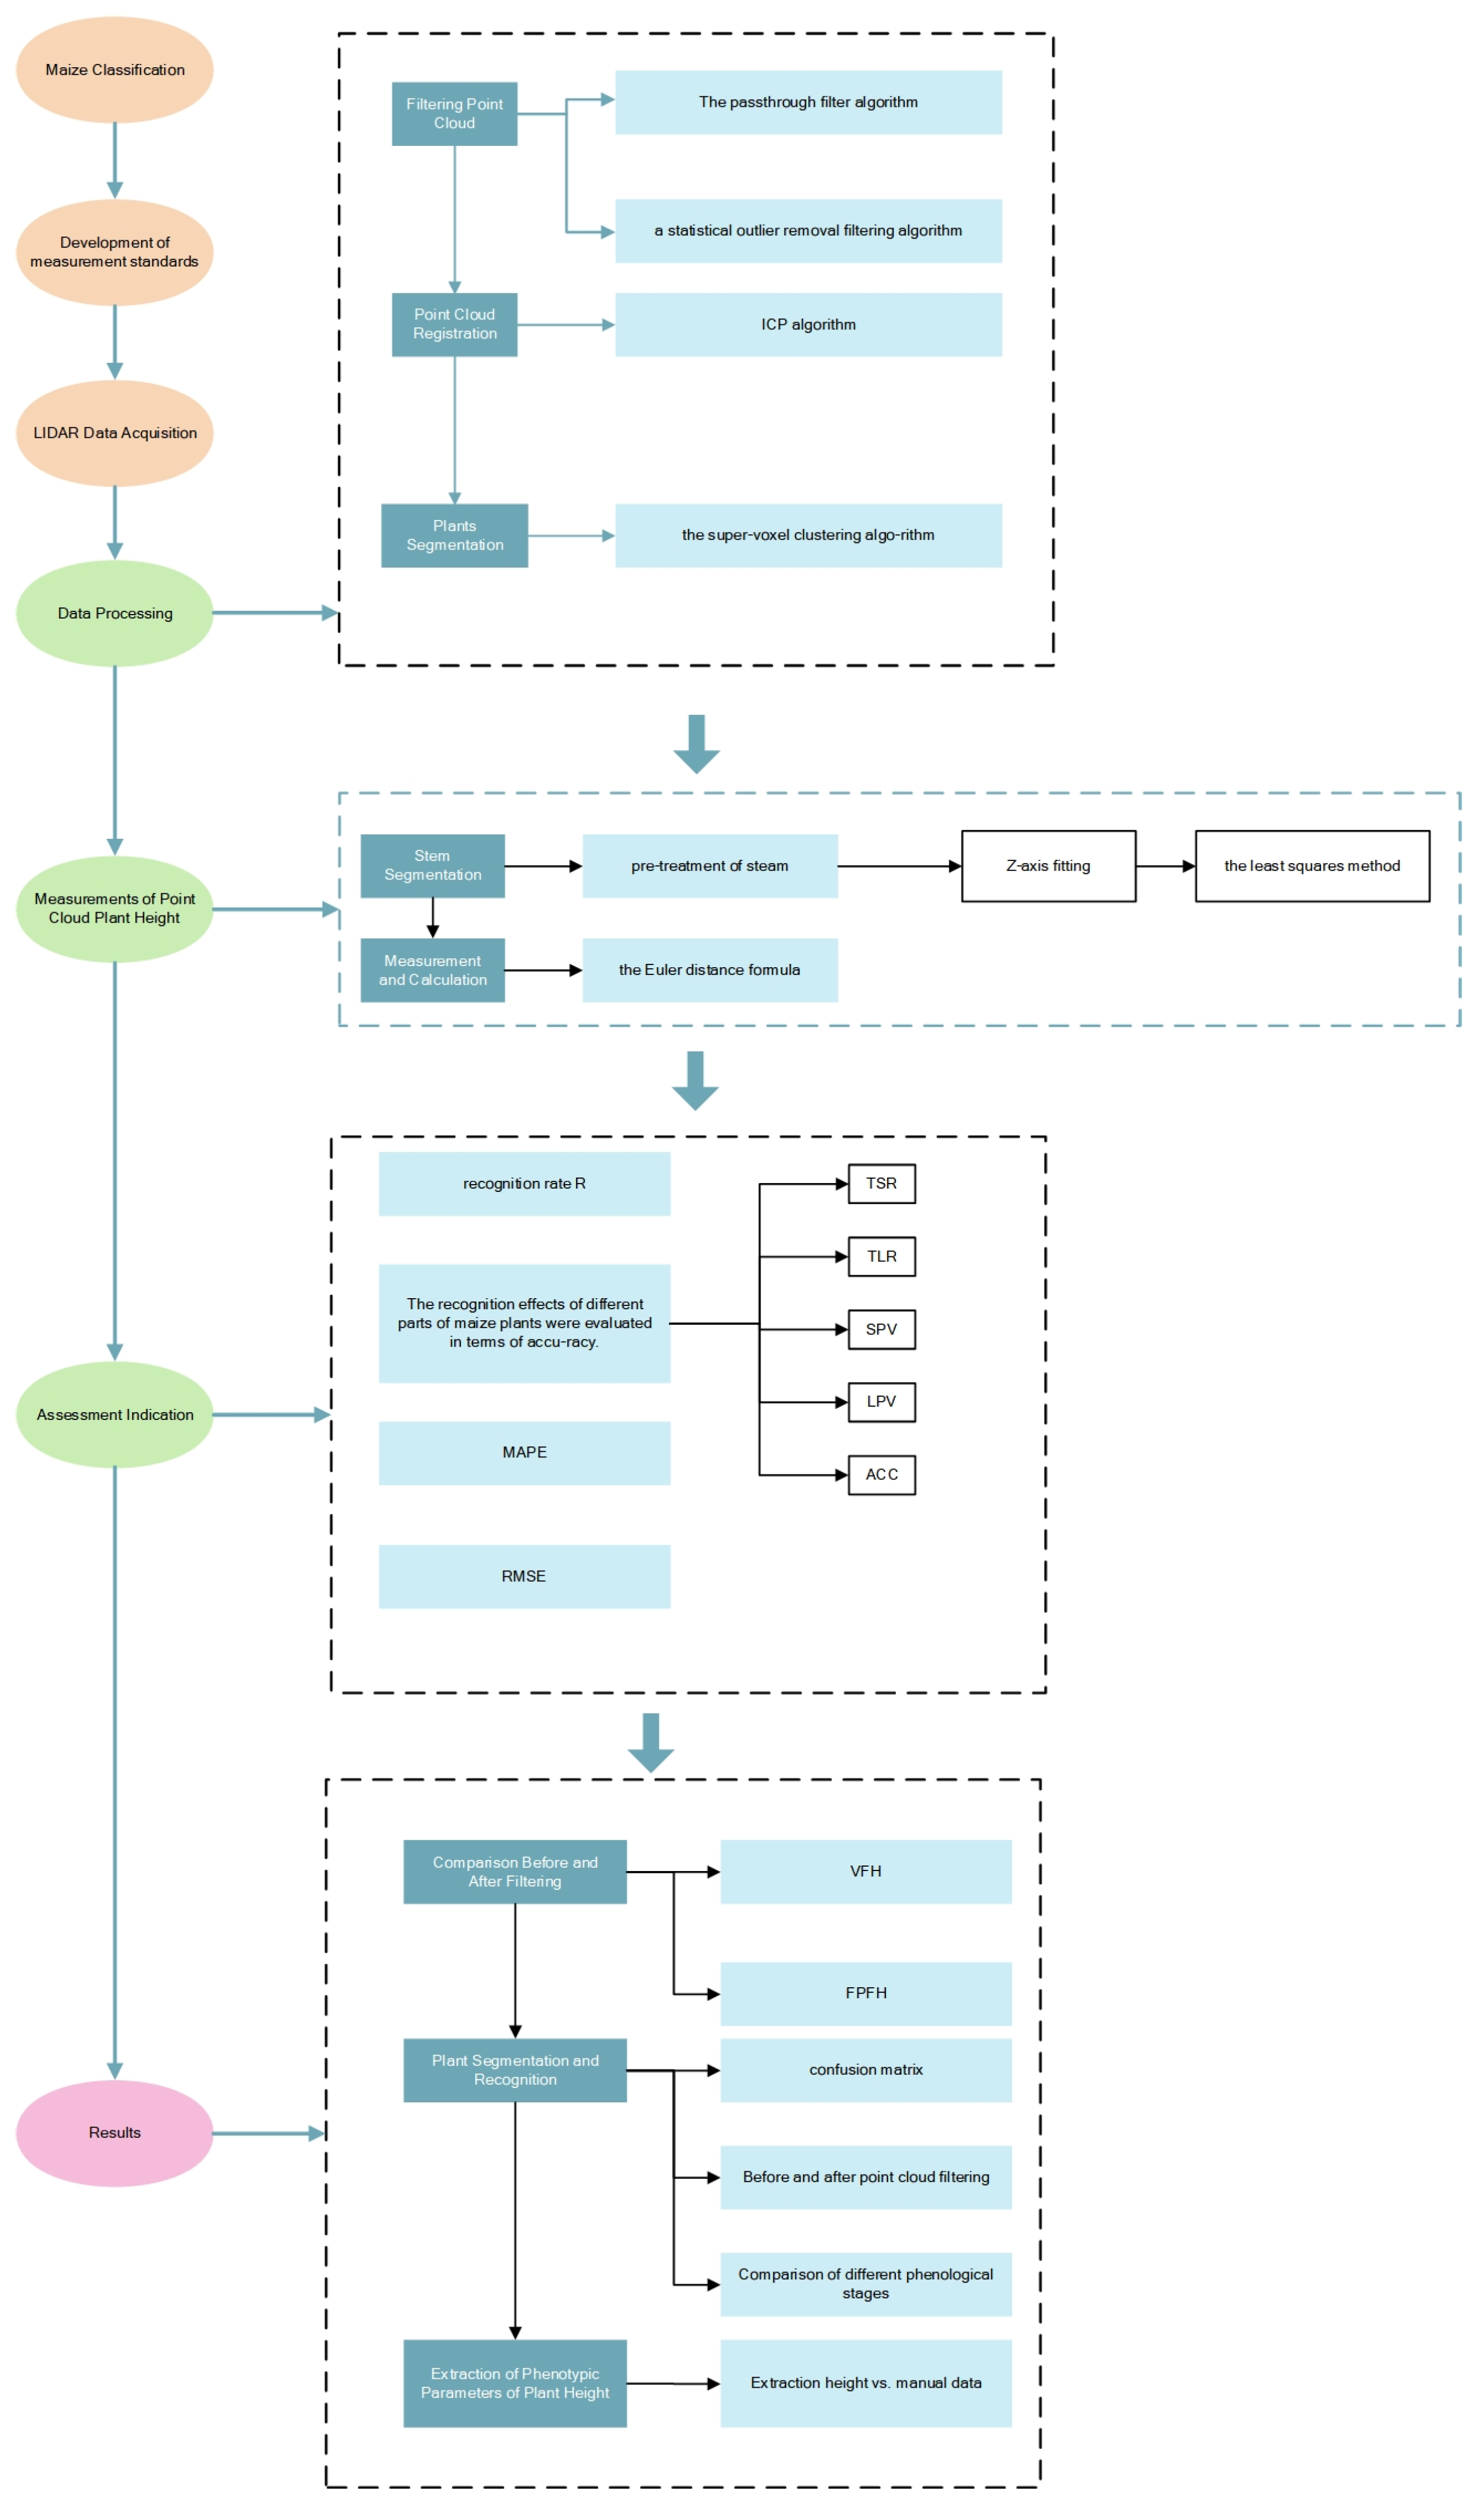
2. Materials and Methods

2.1. Data Acquisition

2.1.1. Point Cloud Data Acquisition

In this paper, the experimental site was the experimental base of South China Agricultural University in Zengcheng District, Guangzhou, Guangdong Province (113°38′38″ E, 23°14′34″ N). As shown in Figure 1, the rectangular experimental field was composed of 112 rows and 30 columns of maize plants. The maize row spacing was 1.1 m, and the plant spacing was 0.40 m. The research object was the maize with a growth cycle from 20 June to 2 September 2021.
Livox-mid 40 LiDAR (Livox Company, Shenzhen, China) collected maize point cloud information. Its main parameters are shown in Table 1. The Livox Mid-40 LiDAR uses non-repetitive scanning and a solid-state structure, with increased integration time, enhancing the probability of detecting objects and details within the FOV [30] (Figure 2).
The scheme of scanning the maize is shown in Figure 3, and the point clouds were collected by the Livox-mid 40 LiDAR. A coordinate system was created with the origin that was the LiDAR position, and the y-axis that was the LiDAR orientation. The LiDAR was set flat on the tripod, which made filtering easy. Because detected plants would be blocked by objects in front of them (Figure 3B), this study adopted a method to avoid collecting point clouds that were not complete. Within the designated maize sampling field, three data collection points were determined and arranged according to the collection strategy. Each point was located approximately 2.5 m from the edge of the field, forming a 30-degree angle with each other. Sequentially, point cloud data were collected from points 1 to 3. By aggregating the point cloud data obtained from different perspectives and integrating information from multiple advantageous positions, this study successfully reconstructed the 3D point cloud model of the maize plants, thereby obtaining a comprehensive point cloud model of the maize vegetation.

2.1.2. Standardization of Maize Plant Height Measurement

In this paper, the height information of maize plants in the sampling field was collected and verified by manual measurement. Different measurement standards were adopted to measure maize plant height at different growth periods.
As depicted in Figure 4, since the stems, branches, and leaves of maize during the tasseling stage are not fully developed yet, the measurement of plant height is taken from the ground base to the new leaves at the top of the stem [31]. By the time maize plants reach the flowering and maturity stages, they have completed the tasseling process. Consequently, the height of maize plants is measured from the ground base to the top of the canopy. In this study, for maize plants at the tasseling stage, 20 were randomly selected as the initial control group, with the aim of measuring their height [32]. For maize plants at the grain flowering stage, another 40 were randomly chosen, constituting the second control group. Additionally, 40 plants at the maturity stage were also randomly selected, forming the third control group, bringing the total sample size to 100 plants. To minimize measurement errors, the height of the same maize plant is measured three times, and an average value is computed to determine the plant height.

2.1.3. The Method of Extracting Multi-Phenotypic Maize Plant Height Information Using Solid-State LiDAR

This study proposes a method for extracting multitemporal maize plant height information in the field using solid-state LiDAR, and verifies its effectiveness. The basic idea is shown in Figure 5. First, variations in the accuracy of plant height measurements were explored for maize at three phenological stages: staminate, flowering, and maturity, followed by the development of standards for measuring maize plant height for data processing and statistics. LiDAR was utilized for multi-angle continuous scanning of maize plant communities to achieve high-precision data collection. The processing included three steps: point cloud filtering, point cloud alignment, and plant segmentation. The point cloud filtering stage utilized the passthrough filter algorithm and statistical outlier removal filtering algorithm to purify the point cloud data. The Iterative Closest Point (ICP) [33] algorithm was used in the point cloud alignment stage to realize the point cloud alignment of the maize plants, while the plant segmentation stage utilizes the supervoxel clustering algorithm to realize the segmentation of the plants. The next step was to measure the height of the maize point cloud plants. First, stem preprocessing was performed by the least squares and Z-axis fitting methods, and then the segmentation of the corn stems was realized. Then, the Euclidean distance formula was utilized for measurement and calculation.
In terms of evaluation metrics, eight metrics, namely, recognition rate (R), the mean absolute percentage error (MAPE), the root mean square error (RMSE), the rate of the true stem (TSR), the rate of the true leaf (TLR), stem predictive values (SPV), leaf predictive values (LPV), and the closeness between a given set of measurements (TS and TL) and their true values (ACC), respectively, were used to evaluate the feasibility of the proposed method. The results were analyzed to verify the feasibility of multitemporal maize plant height information extraction in the field using solid-state LiDAR in terms of three aspects: comparison before and after filtering, plant segmentation and identification, and plant height phenotypic parameter extraction. The results were analyzed to verify the feasibility of multitemporal maize plant height information extraction in the field using solid-state LiDAR in three aspects: comparison before and after filtering, plant segmentation and identification, and extraction of plant height phenotypic parameters.

2.2. Data Processing

2.2.1. Filtering Point Cloud

The field environment was complex. Therefore, there was a lot of point cloud noise and complex background that were non-target area point information in the collected point cloud data. It is necessary to filter out invalid pointsets from the input data, such as ground, weeds, and point cloud noise. The maximum acquisition distance of LiDAR could reach about 200 m, far beyond the effective acquisition range of maize plants and the range of target fields. The point cloud information beyond the target area was filtered preliminarily by using the passthrough filtering algorithm. This study, by integrating noise filtering and statistical contour removal algorithms, allows for a more precise depiction of the point cloud model contours of maize plants. This approach enhances the preservation of the point cloud model’s integrity. It also simplifies the process of point cloud registration. Moreover, it substantially lowers the incidence of registration errors. This research primarily employs the Point Cloud Library (PCL) [34] and the C++ language to realize this point cloud processing workflow.
The passthrough filter algorithm was used to filter along the specified dimension of the point cloud and retained the point cloud data within the specified range [35]. The point cloud was composed of points with 3D coordinate information. The point cloud of any dimension can be filtered by setting the threshold. In this experiment, the point cloud data was obtained by LiDAR scanning that included a large number of invalid point clouds, the point cloud of the blocked part of maize plants, and maize plant point clouds that could not be completely collected. Through passthrough filtering, the point cloud was roughly filtered to reduce the operation time of statistical outlier removal filtering. At the same time, it could improve the accuracy of registration and reduce the registration time. Since the acquisition point that we set was located 2.5 m in front of the target point cloud, the y-direction passthrough filtering could be carried out on the Y-axis of the point cloud data when the coordinate was larger than the range of the target point cloud. Similarly, the same processing method was adopted for the non-target areas in the X and Z axes.
The statistical outlier removal filtering algorithm was employed to enhance the quality of point cloud data. This algorithm addressed the removal of outliers in sparse point clouds by evaluating the distance distribution from each point cloud to its neighboring clouds within the input dataset [36]. The assumption was made that all resulting distributions followed Gaussian distributions, characterized by their mean and standard deviation.
When scanning maize plants with LiDAR to obtain point cloud data, multiple factors can affect the quality and accuracy of the data [27]. Firstly, the displacement of maize plants over time, as well as under the influence of wind, can result in uneven density in the collected point cloud data. Specifically, due to varying collection distances at the test points, the point cloud density of the maize plants changes significantly, and environmental factors like wind introduce sparse outliers into the data. This is particularly evident on the maize leaves and branches, which are more prone to displacement relative to the stem, thus generating more outliers in consecutive short-frame scans [37].
These outliers and noise not only increase the difficulty of data processing but can also lead to the failure of point cloud information registration, affecting the accurate calculation of surface normals and curvature, and consequently reducing the measurement precision of features such as maize plant height.
To address this issue, a statistical outlier removal [38] filtering algorithm is employed, which conducts a statistical analysis of the neighborhood of each point, in order to enhance the smoothness and uniformity of the point cloud data, thereby removing outliers from the point cloud.
The specific calculation process is as follows:
    m d i = 1 K k = 1 K d k
    μ = i = 1 N m d i N ,
σ 2 = i = 1 N ( m d i ) 2 ( i = 1 N m d i ) 2 N N 1 ,
t h = μ + s t d m u l · σ ,
First, the average moving distance of each point m d i is calculated, as shown in Formula (1). Then, the global average value μ and variance σ 2 of all points’ m d i values are calculated, given by Formulas (2) and (3), respectively. Finally, a threshold t h is set, as shown in Formula (4), to determine which points should be considered outliers and removed. This threshold is calculated by multiplying the standard deviation σ by a coefficient s t d m u l and adding it to the average value μ . Points in the point cloud whose average moving distance exceeds this threshold will be marked as outliers and removed from the dataset.
In this study, for the point cloud of maize leaf and stem sparsity values, the neighborhood number is set to 50, and the standard deviation multiplier s t d m u l is set to 1. This means that points whose standard deviation of the average distance from the query point exceeds 1 will be identified as outliers and eliminated. By denoising through statistical methods, the normal vectors of each organ in the maize plant point cloud become more consistent, aiding in feature extraction and improving the accuracy of stem segmentation and plant height measurement, thereby enhancing the efficiency and reliability of point cloud processing.

2.2.2. Point Cloud Registration

The single point clouds of maize plants could be obtained through point cloud segmentation, but the segmented point clouds of maize were incomplete, especially the point clouds on the side far away from the LiDAR [39]. Moreover, due to the mutual shielding of maize plants and multiple folding of maize leaves, both the acquisition accuracy of the 3D position and the scanning effect of the maize plant point clouds [40,41] would be affected. According to the acquisition scheme described in this paper, the 3D point clouds information of the target maize plant was obtained from three different angles, and then the point cloud information of the target plant was registered to obtain the complete maize point cloud.
Point cloud registration was the process of aligning various 3D point cloud data views into a complete model, finding the relative position and direction of the separately obtained view in the global coordinate framework, and perfectly overlapping areas intersected by other point clouds. The common algorithm for registration was the ICP algorithm, and its principle is expressed as follows:
In the overlapping area of the two groups of point clouds data to be matched, two-point sets are selected to represent the source point set and the target point set, where P = p i | p i R 3 , i = 1,2 , · · · · n is the source set, Q = q j | q j R 3 , j = 1,2 , · · · · m is the target set, and m and n represented the scale of the two-point sets, respectively. The rotation and the translation matrix are identified as R and t. So, the question of solving the optimal transformation matrix can be transformed into finding the optimal solution (R, t) satisfying min R , t .
R * , t * = a r g R , t m i n i = 1 n | | ( R p i + t ) q i | | 2 ,
where p i represents the corresponding points of the source point cloud to be registered, q i represents the points of the target point cloud; n is the number of points of point clouds to be registered; R , t are the rotation matrix and the translation matrix of registration; R * , t * are the optimal solutions of R and t to be solved.
In Figure 6, Figure 6A shows the source point cloud of a single maize plant to be aligned, and Figure 6B shows the reference point cloud of a single maize plant. First, the point set p i was extracted from the target maize point P, p i ϵ P . The corresponding point set q i is found in Figure 6A, q i ϵ Q . The rotation matrix R and the translation matrix t were calculated to minimize the error function. The point set P was rotated and translated to obtain a new corresponding point set p i . The average distance between p i and the corresponding point set q i was calculated. It was set as d = 1 n i = 1 n | p i q i | 2 when d was less than a given threshold or greater than the preset maximum number of iterations, and the iterative calculation was terminated. Otherwise, the optimal calculation was returned until the convergence condition was met. After convergence, the complete maize point clouds model was obtained, as shown in Figure 6C.

2.2.3. Plant Segmentation

To measure the plant height of a single maize plant, it was necessary to segment the filtered plant point clouds to extract a single maize plant [39]. The interference of field weeds and ground bulge make it difficult to segment plant point clouds accurately. Moreover, due to the distortion phenomenon of point clouds when LiDAR collected the point cloud data, it was impossible to obtain an accurate maize point cloud model. Especially in a windy state, the distortion of the maize point clouds was obvious, which made it difficult to extract their skeletons from the maize point clouds. To accurately segment the single maize point clouds, we used the supervoxel clustering algorithm [42] and Euclidean clustering algorithm to segment the maize point clouds.
During segmentation, it was necessary to search the adjacent points to deal with the point clouds composed of multiple spatial isolation areas. The cluster included a single maize plant point cloud, and the scanned data were both large and dense. Therefore, this resulted in the lack of a large number of point clouds to be searched, a large search volume, and a long search time. As a result of the supervoxel clustering algorithm, points in the point clouds were clustered and segmented as nodes, thus reducing the size of the point cloud, reducing the time it took to search, improving segmentation accuracy, and effectively segmenting a single maize skeleton [43].
The supervoxel clustering segmentation algorithm deleted isolated point clouds in the process of generating point cloud voxels. After finding the skeleton of the maize point clouds through the clustering results of supervoxels, the adjacent point cloud was queried by the Euclidean algorithm and segmented by the clustering method to obtain a single maize point cloud.
By employing Euclidean distance vectors to cluster feature points within a Euclidean cloud, each Euclidean distance vector primarily comprises a set of associated feature points [44]. Based on the voxel eigenvalues of point clouds obtained by supervoxel clustering segmentation, the threshold judgment segment of voxel eigenvalues of adjacent point clouds in space was divided into the same point cloud set. Finally, it was inferred that all point cloud voxels were used to segment the point clouds of a single maize plant.

2.3. Measurements of Point Cloud Plant Height

After obtaining the complete maize single plant model from the above steps, the maize plant was divided to obtain the maize plant height value.

2.3.1. Stem Segmentation

As maize stalks resemble cylindrical bodies in shape, accurate extraction of the main structure of maize stalks can be achieved by fitting a cylindrical model to the point cloud data of the maize plants. To construct a maize stalk model, a cylindrical model is required to precisely segment the point cloud data. During the data acquisition phase, the precise positioning of the LiDAR sensor ensures that its scanning plane is perpendicular to the maize plants, aligning the growth axis of the stalks with the Z-axis of data collection [45]. This alignment facilitates cylindrical fitting along the Z-axis, which significantly improves segmentation efficiency, reduces computation time, and substantially lowers the likelihood of segmentation errors.
In the preprocessing phase of constructing the maize stalk model, specific steps are needed to process the point cloud data to enhance the accuracy and efficiency of the model. The detailed computational steps are as follows:
v = v x , v y , v z ,
p 0 = x 0 , y 0 , z 0
n i = L S p i 1 , p i 2 , , p i K ,
d i = | | ( p i p 0 ) ( p i p 0 v | | v | | 2 ) v | | ,
Let p 0 be a reference point on the axis of a cylinder, and v be the directional vector of that axis. Through the least squares method, the nearest neighbor point set n i , aligned with the cylinder’s normal vector, is selected from the point cloud, as defined in Equation (8). Subsequently, for randomly selected sample points p k , their distance d i to the cylinder’s axis is calculated, following Equation (9). This process is executed through multiple iterations, aiming to find an optimal cylindrical model fit, ensuring that the chosen sample point set accurately represents the geometric characteristics of the cylinder. In this study, the growth direction of a maize plant was defined as the Z-axis in a cylindrical coordinate system [42].
In this study, the measurement of maize plant height using this method does not exclude the maize canopy. This is because the canopy is consistent with the stalk in the vertical direction Z a x i s , and therefore, canopy information is also taken into account during the data segmentation and fitting process. This means that the measured plant height is a comprehensive value, including the entire vertical distance from the base of the plant to the top of the canopy. This integrated measurement approach enhances the accuracy of the stalk point cloud model extraction, and is particularly applicable to maize stalks during flowering and maturity phases, as their shape is more cylindrical.
When fitting point clouds of maize stalks during flowering and maturity stages, since their shape is closer to a perfect cylinder, it is necessary to adjust the normal threshold during the optimization of the segmentation process, while also considering the different spatial distributions of leaves and branches at various growth stages of the maize plants. Setting the threshold too high may lead to inaccurate segmentation, while setting it too low could affect the precise fitting of the ears and other parts of the plant, resulting in suboptimal segmentation outcomes. Considering that the spatial distribution of leaves and branches of maize plants during the elongation stage is relatively sparse, appropriately increasing the range of the segmentation normal threshold becomes a key step in improving the accuracy of the cylindrical fit.

2.3.2. Measurement and Calculation

After cylindrical fitting the single plant model of maize plant point clouds, the stem model was composed of point clouds and could be expressed by 3D coordinates. Then, the maize plant height was calculated by the Euler distance formula. The Euler distance formula was as follows:
D = x 1 x 2 2 + y 1 y 2 2 + z 1 z 2 2 2 .
In this study, the height of a maize plant is defined as the Euclidean distance D between two points: the lowest point with coordinates x 1 , y 1 , z 1 and the highest point with coordinates ( x 2 ,   y 2 ,   z 2 ) . This method involves traversing through all the point cloud coordinates of the stem and calculating the distances between all points to accurately measure the height of the maize. According to the definition described in Section 2.1.2, the ground reference is identified as the stem’s lowest point. In maize, during the tasseling phase, the apex of the stem is considered the highest point of the stem model; for maize in the flowering and maturing phases, the top of the maize canopy is recognized as the highest point of the stem model.

2.4. Assessment Indication

In this paper, the segmentation success rate R is used to represent the segmentation effect of a single maize plant. The segmentation success rate is expressed as the ratio of the number of successful segmentations to the actual number of maize plants. The calculation formula of recognition rate R is as follows:
R = n m ,
where n is the number of successful recognitions, and m is the total number of recognitions.
This paper evaluated the recognition effect of the segmented point clouds of maize stems and branches and leaves, which was statistically analyzed through the confusion matrix. The recognition effect before and after filtering were compared. The recognition effects of different parts of maize plants were evaluated in terms of accuracy. The calculation formula is as follows:
  T S R = T S T S + F L ,
T L R = T L T L + F S ,
S P V = T S T S + F S ,
L P V = T L T L + F L ,
  A C C = T S + T L T S + T L + F S + F L ,
where TSR is the rate of the true stem, and TLR is the rate of the true leaf. They described the accuracy of a test that reported the presence or absence of the condition. Individuals that met the condition were considered stems or leaves. SPV and LPV are stem and leaf predictive values, respectively, which were the proportions of true stems and true leaves in the predicted results of statistics and diagnostic tests. TS is the value of the true stem condition; FS is the value of the false stem condition; TL is the value of the true leaf condition; FL is the value of the false leaf condition; ACC is the proximity between a given set of measured values (TS and TL) and their true values. In other words, it is the proportion of correct classifications among all categories [46].
In addition, the mean absolute percentage error (MAPE) and root mean square error (RMSE) are both used as indexes to evaluate the calculation accuracy of plant height. The calculation formula is as follows:
M A P E = 1 n i = 1 n x j x s x s × 100 % ,
  R M S E = 1 n i = 1 n x j x s 2 ,
where n is the number of samples; x j is the extracted value; and x s is the manual measurement value.

3. Results

3.1. Comparison before and after Filtering

In the process of point cloud registration, the existence of noise point clouds increased the number of local features. The registration difficulty rose and the accuracy decreased as the local features and vectors became more complex, thereby impacting the registration effect. Point cloud filtering removed a large amount of redundant point cloud information, reduced the amount of data in the point cloud, and simplified local features. At the same time, it effectively improved the registration efficiency of the point clouds.
Figure 7 showed the comparison of the viewpoint feature histogram before and after filtering. It could be seen that the number of viewpoint direction components and the number of Fast Point Feature Histogram (FPFH) [47] surface shapes decreased by about 20% after filtering, which reduced the complexity of registration feature extraction and helped to improve the accuracy of point cloud registration. From the maize plant point clouds filtered by the statistical value, there were fewer nodes in the whole area. Moreover, compared with the point clouds without filtering, the average number of skeleton supervoxels extracted before filtering was 5839. The average number of skeleton supervoxels removed after filtering was 4646, indicating that the statistical value filtering effectively reduced the number of point clouds by about 11%. It mainly reduced the redundant nodes generated from the redundant noise and effectively reduced the phenomenon of wrong segmentation when extracting the skeletons.

3.2. Plant Segmentation and Recognition

The same point cloud image was tested before and after filtering, which was used for the segmentation of single plants and the identification of the stems and leaves. The test results are shown in Figure 8.
It can be seen from the confusion matrix that there were actually 25 maize plants in the point cloud sample, and 21 maize plants were segmented before filtering. Among them, five samples were identified incorrectly in the stem and branch identification test. After filtering, a total of 23 maize plants were segmented. In the identification test of the stems and branches, two samples were misidentified, and both of them identified the point clouds of the branches and leaves as the point clouds of the stems.
Regarding the success segmentation rate of a single maize plant before and after filtering, the success segmentation rate after filtering increased significantly from 64.00% to 84.00%. This improvement was attributed to the reduction in the clutter in the single maize plants. The application of contour and skeleton extraction techniques on the maize proved beneficial. Given that the primary objective of this study was to extract height information from maize plants, the segmentation of the maize organs was focused mainly on two components: the stems (including the ears) and the branches. The segmentation process of a single plant’s point cloud primarily involved fitting the stem to identify its branches and leaves. Given that the data for the stems and leaves in the sample were balanced, successful identification also suggested a balanced distribution of branches and leaves. Consequently, the recall rate for the stem was equivalent to the precision rate for the branches and leaves, and vice versa.
As demonstrated in Table 2, after the application of filtering, the recall rate for stem identification increased from 88.89% to 100%, and the recall rate for the branches and leaves improved from 84.21% to 91.30%. The recognition rates for the stem and the branches and leaves, increased from 84.21% to 91.30%, and from 88.89% to 100%, respectively. Additionally, the overall recognition accuracy improved from 86.55% to 95.65%. The data revealed that the recall rate for the branches and leaves was lower than that for the stems. This discrepancy arose because the branches and leaves within the maize point clouds were frequently misidentified as stems. The occlusion between maize plants led to less distinct characteristics of the branches and leaves, and the continuity of the stem’s point clouds was poor. In the process of fitting the stems, branches and leaves were mistakenly regarded as part of the stem due to the failure to preserve their overall extension characteristics. This resulted in segmented stem point clouds that included the branch and leaf point clouds.
However, after filtering, the contours of the branch and leaf point clouds became relatively clearer, and the number of adjacent points was significantly reduced. This led to a notable improvement in the recall rate, precision rate, and accuracy rate.
From the visualization results of stem recognition and segmentation in Figure 9, it could be seen that the supervoxel clustering segmentation and the Euclidean clustering performed better in segmenting a single plant. Figure 9A,B showed the segmentation effect of an incomplete point cloud model on maize plant stems due to occlusion. Due to the incompleteness of the stalk point cloud with missing parts in the center, adopting a cylindrical fitting method can improve the accuracy of estimating the stalk shape. Moreover, given the effectiveness of point clouds in segmenting the upper and lower parts of the maize stalk, this method is of significant importance for the precise measurement of the maize plant height. Figure 9C displayed the segmentation and recognition effect of maize at the flowering stage.
The model shown in Figure 9C, when compared to Figure 8A,B, demonstrates a higher level of completeness. Hence, from this comparison, it is evident that maize plants located at the periphery of the crop population have achieved significant improvements in the accuracy of stem identification and segmentation during the flowering and maturity stages. Meanwhile, the maize at the tasseling stage, as depicted in Figure 9D–F, despite having relatively complete point cloud models, exhibit underdeveloped organ growth, particularly evident at the jointing stage, which results in inferior segmentation and identification outcomes compared to the maize plants at the flowering and maturity stages. Nevertheless, their performance remains commendable. For successfully fully segmented maize plants at the flowering and maturity stages, data acquisition primarily relies on measuring the distance between the canopy and stem point clouds; for maize plants at the tasseling stage, data are mainly obtained by measuring the distance between the stem point clouds.

3.3. Extraction of Phenotypic Parameters of Plant Height

This manuscript delineates four datasets, encompassing various developmental stages of maize throughout its life cycle: the tasseling stage, flowering period, maturity phase, and the entire growth cycle. Specifically, for the flowering and maturity phases of maize, this study has not only gathered manual height measurement data of maize plants from 40 randomly selected groups, both internally and externally, but it also encompasses data obtained through point cloud technology measurements of maize stems. These measurements extracted via point cloud technology have been compared and analyzed against traditional manual measurement results, with specific findings illustrated in Figure 9.
As depicted in Figure 10, the analysis comparing the derived plant height values with actual measurements reveals that during the tasseling stage, the mean absolute percentage error (MAPE) and the root mean square error (RMSE) stood at 1.71% and 1.21 cm, respectively. Moving to the flowering stage, these metrics improved to 0.57% for MAPE and 1.15 cm for RMSE. At the maturity stage, the figures slightly adjusted to an MAPE of 0.51% and an RMSE of 1.40 cm. Considering the entire growth cycle, the overall MAPE and RMSE were calculated at 0.77% and 1.27 cm, respectively.
Figure 10A shows that maize at the tassel stage had slightly more measurement errors compared to the other stages. This discrepancy can be attributed to the incomplete head growth, impacting the precision of stem segment segmentation and fitting in the early stages. Additionally, manual measurement errors were also observed to be more pronounced during this phase for similar reasons.
As shown in Figure 10B, the plant height measurement accuracy of maize at the flowering stage exceeded that of maize at the maturity stage, with an MAPE of about 0.5%. This improvement is linked to the more distinct and clearer organ differentiation observed at this stage. Despite challenges in single maize plant segmentation due to occlusion and other factors, obtaining complete stems was more feasible compared to the tasseling stage, facilitating better stem recognition and segmentation, and consequently, higher accuracy in height extraction.
The data presented in Figure 10C show that the extraction accuracy of the maize plant height values at maturity was almost the same compared to the maize at flowering, with an MAPE of about 0.5%. This similarity in accuracy between the two stages can be attributed to comparable levels of organ differentiation and segmentation challenges, notwithstanding the differences in plant height, thus resulting in a minimal disparity in the accuracy of the extracted values.
The extracted value of the maize stems was compared with the measured values across the entire growth cycle. As shown in Figure 10D, the MAPE and RMSE was 0.77% and 1.27 cm, respectively. From this result, the method using ground LiDAR to collect maize phenotypes for plant height measurement had a higher accuracy compared with the manual measurement results. The determination coefficient between the extracted value and the manually measured value of plant height was 0.99, which showed that there was good consistency between the extracted value and the measured value. The method of extracting the plant height information by ground LiDAR was feasible.

4. Discussion

The plant height serves as a vital indicator reflecting the growth condition of maize, and its anomalous rate of change often signals potential disease infections or nutritional deficiencies within the crop community [48]. The continuous monitoring of maize plant height is crucial for the early detection of abnormal growth, enabling researchers and farm managers to implement timely management interventions. The long-term monitoring of plant height aids in more accurately determining the growth stages of the plant community, optimizing irrigation, fertilization, and pest management, and contributes to more precise yield forecasts [49], thus facilitating earlier market strategy development.
In the field of phenotypic research in agriculture, plant height is an important trait for assessing the impact of genetic and environmental interactions. Precise measurements of plant height improve our comprehension of maize genetic responses to environmental changes. These measurements facilitate the identification of plants with superior traits. High-throughput phenotyping platforms use these data to speed up the creation of new maize varieties. Accurate measurement techniques for plant height increase precision and efficiency in crop management. These techniques also offer considerable support and convenience for agricultural research.
This study developed a multi-angle measurement method of corn plant height using solid-state LiDAR. This method shows significant improvements in precision and efficiency. It provides a valuable technological tool for agricultural management and research.
The data acquisition by LiDAR scanning had the advantages of high precision, fast speed, non-contact, and multi-information collection [26,50]. Moreover, the 3D point cloud data collected by solid-state LiDAR can simultaneously contain three types of information: the spatial coordinates, depth, and reflectivity of the target crops. Solid-state ground-based LiDAR, with its high resolution and multi-angle shooting technology, can capture more comprehensive point cloud data. This allows for a more precise depiction of the actual growth conditions of the crops. Therefore, it can not only be used to extract various phenotypic parameters of other types of crops but also its 3D data can be used to verify the accuracy of other plant models.
Compared to drone technology [51], solid-state LiDAR exhibits superior interference resistance. It can intricately capture information from the main stems and the ground from a lower perspective, effectively reducing errors in plant height assessments. Although traditional remote sensing techniques have some advantages in collecting data over large areas, although traditional remote sensing techniques have some advantages in collecting data over large areas, they are usually not as accurate as solid-state LiDAR in constructing high-precision three-dimensional plant models or making accurate plant height measurements.
Considering that manual measurements have the highest accuracy among the methods discussed previously, to enhance the validity of this study, the plant height data obtained from the maize by LiDAR were compared with the actual manual measurements. The results indicate that LiDAR measurements exhibit a high precision and consistency throughout the growth cycle, with a total MAPE of 0.77%, a total RMSE of 1.27 cm, and a coefficient of determination reaching 0.99. During the heading stage, the MAPE and RMSE were 1.71% and 1.21 cm, respectively; during the flowering stage, these values dropped to 0.57% and 1.15 cm; and during the maturity stage, they were 0.51% and 1.40 cm, respectively.
The purpose of this study was to use ground-based LiDAR to accurately capture the height of field maize plants. Because ground-based LiDAR has a high resolution and strong anti-interference capabilities, it can depict the precise structure features of crops. Compared with UAV-based remote sensing methods involving digital surface models (DSMs) to measure the maize plant height, ground LiDAR can obtain more comprehensive plant and ground data through multi-angle collection, and better solve the problem of segmentation between the stems and ground to ensure the accuracy of the plant height assessment [52].
According to the results of the field maize plant height information obtained by ground LiDAR, the R2 and MAPE increased by 98% and 93.6%. It showed that compared with the method of the high-definition digital reconstruction of maize point clouds to extract plant height information, the accuracy of the maize point clouds obtained in this study was greatly improved. In addition, in the measurement of crop heights, the cloud model is relatively complete and has certain advantages [53].
Furthermore, the results show that supervoxel clustering algorithms and Euclidean clustering algorithms exploit the continuity or consistency of regional attributes to aggregate point clouds and divide them into represented node data. Compared with methods such as density estimation and area search [22,54], these algorithms use smaller volume point clouds to accelerate and accurately complete the point cloud data segmentation of individual maize plants.
Furthermore, the analysis results unveil a significant issue: a pronounced mutual shading phenomenon exists among maize plants in the field during the flowering and maturity stages. In order to obtain a more complete point cloud model, this study set up multiple observation points to collect data from different angles on the same plant [39]. By means of registration, the complete point cloud model of the maize plants near the edge of the field could be obtained.
To resolve the challenge of measuring the crop height, the method of cylinder fitting was employed to extract the point clouds of the maize stem along with the phenotype information pertaining to the maize height. The findings revealed that the organs in the maize at the tasseling stage had not yet differentiated. Therefore, when extracting the stem using the cylinder fitting method, the resulting stem point clouds included portions of branches and leaves, and the extracted portion of the stem point clouds was slightly higher than the actual height of the maize. This not only affected the extraction of the stem but also compromised the accuracy of the height extraction. Other studies have primarily used the highest point of the plant as the indicator of the plant height [26], but this does not fully conform to the standard for measuring the height of the main stem of maize during its tasseling stage.
During the flowering and maturity phases, the morphology of maize plants is fully differentiated, with their shapes and boundary features becoming pronounced. When these plants are positioned on the periphery of a plant group, stem information can be relatively directly extracted from the point cloud data, which is crucial for the accurate determination of the plant height. However, when these plants are located within the interior of the cluster, the shading phenomenon significantly affects the integrity of the point cloud data. Due to mutual shading, the point cloud data for internal plants often lack completeness, posing a significant challenge for plant height measurements based on point cloud technology [55]. During the statistical value filtering process, some incomplete maize plant point clouds would be excluded, leading to an increased number of incomplete point cloud models. While multi-angle point cloud registration could somewhat ameliorate the shape of the point clouds, the integrity of these point clouds was inferior compared to that of the maize plants in the tasseling stage and those that were not significantly occluded.
However, in the extraction of the maize plant height, the bottom and ear point clouds were relatively well preserved since the heavily obscured portions predominantly occurred in the middle of the leafy maize. Segmentation methods based on continuous characteristics struggle to fully segment stems with missing data [28], which may impact the estimation of the plant height. Thus, despite the absence of intermediate point clouds and considerable deviation in the fitting position of the cylinder, the point clouds for the maize ear and bottom appeared relatively complete when the cylinder was fitted to the maize stem. The measurement of the maize plant height was primarily based on the top and bottom point clouds. Consequently, even if the integrity of the maize stem assembly was not high, its impact on the extracted value of the plant height was minimal.
By comparing the plant height data of maize at different growth stages obtained by solid-state LiDAR and traditional manual measurement methods, this study revealed that when maize was at the tasseling stage, the plant height measured by solid-state LiDAR had a large error compared to the actual measurement, with a mean absolute percentage error (MAPE) of 1.71%, which may be attributed to the fact that the head of the maize had not yet been fully formed at this stage. As the corn entered the flowering and maturity stages, the plant structure became more complete, and the measurement accuracy of the ground LiDAR was significantly improved, with the MAPE reduced to 0.57% and 0.51%, respectively. The measurement accuracy of the corn plant height throughout the growth cycle was excellent, with a total MAPE of 0.77% and a root mean square error (RMSE) of only 1.27 cm. This result validates the high accuracy and reliability of terrestrial LiDAR in accurately measuring maize plant height, especially in the later stages when the plant structure is more complex, and shows its vast potential for application in agricultural research. This study emphasizes the increasing accuracy and potential utility of terrestrial LiDAR technology in plant phenotyping.

5. Conclusions

An approach utilizing solid-state LiDAR was introduced to extract the plant phenotype of maize height across the entire growth cycle. The point clouds of a single plant were obtained by filtering, registering, and segmenting the obtained 3D point cloud information of many maize plants. The stem of a single maize point cloud was extracted and measured to obtain the plant height information. The results showed that the RMSE of the maize plant height information obtained by LiDAR was 0.00127 m, the MAPE was 0.77%, and the maximum R2 value was 0.99. This means that this method exhibits a good performance in plant height phenotype information acquisition. In addition, the maize plants showed higher differentiation at different stem stages. In the maturity stage, the MAPE of the plant height was 0.57%, better than 1.19% (1.71%), which was achieved by the tasseling maize, and 0.06% (0.57%), which was achieved by flowering-stage maize.
This study provides an economical and stable method for in-field corn phenotype analysis. To expand the application of this method, there is an ongoing exploration into integrating solid-state LiDAR with autonomous inspection robots to facilitate more comprehensive in situ data collection on corn plants. This approach not only enables the broader coverage of plant communities but also enhances the precision and efficiency of the data collection process through automation.
Additionally, this research also examines the combined application of unmanned aerial vehicles (UAVs) and solid-state LiDAR technology, aimed at synchronizing their operation with ground-based autonomous inspection robots to collectively perform data collection tasks on plant communities. By implementing the integrated automation of aerial and ground data processes, a significant enhancement in the data collection efficiency is anticipated, along with a substantial reduction in time and labor costs.
The advancements in this method will assist agricultural managers in more accurately determining the growth stages of corn plant communities, providing decision support for irrigation, fertilization, and pest management. Moreover, it will aid in more precise yield predictions and facilitate proactive adjustments to market strategies.

Author Contributions

Conceptualization, J.Z., S.C. and B.Z.; methodology, J.Z., X.Z. and S.C.; software, Y.Z.; validation, Y.Z.; writing—original draft, Y.Z. and H.H.; writing—review and editing, J.Z., Y.W. and H.H. All authors have read and agreed to the published version of the manuscript.

Funding

This work was supported by The Project of Collaborative Innovation Center of GDAAS (XTXM202201), Key-Area Research and Development Program of Guangdong Province (2023B0202090001), Guangzhou Science and Technology Plan Project (2023A04J0830), Academic Team Construction Project of Guangdong Academy of Agricultural Sciences (202130TD).

Data Availability Statement

The data presented in this study are available upon request from the corresponding author.

Conflicts of Interest

The authors declare no conflicts of interest.

References

  1. Zhu, X.; Xu, K.; Liu, Y.; Guo, R.; Chen, L. Assessing the vulnerability and risk of maize to drought in China based on the AquaCrop model. Agric. Syst. 2021, 189, 103040. [Google Scholar] [CrossRef]
  2. Lan, Y.; Thomson, S.J.; Huang, Y.; Hoffmann, W.C.; Zhang, H. Current status and future directions of precision aerial application for site-specific crop management in the USA. Comput. Electron. Agric. 2010, 74, 34–38. [Google Scholar] [CrossRef]
  3. Lan, Y.; Thomson, S.J.; Huang, Y.; Hoffmann, W.C.; Zhang, H. Producing more grain with lower environmental costs. Nature 2014, 514, 486–489. [Google Scholar]
  4. Yang, W.; Duan, L.; Chen, G.; Xiong, L.; Liu, Q. Plant phenomics and high-throughput phenotyping: Accelerating rice functional genomics using multidisciplinary technologies. Curr. Opin. Plant Biol. 2013, 16, 180–187. [Google Scholar] [CrossRef] [PubMed]
  5. Großkinsky, D.K.; Svensgaard, J.; Christensen, S.; Roitsch, T. Plant phenomics and the need for physiological phenotyping across scales to narrow the genotype-to-phenotype knowledge gap. J. Exp. Bot. 2015, 66, 5429–5440. [Google Scholar] [CrossRef]
  6. Hall, R.D.; D’Auria, J.C.; Ferreira, A.C.S.; Gibon, Y.; Kruszka, D.; Mishra, P.; Van de Zedde, R. High-throughput plant phenotyping: A role for metabolomics. Trends Plant Sci. 2022, 27, 549–563. [Google Scholar] [CrossRef] [PubMed]
  7. Liu, J.; Zhao, C.; Yang, G.; Yu, H.; Zhao, X.; Xu, B.; Niu, Q. Review of field-based phenotyping by unmanned aerial vehicle remote sensing platform. Trans. Chin. Soc. Agric. Eng. 2016, 32, 98–106. [Google Scholar]
  8. Li, W.; Niu, Z.; Huang, N.; Wang, C.; Gao, S.; Wu, C. Airborne LiDAR technique for estimating biomass components of maize: A case study in Zhangye City, Northwest China. Ecol. Indic. 2015, 57, 486–496. [Google Scholar] [CrossRef]
  9. Zhou, Z.; Zhang, C.; Lu, X.; Wang, L.; Hao, Z.; Li, M.; Zhang, D.; Yong, H.; Zhu, H.; Weng, J.; et al. Dissecting the genetic basis underlying combining ability of plant height related traits in maize. Front. Plant Sci. 2018, 9, 1117. [Google Scholar] [CrossRef]
  10. Qiu, Q.; Sun, N.; Bai, H.; Wang, N.; Fan, Z.; Wang, Y.; Meng, Z.; Li, B.; Cong, Y. Field-based high-throughput phenotyping for maize plant using 3D LiDAR point cloud generated with a “Phenomobile”. Front. Plant Sci. 2019, 10, 554. [Google Scholar] [CrossRef]
  11. Deery, D.; Jimenez-Berni, J.; Jones, H.; Sirault, X.; Furbank, R. Proximal remote sensing buggies and potential applications for field-based phenotyping. Agronomy 2014, 4, 349–379. [Google Scholar] [CrossRef]
  12. Rebetzke, G.J.; Jimenez-Berni, J.A.; Bovill, W.D.; Deery, D.M.; James, R.A. High-throughput phenotyping technologies allow accurate selection of stay-green. J. Exp. Bot. 2016, 67, 4919–4924. [Google Scholar] [CrossRef] [PubMed]
  13. Sharma, L.K.; Bu, H.; Franzen, D.W.; Denton, A. Use of corn height measured with an acoustic sensor improves yield estimation with ground based active optical sensors. Comput. Electron. Agric. 2016, 124, 254–262. [Google Scholar] [CrossRef]
  14. Shafiekhani, A.; Kadam, S.; Fritschi, F.B.; DeSouza, G.N. Vinobot and vinoculer: Two robotic platforms for high-throughput field phenotyping. Sensors 2017, 17, 214. [Google Scholar] [CrossRef] [PubMed]
  15. Frasson, R.P.D.M.; Krajewski, W.F. 3D Digital Model of Maize Canopy. In Proceedings of the 7th World Congress on Computers in Agriculture Conference Proceedings, Reno, Nevada, 22–24 June 2009; pp. 22–29. [Google Scholar]
  16. Chambelland, J.C.; Dassot, M.; Adam, B.; Donès, N.; Balandier, P.; Marquier, A.; Saudreau, M.; Sonohat, G.; Sinoquet, H. A double-digitising method for building 3D virtual trees with non-planar leaves: Application to the morphology and light-capture properties of young beech trees (Fagus sylvatica). Funct. Plant Biol. 2008, 35, 1059–1069. [Google Scholar] [CrossRef] [PubMed]
  17. Wang, L.; Zhao, Y.; Liu, S.; Li, Y.; Chen, S.; Lan, Y. Precision detection of dense plums in orchards using the improved YOLOv4 model. Front. Plant Sci. 2022, 13, 839269. [Google Scholar] [CrossRef] [PubMed]
  18. Omasa, K.; Hosoi, F.; Konishi, A. 3D LiDAR imaging for detecting and understanding plant responses and canopy structure. J. Exp. Bot. 2007, 58, 881–898. [Google Scholar] [CrossRef] [PubMed]
  19. Hosoi, F.; Nakabayashi, K.; Omasa, K. 3-D modeling of tomato canopies using a high-resolution portable scanning LiDAR for extracting structural information. Sensors 2011, 11, 2166–2174. [Google Scholar] [CrossRef] [PubMed]
  20. Niu, Q.; Feng, H.; Yang, G.; Li, C.; Yang, H.; Xu, B.; Zhao, Y. Monitoring plant height and leaf area index of maize breeding material based on UAV digital images. Trans. Chin. Soc. Agric. Eng. 2018, 34, 73–82. [Google Scholar]
  21. Hu, P.; Chapman, S.C.; Wang, X.; Potgieter, A.; Duan, T.; Jordan, D.; Guo, Y.; Zheng, B. Estimation of plant height using a high throughput phenotyping platform based on unmanned aerial vehicle and self-calibration: Example for sorghum breeding. Eur. J. Agron. 2018, 95, 24–32. [Google Scholar] [CrossRef]
  22. Miao, T.; Zhu, C.; Xu, T.; Yang, T.; Li, N.; Zhou, Y.; Deng, H. Stem-leaf segmentation and phenotypic trait extraction of maize shoots from 3D point cloud. arXiv 2020, arXiv:2009.03108. [Google Scholar]
  23. Qiu, R.; Zhang, M.; Wei, S.; Li, S.; Li, M.; Liu, G. Method for measurement of maize stem diameters based on RGB-D camera. Trans. Chin. Soc. Agric. Eng. 2017, 33, 170–176. [Google Scholar]
  24. Barabaschi, D.; Tondelli, A.; Desiderio, F.; Volante, A.; Vaccino, P.; Valè, G.; Cattivelli, L. Next generation breeding. Plant Sci. 2016, 242, 3–13. [Google Scholar] [CrossRef] [PubMed]
  25. Paulus, S.; Dupuis, J.; Mahlein, A.K.; Kuhlmann, H. Surface feature based classification of plant organs from 3D laserscanned point clouds for plant phenotypin. BMC Bioinform. 2013, 14, 1–12. [Google Scholar] [CrossRef] [PubMed]
  26. Li, Y.; Liu, J.; Zhang, B.; Wang, Y.; Yao, J.; Zhang, X.; Fan, B.; Li, X.; Hai, Y.; Fan, X. 3D reconstruction and phenotype measurement of maize seedlings based on multi-view image sequences. Front. Plant Sci. 2022, 13, 974339. [Google Scholar] [CrossRef] [PubMed]
  27. Gärtner, H.; Wagner, B.; Heinrich, I.; Denier, C. 3D-laser scanning: A new method t25o analyze coarse tree root systems. For. Snow Landsc. Res. 2009, 82, 95–106. [Google Scholar]
  28. Jin, S.; Su, Y.; Wu, F.; Pang, S.; Gao, S.; Hu, T.; Liu, J.; Guo, Q. Stem–leaf segmentation and phenotypic trait extraction of individual maize using terrestrial LiDAR data. IEEE Trans. Geosci. Remote Sens. 2018, 57, 1336–1346. [Google Scholar] [CrossRef]
  29. Liu, J.; Pattey, E.; Jégo, G. Assessment of vegetation indices for regional crop green LAI estimation from Landsat images over multiple growing seasons. Remote Sens. Environ. 2012, 123, 347–358. [Google Scholar] [CrossRef]
  30. Brazeal, R.G.; Wilkinson, B.E.; Hochmair, H.H. A rigorous observation model for the risley prism-based livox Mid-40 LiDAR sensor. Sensors 2021, 21, 4722. [Google Scholar] [CrossRef]
  31. Cui, M.; Jia, B.; Liu, H.; Kan, X.; Zhang, Y.; Zhou, R.; Li, Z.; Yang, L.; Deng, D.; Yin, Z. Genetic mapping of the leaf number above the primary ear and its relationship with plant height and flowering time in maize. Front. Plant Sci. 2017, 8, 1437. [Google Scholar] [CrossRef]
  32. Yu, Z.; Cao, Z.; Wu, X.; Bai, X.; Qin, Y.; Zhuo, W.; Xiao, Y.; Zhang, X.; Xue, H. Automatic image-based detection technology for two critical growth stages of maize: Emergence and three-leaf stage. Agric. For. Meteorol. 2013, 174, 65–84. [Google Scholar] [CrossRef]
  33. Zhang, K.X.; Chen, H.; Wu, H.; Zhao, X.Y.; Zhou, C.A. Point cloud registration method for maize plants based on conical surface fitting—ICP. Sci. Rep. 2022, 12, 6852. [Google Scholar] [CrossRef] [PubMed]
  34. Miknis, M.; Davies, R.; Plassmann, P.; Ware, A. Near real-time point cloud processing using the PCL. In Proceedings of the 2015 International Conference on Systems, Signals and Image Processing (IWSSIP), London, UK, 10–12 September 2015; pp. 153–156. [Google Scholar]
  35. Rusu, R.B.; Cousins, S. 3D is here: Point Cloud Library (PCL). In Proceedings of the IEEE International Conference on Robotics and Automation (ICRA), Shanghai, China, 9–13 May 2011. [Google Scholar]
  36. Carrilho, A.C.; Galo, M.; Santos, R.C. Statistical outlier detection method for airborne LiDAR data. Int. Arch. Photogramm. Remote Sens. Spat. Inf. Sci. 2018, 42, 87–92. [Google Scholar] [CrossRef]
  37. Balta, H.; Velagic, J.; Bosschaerts, W.; De Cubber, G.; Siciliano, B. Fast statistical outlier removal based method for large 3D point clouds of outdoor environments. IFAC-Pap. 2018, 51, 348–353. [Google Scholar] [CrossRef]
  38. Särkkä, S.; Svensson, L. Bayesian Filtering and Smoothing; Cambridge University Press: Cambridge, UK, 2023; Volume 17. [Google Scholar]
  39. Liu, X.; Ma, Q.; Wu, X.; Hu, T.; Liu, Z.; Liu, L.; Guo, Q.; Su, Y. A novel entropy-based method to quantify forest canopy structural complexity from multiplatform LiDAR point clouds. Remote Sens. Environ. 2022, 282, 113280. [Google Scholar] [CrossRef]
  40. Nurunnabi, A.; Sadahiro, Y.; Lindenbergh, R.; Belton, D. Robust cylinder fitting in laser scanning point cloud data. Measurement 2019, 138, 632–651. [Google Scholar] [CrossRef]
  41. Jin, Y.H.; Lee, W.H. Fast cylinder shape matching using random sample consensus in large scale point cloud. Appl. Sci. 2019, 9, 974. [Google Scholar] [CrossRef]
  42. Rampriya, R.S.; Suganya, R. Segmentation of 3D point cloud data based on SuperVoxel technique. Procedia Comput. Sci. 2020, 171, 427–435. [Google Scholar] [CrossRef]
  43. Papon, J.; Abramov, A.; Schoeler, M.; Worgotter, F. Voxel cloud connectivity segmentation-SuperVoxel for point clouds. In Proceedings of the IEEE Conference on Computer Vision and Pattern Recognition, Portland, OR, USA, 23-28 June 2013; pp. 2027–2034. [Google Scholar]
  44. Wen, L.; He, L.; Gao, Z. Research on 3D point cloud de-distortion algorithm and its application on Euclidean clustering. IEEE Access 2019, 7, 86041–86053. [Google Scholar] [CrossRef]
  45. Han, H.; Han, X.; Sun, F.; Huang, C. Point cloud simplification with preserved edge based on normal vector. Opt. -Int. J. Light Electron Opt. 2015, 126, 2157–2162. [Google Scholar] [CrossRef]
  46. Liakos, K.G.; Busato, P.; Moshou, D.; Pearson, S.; Bochtis, D. Machine learning in agriculture: A review. Sensors 2018, 18, 2674. [Google Scholar] [CrossRef] [PubMed]
  47. Peng, Y.; Lin, S.; Wu, H.; Cao, G. Point Cloud Registration Based on Fast Point Feature Histogram Descriptors for 3D Reconstruction of Trees. Remote Sens. 2023, 15, 3775. [Google Scholar] [CrossRef]
  48. Li, W.; Niu, Z.; Chen, H.; Li, D.; Wu, M.; Zhao, W. Remote estimation of canopy height and aboveground biomass of maize using high-resolution stereo images from a low-cost unmanned aerial vehicle system. Ecol. Indic. 2016, 67, 637–648. [Google Scholar] [CrossRef]
  49. Tilly, N.; Aasen, H.; Bareth, G. Fusion of plant height and vegetation indices for the estimation of barley biomass. Remote Sens. 2015, 7, 11449–11480. [Google Scholar] [CrossRef]
  50. Hu, X.; Gu, X.; Sun, Q.; Yang, Y.; Qu, X.; Yang, X.; Guo, R. Comparison of the performance of Multi-source 3D structural data in the application of monitoring maize lodging. Comput. Electron. Agric. 2023, 208, 107782. [Google Scholar] [CrossRef]
  51. Madec, S.; Baret, F.; de Solan, B.; Thomas, S.; Dutartre, D.; Jezequel, S.; Comar, A. High-throughput phenotyping of plant height: Comparing unmanned aerial vehicles and ground LiDAR estimates. J. Exp. Bot. 2017, 68, 5733–5747. [Google Scholar] [CrossRef] [PubMed]
  52. Xu, W.; Yang, W.; Wu, J.; Chen, P.; Lan, Y.; Zhang, L. Canopy laser interception compensation mechanism—UAV LiDAR precise monitoring method for cotton height. Agronomy 2023, 13, 2584. [Google Scholar] [CrossRef]
  53. Wang, H.; Zhang, W.; Yang, G.; Lei, L.; Han, S.; Xu, W.; Chen, R.; Zhang, C.; Yang, H. Maize ear height and ear–plant height ratio estimation with LiDAR data and vertical leaf area profile. Remote Sens. 2023, 15, 964. [Google Scholar] [CrossRef]
  54. Wu, H.; Zhang, X.; Shi, W.; Song, S.; Cardenas-Tristan, A.; Li, K. An accurate and robust region-growing algorithm for plane segmentation of TLS point clouds using a multiscale tensor voting method. IEEE J. Sel. Top. Appl. Earth Obs. Remote Sens. 2019, 12, 4160–4168. [Google Scholar] [CrossRef]
  55. Lei, L.; Li, Z.; Yang, G.; Yang, H. High-Throughput extraction of the distributions of leaf base and inclination angles of maize in the field. IEEE Trans. Geosci. Remote Sens. 2023, 61, 1–28. [Google Scholar] [CrossRef]
Figure 1. The location and field image of the study site. The two images on the left denote that the experimental site for this study is located at the South China Agricultural University Experimental Base in Zengcheng District, Guangzhou City, Guangdong Province, China (113°38′38′′ E, 23°14′34′′ N). The subfigure on the right shows a top view of the data collection test field, where the main part marked by the red box line is the corn planting area.
Agronomy 14 01069 g001
Figure 2. Schematic of LiDAR scanning method: (a) illustrates the point cloud effect of corn generated by a single-frame LiDAR scan; (b) depicts the point cloud detection range of a single-frame LiDAR scan; (c) shows the point cloud effect of corn synthesized from continuous multi-frame LiDAR scans; (d) presents the point cloud detection range of continuous multi-frame LiDAR scans.
Agronomy 14 01069 g002
Figure 3. (A) shows a maize plant point cloud data collection in a field using a Livox Mid-40 LiDAR. (B) displays date collection: point (a), point (b), and point (c) are the LiDAR’s placements, point (d) is the targeted maize area for collection, and point (e) represents the non-targeted maize zones. (C) displays working conditions: point (f) is the LiDAR, point (g) is the tripod, point (h) is the ground, point (i) is the LiDAR’s scanning range, point (j) is the laser-accessible maize zone, point (k) is the non-scannable maize area, and point (l) is the laser’s trajectory.
Agronomy 14 01069 g003
Figure 4. The measurement standard of different growth maize height by manual. (A) The standard for manually measuring the height of maize at the jointing stage. (B) The standard for manually measuring the height of maize during the flowering and grain filling stage and at maturity.
Agronomy 14 01069 g004
Figure 5. This is a technology roadmap for extracting multi-phenotypic maize plant height information using solid-state LiDAR. Several key terms are used in the diagram. ICP stands for Iterative Closest Point; MAPE refers to mean absolute percentage error; and RMSE represents the root mean square error. TSR and TLR denote the rate of the true stem and the rate of the true leaf, respectively. SPV and LPV correspond to the stem predictive values and leaf predictive values, respectively. Finally, ACC is used to measure the closeness between a given set of measurements (TS and TL) and their true values.
Agronomy 14 01069 g005
Figure 6. Schematic diagram of ICP registration process. (A) Source point cloud of a single maize plant to be aligned; (B) reference point cloud of single maize; (C) the result after registration between source point cloud and reference point cloud.
Agronomy 14 01069 g006
Figure 7. Point cloud diagram and viewpoint feature histogram (VFH) of maize plants before and after the filtering process. Fast Point Feature Histogram (FPFH) is a 3D point cloud feature descriptor algorithm that efficiently captures the spatial relationships of each point through local geometric histograms. It simplifies the computation of the traditional PFH, significantly increasing processing speed and reducing resource consumption. The robustness of FPFH makes it suitable for a variety of 3D vision tasks.
Agronomy 14 01069 g007
Figure 8. Confusion matrix for stem and leaf segmentation results based on point clouds. (A) Confusion matrix of stem and leaf segmentation results based on filtered point cloud. (B) Confusion matrix of stem and leaf segmentation results based on origin point cloud.
Agronomy 14 01069 g008
Figure 9. Here are some visual results of maize stem recognition and segmentation: (A,B) display the stem segmentation effects of incomplete point cloud models of maize at the maturity stage, as Example 1 and Example 2, respectively; (C) shows the segmentation effect of a complete point cloud model of maize at the maturity stage; (DF) each present the segmentation effects of complete point cloud models of maize at the tasseling stage, as Example 1, Example 2, and Example 3, respectively.
Agronomy 14 01069 g009
Figure 10. Comparison of the measured value and extracted value of maize height in each period. MAPE and RMSE in the figure with reference to Equations (17) and (18).
Agronomy 14 01069 g010
Table 1. Main parameters of Livox-mid 40 LiDAR.
ParametersValues
Laser Wavelength905 nm
FOV38.4° Circular
Range Precision (1σ@20 m)2 cm
Angular Accuracy<0.1°
Point Rate100,000 points/s
WeightApprox. 710 g
Size88 × 69 × 76 mm
Table 2. Comparison table of stem and leaf identification results based on point cloud before and after filtering.
Stem
Recall Rate
Leaf
Recall Rate
Precision of StemPrecision of LeafAccuracySegmentation Successful Rate
Before88.89%84.21%84.21%88.89%86.55%64.00%
After100%91.30%91.30%100%95.65%84.00%
Disclaimer/Publisher’s Note: The statements, opinions and data contained in all publications are solely those of the individual author(s) and contributor(s) and not of MDPI and/or the editor(s). MDPI and/or the editor(s) disclaim responsibility for any injury to people or property resulting from any ideas, methods, instructions or products referred to in the content.

