

The Effects of Tillage and the Combined Application of Organic and Inorganic Fertilizers on the Antioxidant Enzyme Activity and Yield of Maize Leaves
Abstract
:1. Introduction
2. Materials and Methods
2.1. Overview of the Test Site
2.2. Experimental Materials
2.3. Experimental Design
2.4. Determined Items and Methods
2.4.1. Project
2.4.2. Reference Method
2.4.3. GDH Determination Method
2.4.4. GSH Determination Method
2.4.5. GR Determination Method
2.4.6. CAT Determination Method
2.4.7. APX Determination Method
2.5. Yield
2.6. Data Processing and Analysis
3. Results
3.1. Effect of Combined Fertilizer Application on Antioxidant Enzyme Activity in Maize Leaves Using Different Tillage Modes
3.1.1. CAT Activity
3.1.2. GSH Activity
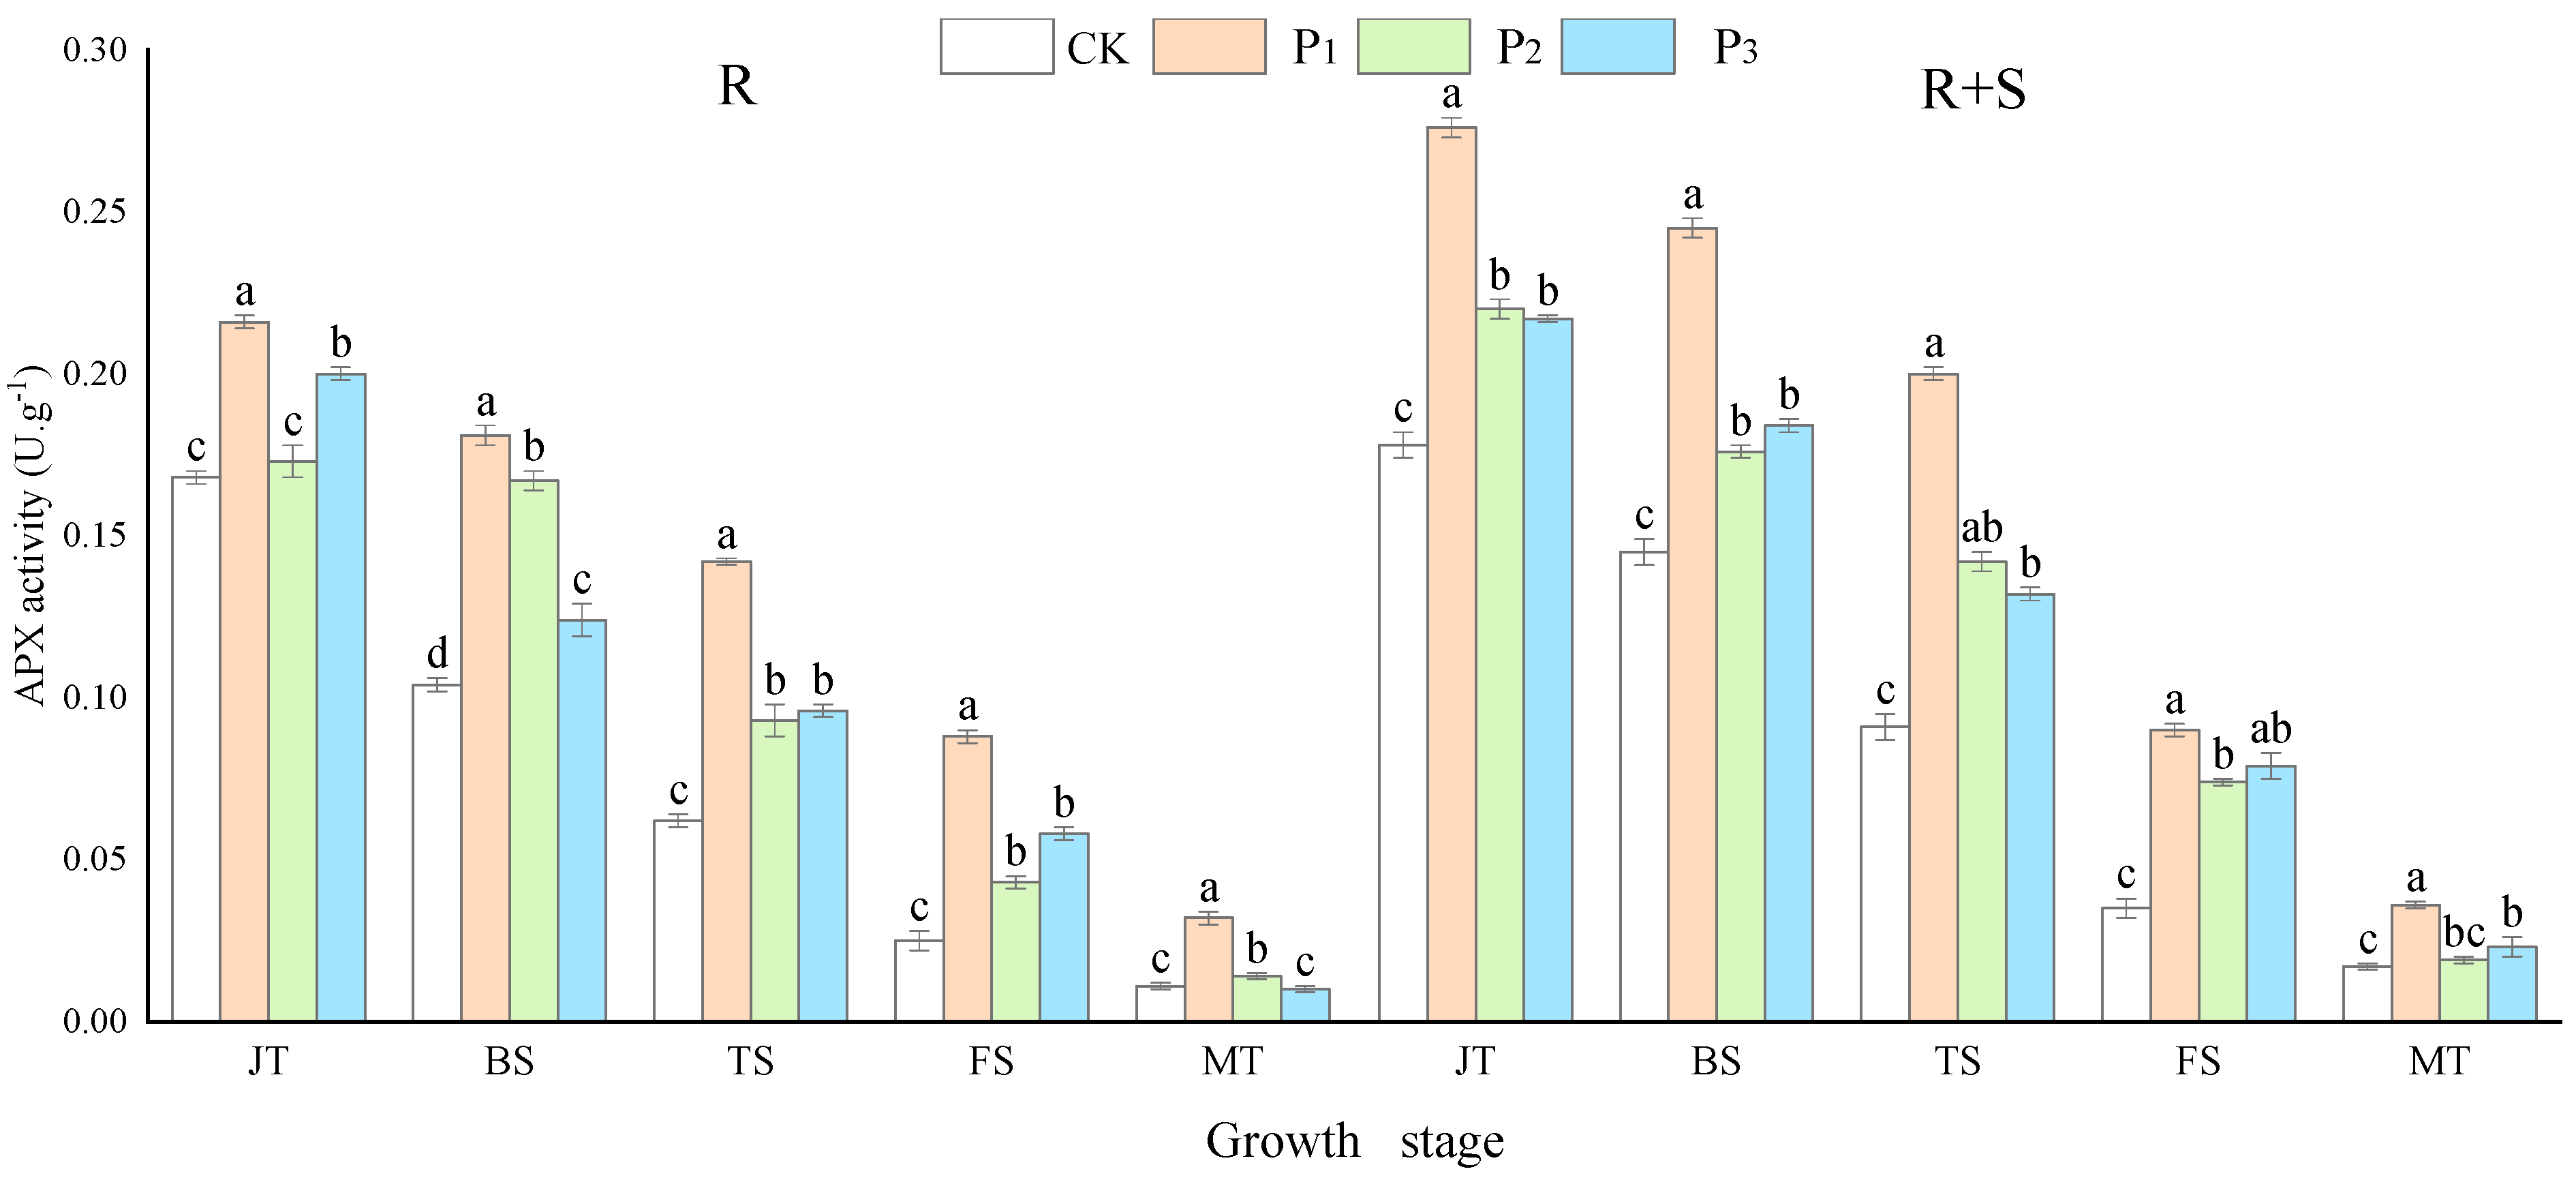
3.1.3. APX Activity
3.1.4. GDH Activity
3.1.5. GR Activity
3.2. Influence of Output and Production Components
3.3. Correlation Analysis
4. Discussion
4.1. Effects of the Combined Application of Organic and Inorganic Fertilizers on Maize Yield Using Different Tillage Modes
4.2. Effects of the Combined Application of Organic and Inorganic Fertilizers on Antioxidant Enzymes in Maize Leaves Using Different Tillage Modes
5. Conclusions
Author Contributions
Funding
Data Availability Statement
Acknowledgments
Conflicts of Interest
References
- Li, G.; Liu, P.; Zhao, B.; Dong, S.; Liu, P.; Zhang, J.; Tian, C.; He, Z. Effects of controlled-release urea under different water conditions on yield and leaf senescence characteristics of summer maize. Chin. J. Appl. Ecol. 2017, 28, 571–580. [Google Scholar]
- Tollenaar, M.; Lee, E.A. Yield potential, yield stability and stress to lerance in maize. Field Crops Res. 2002, 75, 161–169. [Google Scholar] [CrossRef]
- Tollenaar, M.; Lee, E.A. Dissection of physiological processes underlying grain yield in maize by examining genetic improvement and heterosis. Maydica 2006, 51, 399–408. [Google Scholar]
- Yang, F.; Liao, D.; Wu, X.; Gao, R.; Fan, Y.; Raza, M.A.; Wang, X.; Yong, T.; Liu, W.; Liu, J.; et al. Effect of aboveground and belowground interactions on the intercrop yields in maize-soybean relay intercropping systems. Field Crops Res. 2017, 203, 16–23. [Google Scholar] [CrossRef]
- Li, Y.; Ma, L.; Wu, P.; Zhao, X.; Chen, X.; Gao, X. Impacts of interspecific interactions on crop growth and yield in wheat (Triticum aestivum L.)/maize (Zea mays L.) strip intercropping under different water and nitrogen levels. Agronomy 2022, 12, 951. [Google Scholar] [CrossRef]
- Zhao, Y.; Liu, W.; Cheng, S.; Zhou, Y.; Zhou, J.; Wang, X.; Zhang, M.; Wang, Q.; Li, C. Effects of subsoiling (tillage) method on tillage layer characteristics, crop yield and water use efficiency of black soil with sand ginger. Sci. Agric. Sin. 2018, 51, 2489–2503. [Google Scholar]
- Song, Z.; Li, X.; Li, J.; Lin, Z.; Zhao, B. Effects of long-term application of organic fertilizer and chemical fertilizer on soil active organic nitrogen fraction and enzyme activity. J. Plant Nutr. Fertil. 2014, 20, 525–533. [Google Scholar]
- Liu, G.; Xiao, H.; Li, Y. Effects of long-term fertilization on growth, development and photosynthetic characteristics of summer maize in fluvial soil. J. Plant Nutr. Fertil. 2010, 16, 1094–1099. [Google Scholar]
- Liu, G. Effects of Long-Term Fertilization on Photosynthetic and Protective Enzyme Activities of Wheat and Jade Double Cropping Crops. Master’s Thesis, Chinese Academy of Agricultural Sciences, Beijing, China, 2011. [Google Scholar]
- Lin, Z.; Zhao, B.; Yuan, L. HWATBS.Effect of long-term positioning fertilization on soil nutrients and crop yield. Chin. J. Agric. Sci. 2009, 42, 2809–2819. [Google Scholar]
- Yadav, R.L.; Dwivedi, B.S.; Prasad, K.; Tomar, O.K.; Shurpali, N.J.; Pandey, P.S. Yield trends, and changes in soil organic-C and available NPK in a long-term rice–wheat system under integrated use of manures and fertilisers. Field Crops Res. 2000, 68, 219–246. [Google Scholar] [CrossRef]
- Rudrappa, L.; Purakayastha, T.J.; Singh, D.; Bhadraray, S. Long-term manuring and fertilization effects on soil organic carbon pools in a Typic Haplustept of semi-arid sub-tropical India. Soil Tillage Res. 2006, 88, 180–192. [Google Scholar] [CrossRef]
- Ghosh, P.K.; Ramesh, P.; Bandyopadhyay, K.K.; Tripathi, A.K.; Hati, K.M.; Misra, A.K.; Acharya, C.L. Comparative effectiveness of cattle manure, poultry manure, phosphor compo stand fertilizer-NPK on three cropping systems invert soils of semi-aridtropics. I.Crop yield sand system per for mance. Bioresour. Technol. 2004, 95, 77–83. [Google Scholar] [CrossRef]
- Li, N.; Zhao, B. Long-term fertilization effects on processing quality of wheat grain in the North China Plain. Field Crops Res. 2015, 174, 55–60. [Google Scholar]
- Wei, W.; Yan, Y.; Cao, J.; Christie, P.; Zhang, F.; Fan, M. Effects of combined application of organic amendments and fertilizers on crop yield and soil organic matter: An integrated analysis of long-term experiments. Agric. Ecosyst. Environ. 2016, 225, 86–92. [Google Scholar] [CrossRef]
- Abbasi, M.K.; Tahir, M.M. Economizing nitrogen fertilizer in wheat through combinations with organic manures in Kashmir, Pakistan. Agron. J. 2012, 104, 169–177. [Google Scholar] [CrossRef]
- Cai, Z.; Sun, N.; Wang, B.; Xu, M.; Huang, J.; Zhang, H. Effects of long-term fertilization on pH, crop yield and nutrient uptake of nitrogen, phosphorus and potassium in red soil. J. Plant Nutr. Fertil. 2011, 17, 71–78. [Google Scholar]
- Yu, L.; Qiu, J.; Zhao, L.; Liu, S.; Zhang, S.; Yang, H.; Li, W.; Zhang, L.; Cao, T. Effect of nitrogen on growth and physiological characteristics of maize. Jilin Agric. Sci. 2011, 36, 36–39. [Google Scholar]
- Wang, Q.; Zhang, X.; Luo, J.; Huang, Q.; Shen, Q.; Yang, X. Effects of different organic-inorganic compound fertilizers on wheat yield, nitrogen efficiency and soil microbial diversity. J. Plant Nutr. Fertil. 2009, 15, 1003–1009. [Google Scholar]
- Yang, Y.; Wu, J.; Zhang, J.; Pan, X.; Wang, Y.; He, F. Effects of tillage practices on soil water infiltration, organic carbon content and soil structure. Chin. J. Eco-Agric. 2017, 25, 258–266. [Google Scholar]
- Kong, X.; Han, C.; Zeng, S.; Wu, Q.; Liu, L. Effects of different tillage practices on soil physiognomy and maize yield. J. Maize Sci. 2014, 22, 108–113. [Google Scholar]
- Wang, L.; Fan, T.; Li, S. Effects of continuous cropping with plant row spacing on soil moisture and yield of spring maize mulched in loess plateau. J. Soil Water Conserv. 2019, 33, 79–86, 92. [Google Scholar]
- Turner, N.C.; Li, F.M.; Xiong, Y.C.; Siddique, K.H. Agriculturaleco system manage men tin dry areas: Challenges and solutions. Plant Soil 2011, 347, 1–6. [Google Scholar] [CrossRef]
- Shang, J.; Li, J. Effect of conservation tillage on water storage and moisture conservation and yield increase in spring maize field in Weibei arid plateau. Chin. J. Agric. Sci. 2010, 43, 2668–2678. [Google Scholar]
- Li, R.; Wang, M.; Jia, Z. Effects of different furrow and ridge mulching patterns on soil temperature, moisture and yield of spring maize in the Weibei arid plateau. Trans. CSAE 2012, 28, 106–113. [Google Scholar]
- Fang, R.; Tong, Y.; Zhao, E. Study on the effect of water and fertilizer on yield increase of different conservation tillage methods in the Weibei dryland. Agric. Res. Arid. Areas 2003, 21, 54–57. [Google Scholar]
- Iwaniuk, P.; Kaczyński, P.; Pietkun, M.; Łozowicka, B. Evaluation of titanium and silicon role in mitigation of fungicides toxicity in wheat expressed at the level of biochemical and antioxidant profile. Chemosphere 2022, 308, 136284. [Google Scholar] [CrossRef]
- Hasanuzzaman, M.; Parvin, K.; Bardhan, K.; Nahar, K.; Anee, T.I.; Masud, A.A.C.; Fotopoulos, V. Biostimulants for the regulation of reactive oxygen species metabolism in plants under abiotic stress. Cells 2021, 10, 2537. [Google Scholar] [CrossRef]
- Wang, W.; Qiang, X.; Liu, H.; Sun, J.; Ma, X.; Cui, Y. Effect of pre-wheat subsoiling on soil physical properties and growth characteristics of summer maize. J. Soil Water Conserv. 2017, 31, 229–236. [Google Scholar]
- Wang, J.; Wang, X.; Xiong, S.; Ma, X.; Ding, S.; Guo, J.; Wu, K. Effects of Tillage Methods on Nitrogen Metabolism and Nitrogen Use Efficiency of Wheat in Sand Ginger Black Soil. J. Triticeae Crops 2014, 34, 1111–1117. [Google Scholar]
- Wang, X.; Hou, H.; Zhou, B.; Sun, X.; Ma, W.; Zhao, M. Moderating effect of strip subsoiling on the spatial distribution of roots in different densities of jade rice population. Acta Agron. Sin. 2014, 40, 213. [Google Scholar] [CrossRef]
- Cao, C.; Zhong, Y.; Song, H.; Dong, Z.; Zhu, J.; Cheng, X.; Che, Z. Effect of tillage method on antioxidant enzymes and yield of wheat. J. Anhui Agric. Univ. 2019, 46, 883–887. [Google Scholar]
- Meng, L.; Zhang, X.; Jiang, X.; Wang, Q.; Huang, Q.; Xu, Y.; Yang, X.; Shen, Q. Effect of Substitution of Nitrogen by Organic Fertilizer on Rice Yield and Replacement Rate. Sci. Agric. Sin. 2009, 42, 532–542. [Google Scholar]
- Gao, H.; Li, H.; Wang, X. Experimental study on subsoiling in dryland. Agric. Res. Arid. Areas 1995, 13, 126–133. [Google Scholar]
- Li, H.; Chen, J.; Li, W. Research on subsoiling technology under conservation tillage conditions. Trans. CSAM 2000, 31, 42–45. [Google Scholar]
- Wang, Y.; Yang, J.; Yuan, C.; Liu, J.; Li, D.; Dong, S. Leaf senescence and antioxidant enzyme characteristics in different parts of ultra-high-yielding summer maize at flowering stage. Acta Agron. Sin. 2013, 39, 2183–2191. [Google Scholar] [CrossRef]
- Shan, L.; Xu, B. On the drought resistance of sorghum and its position in agriculture in arid areas. China Agric. Sci. 2009, 42, 2342–2348. [Google Scholar]
- Huang, R.; Sun, L.; Xiao, M.; Xu, W.; Zhou, Y. Physiological and biochemical response of B35 sorghum to drought at grain filling stage. Acta Agron. Sin. 2009, 35, 560–565. [Google Scholar] [CrossRef]
- Zhan, X.; Han, X.; Yang, J.; Liu, X.; Ma, L. Effects of different nitrogen, phosphorus and potassium fertilizer dosages on dynamic changes of dry matter accumulation in maize source and reservoir. Chin. J. Soil Sci. 2007, 3, 495–499. [Google Scholar]
- Zhou, B.; Sun, X.; Ding, Z.; Ma, W.; Zhao, M. Effects of soil tillage and fertilization on dry matter accumulation and yield of summer maize. Sci. Agric. Sin. 2017, 50, 2129–2140. [Google Scholar]
- Shen, X. Effects of Tillage Practices on Soil Organic Carbon, Microbial and Nematode Communities. Master’s Thesis, Chinese Academy of Agricultural Sciences, Beijing, China, 2021. [Google Scholar] [CrossRef]
- Jin, Y.; Xu, J.; Cai, J.; Ye, Z. Effects of chemical fertilizer reduction and organic fertilizer application on rice yield and soil nutrients. Bull. Agric. Sci. Technol. 2024, 01, 74–78. [Google Scholar]
- Wang, X.; Jia, Z.; Liang, L.; Han, Q.; Yang, B.; Ding, R.; Cui, R.; Wei, T. Effects of organic fertilizer application on soil moisture and maize economic benefits in dryland. Trans. CSAE 2012, 28, 144–149. [Google Scholar]
- Li, F.; Yu, J.; Nong, M. Partial root-zone irrigation enhanced soil enzyme activities and water use of maize under different ratios of inorganic to organic nitrogen fertilizers. Agric Water Manag. 2010, 97, 231–239. [Google Scholar] [CrossRef]
- Mohanty, M.; Bandyopadhyay, K.K.; Painuli, D.K.; Ghosh, P.K.; Misra, A.K.; Hati, K.M. Water trans mission characteristics of a Vertisol and water use efficiency of rainfed soybean (Glycine max (L.) Merr.) under sub soiling and manuring. Soil Tillage Res. 2007, 93, 420–428. [Google Scholar] [CrossRef]
- Wang, X.; Jia, Z.; Liang, L.; Zhao, E. Effects of organic fertilization in dryland on maize yield and water use efficiency. Northwest J. Agric. Sci. 2009, 18, 93–97. [Google Scholar]
- Gu, J.; Li, S.; Gao, H.; Li, M.; Qin, Q.; Cheng, K. Effects of organic and inorganic fertilizers on water use efficiency of dryland crops. Agric. Res. Arid. Areas 2004, 22, 142–145. [Google Scholar]
- Fan, T.; Stewart, B.A.; Yong, W. Long-term fertilization effects on grain yield, water-use efficiency and soil fertility in the dry land of Loess Plateau in China. Agric. Ecosyst. Environ. 2005, 106, 313–329. [Google Scholar] [CrossRef]
- Jin, Z. Effects of Organic Fertilizer Application under Different Nitrogen Fertilizer Rates on Winter Wheat Yield and Water and Nitrogen Use Efficiency in Weibei Plateau. Master’s Thesis, Northwest A&F University, Xianyang, China, 2014. [Google Scholar]
- Su, Q.; Jia, Z.; Han, Q.; Li, Y.; Wang, J.; Yang, B. Effects of organic fertilization on soil moisture and crop productivity in arid areas of southern Ningnan. J. Plant Nutr. Fertil. 2009, 15, 1466–1469. [Google Scholar]
- Zhu, C.; Meng, W.; Shi, K.; Niu, R.; Jiang, G.; Shen, F.; Liu, F.; Liu, S. Characteristics of soil nutrient and enzyme activities in different growth stages of wheat under different rotation tillage patterns. Sci. Agric. Sin. 2022, 55, 4237–4251. [Google Scholar]
- Wu, J.; Huang, M.; Li, Y.; Yao, Y.; Zhang, C. Effects of tillage practices on grain quality traits of winter wheat in arid areas. J. Triticeae Crops 2012, 32, 454–459. [Google Scholar]
- Long, Q.; Dong, S.; Zhu, C.; Liu, F.; Jiang, G.; Shen, F.; Liu, S. Effects of different tillage patterns on nutrients and crop yield in fluvial soil under wheat-maize rotation. J. Soil Water Conserv. 2019, 33, 167–174, 298. [Google Scholar]
- Cao, B.; Zhao, J.; Yu, S.; Feng, Y.; Wang, Q.; Lin, W.; Ren, A.; Sun, M.; Gao, Z. Effects of fallow rotation on the quality and yield of dryland wheat populations. Shanxi Agric. Sci. 2020, 48, 560–565. [Google Scholar]
- Mittler, R. ROS are good. Trends Plant Sci. 2017, 22, 11–19. [Google Scholar] [CrossRef]
- Babaei, K.; Seyed Sharifi, R.; Pirzad, A.; Khalilzadeh, R. Effects of bio fertilizer and nano Zn-Fe oxide on physiological traits, antioxi dant enzymes activity and yield of wheat (Triticum aestivum L.) under salinity stress. J. Plant Interact. 2017, 12, 381–389. [Google Scholar] [CrossRef]
- Zhang, L.B.; Feng, M.G. Antioxidant enzymes and their contributions to biological control potential of fungal insect pathogens. Appl. Microbiol. Biotechnol. 2018, 102, 4995–5004. [Google Scholar] [CrossRef]
- Hu, T.; Yuan, L.; Wang, J.; Kang, S.; Li, F. Antioxidation responses of maize roots and leaves to partial root-zone irrigation. Agric. Water Manag. 2010, 98, 164–171. [Google Scholar] [CrossRef]
- Fridovich, I. Superoxide dismutases. Annu. Rev. Biochem. 1975, 44, 147–159. [Google Scholar] [CrossRef]
- Jiao, Y. Effect of nitrogen fertilizer application rate on the growth of Quercus liaotungensis seedlings and the activities of enzymes related to nitrogen metabolism. Shanxi For. Sci. Technol. 2023, 52, 9–12. [Google Scholar]
- Lü, Y.; Jin, Y.; Fu, S.; Qi, C. Physiological differences in flood tolerance of different flood-tolerant rapeseed varieties. Chin. J. Plant Physiol. 2013, 49, 959–967. [Google Scholar]
- Sun, X.; Liu, Q.; Yuan, Y.; Zhang, Y.; Huo, J.; Qin, D.; Jiang, T. Changes in ascorbic acid content and related enzyme activities during fruit growth and development of black currant. Chin. J. Agric. Sci. 2019, 52, 98–110. [Google Scholar]
- Shao, G.-Q.; Li, Z.-J.; Ning, T.-Y.; Jiang, B.-J.; Jiao, N.-Y. Effects of irrigation and urea types on ear leaf senescence after anthesis, yield and economic benefit of maize. Sci. Agric. Sin. 2009, 42, 3459–3466, (In Chinese with English Abstract). [Google Scholar]
- Islam, M.R.; Hu, Y.; Mao, S.; Jia, P.; Enejid, A.E.; Xue, X. Effects of water-saving superabsorbent polymer on antioxidant enzyme activities and lipid peroxidation in corn (Zea mays L.) under drought stress. J. Sci. Food Agric. 2011, 91, 813–819. [Google Scholar] [CrossRef] [PubMed]


| Farming Methods | Fertilizer Treatment | Inorganic Fertilizers | Organic Fertilizer |
|---|---|---|---|
| R | CK | Urea 300 kg hm−2, Pd 600 kg hm−2 | — |
| P1 | Urea 150 kg hm−2, Pd 300 kg hm−2 | 3000 kg hm−2 | |
| P2 | Urea 150 kg hm−2, Pd 300 kg hm−2 | 6000 kg hm−2 | |
| P3 | Urea 150 kg hm−2, Pd 300 kg hm−2 | 9000 kg hm−2 | |
| R + S | CK | Urea 300 kg hm−2, Pd 600 kg hm−2 | — |
| P1 | Urea 150 kg hm−2, Pd 300 kg hm−2 | 3000 kg hm−2 | |
| P2 | Urea 150 kg hm−2, Pd 300 kg hm−2 | 6000 kg hm−2 | |
| P3 | Urea 150 kg hm−2, Pd 300 kg hm−2 | 9000 kg hm−2 |
| Year | Tillage Method | Treatment | Bare Top Length (cm) | Ear Length (cm) | Ear Grain Number | 100-Grain Weight (g) | Yield (kg hm−2) |
|---|---|---|---|---|---|---|---|
| 2022 | R | CK | 2.20 ± 0.23 a | 18.47 ± 0.61 c | 616.64 ± 10.59 bc | 45.51 ± 1.28 c | 11,726.43 ± 140.46 d |
| P1 | 0.52 ± 0.18 c | 21.05 ± 0.41 a | 660.17 ± 11.77 a | 51.72 ± 1.49 a | 13,499.80 ± 123.92 a | ||
| P2 | 1.09 ± 0.24 b | 20.68 ± 0.48 a | 630.61 ± 12.30 bc | 52.45 ± 0.35 a | 12,686.24 ± 194.48 b | ||
| P3 | 0.83 ± 0.06 c | 19.43 ± 0.51 b | 642.19 ± 15.48 ab | 49.36 ± 0.60 b | 12,453.76 ± 125.09 c | ||
| R + S | CK | 1.67 ± 0.11 a | 17.97 ± 0.53 c | 629.70 ± 9.02 c | 40.35 ± 1.03 c | 12,046.75 ± 205.50 d | |
| P1 | 0.56 ± 0.02 c | 25.65 ± 1.02 a | 673.43 ± 11.12 a | 51.19 ± 1.76 a | 13,898.44 ± 113.57 a | ||
| P2 | 0.93 ± 0.03 b | 22.44 ± 0.64 b | 650.31 ± 10.95 b | 45.83 ± 1.66 b | 12,979.22 ± 166.41 b | ||
| P3 | 0.72 ± 0.20 b | 19.63 ± 0.44 b | 655.32 ± 13.53 b | 45.45 ± 4.62 a | 12,800.95 ± 122.29 c | ||
| 2023 | R | CK | 2.24 ± 0.25 a | 18.85 ± 0.76 a | 583.66 ± 12.46 b | 30.78 ± 1.50 d | 11,319.90 ± 208.12 d |
| P1 | 0.73 ± 0.30 d | 19.36 ± 1.08 a | 608.55 ± 12.35 a | 40.47 ± 0.87 a | 13,161.75 ± 134.34 a | ||
| P2 | 1.29 ± 0.15 c | 18.70 ± 0.83 a | 600.23 ± 9.71 ab | 37.72 ± 1.37 b | 12,456.75 ± 244.12 b | ||
| P3 | 1.72 ± 0.36 b | 18.42 ± 0.39 a | 586.84 ± 11.29 ab | 33.12 ± 0.71 c | 12,227.55 ± 187.22 c | ||
| R + S | CK | 1.71 ± 0.38 a | 18.78 ± 0.46 b | 584.78 ± 10.78 b | 37.35 ± 0.05 d | 11,791.90 ± 192.87 d | |
| P1 | 0.56 ± 0.34 c | 24.26 ± 0.65 a | 609.84 ± 12.08 a | 49.83 ± 1.47 a | 13,436.70 ± 207.97 a | ||
| P2 | 0.90 ± 0.09 b | 19.21 ± 0.32 b | 587.58 ± 11.71 b | 42.45 ± 0.54 b | 12,716.30 ± 200.91 b | ||
| P3 | 0.83 ± 0.15 b | 19.59 ± 0.41 b | 600.61 ± 16.54 ab | 40.29 ± 0.59 c | 12,536.34 ± 167.96 c |
Disclaimer/Publisher’s Note: The statements, opinions and data contained in all publications are solely those of the individual author(s) and contributor(s) and not of MDPI and/or the editor(s). MDPI and/or the editor(s) disclaim responsibility for any injury to people or property resulting from any ideas, methods, instructions or products referred to in the content. |
© 2024 by the authors. Licensee MDPI, Basel, Switzerland. This article is an open access article distributed under the terms and conditions of the Creative Commons Attribution (CC BY) license (https://creativecommons.org/licenses/by/4.0/).
Share and Cite
Xie, G.; Liang, M.; Chen, P.; Zhang, C.; Fan, M.; Wang, C.; Zhao, L. The Effects of Tillage and the Combined Application of Organic and Inorganic Fertilizers on the Antioxidant Enzyme Activity and Yield of Maize Leaves. Agronomy 2024, 14, 968. https://doi.org/10.3390/agronomy14050968
Xie G, Liang M, Chen P, Zhang C, Fan M, Wang C, Zhao L. The Effects of Tillage and the Combined Application of Organic and Inorganic Fertilizers on the Antioxidant Enzyme Activity and Yield of Maize Leaves. Agronomy. 2024; 14(5):968. https://doi.org/10.3390/agronomy14050968
Chicago/Turabian StyleXie, Guangming, Min Liang, Pei Chen, Chang Zhang, Mingyuan Fan, Chuangyun Wang, and Li Zhao. 2024. "The Effects of Tillage and the Combined Application of Organic and Inorganic Fertilizers on the Antioxidant Enzyme Activity and Yield of Maize Leaves" Agronomy 14, no. 5: 968. https://doi.org/10.3390/agronomy14050968