Article

A Proteomic Approach Identified TFEB as a Key Player in the Protective Action of Novel CB2R Bitopic Ligand FD22a against the Deleterious Effects Induced by β-Amyloid in Glial Cells

1
Department of Pathology, University of Pisa, 56100 Pisa, Italy
2
Department of Translational Research and New Technologies in Medicine and Surgery, University of Pisa, 56126 Pisa, Italy
3
Department of Pharmaceutical Sciences, University of Milan, 20133 Milano, Italy
4
Department of Pharmacy, University of Pisa, 56126 Pisa, Italy
5
Department of Medical, Oral and Biotechnological Sciences, University G. D’Annunzio of Chieti-Pescara, 66100 Chieti, Italy
6
Interuniversitary Consortium for Engineering and Medicine (COIIM), 86100 Campobasso, Italy
7
Department of Clinical and Experimental Medicine, University of Pisa, 56126 Pisa, Italy
8
School of Pharmacy, University of Camerino, 62032 Camerino, Italy
*
Authors to whom correspondence should be addressed.
These authors contributed equally to this work.
Cells 2024, 13(10), 875; https://doi.org/10.3390/cells13100875
Submission received: 13 March 2024 / Revised: 11 May 2024 / Accepted: 16 May 2024 / Published: 19 May 2024

Abstract

:
Neurodegenerative diseases (NDDs) are progressive multifactorial disorders of the nervous system sharing common pathogenic features, including intracellular misfolded protein aggregation, mitochondrial deficit, and inflammation. Taking into consideration the multifaceted nature of NDDs, development of multitarget-directed ligands (MTDLs) has evolved as an attractive therapeutic strategy. Compounds that target the cannabinoid receptor type II (CB2R) are rapidly emerging as novel effective MTDLs against common NDDs, such as Alzheimer’s disease (AD). We recently developed the first CB2R bitopic/dualsteric ligand, namely FD22a, which revealed the ability to induce neuroprotection with fewer side effects. To explore the potential of FD22a as a multitarget drug for the treatment of NDDs, we investigated here its ability to prevent the toxic effect of β-amyloid (Aβ25–35 peptide) on human cellular models of neurodegeneration, such as microglia (HMC3) and glioblastoma (U87-MG) cell lines. Our results displayed that FD22a efficiently prevented Aβ25–35 cytotoxic and proinflammatory effects in both cell lines and counteracted β-amyloid-induced depression of autophagy in U87-MG cells. Notably, a quantitative proteomic analysis of U87-MG cells revealed that FD22a was able to potently stimulate the autophagy–lysosomal pathway (ALP) by activating its master transcriptional regulator TFEB, ultimately increasing the potential of this novel CB2R bitopic/dualsteric ligand as a multitarget drug for the treatment of NDDs.

1. Introduction

The transcription factor EB (TFEB) is a central regulator of the autophagy–lysosomal pathway (ALP) [1,2], which is a major mechanism for degrading intracellular macromolecules, including long-lived proteins, aggregated misfolded proteins, and abnormal cytoplasmic organelles, and maintaining cellular homeostasis (Figure 1).
It is widely recognized that dysfunction in the ALP is a pathogenic feature shared by multiple adult-onset neurodegenerative disorders (NDDs), including Alzheimer’s, Parkinson’s, and Huntington’s diseases [3,4,5]. In general, the accumulation of intracellular aggregates in the brain, which leads to synaptic dysfunction and ultimately neuronal death, is a common feature for all these pathologies.
Despite extensive research efforts, the complex etiology of these diseases is not yet clear, and limited treatment options are currently available.
TFEB is widely expressed in the CNS, including in neurons and astrocytes [6,7,8]. In physiological conditions, TFEB localizes to the cytosol and rests on the lysosomal surface, where upstream kinases, such as rapamycin complex 1 (mTORC1) [9], can phosphorylate it. Thus, the inhibition of mTOR, induced by starvation and lysosomal stress, promotes TFEB dephosphorylation and its nuclear translocation [1,10]. Nuclear TFEB increases the transcription of genes involved in the regulation of lysosomal, autophagic, and retromer function, collectively called the coordinated lysosomal expression and regulation (CLEAR) network. Notably, nuclear TFEB localization is decreased in different NDDs in which protein aggregation takes place [6,8,11,12], thus suggesting that defective nuclear translocation of TFEB is related to impaired protein homeostasis in neurons. TFEB overexpression is widely known to increase the number of autophagosomes, to promote the generation of new lysosomes, and to increase the autophagic flux [1,13,14,15]. Therefore, inducing intracellular clearance through the induction of TFEB activity may represent an appealing therapeutic intervention for the treatment of NDDs.
In recent years, considerable advances in cannabinoid research have renewed interest in targeting components of the endocannabinoid system (ECS) as treatment options in central nervous system (CNS) disorders and NDDs [16,17]. The ECS is a complex molecular system that plays critical roles in multiple physiological processes such as homeostasis, neurogenesis, neuroprotection, and inflammation [18,19]. Elements of the ECS comprise the endogenous ligands, endocannabinoids (eCBs) anandamide (AEA) and 2-arachidonoylglycerol (2-AG), their synthesizing and metabolizing enzymes, and the cannabinoid receptors type 1 (CB1R), type 2 (CB2R), and other putative cannabinoid receptor candidates [20,21] (Figure 2).
While most research has investigated CB1R, which is highly expressed in nearly all brain regions, CB2R in the brain has started to attract considerable interest only in recent years, having been considered for a long time exclusively a peripheral-type receptor [22]. During the last two decades numerous experimental studies have provided robust evidence that CB2R seems to be involved in the modulation of different neurological disorders characterized by neuroinflammatory processes and microglial cell activation [23], suggesting the therapeutic potential of natural and synthetic CB2R ligands in the treatment of neurodegenerative proteinopathies, such as Alzheimer’s and Parkinson’s diseases [24,25].
Notably, a very recent report highlighted a new mechanism allowing CB2R to regulate autophagy (ATG), lipid metabolism, and inflammation in an animal model of postoperative cognitive dysfunction (POCD) through the modulation of TFEB activity [26], further increasing the potential of CB2R targeting for therapeutic intervention in NDDs.
Our group has recently developed the first CB2R bitopic/dualsteric ligand, namely FD22a, which has been shown to display beneficial biological responses both in vitro and in vivo with fewer side effects [27].
Bitopic/dualsteric ligands, which are hybrid compounds composed of orthosteric and allosteric pharmacophoric units, represent one of the most promising strategies of targeting G protein-coupled receptors (GPCRs) [28]. Indeed, this approach allows the exploitation of favorable characteristics of the orthosteric and the allosteric site by a single ligand molecule, including an increased affinity or selectivity for the target receptor, often associated with functional selectivity (i.e., bias signaling pathway activation), reduced off-target activity, and therapeutic resistance [29].
Notably, novel CB2R bitopic ligand FD22a met requirements typical of the bitopic ligand, such as receptor–subtype selectivity and biased signaling for cAMP inhibition versus βarrestin2 recruitment, while revealing significant neuroprotective effects, such as the ability to efficiently combat the inflammatory process in human microglial cells and to display antinociceptive activity in vivo [27]. In addition, computational studies clarified the binding mode of this compound inside the CB2R, further confirming its bitopic nature [27].
To explore in more detail the potential of newly developed CB2R bitopic ligand FD22a to target neurodegeneration, in the present study we investigated the ability of FD22a to counteract the detrimental effects produced by the neurotoxic Aβ fragment 25–35 (Aβ25–35) [30] in human cellular models of neurodegeneration, such as human microglial (HMC3) and human glioblastoma–astrocytoma (U87-MG) cell lines.
In these models FD22a prevented the cytotoxic and proinflammatory effects of Aβ25–35 and efficiently counteracted the depression of autophagy caused by Aβ25–35.
Moreover, protein expression profiling, combined with pathways analyses, revealed that FD22a was able to potently stimulate the ALP pathway through TFEB activation, in turn reversing Aβ25–35 neurotoxicity by promoting intracellular clearance.

2. Materials and Methods

2.1. Cell Cultures, Reagents, and Treatments

Human glioblastoma (U87-MG, ATCC® HTB-14™, Manassas, VA, USA) and human microglial clone 3 (HMC3, ATCC® CRL-3304™, Manassas, VA, USA) cell lines were cultured in high-glucose DMEM supplemented with 10% fetal bovine serum and a 1:1 antibiotic mixture of streptomycin (100 g/mL) and penicillin (100 U/mL) (Sigma-Aldrich, Milan, Italy) at 37 °C in 5% CO2 humidified air.
25–35 peptide (NH2-Gly-Ser-Asn-Lys-Gly-Ala-Ile-Ile-Gly-Leu-Met-COOH) (A4559, Sigma-Aldrich, Milan, Italy) was initially dissolved in double-distilled water to obtain 1 mM concentration and stored at −20 °C. To form aggregated diffusible oligomers, the solution was incubated at 37 °C for 5 days [31], then diluted in medium to the indicated concentration, just prior to cell treatments. FD22a was dissolved in DMSO to obtain a 50 mM stock solution which was kept at 4 °C. Before the experiments FD22a stock solution was diluted into the cell culture medium to the desired experimental concentration, and the final DMSO concentration was maintained no higher than 0.1%. Vehicle-treated cells (0.1% DMSO) were used as control (Ctrl).
In all the experiments 24 h after seeding, cells were exposed to pretreatment with FD22a for 24 h and then exposed to Aβ25–35 at the pertinent concentration (10 µM for U87-MG and 1 µM for HMC3). After 48 h, cells were processed according to the specific experiment protocol.

2.1.1. MTT (Cell Viability Assay)

The 3-(4,5-dimethylthiazol-2-yl)-2,5-diphenyltetrazolium bromide (MTT, Sigma-Aldrich, Milan, Italy) reagent was used to test the effect of FD22a on cell viability. Briefly, after treatment, cells were incubated with MTT (0.5 mg/mL) for 4 h at 37 °C. The formazan products were dissolved in DMSO. An automated microplate reader (BIO-TEK, Winooski, VT, United States) was used to quantify absorbance at 540 nm. Cell viability was expressed as the percentage of control cells.

2.1.2. Release of Inflammatory Cytokines

Concentrations of proinflammatory interleukin 6 (IL-6), tumor necrosis factor α (TNFα), and anti-inflammatory interleukin 10 (IL-10) were quantified by specific ELISAs (RAB0306 (IL-6), RAB0476 (TNFα), and RAB0244 (IL-10), Sigma-Aldrich, Milan, Italy). After pertinent treatment, culture media were collected and stored at −80 °C until analysis.

2.1.3. Gene Expression Analysis

Total RNA was extracted using the RNeasy Mini kit (74104, Qiagen, Hilden, Germany) and a Qubit v.1 fluorometer plus Qubit RNA HS Assay Kit (Thermo Fisher Scientific, Wilmington, DE, USA) was used to extract and quantify total RNA, on the basis of manual protocol indications.
Extracted RNA (1 μg) was retrotranscribed by using the iScriptTM gDNA Clear cDNA Synthesis Kit (Bio-Rad, Milan, Italy) according to the manufacturer’s instructions, and the obtained cDNA samples were quantified by real-time PCR using a SYBR Green probe and CFX Connect Real-Time PCR Detection System (Bio-Rad, Milan, Italy). The PCR cycle program consisted of an initial denaturation at 95 °C for 30 s followed by 40 cycles of 5 s of denaturation at 95 °C and 15 s of annealing/extension at 60 °C. To verify amplicon specificity and potential primer dimer formation, a final melting protocol with ramping from 65 °C to 95 °C with 0.5 °C increments of 5 s was performed.
Primer sequences (Table 1) were designed by using Beacon Designer Software v.8.0 (Premier Biosoft International, Palo Alto, CA, USA) with a junction primer strategy, whenever possible. To exclude genomic DNA contamination, a negative retrotranscription control was used. The endogenous reference gene GAPDH was quantified for each sample.
All reactions were performed in triplicate and the amount of mRNA was calculated by the comparative critical threshold (CT) method.

2.2. Proteomic Analysis

For proteomic analysis, U87-MG human glioblastoma cells were exposed to pretreatment with FD22a (1 μM) for 24 h before being exposed for 48 h with Aβ25–35 (10 μM) as described above. After treatment, cells were rinsed with ice-cold PBS and lysed in rehydration solution (7 M urea, 2 M thiourea, 4% CHAPS, 60 mM dithiothreitol (DTT), 0.002% bromophenol blue) added with 50 mM NaF, 2 mM Na3VO4, 1 μL/106 cells, and protease cocktail inhibitors (Sigma-Aldrich, St. Louis, MO, USA). After stirring and sonication, cells were allowed to rehydrate for 1 h at room temperature (RT) and, thereafter, the solution was centrifuged at 16,000× g for 10 min at RT [32]. Protein contents of resulting protein extracts were measured with the Pierce Protein Assay (Thermo Fisher Scientific, Waltham, MA, USA) and bovine serum albumin was used as standard.
Two-dimensional electrophoresis (2DE) was carried out as previously described [33]. Briefly, one hundred fifty micrograms of proteins was loaded on Serva IPG blue strips (SERVA-German Headquarter, Heidelberg, Germany) with a linear pH 3–10 gradient. The second dimension (SDS-PAGE) was carried out by transferring the proteins to 12% polyacrylamide gels. The gels were stained with Ruthenium II tris (bathophenanthroline disulfonate) tetrasodium salt (Cyanagen Srl, Bologna, Italy) (RuBP) [34] and images were acquired by ImageQuant LAS4010 (GE Health Care, Uppsala, Sweden). The analysis of images was performed using Same Spot (v4.1, TotalLab; Newcastle Upon Tyne, UK) software [35]. The spot volume ratios among the four different conditions (control, FD22a, Aβ25–35, FD22a + Aβ25–35) were calculated using the average spot normalized volume of the six biological replicates. The software included statistical analysis calculations.

2.2.1. In Gel Digestion and Mass Spectrometry

The gel pieces were digested as reported by Giusti et al. 2018 [36]. Peptide MS spectra were recorded manually on the AutoFlex Speed MALDI-TOF/TOF spectrometer (Bruker Daltonics, Leipzig, Germany) operated in positive reflectron mode [37]. Samples unidentified by MALDI-TOF/TOF were analyzed by LC-MS/MS using an UltiMate3000 RSLCnano chromatographic system coupled to an Orbitrap Fusion Tribrid mass spectrometer (Thermo Fisher Scientific, Waltham, MA, USA), operating in positive ionization mode, equipped with a nanoESI source (EASY-Spray NG). Peptides were loaded on a PepMap100 C18 precolumn cartridge (5 µm particle size, 100 Å pore size, 300 µm i.d. × 5 mm length, Thermo Fisher Scientific, Waltham, MA, USA) and subsequently separated on an EASY-Spray PepMap RSLC C18 column (2 µm particle size, 100 Å pore size, 75 µm i.d. × 15 cm length, Thermo Fisher Scientific, Waltham, MA, USA) at a flow rate of 300 nL/min and a temperature of 40 °C, using 0.1% FA in water (eluent A) and 99.9% ACN, 0.1% FA (eluent B). The chromatographic separation was achieved by a two-step linear gradient from 5% to 30% eluent B in 40 min, and from 30% to 55% in 5 min followed by an increase to 90% in one minute, for a total runtime of 56 min.
Precursor (MS1) survey scans were recorded in the Orbitrap, at resolving powers of 240 K (at m/z 200). Data-dependent MS/MS (MS2) analysis was performed in top-speed mode with a 3 s cycle time, during which most abundant multiple-charged (2+–5+) precursor ions detected within the range of 375–1500 m/z were selected for HCD activation in order of abundance and detected in the ion trap at a rapid scan rate after fragmentation using 30% normalized collision energy. Quadrupole isolation with a 1.6 m/z isolation window was used, and dynamic exclusion was enabled for 60 s after a single scan. Automatic gain control targets and maximum injection times were standard and auto for MS1 and 150% and 70 for MS2. For MS2, the signal intensity threshold was 5.0 × 10³, and the option “Injection Ions for All Available Parallelizable Time” was set.
Raw data were directly loaded in PEAKS Studio Xpro software 11 (Bioinformatic Solutions Inc., Waterloo, ON, Canada) using the “correct precursor only” option. The mass lists were searched against the UniProt/SwissProt database (downloaded January 2022) restricted to Mammalia taxonomy to which a list of common contaminants was appended (67,666 searched entries). Non-specific cleavage was allowed to one end of the peptides, with a maximum of 2 missed cleavages and 2 variable PTMs per peptide. Additionally, 10 ppm and 0.5 Da were set as the highest error mass tolerances for precursors and fragments, respectively. A −10lgp threshold for PSMs was manually set to 35.

2.2.2. Bioinformatic Analysis

To determine the predominant canonical pathways and interaction network involved, differentially expressed proteins obtained from the comparison of FD22a + Aβ25–35 vs. Aβ25–35 were functionally analyzed using QIAGEN’s Ingenuity Pathway Analysis (IPA, QIAGEN Redwood City, CA, USA, www.qiagen.com/ingenuity, Build version: 321501M, Content version: 21249400, accessed on 15 January 2021). Comparison of the different analyses was performed and potential regulators and downstream functions were investigated as previously described [33].

2.2.3. Western Blot Analysis

Equal amounts of proteins from U87-MG cell lysates (30 μg of proteins) were mixed with Laemmli solution, run in 4–15% polyacrylamide gels (Mini-PROTEAN® Precast Gels, Biorad, Hercules, CA, USA) using a mini-Protean Tetracell (Biorad, Hercules, CA, USA), and transferred onto nitrocellulose membranes (0.2 μm) using a Trans-Blot Turbo transfer system (Biorad) as previously described [33]. Immediately after, WB membranes were stained with 1 mM RuBP and total protein images acquired by ImageQuant LAS4010 (GE Health Care, Uppsala, Sweden). Subsequently, membranes were incubated with primary antibodies (dilution 1:1000). The following antibodies were purchased from Cell Signaling Technology, Beverly, MA, USA: TFEB (D207D) rabbit mAb (#37785), phosphorylated TFEB (E9S8N) rabbit mAb (pTFEBS211; #37681), mTOR (7C10) rabbit mAb (#2983), phosphorylated mTOR (D9C2) XP rabbit mAb (p-mTORS2448; #5536). Immunoblots were developed using the enhanced chemiluminescence (ECL) detection system. The chemiluminescent images were acquired using LAS4010 (GE Health Care Europe, Upsala, Sweden). Semiquantitative analysis of specific immunolabeled bands was performed using ImageQuant TL 7 software.

2.2.4. Statistical Analysis

For cell viability, ELISAs and gene expression analysis results are expressed as the mean ± standard error of the mean (SEM). Statistical analyses were performed using commercial software (GraphPad Prism, San Diego, CA, USA) using ordinary one-way ANOVA followed by Dunnett’s or Tukey’s post hoc tests. Differences for which p < 0.05 were considered significant.
For proteomic studies, all analyses were performed at least in triplicate and values were expressed as mean ± standard error (SD). In 2DE experiments, a comparison among the different treatments was performed. The significance of the differences of normalized volume for each spot was calculated by the software Same Spot (v4.1, TotalLab, Newcastle Upon Tyne, UK) including the analysis of variance (ANOVA test). The protein spots that showed significant differences in expression were cut out from the gel and identified by mass spectrometry analyses. The immunoreactive bands obtained in WB experiments were analyzed using ImageQuant TL (GE Health Care). The antigen-specific bands and the total proteins after RuBP staining were quantified. The volume of each band was normalized on total proteins obtained from RuBP staining. The results were expressed as a ratio of optical density. For phosphoproteins a consecutive normalization on the expression level of corresponding proteins was performed. An unpaired t-test was used to compare differences among treatments (Prism 7; GraphPad Software, San Diego, CA, USA). Differences for which p < 0.05 were considered significant.

3. Results

3.1. FD22a Prevents Aβ25–35-Induced Cytotoxicity in HMC3 and U87-MG Cells

To investigate the potential protective activity of FD22a against Aβ25–35-induced cytotoxicity, two different human cell lines, namely human microglial (HMC3) and glioblastoma (U87-MG) cells, were exposed to pretreatment (24 h) with increasing concentrations (0.1–10 μM) of FD22a before being treated for 48 h with 1 or 10 μM Aβ25–35, respectively (Figure 3). These two β-amyloid concentrations have been chosen as they reduce cell viability by approximately 50% compared to either HMC3 or U87-MG control cells (Figure 3C,D). Moreover, comparable Aβ25–35 concentrations have been previously used by Polini et al. in HMC3 cell culture experiments [31]. Of note, in HMC3 cells no tested concentration of FD22a affected cell viability (Figure 3A), whereas in U87-MG cells, when FD22a was used at a concentration higher than 1 µM, a slight cytotoxic effect was observed (Figure 3B). Vehicle-treated cells (Ctrl) did not show any difference compared to untreated cells (NT).
Cell viability was analyzed by MTT assay. As expected, Aβ25–35 significantly reduced cell viability with respect to control cells (Figure 3C,D). When used at 0.1 μM, FD22a did not counteract the deleterious effects of Aβ25–35 on cell viability in both cell lines. On the contrary, 1 μM FD22a induced a significant increase in cell viability compared to Aβ25–35-treated cells (Figure 3C,D). For these reasons, the subsequent experiments were carried out using 1 μM FD22a.

3.2. FD22a Inhibits β-Amyloid-Mediated Release of Proinflammatory Factors in HMC3 and U87-MG Cells

Microglia represent the first line of immune defense within the CNS, and microglial dysfunction is considered a pathogenic mechanism common to several neurological disorders [38]. Studies have revealed that Aβ peptides activate microglia to release a large variety of proinflammatory factors [39,40]. Therefore, a potential strategy to delay Alzheimer’s disease (AD) onset and possibly prevent its progression could be suppressing the response of microglial cells to inflammatory stress [41,42]. Based on these premises, in our study we used human HMC3 microglial cells to investigate the protective effect of the newly developed CB2R bitopic/dualsteric ligand FD22a against β-amyloid’s cytotoxic and proinflammatory effects. Having assessed that FD22a (1 μM) can protect HMC3 cells from β-amyloid-induced cytotoxicity, we went on to evaluate the ability of FD22a to withstand the increased production of proinflammatory cytokines induced by β-amyloid. In HMC3 cells, Aβ25–35 (1 μM for 48 h) promoted a significant increase in the release of common proinflammatory cytokines (TNFα and IL-6) (Figure 4A,B), whereas no effect on the release of anti-inflammatory cytokine IL-10 was observed (Figure 4C). In all experiments, treatment with FD22a (1 μM) alone did not show any significant change as compared to control cells. Then, we repeated the experiments, exposing HMC3 cells to pretreatment with 1 μM FD22a. Compared with the β-amyloid-treated group, pretreatment with FD22a was demonstrated to significantly counteract the β-amyloid-increased secretion of TNFα and IL-6, even though the level of both cytokines was still higher as compared to control cells (Figure 4A,B). In addition, pretreatment with FD22a followed by Aβ25–35 treatment induced a significantly enhanced secretion of anti-inflammatory cytokine IL-10 (Figure 4C). Taken together, these findings indicated the potential of FD22a to inhibit β-amyloid-induced microglial activation.
Since the role of CB2R in the beneficial effects of FD22a on the inflammatory response of LPS/TNFα-treated HMC3 cells has been previously reported, we additionally examined the involvement of CB2R in mediating the anti-inflammatory properties of FD22a in β-amyloid-induced HMC3 cells. As shown in Figure 4A–C, co-administration of CB2R selective antagonist SR144528 (1 μM) almost completely abolished the protective effect of FD22a against β-amyloid-induced microglial activation. The same set of experiments was also carried out in U87-MG cells, revealing that the FD22a/CB2R system was able to efficiently suppress β-amyloid-induced enhanced production of proinflammatory cytokines, namely TNFα and IL-6 (Figure 5A,B), and to promote the secretion of anti-inflammatory cytokine IL-10 (Figure 5C). As detected in HMC3 cells, treatment with FD22a (1 μM) alone did not produce any significant effect on cytokine release in U87-MG cells.

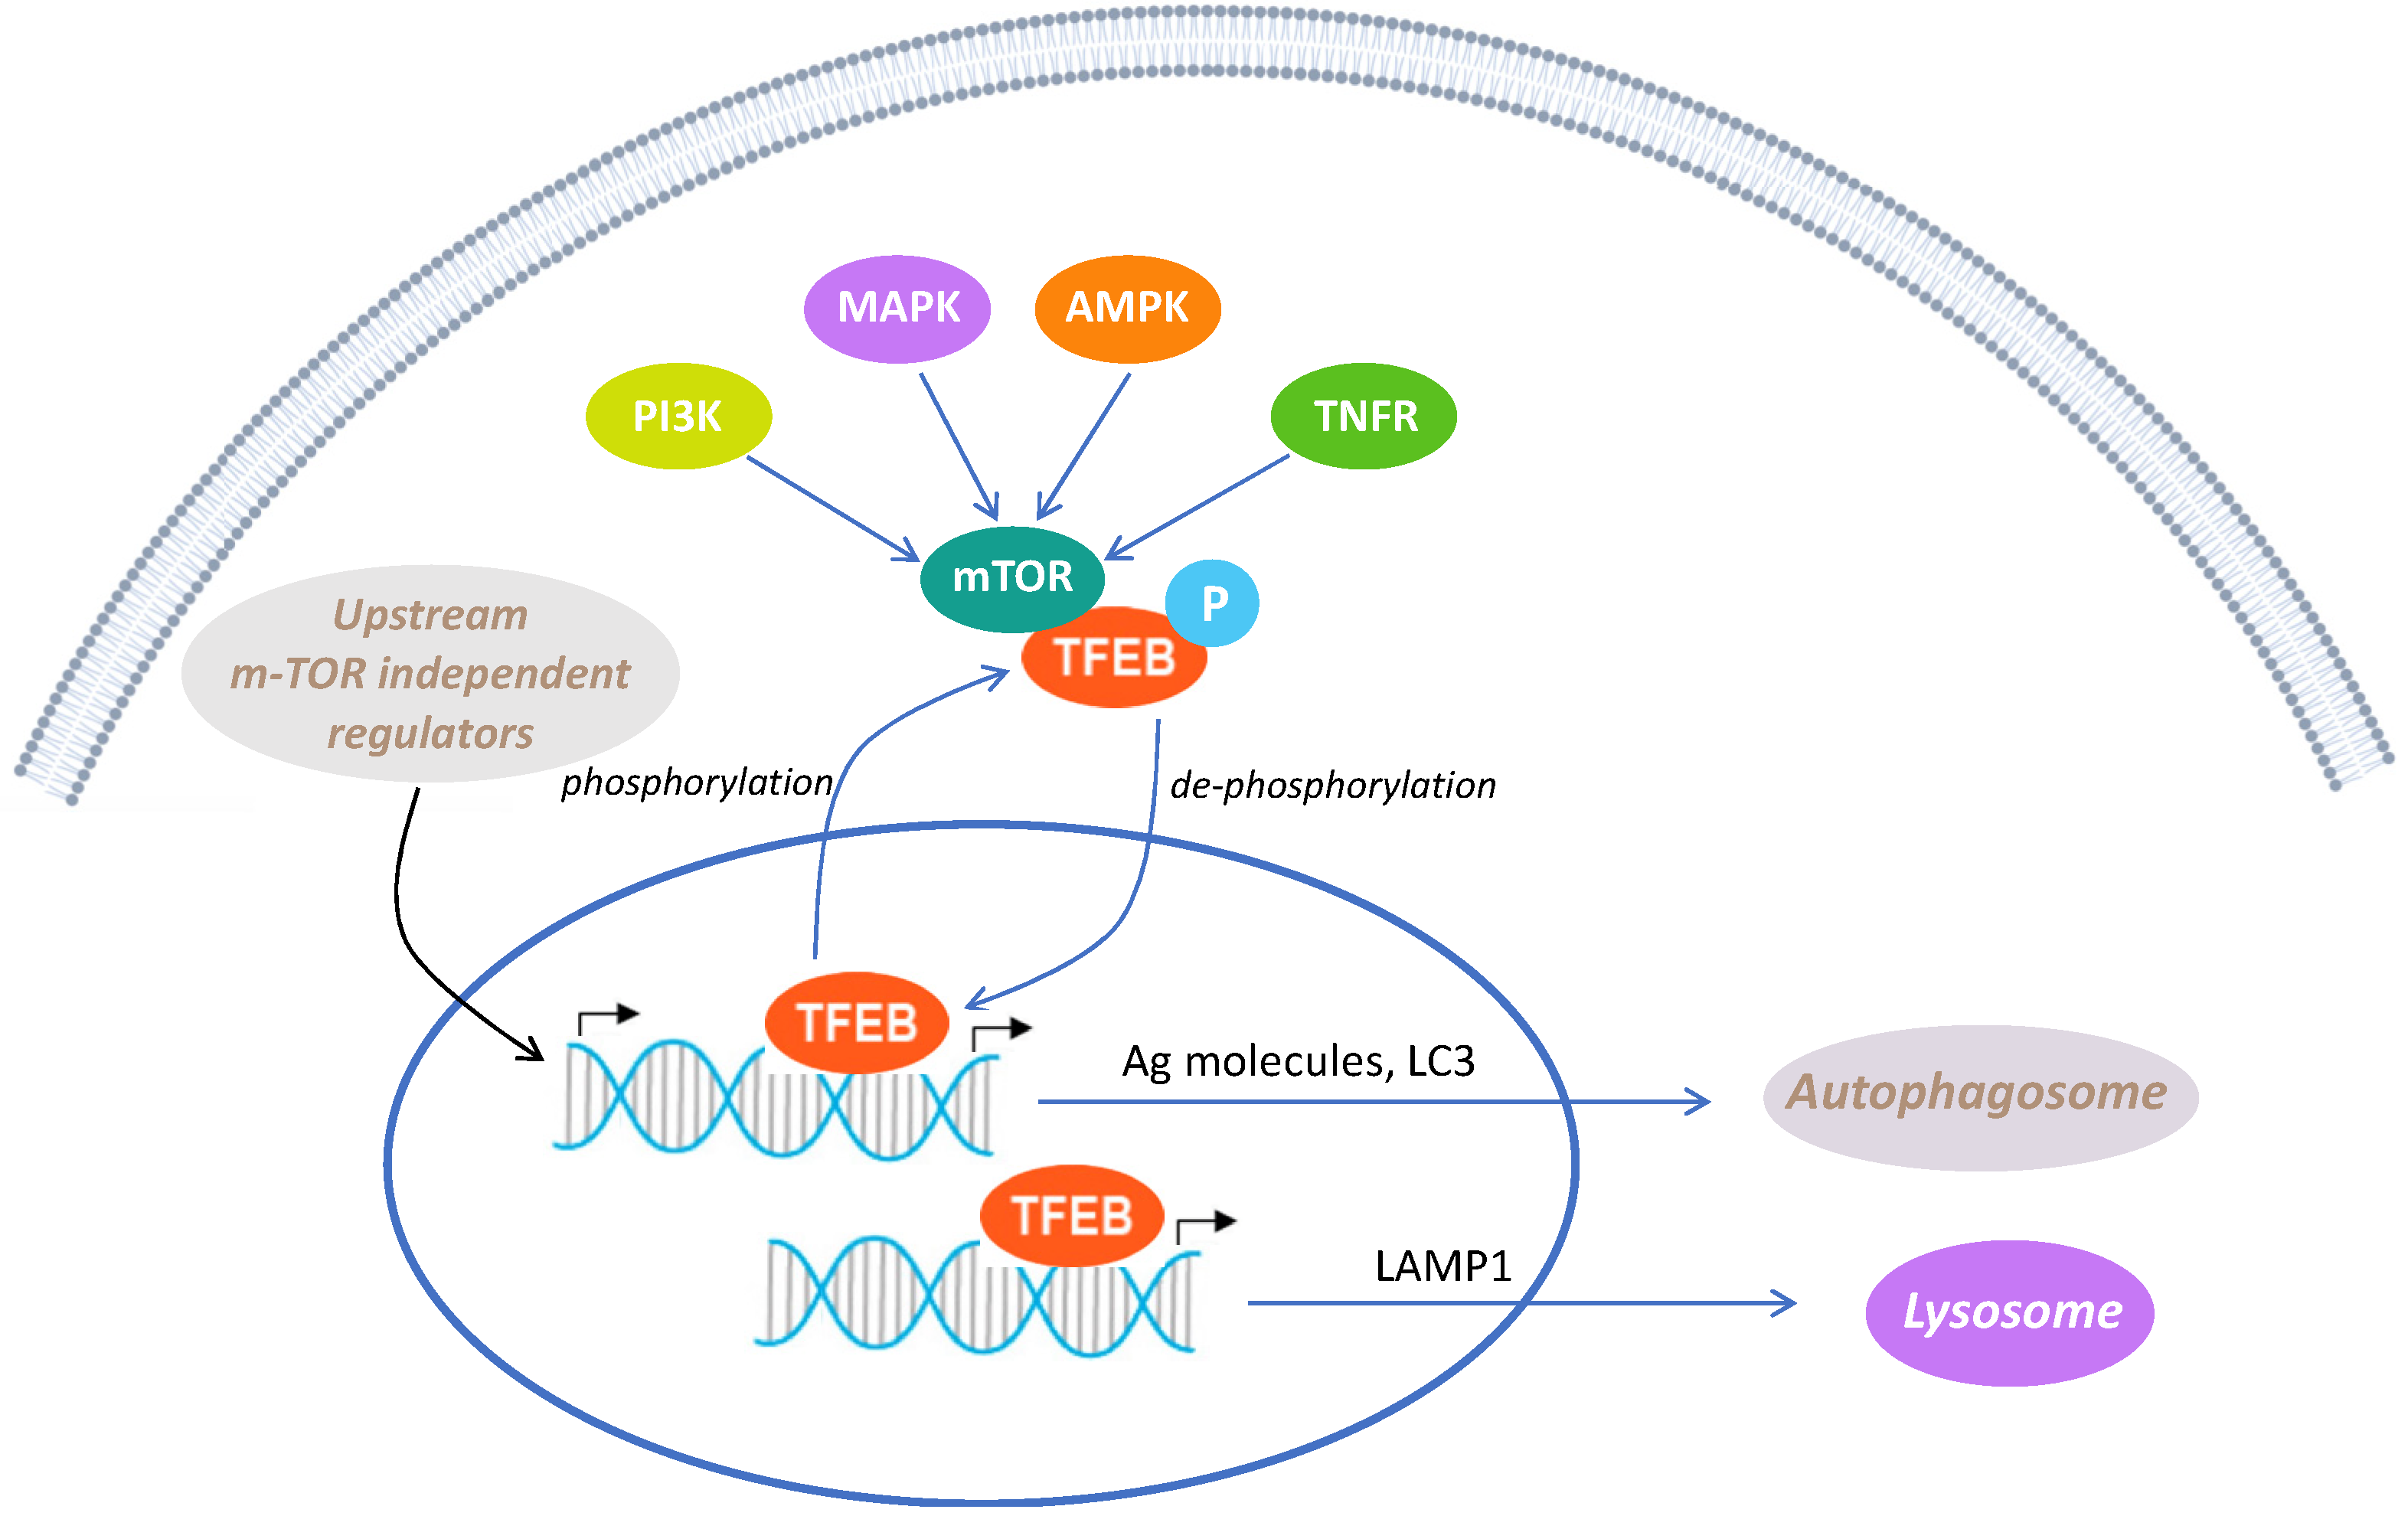
3.3. FD22a Prevents β-Amyloid-Induced Down-Regulation of Autophagy in U87-MG Cells

ATG is crucial for neuronal homeostasis, and its dysfunction has been directly linked to a growing number of NDDs. Accordingly, the induction of ATG may be exploited as a strategy to assist neurons to survive by clearing abnormal protein aggregates [43]. The kinase mammalian target of rapamycin (mTOR) is a central modulator of ATG [44], and a marked up-regulation of mTOR is known to contribute to AD progression in humans [45]. Hence, U87-MG cells, which feature a similar mTOR up-regulation leading to ATG suppression [46,47,48,49], may represent the ideal cell line for in vitro studies.
Having assessed that FD22a (1 μM) was able to protect U87-MG cells from β-amyloid-induced cytotoxicity and proinflammatory response, we went on to examine whether exposure of U87-MG cells to Aβ25–35 could lead to further depression of autophagy and whether pretreatment with FD22a could resolve, or at least attenuate, the deleterious effect of β-amyloid in such cells.
Gene expression analysis revealed that exposure of U87-MG cells to 10 μM Aβ25–35 for 48 h leads to a significant decrease in the expression of proautophagy-related genes, such as microtubule-associated protein 1 light chain 3 (LC3), sirtuin 1 (SIRT1), and sirtuin 6 (SIRT6), and to increase expression of negative regulator of ATG such as mTOR, sigma-1 receptor (SIGMAR1), and sirtuin 5 (SIRT5) (Figure 6A). Increased expression of inflammatory-response-related genes, such as monocyte chemoattract protein-1 (MCP1) and transcription factor NF-κB, was also observed (Figure 6B). Pretreatment with FD22a (1 μM) for 24 h was demonstrated to efficiently prevent the depression of autophagy (Figure 6A) and the proinflammatory response caused by β-amyloid exposure (Figure 6B). Notably, treatment with FD22a (1 μM) alone was not able to produce any significant transcriptional effect in U87-MG cells.

3.4. Quantitative Proteomic Analysis Uncovers the Activation of TFEB in the Restoration of Autophagy by FD22a

To uncover potential molecular pathways and protein targets involved in FD22a’s effect and in its potential protective action against the deleterious impact caused by β-amyloid exposure, we performed a quantitative proteomic analysis of U87-MG cells. The 2DE protein maps of cellular protein extracts obtained from U87-MG cells in different treatment conditions were compared.
Overall, an average of 1800 ± 70 spots were found within a linear pH range from 3 to 10. A representative gel image is shown in Figure 7A (representative 2DE images of all groups are shown in Supplementary Materials Figure S1), whereas the Venn diagram shown in Figure 7B shows the number of protein spots found significantly differentially expressed in different comparisons.
Regarding comparison with the control, 67 spots were modified by the treatment with FD22a and 41 by the treatment with Aβ25–35, whereas pretreatment with FD22a reduced protein spot changes, as suggested by the FD22a + Aβ25–35 vs. Aβ25–35 comparison. A volcano plot was constructed to represent fold change and p-value in protein expression for this comparison. It revealed that about 50 percent of the 20 spots found with a significant change in expression were up-regulated (Figure 7C).
These spots were identified by LC-MS/MS. The name of the identified proteins, the molecular weight (MW), isoelectric point (pI), score, coverage values of MS/MS, ratio, and p-values are listed in Table 2, whereas Figure 8 shows box plots of data distribution obtained for these proteins in different treatment conditions. Compared with the Aβ25–35 group, the combined FD22a and Aβ25–35 treatment significantly restores to the control value the expression of HS90A/B, lamin A (LMNA), fructose biphosphate-aldolase (ALDOA), calcyclin-binding protein (CYBP), ubiquitin carboxyl-terminal hydrolase isozyme L1 (UCHL1), and peroxiredoxin 2 (PRDX2). Moreover, Table 3 and Table 4 report the proteins that were found differentially expressed when comparing both FD22a and Aβ25–35 treatment with control experiments, respectively.
To explore the molecular pathways involved in FD22a action and its ability to protect against the deleterious effects of Aβ25–35, proteins that were found to express differently were analyzed by Ingenuity Pathway Analysis (IPA, QIAGEN Redwood City, CA, USA, www.qiagen.com/ingenuity). An involvement of the CLEAR signaling pathway (z score = 2.2) with a TFEB-dependent activation of autophagy and lysosome biogenesis emerged from the analysis of proteins differently expressed in relation to the treatment with FD22a. Accordingly, an inhibition of NF-κB was observed in the network analysis (Figure 9).
Moreover, a list of potential regulators was obtained from causal network analysis, with significant positive and negative z-scores (Supplementary Table S1): among these, the activation of Next to BRCA1 gene 1 protein (NBR1) (z-score = 3.4, p-value = 1.16 × 10⁻⁸), a ubiquitin-binding autophagy adapter which acts as a receptor for selective autophagosomal degradation of ubiquitinated targets, agreed with induction of autophagy by FD22a. On the other hand, IPA of proteins differently expressed after exposure of U87-MG cells to Aβ25–35 supported a loss of autophagic response with caspase activation and inhibition of sestrin 2 (SESN2) (z-score = −2.1; p-value = 0.00002), a stress-inducible protein, able to activate the specific autophagic machinery for degradation of mitochondria (Supplementary Table S2).
Studies have suggested that the dephosphorylation of TFEB at serine 211 (TFEB-S211) promoted the nuclear entry of TFEB, which regulates the expression of autophagy-related genes [2,50].
Since the IPA suggested that the TFEB pathway could be involved in the action of FD22a, we performed Western blot analysis to evaluate the expression of total TFEB and TFEB-S211 in different treatment conditions. Western blot analysis revealed that exposure of U87-MG cells to 10 μM Aβ25–35 for 48h led to a significant increase in TFEB-S211 expression (4.2-fold with respect to control, p-value < 0.001), and pretreatment with 1 μM FD22a attenuated the expression of the phosphorylated form by about 26% (Figure 10).
Western blot analysis also revealed that Aβ25–35 treatment produced an increased expression of the phosphorylated form of mTOR (p-mTOR) in comparison to control cells, whereas the addition of FD22a induced an approximately 33% reduction in mTOR phosphorylation with respect to Aβ25–35-treated cells (p-value = 0.048) (Figure 10), thus confirming gene expression results. A reduction of p-mTOR, the active form of mTOR (Figure 10), and an increase in phosphatase expression observed in 2DE (Table 2) may concur with the dephosphorylation of TFEB induced by FD22a.

4. Discussion

In this study, we investigated the protective effect of the newly developed CB2R bitopic/dualsteric ligand FD22a against the toxicity of β-amyloid (Aβ25–35 peptide) on human cellular models of neurodegeneration, including microglial (HMC3) and glioblastoma (U87-MG) cell lines. Our results showed that FD22a protected and rescued both cell lines from β-amyloid cytotoxic and proinflammatory effects and specifically prevented β-amyloid-induced depression of the autophagy–lysosome pathway (ALP) in U87-MG cells by promoting a TFEB-dependent activation of autophagy and lysosome biogenesis. Given the strong evidence for ALP’s impairment in all major forms of NDDs [51,52,53], drugs capable of restoring autophagy deficits hold significant potential in the treatment of NDDs.
Our gene expression data revealed that exposure of U87-MG cells to β-amyloid leads to significantly decreased expression of proautophagy marker genes (i.e., LC3, SIRT1, and SIRT6) and increased expression of negative autophagy regulators, such as mTOR, SIGMAR1, and SIRT5. Increased expression of inflammatory-response-related genes, including MCP1 and NF-κB, was also observed. Notably, pretreatment with FD22a prevented the depression of autophagy and the proinflammatory response caused by β-amyloid exposure, strengthening previous evidence of neuroprotective activity described for FD22a [27] and supporting a beneficial role of CB2R activation in β-amyloid-dependent neuroinflammation, as seen in AD pathology [23]. To explore in more detail the molecular pathways involved in the protective action of FD22a against the deleterious effects induced by β-amyloid, we performed a quantitative proteomic analysis of U87-MG cells. Proteins that were found to express differently following different treatment conditions, such as control, exposure to β-amyloid alone, and co-treatment with FD22a and β-amyloid, were analyzed by IPA to identify specific networks. Molecular pathway analysis revealed that in U87-MG cells’ FD22a treatment significantly impacts the CLEAR signaling pathway, promoting a TFEB-dependent activation of autophagy and lysosome biogenesis. Accordingly, inhibition of NF-κB and activation of Next to BRCA1 gene 1 protein (NBR1), with the latter acting as a receptor for selective autophagosomal degradation of ubiquitinated targets, were observed, supporting the induction of autophagy by FD22a. On the other hand, after exposure of U87-MG cells to β-amyloid, network analysis supported a loss of autophagic response with caspase activation and inhibition of the stress-inducible metabolic protein sestrin 2 (SESN2), which is widely recognized as a key regulator of cellular homeostasis [52,54]. Furthermore, compared with the Aβ25–35 treatment group, the combined FD22a and Aβ25–35 treatment significantly restores, to the control value, the expression of HS90A/B, lamin A (LMNA), fructose bisphosphate-aldolase (ALDOA), calcyclin-binding protein (CYBP), ubiquitin carboxyl-terminal hydrolase isozyme L1 (UCHL1), and peroxiredoxin 2 (PRDX2), collectively contributing to the recovery of cell viability and vitality and suggesting a possible role of CB2R activation in promoting cell survival in the face of β-amyloid toxic insults.
In particular, the significant reduction in cofilin-1 expression actually could derive from CBR2 activation. Cofilin is an essential actin regulatory protein that constitutively severs actin filaments, and its activation is often an early event in cell migration. CBR2 agonists have been shown to modulate the activities of cofilin [55], and Yang et al. suggested that anti-inflammatory effects of CBR2 agonists may be mediated by cofilin-1 protein [56].
Numerous studies have shown that improving intracellular clearance may alleviate the symptoms associated with a large variety of NDDs. Therefore, regulating TFEB activity may be a promising therapeutic strategy against NDDs. The main mechanisms involved in the regulation of TFEB are predominantly posttranslational modifications, including phosphorylation, acetylation, SUMOylating, PARsylation, and glycosylation [50]. Among them, the phosphorylation of diverse serine residues plays a central role because it maintains TFEB in the cytoplasm, preventing its nuclear entry and activation. The principal negative regulator of TFEB activity is the mammalian target of rapamycin (mTorc1), which phosphorylates TFEB at at least three serines, S122, S142, and S211 [57,58]. We demonstrated here that exposure of U87-MG cells to Aβ25–35 could lead to a significant increase in TFEB-S211 expression, while pretreatment with FD22a significantly attenuated the expression of the phosphorylated form. In accordance with gene expression results, Western blot analysis also revealed that Aβ25–35 treatment produced an increased expression of the phosphorylated form of mTOR (p-mTOR) in comparison to control cells, whereas the addition of FD22a induced a significant reduction of p-mTOR with respect to control and Aβ25–35-treated cells. Notably, the detected reduction of p-mTOR and increased expression of phosphatases revealed in 2DE experiments may concur with the dephosphorylation of TFEB induced by FD22a.

5. Conclusions

Overall, the results of our study highlight the potential for a multitarget treatment of neurodegenerative pathologies via FD22a-mediated activation of CB2R. The observed ability of FD22a to promote TFEB nuclear entry by dephosphorylation of S211, the target serine of mTOR, followed by TFEB-mediated activation of autophagic lysosomal function, associated with the ability to prevent β-amyloid-induced cytotoxic and proinflammatory effects, may have a marked relevance in the prevention and/or treatment of AD pathology. Even though our work provides convincing evidence of the potential of FD22a to target neurodegeneration, extensively illustrating the ability of this novel CB2R bitopic ligand to efficiently counteract the deleterious effects of β-amyloid in human glial cells, further investigations on in vivo models of AD and knockout of CB2R will be necessary to corroborate the therapeutic potential of CB2R activation in slowing or reversing AD. Furthermore, a detailed investigation of FD22a’s pharmacokinetic properties will also be fundamental to pursue a future therapeutic application of this novel CB2R bitopic ligand.

Supplementary Materials

The following supporting information can be downloaded at: https://www.mdpi.com/article/10.3390/cells13100875/s1, Figure S1. Representative 2DE image of U87-MG proteome in different condition of treatment.; Table S1. Master Regulators obtained by IPA analysis of differentially expressed proteins in the comparison FD22a vs. Ctrl; and Table S2. Master Regulators obtained by IPA analysis of differentially expressed proteins in the comparison Aβ25–35 vs. Ctrl.

Author Contributions

G.C. and L.G. conceptualized and supervised this study. B.P., L.Z., M.R., M.Z., G.C., and L.G. designed the experiments. B.P., L.Z., F.G., R.F., C.R., V.C., and L.G. performed the experiments. B.P., L.Z., M.Z., V.C., and C.M. analyzed the data. G.C., L.G., L.Z., and B.P. wrote the manuscript. A.L., R.Z., and M.R. edited the manuscript. All authors have read and agreed to the published version of the manuscript.

Funding

This research received no external funding.

Institutional Review Board Statement

Not applicable.

Informed Consent Statement

No applicable.

Data Availability Statement

The data presented in this study are available on request from the corresponding author.

Conflicts of Interest

The authors declare no conflicts of interest.

References

  1. Sardiello, M.; Palmieri, M.; Di Ronza, A.; Medina, D.L.; Valenza, M.; Gennarino, V.A.; Di Malta, C.; Donaudy, F.; Embrione, V.; Polishchuk, R.S.; et al. A Gene Network Regulating Lysosomal Biogenesis and Function. Science 2009, 325, 473–477. [Google Scholar] [CrossRef] [PubMed]
  2. Settembre, C.; Di Malta, C.; Polito, V.A.; Arencibia, M.G.; Vetrini, F.; Erdin, S.; Erdin, S.U.; Huynh, T.; Medina, D.; Colella, P.; et al. TFEB Links Autophagy to Lysosomal Biogenesis. Science 2011, 332, 1429–1433. [Google Scholar] [CrossRef] [PubMed]
  3. Harris, H.; Rubinsztein, D.C. Control of Autophagy as a Therapy for Neurodegenerative Disease. Nat. Rev. Neurol. 2012, 8, 108–117. [Google Scholar] [CrossRef] [PubMed]
  4. Mizushima, N.; Komatsu, M. Autophagy: Renovation of Cells and Tissues. Cell 2011, 147, 728–741. [Google Scholar] [CrossRef] [PubMed]
  5. Zhang, Y.; Zhou, J.; Gehl, C.R.; Long, J.D.; Johnson, H.; Magnotta, V.A.; Sewell, D.; Shannon, K.; Paulsen, J.S. Mild Cognitive Impairment as an Early Landmark in Huntington’s Disease. Front. Neurol. 2021, 12, 678652. [Google Scholar] [CrossRef]
  6. Decressac, M.; Mattsson, B.; Weikop, P.; Lundblad, M.; Jakobsson, J.; Björklund, A. TFEB-Mediated Autophagy Rescues Midbrain Dopamine Neurons from α-Synuclein Toxicity. Proc. Natl. Acad. Sci. USA 2013, 110, E1817–E1826. [Google Scholar] [CrossRef] [PubMed]
  7. Reddy, K.; Cusack, C.L.; Nnah, I.C.; Khayati, K.; Saqcena, C.; Huynh, T.B.; Noggle, S.A.; Ballabio, A.; Dobrowolski, R. Dysregulation of Nutrient Sensing and CLEARance in Presenilin Deficiency. Cell Rep. 2016, 14, 2166–2179. [Google Scholar] [CrossRef] [PubMed]
  8. Wang, H.; Wang, R.; Carrera, I.; Xu, S.; Lakshmana, M.K. TFEB Overexpression in the P301S Model of Tauopathy Mitigates Increased PHF1 Levels and Lipofuscin Puncta and Rescues Memory Deficits. eNeuro 2016, 3, ENEURO.0042-16.2016. [Google Scholar] [CrossRef]
  9. Puertollano, R.; Ferguson, S.M.; Brugarolas, J.; Ballabio, A. The Complex Relationship between TFEB Transcription Factor Phosphorylation and Subcellular Localization. EMBO J. 2018, 37, e98804. [Google Scholar] [CrossRef]
  10. Medina, D.L.; Di Paola, S.; Peluso, I.; Armani, A.; De Stefani, D.; Venditti, R.; Montefusco, S.; Scotto-Rosato, A.; Prezioso, C.; Forrester, A.; et al. Lysosomal Calcium Signalling Regulates Autophagy through Calcineurin and TFEB. Nat. Cell Biol. 2015, 17, 288–299. [Google Scholar] [CrossRef]
  11. Cortes, C.J.; Miranda, H.C.; Frankowski, H.; Batlevi, Y.; Young, J.E.; Le, A.; Ivanov, N.; Sopher, B.L.; Carromeu, C.; Muotri, A.R.; et al. Polyglutamine-Expanded Androgen Receptor Interferes with TFEB to Elicit Autophagy Defects in SBMA. Nat. Neurosci. 2014, 17, 1180–1189. [Google Scholar] [CrossRef] [PubMed]
  12. Tsunemi, T.; Ashe, T.D.; Morrison, B.E.; Soriano, K.R.; Au, J.; Roque, R.A.V.; Lazarowski, E.R.; Damian, V.A.; Masliah, E.; La Spada, A.R. PGC-1α Rescues Huntington’s Disease Proteotoxicity by Preventing Oxidative Stress and Promoting TFEB Function. Sci. Transl. Med. 2012, 4, 142ra97. [Google Scholar] [CrossRef] [PubMed]
  13. Song, W.; Wang, F.; Savini, M.; Ake, A.; Di Ronza, A.; Sardiello, M.; Segatori, L. TFEB Regulates Lysosomal Proteostasis. Human. Mol. Genet. 2013, 22, 1994–2009. [Google Scholar] [CrossRef] [PubMed]
  14. Palmieri, M.; Impey, S.; Kang, H.; Di Ronza, A.; Pelz, C.; Sardiello, M.; Ballabio, A. Characterization of the CLEAR Network Reveals an Integrated Control of Cellular Clearance Pathways. Human. Mol. Genet. 2011, 20, 3852–3866. [Google Scholar] [CrossRef] [PubMed]
  15. Settembre, C.; Ballabio, A. TFEB Regulates Autophagy: An Integrated Coordination of Cellular Degradation and Recycling Processes. Autophagy 2011, 7, 1379–1381. [Google Scholar] [CrossRef] [PubMed]
  16. Ranieri, R.; Laezza, C.; Bifulco, M.; Marasco, D.; Malfitano, A. Endocannabinoid System in Neurological Disorders. Recent Pat. CNS Drug Discov. 2016, 10, 90–112. [Google Scholar] [CrossRef] [PubMed]
  17. Fernández-Ruiz, J.; Romero, J.; Ramos, J.A. Endocannabinoids and Neurodegenerative Disorders: Parkinson’s Disease, Huntington’s Chorea, Alzheimer’s Disease, and Others. In Endocannabinoids; Pertwee, R.G., Ed.; Handbook of Experimental Pharmacology; Springer International Publishing: Cham, Switzerland, 2015; Volume 231, pp. 233–259. ISBN 978-3-319-20824-4. [Google Scholar]
  18. Battista, N.; Di Tommaso, M.; Bari, M.; Maccarrone, M. The Endocannabinoid System: An Overview. Front. Behav. Neurosci. 2012, 6, 9. [Google Scholar] [CrossRef] [PubMed]
  19. Aizpurua-Olaizola, O.; Elezgarai, I.; Rico-Barrio, I.; Zarandona, I.; Etxebarria, N.; Usobiaga, A. Targeting the Endocannabinoid System: Future Therapeutic Strategies. Drug Discov. Today 2017, 22, 105–110. [Google Scholar] [CrossRef] [PubMed]
  20. Howlett, A.C. International Union of Pharmacology. XXVII. Classification of Cannabinoid Receptors. Pharmacol. Rev. 2002, 54, 161–202. [Google Scholar] [CrossRef]
  21. Lu, H.-C.; Mackie, K. An Introduction to the Endogenous Cannabinoid System. Biol. Psychiatry 2016, 79, 516–525. [Google Scholar] [CrossRef]
  22. Munro, S.; Thomas, K.L.; Abu-Shaar, M. Molecular Characterization of a Peripheral Receptor for Cannabinoids. Nature 1993, 365, 61–65. [Google Scholar] [CrossRef] [PubMed]
  23. Komorowska-Müller, J.A.; Schmöle, A.-C. CB2 Receptor in Microglia: The Guardian of Self-Control. Int. J. Mol. Sci. 2020, 22, 19. [Google Scholar] [CrossRef] [PubMed]
  24. Pagano, C.; Navarra, G.; Coppola, L.; Avilia, G.; Bifulco, M.; Laezza, C. Cannabinoids: Therapeutic Use in Clinical Practice. Int. J. Mol. Sci. 2022, 23, 3344. [Google Scholar] [CrossRef] [PubMed]
  25. Kibret, B.G.; Ishiguro, H.; Horiuchi, Y.; Onaivi, E.S. New Insights and Potential Therapeutic Targeting of CB2 Cannabinoid Receptors in CNS Disorders. Int. J. Mol. Sci. 2022, 23, 975. [Google Scholar] [CrossRef]
  26. Zhang, L.; Wang, X.; Yu, W.; Ying, J.; Fang, P.; Zheng, Q.; Feng, X.; Hu, J.; Xiao, F.; Chen, S.; et al. CB2R Activation Regulates TFEB-Mediated Autophagy and Affects Lipid Metabolism and Inflammation of Astrocytes in POCD. Front. Immunol. 2022, 13, 836494. [Google Scholar] [CrossRef] [PubMed]
  27. Gado, F.; Ferrisi, R.; Polini, B.; Mohamed, K.A.; Ricardi, C.; Lucarini, E.; Carpi, S.; Domenichini, F.; Stevenson, L.A.; Rapposelli, S.; et al. Design, Synthesis, and Biological Activity of New CB2 Receptor Ligands: From Orthosteric and Allosteric Modulators to Dualsteric/Bitopic Ligands. J. Med. Chem. 2022, 65, 9918–9938. [Google Scholar] [CrossRef] [PubMed]
  28. Lane, J.R.; Sexton, P.M.; Christopoulos, A. Bridging the Gap: Bitopic Ligands of G-Protein-Coupled Receptors. Trends Pharmacol. Sci. 2013, 34, 59–66. [Google Scholar] [CrossRef] [PubMed]
  29. Newman, A.H.; Battiti, F.O.; Bonifazi, A. 2016 Philip S. Portoghese Medicinal Chemistry Lectureship: Designing Bivalent or Bitopic Molecules for G-Protein Coupled Receptors. The Whole Is Greater Than the Sum of Its Parts. J. Med. Chem. 2020, 63, 1779–1797. [Google Scholar] [CrossRef]
  30. Millucci, L.; Ghezzi, L.; Bernardini, G.; Santucci, A. Conformations and Biological Activities of Amyloid Beta Peptide 25–35. Curr. Protein Pept. Sci. 2010, 11, 54–67. [Google Scholar] [CrossRef]
  31. Polini, B.; Ricardi, C.; Bertolini, A.; Carnicelli, V.; Rutigliano, G.; Saponaro, F.; Zucchi, R.; Chiellini, G. T1AM/TAAR1 System Reduces Inflammatory Response and β-Amyloid Toxicity in Human Microglial HMC3 Cell Line. Int. J. Mol. Sci. 2023, 24, 11569. [Google Scholar] [CrossRef]
  32. Ciregia, F.; Bugliani, M.; Ronci, M.; Giusti, L.; Boldrini, C.; Mazzoni, M.R.; Mossuto, S.; Grano, F.; Cnop, M.; Marselli, L.; et al. Palmitate-Induced Lipotoxicity Alters Acetylation of Multiple Proteins in Clonal β Cells and Human Pancreatic Islets. Sci. Rep. 2017, 7, 13445. [Google Scholar] [CrossRef] [PubMed]
  33. Barbalace, M.C.; Zallocco, L.; Beghelli, D.; Ronci, M.; Scortichini, S.; Digiacomo, M.; Macchia, M.; Mazzoni, M.R.; Fiorini, D.; Lucacchini, A.; et al. Antioxidant and Neuroprotective Activity of Extra Virgin Olive Oil Extracts Obtained from Quercetano Cultivar Trees Grown in Different Areas of the Tuscany Region (Italy). Antioxidants 2021, 10, 421. [Google Scholar] [CrossRef] [PubMed]
  34. Lacerenza, S.; Ciregia, F.; Giusti, L.; Bonotti, A.; Greco, V.; Giannaccini, G.; D’Antongiovanni, V.; Fallahi, P.; Pieroni, L.; Cristaudo, A.; et al. Putative Biomarkers for Malignant Pleural Mesothelioma Suggested by Proteomic Analysis of Cell Secretome. Cancer Genom. Proteom. 2020, 17, 225–236. [Google Scholar] [CrossRef] [PubMed]
  35. Ciregia, F.; Giusti, L.; Da Valle, Y.; Donadio, E.; Consensi, A.; Giacomelli, C.; Sernissi, F.; Scarpellini, P.; Maggi, F.; Lucacchini, A.; et al. A Multidisciplinary Approach to Study a Couple of Monozygotic Twins Discordant for the Chronic Fatigue Syndrome: A Focus on Potential Salivary Biomarkers. J. Transl. Med. 2013, 11, 243. [Google Scholar] [CrossRef] [PubMed]
  36. Giusti, L.; Angeloni, C.; Barbalace, M.; Lacerenza, S.; Ciregia, F.; Ronci, M.; Urbani, A.; Manera, C.; Digiacomo, M.; Macchia, M.; et al. A Proteomic Approach to Uncover Neuroprotective Mechanisms of Oleocanthal against Oxidative Stress. Int. J. Mol. Sci. 2018, 19, 2329. [Google Scholar] [CrossRef] [PubMed]
  37. Pontifex, M.G.; Connell, E.; Le Gall, G.; Pourtau, L.; Gaudout, D.; Angeloni, C.; Zallocco, L.; Ronci, M.; Giusti, L.; Müller, M.; et al. Saffron Extract (Safr’InsideTM) Improves Anxiety Related Behaviour in a Mouse Model of Low-Grade Inflammation through the Modulation of the Microbiota and Gut Derived Metabolites. Food Funct. 2022, 13, 12219–12233. [Google Scholar] [CrossRef] [PubMed]
  38. Akiyama, H. Inflammation and Alzheimer’s Disease. Neurobiol. Aging 2000, 21, 383–421. [Google Scholar] [CrossRef] [PubMed]
  39. Shi, S.; Liang, D.; Chen, Y.; Xie, Y.; Wang, Y.; Wang, L.; Wang, Z.; Qiao, Z. Gx-50 Reduces β-Amyloid-Induced TNF-α, IL-1β, NO, and PGE 2 Expression and Inhibits NF-κB Signaling in a Mouse Model of Alzheimer’s Disease. Eur. J. Immunol. 2016, 46, 665–676. [Google Scholar] [CrossRef]
  40. Cisbani, G.; Rivest, S. Targeting Innate Immunity to Protect and Cure Alzheimer’s Disease: Opportunities and Pitfalls. Mol. Psychiatry 2021, 26, 5504–5515. [Google Scholar] [CrossRef]
  41. Liu, Y.-Y.; Bian, J.-S. Hydrogen Sulfide Protects Amyloid-β Induced Cell Toxicity in Microglia. J. Alzheimer’s Dis. 2011, 22, 1189–1200. [Google Scholar] [CrossRef]
  42. Ranaivo, H.R.; Craft, J.M.; Hu, W.; Guo, L.; Wing, L.K.; Van Eldik, L.J.; Watterson, D.M. Glia as a Therapeutic Target: Selective Suppression of Human Amyloid-β-Induced Upregulation of Brain Proinflammatory Cytokine Production Attenuates Neurodegeneration. J. Neurosci. 2006, 26, 662–670. [Google Scholar] [CrossRef] [PubMed]
  43. Nixon, R.A. The Role of Autophagy in Neurodegenerative Disease. Nat. Med. 2013, 19, 983–997. [Google Scholar] [CrossRef] [PubMed]
  44. Crino, P.B. The mTOR Signalling Cascade: Paving New Roads to Cure Neurological Disease. Nat. Rev. Neurol. 2016, 12, 379–392. [Google Scholar] [CrossRef] [PubMed]
  45. Tramutola, A.; Triplett, J.C.; Di Domenico, F.; Niedowicz, D.M.; Murphy, M.P.; Coccia, R.; Perluigi, M.; Butterfield, D.A. Alteration of mTOR Signaling Occurs Early in the Progression of Alzheimer Disease (AD): Analysis of Brain from Subjects with Pre-clinical AD, Amnestic Mild Cognitive Impairment and Late-stage AD. J. Neurochem. 2015, 133, 739–749. [Google Scholar] [CrossRef] [PubMed]
  46. Arcella, A.; Biagioni, F.; Antonietta Oliva, M.; Bucci, D.; Frati, A.; Esposito, V.; Cantore, G.; Giangaspero, F.; Fornai, F. Rapamycin Inhibits the Growth of Glioblastoma. Brain Res. 2013, 1495, 37–51. [Google Scholar] [CrossRef] [PubMed]
  47. Ferrucci, M.; Ryskalin, L.; Biagioni, F.; Gambardella, S.; Busceti, C.L.; Falleni, A.; Lazzeri, G.; Fornai, F. Methamphetamine Increases Prion Protein and Induces Dopamine-Dependent Expression of Protease Resistant PrPsc. Arch. Ital. Biol. 2017, 155, 81–97. [Google Scholar] [CrossRef] [PubMed]
  48. Ryskalin, L.; Limanaqi, F.; Biagioni, F.; Frati, A.; Esposito, V.; Calierno, M.T.; Lenzi, P.; Fornai, F. The Emerging Role of M-TOR up-Regulation in Brain Astrocytoma. Histol. Histopathol. 2017, 32, 413–431. [Google Scholar] [CrossRef] [PubMed]
  49. Bellusci, L.; Laurino, A.; Sabatini, M.; Sestito, S.; Lenzi, P.; Raimondi, L.; Rapposelli, S.; Biagioni, F.; Fornai, F.; Salvetti, A.; et al. New Insights into the Potential Roles of 3-Iodothyronamine (T1AM) and Newly Developed Thyronamine-Like TAAR1 Agonists in Neuroprotection. Front. Pharmacol. 2017, 8, 905. [Google Scholar] [CrossRef]
  50. Franco-Juárez, B.; Coronel-Cruz, C.; Hernández-Ochoa, B.; Gómez-Manzo, S.; Cárdenas-Rodríguez, N.; Arreguin-Espinosa, R.; Bandala, C.; Canseco-Ávila, L.M.; Ortega-Cuellar, D. TFEB; Beyond Its Role as an Autophagy and Lysosomes Regulator. Cells 2022, 11, 3153. [Google Scholar] [CrossRef]
  51. Meyer, K.; Kaspar, B.K. Glia–Neuron Interactions in Neurological Diseases: Testing Non-Cell Autonomy in a Dish. Brain Res. 2017, 1656, 27–39. [Google Scholar] [CrossRef]
  52. Rahman, M.; Islam, R.; Yamin, M.; Islam, M.M.; Sarker, M.T.; Meem, A.F.K.; Akter, A.; Bin Emran, T.; Cavalu, S.; Sharma, R. Emerging Role of Neuron-Glia in Neurological Disorders: At a Glance. Oxidative Med. Cell. Longev. 2022, 2022, 3201644. [Google Scholar] [CrossRef] [PubMed]
  53. Diab, R.; Pilotto, F.; Saxena, S. Autophagy and Neurodegeneration: Unraveling the Role of C9ORF72 in the Regulation of Autophagy and Its Relationship to ALS-FTD Pathology. Front. Cell. Neurosci. 2023, 17, 1086895. [Google Scholar] [CrossRef] [PubMed]
  54. Sánchez-Álvarez, M.; Strippoli, R.; Donadelli, M.; Bazhin, A.V.; Cordani, M. Sestrins as a Therapeutic Bridge between ROS and Autophagy in Cancer. Cancers 2019, 11, 1415. [Google Scholar] [CrossRef] [PubMed]
  55. He, F.; Song, Z.-H. Molecular and Cellular Changes Induced by the Activation of CB2 Cannabinoid Receptors in Trabecular Meshwork Cells. Mol. Vis. 2007, 13, 1348–1356. [Google Scholar] [PubMed]
  56. Yang, L.; Li, F.-F.; Han, Y.-C.; Jia, B.; Ding, Y. Cannabinoid Receptor CB2 Is Involved in Tetrahydrocannabinol-Induced Anti-Inflammation against Lipopolysaccharide in MG-63 Cells. Mediat. Inflamm. 2015, 2015, 362126. [Google Scholar] [CrossRef]
  57. Martina, J.A.; Chen, Y.; Gucek, M.; Puertollano, R. MTORC1 Functions as a Transcriptional Regulator of Autophagy by Preventing Nuclear Transport of TFEB. Autophagy 2012, 8, 903–914. [Google Scholar] [CrossRef]
  58. Vega-Rubin-de-Celis, S.; Peña-Llopis, S.; Konda, M.; Brugarolas, J. Multistep Regulation of TFEB by MTORC1. Autophagy 2017, 13, 464–472. [Google Scholar] [CrossRef]
Figure 1. Regulation of TFEB activity, a key transcription molecule regulating autophagy. Intracellular molecules, including PI3K, MAPK, AMPK, and TNFR, possess the capability to activate the mTOR pathway, a prominent negative regulator of autophagy. mTOR, functioning as a kinase, plays a crucial role in regulating the localization and activation of TFEB, a crucial transcription factor, which governs autophagy at the transcriptional level by promoting the expression of multiple lysosomal genes, influencing autolysosome production and function. Specifically, activated mTOR phosphorylates TFEB, inhibiting its activity and confining it to the cytoplasm. Inhibiting mTOR leads to TFEB dephosphorylation, enabling its nuclear translocation and transcriptional activity. Within the nucleus, TFEB regulates autophagy in two ways: promoting the expression of autophagy-related molecules for enhanced autophagy, and activating lysosomal-pathway-related molecules, especially LAMP1, to foster lysosome formation. This orchestrated process facilitates the degradation of damaged organelles, recycling their products, such as amino acids, for cellular benefit.
Cells 13 00875 g001
Figure 2. Overview of the components of the endocannabinoid system (ECS). ECS consists in endogenous endocannabinoids Anandamide (AEA) and 2-Arachidonoylglycerol (2-AG); cannabinoid receptors type 1 (CB1) and type 2 (CB2), and non-cannabinoid receptors GPR55, GPR35, GPR119, GPR18, GPR12, TRPM8, TRPV1, TRPV2, PPAR; enzymes for endocannabinoid synthesis (diacylglycerol lipase (DAGL) and phospholipase C (PLC)) and degradation (monoacylglycerol lipase (MAGL) and fatty acid amide hydrolase (FAAH)), and transporters, including serum albumin, ceramide, cholesterol.
Cells 13 00875 g002
Figure 3. FD22a prevents Aβ25–35-induced damage in HMC3 and U87-MG cell lines. (A) HMC3 and (B) U87-MG cells were treated with FD22a (0.1–20 μM) for 24 h; (C) HMC3 and (D) U87-MG cells were pretreated with FD22a (1 μM) and after 24 h exposed respectively to 1 μM or 10 μM Aβ25–35 for 48 h. In both experimental models, cell viability was quantified by MTT assay. Each bar corresponds to the means ± SEM of at least four independent experiments. Data were analyzed by one-way analysis of variance (ANOVA) followed by Dunnett’s test. § p < 0.05 with respect to vehicle-treated cells (Ctrl). $$$ p < 0.005 respect to Ctrl; *** p < 0.005 with respect to Aβ25–35-treated cells.
Cells 13 00875 g003
Figure 4. FD22a/CB2R system modulates Aβ25–35-mediated secretion of inflammatory cytokines in HMC3 cells. In HMC3 cells, FD22a pretreatment counteracts the release (pg/mL) of proinflammatory TNFα (A) and IL-6 (B) induced by Aβ25–35 and stimulates the secretion of anti-inflammatory IL-10 (C). Each bar corresponds to the means ± SEM of at least three independent experiments. Data were analyzed by one-way analysis of variance (ANOVA) followed by Dunnett’s test. $$$ p < 0.005 with respect to vehicle-treated cells (control cells); *** p < 0.005 with respect to Aβ25–35-treated cells.
Cells 13 00875 g004
Figure 5. FD22a/CB2R system modulates Aβ25–35-mediated release of inflammatory cytokines in U87-MG cells. In U87-MG cells, FD22a pretreatment counteracts the release (pg/mL) of proinflammatory TNFα (A) and IL-6 (B) induced by Aβ25–35 and stimulates the secretion of anti-inflammatory IL-10 (C). Each bar corresponds to the means ± SEM of at least three independent experiments. Data were analyzed by one-way analysis of variance (ANOVA) followed by Dunnett’s test. $$$ p < 0.005 with respect to vehicle-treated cells (control cells); *** p < 0.005 with respect to Aβ25–35-treated cells.
Cells 13 00875 g005
Figure 6. FD22a pretreatment prevents Aβ25–35 deleterious transcriptional effects on autophagy and inflammation. Pretreatment with FD22a significantly modulates transcriptional expression of selected autophagy (ATG)-related (A) and proinflammatory (B) genes. Each bar corresponds to the means ± SEM of at least three independent experiments. Data were analyzed by one-way analysis of variance (ANOVA) followed by Tukey’s test. $$ p < 0.01 with respect to vehicle-treated cells (control cells) $$$ p < 0.005 with respect to vehicle-treated cells (control cells); * p < 0.05 with respect to Aβ25–35-treated cells; ** p < 0.01 with respect to Aβ25–35-treated cells; *** p < 0.005 with respect to Aβ25–35-treated cells.
Cells 13 00875 g006
Figure 7. (A) Representative 2DE image of U87-MG proteome. Protein extracts were separated in a linear pH 3–10 gradient. SDS-PAGE was performed using 12% acrylamide. Gels were stained with fluorescent dye and acquired by ImageQuant TL 7. (B) Venn diagram showing the number of proteins found differentially expressed in the different comparisons: FD22a vs. Ctrl, Aβ25–35 vs. Ctrl, and FD22a + Aβ25–35 vs. Aβ25–35. Both unique and overlapping proteins are reported as numbers (Venny 2.0.2). (C) Scatter plot of fold change (x-axis) against log10 p-value (y-axis) of quantified proteins obtained for FD22a + Aβ25–35 vs. Aβ25–35 comparison. Up-regulated and down-regulated proteins are colored red and blue, respectively. Only proteins that showed both p-value and q-value < 0.05 were identified. Dotted line indicates the threshold of significance. The gene names of identified proteins are shown in the scatter plot.
Cells 13 00875 g007
Figure 8. Box plots of proteins found differentially expressed in the comparison FD22a + Aβ25–35 vs. Aβ25–35. The optical density (OD) of normalized spot volume of the six biological replicates is shown for different conditions (control, FD22a, Aβ25–35, FD22a + Aβ25–35). Data were analyzed by Mann–Whitney test. * p < 0.05, ** p < 0.01, with respect to Aβ25–35.
Cells 13 00875 g008
Figure 9. Functional network derived from QIAGEN’s Ingenuity Pathway Analysis of proteins differentially expressed in the FD22a + Aβ25–35 vs. Aβ25–35 comparison. The network describes functional relationships among proteins based on known associations in the literature. Solid line: direct interaction; dotted line: indirect interaction. Red and green indicate up- and down-regulated proteins, respectively. Orange suggests an activation whereas blue suggests an inhibition. (*) This protein has been identified in many spots. The number below the protein symbol indicates the fold change value of expression.
Cells 13 00875 g009
Figure 10. Western blot detection and quantification of TFEB, p-TFEB (S211), mTOR, and p-mTOR in U87-MG control cells, after the addition of FD22a and after treatment with Aβ25–35 alone and in the presence of FD22a. Each bar graph represents the mean ± SEM of five independent experiments. Optical density of each immunoreactive band was normalized on total protein obtained from RuBP staining. For p-TFEB and p-mTOR the expression level of TFEB and mTOR, respectively, were used as loading control. An unpaired t-test was used to compare differences among treatments (Prism 7; GraphPad Software, San Diego, CA, USA), * p < 0.05, ** p < 0.01, and *** p < 0.001. ns means not significant.
Cells 13 00875 g010
Table 1. Primer sequences for Real-Time PCR experiments.
Reference Sequence
(RefSeq) RNA
Gene SymbolPrimer Sequences
NM_002046GAPDH(F) 5′-CCCTTCATTGACCTCAACTACATG
(R) 5′-TGGGATTTCCATTGATGACAAGC
NM_022818.5LC3(F) 5′-AGTCTTCTCTTCAGGTTCAC
(R) 5′-CTCACACAGCCCGTTTAC
NM_004958.4MTOR(F) 5′-TGCCTTCACAGATACCCAG
(R) 5′-AGACCTCACAGCCACAGA
NM_001282208SIGMAR1(F) 5′-CTTCTACCCAGGGGAGAC
(R) 5′-GCATAGGAGCGAAGAGTAT
NM_001314049.2SIRT1(F) 5′-GGGTTCTTCTAAACTTGGACTCT
(R) 5′-GTAGGCGGCTTGATGGTAAT
NM_054354940.1SIRT5(F) 5′-CAAATCTGGTTTCGTGTGGAC
(R) 5′-AATAACTAAAGCCCGCCTCAA
NM_001193285SIRT6(F) 5′-CTCCTCCGCTTCCTGGTC
(R) 5′-TTACACTTGGCACATTCTTCC
NM_002982.4MCP1(F) 5′-GAGAGGCTGAGACTAACC
(R) 5′-TGATTGCATCTGGCTGAG
NM_001404662NFKB(F) 5′-CCTTTCTCATCCCATCTTT
(R) 5′-CCTCAATGTCCTCTTTCTG
Table 2. List of proteins found differentially expressed in the comparison of U87-MG cells treated with FD22a + Aβ25–35 vs. cells treated with Aβ25–35 identified by LC-MS/MS. ID: SwissProt accession number, MW: molecular weight, pI: isoelectric point.
#IDGeneProtein NameScoreCovPeppIMWp-ValueRatio
FD22a + Aβ25–35/Aβ25–35
996P08238HS90BHeat shock protein HSP 90-beta70964.9783,5430.0050.67
998P07900HS90AHeat shock protein HSP 90-alpha72 *314.9484,6600.0220.71
999P07900HS90AHeat shock protein HSP 90-alpha73 *314.9484,6600.0360.65
999P08238HS90BHeat shock protein HSP 90-beta73 *314.9683,2640.0360.65
1036Q92499DDX1ATP-dependent RNA helicase84 *546.882,4320.0761.29
1178P02545LMNAPrelamin-A/C159 *18126.5774,1400.0051.22
1229P38646HSPA9Stress-70 protein. mitochondrial731165.8773,9200.0081.16
1288O94826TOM70Mitochondrial import receptor subunit TOM7045 *526.8267,4550.0380.79
1518P48643TCPET-complex protein 1 subunit epsilon40 *216.160,5340.1430.77
1645Q13153PAK1Serine/threonine-protein kinase PAK 1591975.5560,8940.0231.35
1730P78371CCT2T-complex protein 1 subunit beta15032116.0157,7940.0001.14
1769Q07960RHG01Rho GTPase-activating protein 136 *315.8550,4360.2490.83
2101Q15019SEPTIN2Septin-2641846.1541,6890.0231.21
2200P04075ALDOAFructose-bisphosphate aldolase A139 *998.3939,4200.0011.26
2396P04083ANXA1Annexin A117439116.5738,9180.0040.92
2896Q9HB71CYBPCalcyclin-binding protein59 *728.3226,2100.0050.79
2956P04792HSPB1Heat shock protein beta-1661645.9822,8260.0060.78
2973P52565ARHGDIARho GDP-dissociation inhibitor 1782965.0223,2500.0091.16
3025P09936UCHL1Ubiquitin carboxyl-terminal hydrolase isozyme L1561935.3325,1510.0011.18
3269P32119PRDX2Peroxiredoxin-2702245.6622,0490.0841.20
3944P23528CFL1Cofilin-11204878.2218,7190.0010.63
*—10lgp-value of samples analyzed by Orbitrap.
Table 3. List of proteins found differentially expressed in the comparison of U87-MG cells treated with FD22a vs. cells without treatment identified by LC-MS/MS. ID: SwissProt accession number, MW: molecular weight, pI: isoelectric point.
#IDGeneProtein NameScoreCovPeppIMWp-ValueRatio FD22a/Ctrl
858P12814ACTN1Alpha-actinin-1821185.25103,5630.01070.70
914P55072VCPTransitional endoplasmic reticulum ATPase19028185.1489,9500.04780.69
1140Q9NTI5PDS5BSister chromatid cohesion protein PDS5 homolog B56798.6716,58180.01290.67
1161P11021HSPA5Endoplasmic reticulum chaperone BiP23736185.0772,4020.00350.68
1199P41250GARS1Glycine--tRNA ligase11621106.6183,8540.00101.37
1205P26038MSNMoesin871486.0867,8920.02421.48
1278P11142HSPA8Heat shock cognate 71 kDa protein891475.3771,0820.02731.28
1301P11142HSPA8Heat shock cognate 71 kDa protein55955.3771,0820.01841.35
1317O75864PPP1R37Protein phosphatase 1 regulatory subunit 3747634.9774,7670.04350.83
1421P61978HNRNPKHeterogeneous nuclear ribonucleoprotein K782075.3951,2300.00171.44
1432P61978HNRNPKHeterogeneous nuclear ribonucleoprotein K15025105.3951,2300.04571.26
1435Q9H6N6MYH16Putative uncharacterized protein MYH166414125.4128,4390.00510.76
1443P61978HNRNPKHeterogeneous nuclear ribonucleoprotein K962385.3951,2300.00691.33
1451Q16555DPYSL2Dihydropyrimidinase-related protein 2581455.9562,7110.00140.77
1461P48643TCPGT-complex protein 1 subunit gamma93 *426.160,5340.00760.82
1461Q16555DPYL2Dihydropyrimidinase-related protein 254 *215.9562,2940.00760.82
1511P08670VIMVimentin14739145.0653,6760.02740.78
1524P10809HSPD160 kDa heat shock protein. mitochondrial20341165.761,1870.03081.17
1610P08670VIMVimentin22148215.0653,6760.01561.20
1641P68371TUBB4BTubulin beta-4B chain14231134.7950,2550.00430.51
1725O43175PHGDHD-3-phosphoglycerate dehydrogenase561266.2957,3560.00051.81
1726P28329CHATCholine O-acetyltransferase73988.983,8520.02820.74
1730P78371CCT2T-complex protein 1 subunit beta15032116.0157,7940.02710.88
1745O00148DDX39AATP-dependent RNA helicase921985.4649,6110.02630.73
1848P48594SERPINB4Serpin B4601255.8644,9970.01921.20
1859P06733ENO1Alpha-enolase611757.0147,4810.04791.29
1864P08670VIMVimentin7029125.0653,6760.00560.48
1877P31930UQCRC1Cytochrome b-c1 complex subunit 1. mitochondrial842775.9453,2970.03971.20
1951P08670VIMVimentin12324105.0653,6760.01170.40
2042O75874IDHCIsocitrate dehydrogenase [NADP] cytoplasmic (IDH) 124 *1776.5345,6590.04910.85
2077Q7L2H7EIF3MEukaryotic translation initiation factor 3 subunit M621545.4142,9320.00911.51
2140Q9UNM6PSMD1326S proteasome non-ATPase regulatory subunit 13861855.5343,2030.04921.16
2365P67775PPP2CASerine/threonine-protein phosphatase 2A catalytic subunit alpha isoform661745.336,1420.04251.24
2464P31942HNRNPH3Heterogeneous nuclear ribonucleoprotein H3701956.3736,9600.02281.36
2491P62879GNB2Guanine nucleotide-binding protein G(I)/G(S)/G(T) subunit beta-2711865.638,0480.00291.43
2595P09525ANXA4Annexin A4591545.8436,0880.01691.32
2637P07951TPM2Tropomyosin beta chain622674.6632,9450.01711.49
2653P06753TPM3Tropomyosin alpha 3 chain701364.6832,9870.00010.68
2720P62258YWHAE14-3-3 protein epsilon793164.6329,3260.00140.54
2806P61981YWHAG14-3-3 protein gamma682754.828,4560.00000.55
2864P63104YWHAZ14-3-3 protein zeta/delta873164.7327,8990.00010.39
2875P17480UBTFNucleolar transcription factor 1591085.6389,6920.02211.34
2884P31946YWHAB14-3-3 protein beta/alpha882764.7628,1790.00090.65
2895P04083ANXA1Annexin A1651646.5738,9180.00121.75
2932O75489NDUFS3NADH dehydrogenase [ubiquinone] iron-sulfur protein 3. mitochondrial742456.9930,3370.01161.28
2997P30041PRDX6Peroxiredoxin-694265625,1330.00460.81
4526P61978HNRNPKHeterogeneous nuclear ribonucleoprotein K952385.3951,2300.03140.76
*—10lgp-value of samples analyzed by Orbitrap.
Table 4. List of proteins found differentially expressed in the comparison of U87-MG cells treated with Aβ25–35 vs. cells without treatment identified by LC-MS/MS. ID: SwissProt accession number, MW: molecular weight, pI: isoelectric point.
#IDGeneProtein NameScoreCovPeppIMWp-ValueRatio
25–35/Ctrl
669P53396ACLYATP-citrate synthase72 *226.95120,8390.01510.76
669P53992SC24CProtein transport protein Sec24C63 *226.71118,3250.01510.76
1099P13798APEHAcylamino-acid-releasing enzyme581275.2982,1420.04851.29
1136P0CG48UBCPolyubiquitin-C49 *217.1677,0390.00070.43
1140Q9NTI5PDS5BSister chromatid cohesion protein PDS5 homolog B56798.67165,8180.00360.43
1149P02545LMNAPrelamin-A/C [Cleaved into: Lamin-A/C (70 kDa lamin) (Renal carcinoma antigen NY-REN-32)]41 *216.5774,1400.01850.55
1178P02545LMNAPrelamin-A/C159 *18126.5774,1400.00510.62
1179P41250GARSGlycine--tRNA ligase79 *336.6183,1660.01441.39
1314P20700LMNB1Lamin-B1801185.1166,6530.03300.74
1317O75864PPP1R37Protein phosphatase 1 regulatory subunit 3747634.9774,7670.00780.58
1331Q9NSD9SYFBPhenylalanine--tRNA ligase beta subunit90 *886.3966,1160.05240.65
1356P31040SDHASuccinate dehydrogenase [ubiquinone] flavoprotein subunit mitochondrial94 *447.0672,6920.00210.54
1432P61978HNRNPKHeterogeneous nuclear ribonucleoprotein K15025105.3951,2300.15401.36
1451Q16555DPYSL2Dihydropyrimidinase-related protein 2581455.9562,7110.00020.86
1461P48643TCPGT-complex protein 1 subunit gamma93 *426.160,5340.00020.87
1461Q16555DPYL2Dihydropyrimidinase-related protein 254 *215.9562,2940.00020.87
2042O75874IDHCIsocitrate dehydrogenase [NADP] cytoplasmic124 *1776.5345,6590.00280.86
2200P04075ALDOAFructose-bisphosphate aldolase A139 *998.3939,4200.00150.77
2896Q9HB71CYBPCalcyclin-binding protein59 *728.3226,2100.00551.32
2997P30041PRDX6Peroxiredoxin-694265625,1330.00020.81
3944P23528CFL1Cofilin-11204878.2218,7190.00090.75
4526P61978HNRNPKHeterogeneous nuclear ribonucleoprotein K952385.3951,2300.00080.78
*—10lgp-value of samples analyzed by Orbitrap.
Disclaimer/Publisher’s Note: The statements, opinions and data contained in all publications are solely those of the individual author(s) and contributor(s) and not of MDPI and/or the editor(s). MDPI and/or the editor(s) disclaim responsibility for any injury to people or property resulting from any ideas, methods, instructions or products referred to in the content.

