
Spatiotemporal Changes of sc-PDSI and Its Dynamic Drivers in Yellow River Basin


1
College of Urban and Environmental Sciences, Northwest University, Xi’an 710127, China
2
Shaanxi Key Laboratory of Earth Surface System and Environmental Carrying Capacity, Northwest University, Xi’an 710127, China
3
School of Urban and Environmental Sciences, Huaiyin Normal University, Huai’an 223300, China
*
Author to whom correspondence should be addressed.
Atmosphere 2022, 13(3), 399; https://doi.org/10.3390/atmos13030399
Submission received: 16 January 2022
/
Revised: 21 February 2022
/
Accepted: 22 February 2022
/
Published: 28 February 2022
(This article belongs to the Special Issue The Water Cycle and Climate Change)
Abstract
:Droughts in the Yellow River Basin (YRB), a typical large river in arid to semiarid regions, have been studied extensively. However, the details of the dynamic drivers of meteorological droughts, such as precipitation (P), reference evapotranspiration (ET0), and actual evapotranspiration (AET), are unclear in the YRB, as is whether or not the main dynamic driver of meteorological drought in each subzone is consistent. In order to solve this issue, we analyzed (1) the seasonal distribution of drought in the YRB and (2) sc-PDSI and dynamic driver’s trends by using linear trends, Sen’s slope, and Z statistics in the YRB from 1951 to 2017; (3) the probability distribution of sc-PDSI, P, ET0, and AET; (4) the correlation of the sc-PDSI with some factors that drive drought; and (5) conducted a Pearson correlation analysis between sc-PDSI and the dynamic drivers at the 0.5° pixel scale. The results show that (1) the northwest region in the YRB was drier than the southeast region, and the drought in spring and winter was more severe than in other seasons. (2) The sc-PDSI showed a downwards trend (−0.47/decade), P and AET also showed a downwards trend (−3.408 mm/decade, −0.27 mm/decade), while ET0 showed a significant upwards trend (12.013 mm/decade) in the YRB. (3) The midstream of the YRB had the highest risk of drought. (4) The P, ET0, and AET were highly correlated with the sc-PDSI on a 12-month timescale. (5) The main dynamic driver of the upstream and downstream drought is P, and the main dynamic driver of the midstream drought was ET0.
1. Introduction
Drought is a multiscale phenomenon and a recurring natural hazard that has attracted increasing attention because it restricts the development of human society and the economy [1,2]. Additionally, drought has devastating impacts on water resources [3,4,5], agriculture [6,7], eco-environmental systems, and human health [8,9,10,11]. Drought is also distributed over an extensive area causing more people to be affected than other natural hazards, such as floods, hurricanes, earthquakes, and tornadoes [12]. In the past few decades, severe drought events have been recorded, such as those of the Yangtze River, the Yellow River, and the Huai River in Northern China, the Horn of Africa, California in the western U.S., Western Africa, East Asia, Central America, the Amazon, and the Mediterranean [13,14,15,16]. Previous research suggests that the risk of drought may increase over many land areas in the 21st century [17].
There is no universal definition of drought worldwide, which leads to obstacles to drought investigations. Therefore, many researchers have made many attempts to investigate drought and agree that drought is characterized by abnormal decreases in precipitation and high-temperature anomalies, and high rates of potential evapotranspiration over a long period [18,19].
Under the background of climate warming, the factors inducing initial meteorological drought are a critical characteristic of drought propagation and are essential for drought prevention and mitigation. Numerous drought indices have been developed to quantify drought events, which can comprehensively describe drought characteristics such as duration, severity, and intensity and can be applied in different regions with different climatic conditions in a single number [20,21]. The commonly used drought indices can be sorted as precipitation indices, water budget indices, soil moisture indices, hydrological, and various aridity indices, all of which indicate water status, including deficiency or surplus of water or even the moisture conditions in a given area [22]. The commonly used indices include the standardized precipitation index (SPI) [23], Palmer drought severity index (PDSI) [24], crop moisture index (CMI) [25], surface water supply index (SWSI) [26], standardized precipitation evapotranspiration index (SPEI) [21], and water surplus variability index (WSVI) [27]. Many studies have suggested that the sc-PDSI has good performance in detecting and evaluating drought in China [28,29,30].
To better cope with drought and alleviate its impacts, it is essential to identify drought driving factors and understand how droughts happen at the atmosphere-land interface. Drought driving factor analysis is an essential prerequisite for studying drought evolution mechanisms, and it is also a strong foundation for drought assessment. Previous studies have shown that the driving force of drought involves one or more factors, such as climate change and anthropogenic activities. The former includes insufficient precipitation, large evapotranspiration, and increased global warming; the latter include overexploitation of water resources, changes in land-use patterns, deforestation, and land degradation [31,32,33]. However, Burke (2006) predicted that the area of the world suffering from extreme drought would expand from 1% to 30% in the 21st century in the context of climate change and variability [34]. The intensity, frequency, and duration of droughts and severe droughts may also increase. Therefore, the drought driving factor caused by climate change, such as precipitation or evapotranspiration, needs more attention. The drought propagation process depends on the degree of water shortage. The first stage is meteorological drought caused by a lack of precipitation, which further propagates into agricultural drought caused by soil moisture deficit and then evolves into hydrological drought caused by a decrease in streamflow, eventually resulting in socioeconomic or ecological drought because of water supply failure to satisfy water demand [35,36,37,38].
The Yellow River Basin (YRB) is an essential agricultural production base in China, supporting more than 114 million people. With rapid population and economic growth, the water resources of the YRB have been overexploited, resulting in a significant decrease in surface runoff in some regions of the basin, which will deepen the impact of hydrological droughts based on meteorological drought [39,40,41]. To explore the physical mechanism of drought, Zhang et al. (2013) studied the influence of abnormal sea-level temperature in the mid-latitudes of the North Atlantic on drought in the YRB [42]. Seager et al. (2005) and Schubert et al. (2009) pointed out that changes in sea surface temperatures have significant influences on land precipitation [43,44]. Omer et al. (2020) hold the view that the environment of the YRB has gradually been converted from a nature-dominated to a human-dominated environment because of high-intensity anthropogenic activities [45]. Therefore, the formation condition of drought is complicated, which is not only the result of the comprehensive influence of climate factors and anthropogenic activities but also related to complex topographic features (such as shady slopes and Sunny slopes, ravines and valleys, valleys and peaks, close to or far from water, and topographical factors such as foothills and slopes) [45]. In addition to climate, topography, soil, and vegetation are the main factors affecting the partitioning of rainfall into runoff and evapotranspiration [46]. Some studies focused on drought sensitivity caused by climate change on a large scale and found sc-PDSI is more sensitive to P than to ET0 on the national scale, except for northeastern China [47]. Among these previous studies, more efforts have been focused on the driving factors and the evolution of drought. However, few studies have focused on whether drought is equally sensitive to AET, P, or ET0; research on the driving factors of drought lacks a more detailed discussion in YRB.
In this study, a framework that consisted of this paper comprehensively evaluated the main driving factor of drought based on the CRU dataset and sc-PDSI index in the YRB from 1951 to 2017. The primary aims of this study include (1) analyzing the spatial and temporal variability of seasonal drought based on sc-PDSI, (2) identifying the characteristics of drought and their driving factors, (3) calculating the correlation coefficient of the sc-PDSI with P, ET0 and AET by using the correlation analysis method at the grid level, and (4) evaluating the sensitivity of P, ET0, and AET to sc-PDSI to explore the leading factors that cause meteorological drought and quantify how large their effect on drought. The findings can provide a scientific foundation for the sensitivity assessment of P, ET0, and AET to sc-PDSI and deliver vital and valuable information for local drought early warning under changing environments.
2. Study Area and Data
2.1. The Yellow River Basin (YRB)
The Yellow River is the second-longest river in China, which has a total area of 795,000 km2 and flows through nine provinces, i.e., Qinghai, Sichuan, Gansu, Ningxia, Inner Mongolia, Shaanxi, Shanxi, Henan, and Shandong. The geomorphological types in the watershed are complex, including three descending stages and four geomorphic units (Figure 1). The first stage consists of the Qinghai–Tibet Plateau, the second stage is primarily located on the Inner Mongolia Plateau and Loess Plateau, and the third stage primarily consists of alluvial plains from west to the east with a drop of 4480 m [48,49]. The climate in the YRB changes dramatically with the terrain, which is dominated by arid and semiarid continental monsoon climates, including a dry climate in the northwest and a semiarid climate in the middle and semi-humid and humid climates in the southeast, accounting for 11.7%, 28.2%, 54.8% and 5.3% of the basin area, respectively [50,51]. Due to differences in climatic types and topographies, precipitation and potential evapotranspiration distributions exhibit significant regional discrepancies. The annual rainfall ranges from 123 mm to 1021 mm, and the yearly pan evaporation ranges from 700 to 1800 mm, both of which increase from the northwest to the southeast in the YRB [52]. The annual distribution of precipitation in the YRB is less than the potential evapotranspiration, with a normal distribution (Figure 2). Under the influence of climate change and human activities, frequent droughts in the YRB have brought great challenges to local water resources, energy, food, and ecological security [39,53].
2.2. Datasets
In this study, sc-PDSI was used for drought identification and calculated the correlation between sc-PDSI and P, ET0, and AET at a monthly temporal resolution from 1951 to 2017. This data was obtained from CRU TS4.03 with a spatial resolution of 0.5° × 0.5°, which was compiled and processed by the British Ministry of East Anglia’s Climatic Research University (CRU). The CRU TS dataset has been recognized and adopted by the Intergovernmental Panel on Climate Change (IPCC), as it has the advantage of strict time uniformity tests in data reconstruction and higher spatial resolution [54], which has also been widely used in the study of drought and climate change assessment [55]. ET0 in the TS4.03 dataset was obtained using the FAO-56 Penman–Monteith equation. AET was obtained according to the Budyko equation based on precipitation and potential evapotranspiration. Table 1 shows the classification of drought based on sc-PDSI values.
3. Methodology
3.1. Trend Analysis
The trend analysis of the 1951–2017 sc-PDSI data of the Yellow River Basin was conducted by pixel-based linear regression analysis. The formula is
where n is the number of years (time series is 1951–2017, n = 67), is the sc-PDSI of each pixel point in the study area in the -th year, and the slope is the pixel of the research area in 1951–2017. The slope of the linear regression equation of the interannual variation of the point sc-PDSI, that is, the rate of change of the trend, reflects the overall direction of sc-PDSI during the study period. Slope > 0 indicated that the overall evolution of the sc-PDSI showed an increasing trend, and slope < 0 suggests that the overall change in the sc-PDSI showed a decreasing trend.
3.2. The Modified Mann–Kendall (MMK) Trend Detection Method
The modified Mann–Kendall (MMK) trend test method based on the traditional Mann–Kendall (MK) trend test can detect the trend characteristics of time series and eliminate the autocorrelation components in the time series. Therefore, this study adopted the MMK method to investigate the trend characteristics of hydrological drought on the annual scale in the YRB during 1951–2017. The MMK test statistic Z is generally used to identify whether the trend of a time series is consistently decreasing or increasing. In this study, trend significance was tested at the α = 0.05 (1.96 ≤ |Z| < 2.58) and α = 0.01 (|Z| ≥ 2.58) significance levels. Positive values of the Z statistic indicate trends upwards over the whole time series, whereas negative values of the Z statistic indicate downwards trends over the entire time series.
3.3. Calculation of AET
The Budyko water–energy balance equation is suggested to be an efficient approach to simulate the regional AET [56]; it is widely used to study water and energy balances in the YRB [46,57] and is expressed as:
where , , and are the annual actual areal evapotranspiration, precipitation, and potential evapotranspiration of the YRB, respectively; i ranges from 1951 to 2017 in this study.
3.4. Correlation Analysis
Based on the pixel scale, this paper studies the correlation between sc-PDSI and key factors of the hydrological cycle in the Yellow River Basin. Among them, the calculation of the relevant analysis, the formula is:
where n is the number of years; is the linear correlation coefficient of the two influencing Factors , , , and are the values of the two influencing factors and in the -th year (i = 1951, 1952 …, 2017); and are the average values of the two influencing factors years, respectively.
4. Results
4.1. Seasonal Distribution of Drought in the YRB
The drought in spring and winter was more severe than in other seasons, and the inflow zone (Kubuqi Desert and the Mu Us Desert in YRB) always occupied the center of drought (Figure 3). In summer and autumn, the spatial distribution of drought presented a strip-like change from southeast to northwest, showing obvious spatial differentiation. However, due to the precipitation brought by the summer monsoon in the midstream and downstream of the YRB, that is, the southeastern part of the basin, drought rarely occurs in summer. Additionally, in autumn, as the precipitation belt moves further to the northwest, the drought range also moves to the northwest accordingly. The drought in the northwest of the basin, especially on the Loess Plateau, was more serious than that in the southeast, consistent with the results of related studies [58,59,60].
4.2. Regional Trends in sc-PDSI and the Key Hydrological Cycle Factor
The drought index showed an increasing trend of 0.061/decade in the upstream, while the midstream and downstream and the whole basin had decreasing trends of −0.173/decade, −0.03/decade, and −0.047/decade, respectively (Figure 4). The above results showed that the river headwaters show a trend of humidification. In contrast, the linear tendency rate of sc-PDSI in the midstream and downstream showed a downwards trend, which indicated that drought was aggravating. Related research holds the same view that the loess plateau area of the entire watershed, especially the upstream of the Ningxia River Tao Plain, the midstream of the Fenwei Basin, and the irrigation area in the downstream of the YRB, all show a more significant trend of drought [61].
Consistent with the sc-PDSI change trends, the P in the upstream exhibited increasing trends of 0.536 mm/decade, and the P in the midstream, downstream, and the whole basin showed decreasing trends of −7.109/10a, −3.651 mm/decade, and −3.408 mm/decade, respectively. Therefore, the P exhibited consistent trends with sc-PDSI in the whole basin. P indicated the incoming water in a basin, while AET subjected to both moisture and ET0 reveals the dewatering of a region. AET in the subbasin and the whole basin showed inconsistent trends, where AET in upstream and downstream showed increasing trends of 0.932 mm/decade and 0.593 mm/decade, respectively, while AET in the midstream and in the whole basin showed decreasing trends of −2.337 mm/decade and −0.27 mm/decade, respectively. However, it was found that ET0 in the upstream, midstream, downstream, and the whole basin all demonstrated significant increasing trends of 8.845 mm/decade, 13.649 mm/decade, 13.546 mm/decade, and 12.013 mm/decade, respectively.
On the subbasin scale, both the S and Z of the sc-PDSI in the upstream showed a significant increasing trend (Table 2), which means that droughts in the upstream have become less severe in recent decades. However, P, ET0, and AET also showed a positive trend, among which ET0 and AET passed the significance test, and P failed to pass the significance test. The S and Z value of sc-PDSI and P was less than zero and passed the significance test of 0.05 and 0.01, respectively, which indicated increased drought and less precipitation in recent decades. In addition, drought showed an insignificant aggravation trend, and ET0 showed a significant increasing trend in the downstream. On the whole basin scale, the S and Z values of the sc-PDSI were −0.002 and −0.72, respectively, indicating that drought increased in the YRB. The trend characteristic S and Z values failed to pass the significance test of α = 0.05, indicating that drought generally showed a nonsignificant upwards trend in the YRB.
4.3. The Probability Distribution of sc-PDSI, P, ET0 and AET
The probability distributions of sc-PDSI and dynamic drivers on a yearly scale from 1951 to 2017 were plotted (Figure 5). At the same probability, whether it was P, ET0, or AET, the upstream was less than the midstream and downstream, among them, the P was between 240 and 450 mm in the upstream, 340 to 760 mm in the, and 430 to 1100 mm in the downstream. ET0 also showed a law of increasing order from the upstream to the downstream. The ET0 ranged from 800 to 940 mm upstream, 790 to 1100 mm midstream, and 890 to 1200 mm downstream. AET was consistent with P and ET0, between 220 and 390 mm upstream, 320 to 530 mm midstream, and 400 to 690 mm downstream. The probability plot distribution of sc-PDSI in the three subbasins was relatively concentrated, not as scattered as P, ET0, and AET.
The probability of extreme, severe, moderate, and mild drought increases sequentially (Figure 6). The fit curve of sc-PDSI presents a normal distribution, the probability of moderate and severe drought was between 0.07% and 10%, and the probability of mild drought ranges from 10% to 25%. From the perspective of the spatial distribution of different drought classifications, the probability of moderate and severe drought in the downstream was more significant than that in the upstream and midstream, and the midstream was more prone to mild drought, while the river source area was relatively humid. Although the probability of severe and moderate drought in the downstream was higher than that in the midstream, the probability of mild drought in the midstream was higher. In addition, the probability of mild drought is much higher than the incidence of severe and moderate drought in the YRB. Therefore, the drought risk upstream was smaller than that in the other parts of the basin, and the drought risk in the midstream was highest in the YRB. This result was similar to related research, which also concluded that the midstream of the YRB has the highest risk of drought [39].
4.4. Impacts of Key Hydrological Cycle Elements on Drought at Different Time Scales
P, ET0, and AET were key hydrological cycle elements that promote the development of the hydrological cycle, which had a great impact on drought in the basin. P, ET0, and AET showed a significant correlation with sc-PDSI at different time scales in the YRB (Table 3).
The different time scales were 1 month, 3 months, 6 months, 9 months, 12 months, 15 months, and 18 months. It was found that (1) the P and AET have a positive correlation with sc-PDSI, and the ET0 has a negative correlation with sc-PDSI; (2) In general, an increasing trend was seen in the Pearson’s correlation coefficient within 12 months, and the significance decreased gradually over the time scale of more than 12 months; (3) On a 12-month timescale, the sc-PDSI was more sensitive to P than to ET0 and AET. The Pearson’s correlation coefficient between sc-PDSI and P reached 0.74, 0.78, and 0.69 upstream, midstream, and downstream, respectively, and passed the significance test at the 0.01 level. (4) The correlation coefficient between sc-PDSI and P (ET0, AET) was the highest at the 12-month timescale, which indicated that sc-PDSI was susceptible to ET0, P, and AET at a longer time scale.
4.5. Identification of Influence Factors on Drought
A Pearson correlation analysis was conducted between the sc-PDSI and P, ET0, AET at the 0.5°pixel scale (Figure 7). It was found that the sc-PDSI of the YRB was positively correlated with P, which was consistent with Figure 4. The highest correlation coefficient reached 0.77, the lowest correlation coefficient was 0.21, and the average correlation coefficient was 0.58. The areas with a significant positive correlation accounted for 44% of the basin, mainly distributed in the Lanzhou to Hekou upstream and the Inflow Zone of the Hekou Town to Longmen Gorge, Longmen Gorge to Sanmen Gorge in the midstream. In contrast, a significant negative correlation was shown between the sc-PDSI and ET0 on an annual timescale, and most of the YRB (>95%) showed a negative correlation except for the source area of the YRB, especially Longyang Gorge in the upstream.
The correlation between sc-PDSI and ET0 showed a positive correlation in the river source area and indicated a significant negative correlation in the midstream, with a correlation coefficient of −0.78. The areas from the river source area to the downstream showed a noticeable reduction in the significant positive correlation and gradually succeeded from a positive correlation to a negative correlation. From the spatial distribution, strong correlation, moderate correlation, and weak correlation between sc-PDSI and ET0 accounted for 24%, 45%, and 17% of the total areas, respectively. The mean correlation between sc-PDSI and ET0 was −0.45 in the YRB.
Similar to the relationship between the sc-PDSI and P, the AET also showed a significant positive correlation with the sc-PDSI. The highest positive correlation coefficient reached 0.74, and the average value of the whole basin was 0.55. Strong positive correlation and moderate positive correlation areas account for 65% and 33%, respectively. Only 2% of the basin showed a weak positive correlation.
To further analyze the seasonal difference in the relationship between drought and hydrological cycle factors, the correlations between sc-PDSI and P, ET0 and AET were calculated for each pixel at a seasonal scale. The correlation coefficient between sc-PDSI and P is highest in summer, reaching 0.54, followed by autumn, spring, and winter, with correlation coefficients of 0.50, 0.46, and 0.17, respectively. In contrast, sc-PDSI was negatively correlated with ET0, with the highest correlation coefficient of −0.48 in autumn, followed by summer, spring, and winter, with correlation coefficients of −0.40, −0.31, and −0.17, respectively. sc-PDSI was positively correlated with AET, with the highest correlation coefficient of 0.45 occurring in summer and autumn, followed by spring with a correlation coefficient of 0.35 and the smallest correlation coefficient of 0.15 in winter.
4.6. Spatial Variation of Primary Drought Influencing Factor
Identifying the dominant dynamic driver that mainly affected the sc-PDSI can help us to better understand the causes of drought and develop effective drought mitigation measures. From the perspective of the hydrological cycle, the dynamic drivers of meteorological drought include P, ET0, and AET. Precipitation was the primary water input, and ET0 and AET were the leading causes of water loss. So, we performed the comparison after the correlation analysis. Specifically, the spatial correlation coefficients of sc-PDSI and P, ET0, and AET from 1951 to 2017 are calculated and then compared in pairs, and finally, the results of the comparison are sorted so as to obtain the main driving factor of drought.
The driving effects of ET0 and P in the drought of the YRB indicate that the ratio of the basin affected by ET0 to the area affected by P was 1:2 (Figure 8a). AET was the dominant factor in the source area of the YRB, and the remaining basins were more affected by P. The area affected by AET to the area affected by P was 1:6 (Figure 8b). The midstream was more affected by ET0, while the upstream was affected by AET (Figure 8c) because extreme drought and cold climates restrained evapotranspiration in the upper reach of the YRB [62]. ET0 was the main dynamic driver of the YRB, accounting for 58% of the total watershed area, and the watershed area with AET as the main driving factor accounts for 42%. In summary, the dynamic driver of upstream and downstream was ranked as follows: P > AET > ET0, and the order of dynamic driving factors in midstream is ET0 > P > AET. The main driving factor of the upstream and downstream drought was P, and the main influencing factor of the midstream drought was ET0.
Judging from the scale of the season, except winter, P had the most significant effect on drought, of which P was the most obvious in summer and autumn. P, ET0, and AET had roughly the same effect on drought in the spring. In the comparison of P and ET0, the total watershed influenced by P accounts for 51%, and the area influenced by ET0 accounts for 49%. In the comparison between ET0 and AET, the area where ET0 had the main influence accounted for 49%, and the area where AET has the primary influence accounted for 51%. Therefore, the area where ET0 played the leading role was concentrated in the midstream, and the dominant factor upstream and downstream was P.
Unlike spring, in summer and autumn, the drought area affected by ET0 and AET gradually shrunk. However, the range of droughts affected by P was expanding. The drought area affected by P increased by 43% and 37% in summer and autumn, respectively, in the comparison of the effects of P and ET0 on drought. The drought area affected by P increased by 37% and 17% in summer and autumn, respectively, in the comparison of the effects of P and AET on drought. Therefore, the order of the influence of P, ET0, and AET on the drought index in summer and autumn was P > AET > ET0. While both P and ET0 decrease with decreasing temperature in winter, and the main factor affecting sc-PDSI is AET, because of the decrease in winter precipitation, evapotranspiration was also weakened by the drop in temperature.
5. Discussion
5.1. Causes of Drought in the YRB
The YRB is located in the northern and western regions of the monsoon climate zone. Summer precipitation is affected not only by mid-high latitude circulation but also by the Asian monsoon. Generally, meteorological drought showed an increasing trend in the YRB during 1951–2017, especially since the 1990s. The decline in precipitation (−5.123 mm/decade) and the rise in temperature (0.316 °C/decade) are the leading causes of drought in the YRB [63,64]. Additionally, global warming aggravates the El Niño-Southern Oscillation (ENSO) phenomenon, which is strongly correlated with AET, thus strongly impacting the propagation time of drought and leading to the uneven temporal and spatial distribution of P and AET in the YRB [65], which has differentiated impacts on runoff increment changes and increases the possibility of drought disasters [66]. In addition to the effects of global climate change, the YRB has also suffered from severe impacts of human activities, such as reservoir construction, soil and water conservation, irrigation diversion, sustained population growth, rapid economic development, river cut-off, vegetation coverage reduction, and groundwater level decline, which have a more significant impact on drought [40]. Some research indicates that human activities have become the dominant influencing factor on the decrease in runoff increment changes in YRB, which may increase the probability of hydrological drought [40].
Whether the distribution of drought and its impact factors within the YRB are consistent is the second issue we were committed to solving. From a watershed perspective, it can be seen that the upstream is dominated by increasing annual precipitation, and decreasing annual precipitation in the midstream and downstream was observed, which may, to a certain degree, increase the risk of droughts in the midstream and downstream. Thus, higher risks of droughts may be expected in the middle and lower YRB. In recent years, the Loess Plateau in the YRB had continuously implemented the ‘Grain for Green Project’ (GGP), and the vegetation coverage had constantly been improved. As a result of the GGP, the land cover patterns of the Loess Plateau have experienced a remarkable change since 1999. By the end of 2008, the area of cropland had decreased from 41% to nearly 30% of the total area of the plateau, and the area of grassland had decreased from 36% to over 43% of the total plateau area. However, the woodland area increased from 12% to approximately 16% of the total plateau area [67], and the underlying surface has undergone tremendous changes, affecting the local reflectivity, temperature, evapotranspiration, etc. In the past four decades, precipitation rates have significantly decreased in the central and southern areas of the plateau [68,69,70]. Wang et al. (2011) constructed a multiannual water balance to estimate the average annual AET and runoff for forestlands and non-forestlands of 57 basins and found that the annual AET increased due to vegetation restoration on the Loess Plateau [71]. These results are consistent with the conclusions of this study that the decrease in precipitation and the increase in potential evapotranspiration have increased the drought trend in the midstream of the YRB.
5.2. The Relationship between AET and ET0
The YRB involves parts of the Qinghai–Tibet Plateau, the eastern monsoon region, and the western arid region. The occurrence and evolution of meteorological drought are complex and diverse. The correlation between ET0 and AET showed a significant regional differentiation pattern across the country (Figure 9), especially in the north and south. The Qinling–Huaihe River is the north–south boundary line of China, which is the dividing line between the semi-humid and semiarid areas and the precipitation line of 600 mm. Taking the Qinling–Huaihe River line as the boundary, the relationship between ET0 and AET was significantly different. There was a significant positive correlation on the south side of the Qinling–Huaihe line and a significant negative correlation on the north side. The occurrence of the meteorological drought was more likely to be induced by changes in AET in the north of the Qinling–Huaihe River. To the south of the Qinling–Huaihe River, it was more likely to be caused by changes in ET0.
Why do the abovementioned diametrically opposite situations appear in different geographical spaces? The underlying reason could be traced back to the mechanism of evaporation. In the arid region, there was a roughly complementary relationship between AET and ET0. ET0 was much greater than P, so the AET was limited by the moisture on the surface of the land, resulting in a decrease in AET and an increase in ET0. As a result, on the one hand, AET in the arid region was controlled by P, and almost all P evaporated in the form of AET. However, ET0 and AET showed a negative correlation, and the correlation coefficient reached a maximum of −0.78. In contrast, in humid or water-rich areas, such as the south side of the Qinling–Huaihe line and the source region of the YRB, there was a positive correlation between ET0 and AET, and the correlation coefficient was up to 0.97, so the AET was controlled by ET0. These results were largely consistent with those reported in the literature [72].
In general, in arid and semiarid regions, AET is water controlled, and semi-humid and humid areas are energy controlled. The YRB is in the north of the Qinling–Huaihe River, so most of the watersheds were water-limited areas, while the source region of the YRB was relatively particular and was located on the Qinghai–Tibet Plateau at a high altitude. Although P shows an increasing trend in the source area of the YRB, it still has a strong evaporation capacity and is more energy-limited. Therefore, AET showed an upwards trend, which was consistent with previous research conclusions [57]. In summary, it was better to understand why the aridification trend in the source region of the YRB was further increased under the premise of increasing precipitation.
However, for the entire basin, rising ET0 was one of the factors causing frequent droughts. Li et al. (2012) concluded that ET0 showed a significant increase on the Loess Plateau because of the higher temperature and lower relative humidity, which was well matched with our study [57]. However, many previous studies using different data sources found that the annual mean reference evapotranspiration had a declining trend [57,73].
5.3. The Impact of the Relationship between AET and P on Meteorological Drought
Based on Budyko’s water–energy balance theory, the AET was mainly influenced by two factors: one of the factors was the availability of energy on the land surface, and the other was the availability of water on the land surface.
Therefore, we further analyzed the correlation between AET and P in China (Figure 10), the Yangtze River Basin, the Pearl River Basin, and some rivers in the southeast that showed a negative correlation, and the AET delivered apparent energy control. Most of the northern river basins, including the YRB, showed a positive correlation, indicating that the AET was limited by water. Therefore, the AET and P presented a similar spatial distribution pattern, which suggested that the AET showed a decreasing trend from the southeast to the northwest, and the occurrence and development of meteorological drought were affected by the combined effects of P, AET, and ET0. The meteorological drought had a time lag effect on P, with different time lags in each subzone of the YRB.
Further analysis of the relationship between AET and P in the YRB (Figure 11) shows that as precipitation gradually increases from northwest to southeast, the dependence of AET on precipitation gradually becomes weaker; when the precipitation line exceeds 400 mm, the AET was mainly affected by energy.
6. Conclusions
In this study, sc-PDSI was used as a meteorological drought index, and the temporal and spatial distributions of meteorological drought were comprehensively evaluated in the YRB from 1951 to 2017. Based on the linear trend, Sen’s slope, and Z statistic, we analyzed the sc-PDSI and driving factor trends. Additionally, the probability distribution of sc-PDSI, P, ET0, and AET and the correlation of the sc-PDSI with some factors that drive drought were quantitatively identified. Finally, a Pearson correlation analysis was conducted between the sc-PDSI and the multiple meteorological factors at the 0.5° pixel scale. From the results, major conclusions are given as follows:
- The annual sc-PDSI decreased from the southeast to the northwest region in the YRB, which shows remarkable spatial variation in different seasons. The northwest region in the YRB was drier than the southeast region in every season, and the drought in spring and winter was more severe than in other seasons.
- sc-PDSI showed a downwards trend (−0.47/decade), P and AET also showed a downwards trend (−3.408 mm/decade, −0.27 mm/decade), while ET0 showed a significant upwards trend (12.013 mm/decade) by using a linear trend. sc-PDSI and P exhibited a downwards trend by using Sen’s slope and Z statistic (−0.002 and −0.72, respectively, −0.17 and −1.16, respectively), while both ET0 and AET showed upward trends by using Sen’s slope and Z statistic, which were different from the linear trend test method. This may be due to the significant increase in AET in the upper reaches of the YRB, leading to an insignificant increase in AET in the entire YRB.
- The probability of moderate and severe drought in the lower reaches was greater than that in the upper and middle reaches. The midstream area was more prone to mild drought, while the river source area was relatively humid. Although the probability of severe and moderate drought in the lower reaches was higher than that in the middle reaches, the middle reached of the YRB have the highest risk of drought.
- The main driving factor of the upstream and downstream drought was P. The main influencing factor of the midstream drought was ET0. The driving factors for drought upstream and downstream were ranked as follows: P > AET > ET0; the driving factors of midstream drought were ET0 > P > AET.
However, the ET0 in CRU TS4.03 was derived using time-invariant wind speed data. Yet, in fact, the wind speed has changed greatly in the past few decades, so there will be great uncertainty in the data of potential evapotranspiration, which is the direction that the follow-up research of the article needs to improve upon.
Author Contributions
Funding acquisition, W.L.; Writing—original draft, W.L.; Writing—review and editing, Y.Z. All authors have read and agreed to the published version of the manuscript.
Funding
This research was funded by the National Natural Science Foundation of China (Grant No. 41901110; 41907384).
Conflicts of Interest
The authors declare no conflict of interest.
References
- Schwalm, C.R.; Anderegg, W.R.L.; Michalak, A.M.; Fisher, J.B.; Biondi, F.; Koch, G.; Litvak, M.; Ogle, K.; Shaw, J.D.; Wolf, A. Global patterns of drought recovery. Nature 2017, 548, 202–205. [Google Scholar] [CrossRef] [PubMed]
- Wilhite, D.A. Drought as a Natural Hazard: Concepts and Definitions; Routledge: London, UK, 2000. [Google Scholar]
- Huang, L.; Zhou, P.; Cheng, L.; Liu, Z. Dynamic drought recovery patterns over the Yangtze River Basin. Catena 2021, 201, 105–194. [Google Scholar] [CrossRef]
- Zhang, Z.; Chen, X.; Xu, C.Y.; Hong, Y.; Hardy, J.; Sun, Z. Examining the influence of river–lake interaction on the drought and water resources in the Poyang Lake basin. J. Hydrol. 2015, 522, 510–521. [Google Scholar] [CrossRef]
- Below, R.; Grover-Kopec, E.; Dilley, M. Documenting Drought-Related Disasters A Global Reassessment. J. Environ. Dev. 2007, 16, 328–344. [Google Scholar] [CrossRef]
- Gan, T.Y.; Ito, M.; Hülsmann, S.; Qin, X.; Lu, X.; Liong, S.Y.; Rutschman, P.; Disse, M.; Koivusalo, H.; Huelsmann, S.; et al. Possible climate change/variability and human impacts, vulnerability of drought-prone regions, water resources and capacity building for Africa. Hydrol. Sci. J. 2016, 61, 1209–1226. [Google Scholar] [CrossRef]
- Cammalleri, C.; Vogt, J.; Salamon, P. Development of an operational low-flow index for hydrological drought monitoring over Europe. Hydrol. Sci. J. 2016, 62, 346–358. [Google Scholar] [CrossRef] [Green Version]
- Hoerling, M.; Kumar, A.; Dole, R.; Nielsen-Gammon, J.W.; Eischeid, J.; Perlwitz, J.; Quan, X.W.; Zhang, T.; Pegion, P.; Chen, M. Anatomy of an Extreme Event. J. Clim. 2013, 26, 2811–2832. [Google Scholar] [CrossRef]
- Kenney, D. Drought and Water Crises: Science, Technology, and Management Issues; CRC Press: Boca Raton, FL, USA, 2005. [Google Scholar]
- Rojas, O. Agricultural extreme drought assessment at global level using the FAO-Agricultural Stress Index System (ASIS). Weather Clim. Extremes 2018, 27, 100184. [Google Scholar] [CrossRef]
- Delbiso, T.D.; Rodriguez-Llanes, J.M.; Donneau, A.F.; Speybroeck, N.; Guha-Sapir, D. Drought, conflict and children’s undernutrition in Ethiopia 2000–2013: A meta-analysis. Bull. World Health Organ. 2017, 95, 94–102. [Google Scholar] [CrossRef]
- Wilhite, D.; UNISDR. Drought: A Global Assessment; Routledge: London, UK, 2000. [Google Scholar]
- Zhang, J.; Chen, H.; Zhang, Q. Extreme drought in the recent two decades in northern China resulting from Eurasian warming. Clim. Dyn. 2019, 52, 2885–2902. [Google Scholar] [CrossRef] [Green Version]
- Tierney, J.E.; Ummenhofer, C.C.; Demenocal, P.B. Past and future rainfall in the Horn of Africa. Sci. Adv. 2015, 1, e1500682. [Google Scholar] [CrossRef] [PubMed] [Green Version]
- Mao, Y.; Nijssen, B.; Lettenmaier, D.P. Is climate change implicated in the 2013–2014 California drought? A hydrologic perspective. Geophys. Res. Lett. 2015, 42, 2805–2813. [Google Scholar] [CrossRef]
- Spinoni, J.; Naumann, G.; Carrao, H.; Barbosa, P.; Vogt, J. World drought frequency, duration, and severity for 1951–2010. Int. J. Climatol. 2014, 34, 2792–2804. [Google Scholar] [CrossRef] [Green Version]
- Dai, A. Increasing drought under global warming in observations and models. Nat. Clim. Chang. 2013, 3, 52–58. [Google Scholar] [CrossRef]
- Mishra, A.K.; Singh, V.P. A review of drought concepts. J. Hydrol. 2010, 391, 202–216. [Google Scholar] [CrossRef]
- Van Loon, A.F. Hydrological drought explained. Wiley Interdiscip. Rev. Water 2015, 2, 359–392. [Google Scholar] [CrossRef]
- Beguería, S.; Vicente-Serrano, S.M.; Angulo-Martínez, M. A multiscalar global drought dataset: The SPEIbase: A new gridded product for the analysis of drought variability and impacts. Bull. Am. Meteorol. Soc. 2010, 91, 1351–1354. [Google Scholar] [CrossRef] [Green Version]
- Vicente-Serrano, S.M.; Beguería, S.; López-Moreno, J.I. A multiscalar drought index sensitive to global warming: The standardized precipitation evapotranspiration index. J. Clim. 2010, 23, 1696–1718. [Google Scholar] [CrossRef] [Green Version]
- Szép, I.J.; Mika, J.; Dunkel, Z. Palmer drought severity index as soil moisture indicator: Physical interpretation, statistical behaviour and relation to global climate. Phys. Chem. Earth 2005, 30, 231–243. [Google Scholar] [CrossRef]
- McKee, T.B.; Doesken, N.J.; Kleist, J. The relationship of drought frequency and duration to time scales. In Proceedings of the 8th Conference on Applied Climatology, Boston, MA, USA; 1993; pp. 179–183. [Google Scholar]
- Palmer, W.C. Meteorological Drought; US Department of Commerce, Weather Bureau: Washington, DC, USA, 1965; Volume 30.
- Palmer, W.C. Keeping track of crop moisture conditions, nationwide: The new crop moisture index. Weatherwise 1968, 21, 156–161. [Google Scholar] [CrossRef]
- Shafer, B.A.; Dezman, L.E. Development of a Surface Water Supply Index (SWSI) to assess the severity of drought conditions in snowpack runoff areas. In Proceedings of the Eastern Snow Conference, 39th Annual Meeting, Reno, Nevada, 19–23 April 1982. [Google Scholar]
- Gocic, M.; Trajkovic, S. Water surplus variability index as an indicator of drought. J. Hydrol. Eng. 2015, 20, 04014038. [Google Scholar] [CrossRef]
- Wei, J.; Ma, Z.G. Comparison of Palmer Drought Severity Index, Percentage of Precipitation Anomaly and Surface Humid Index. Acta Geogr. Sin. 2003, 52, 117–124. [Google Scholar]
- Lu, H.; Mo, X.; Liu, S. Intercomparison of three indices for addressing drought variability in North China Plain during 1962−2012. Proc. Int. Assoc. Hydrol. Sci. 2015, 366, 141–142. [Google Scholar] [CrossRef]
- Zhao, H.; Gao, G.; An, W.; Zou, X.; Li, H.; Hou, M. Timescale differences between sc-PDSI and SPEI for drought monitoring in China. Phys. Chem. Earth 2017, 102, 48–58. [Google Scholar] [CrossRef]
- Zhao, T.; Dai, A. The Magnitude and Causes of Global Drought Changes in the Twenty-First Century under a Low–Moderate Emissions Scenario. J. Clim. 2015, 28, 4490–4512. [Google Scholar] [CrossRef]
- Zhao, M.; Running, S.W. Drought-induced reduction in global terrestrial net primary production from 2000 through 2009. Science 2010, 329, 940–943. [Google Scholar] [CrossRef] [Green Version]
- Mishra, A.K.; Singh, V.P. Drought modeling–A review. J. Hydrol. 2011, 403, 157–175. [Google Scholar] [CrossRef]
- Burke, E.J.; Brown, S.J.; Christidis, N. Modeling the Recent Evolution of Global Drought and Projections for the Twenty-First Century with the Hadley Centre Climate Model. J. Hydrometeorol 2006, 7, 1113. [Google Scholar] [CrossRef]
- Tallaksen, L.M.; Hisdal, H.; Van Lanen, H.A. Space–time modelling of catchment scale drought characteristics. J. Hydrol. 2009, 375, 363–372. [Google Scholar] [CrossRef]
- Sheffield, J.; Wood, E.F. Drought: Past Problems and Future Scenarios; Taylor & Francis Group: Abingdon, UK, 2012. [Google Scholar]
- Guo, Y.; Huang, S.; Huang, Q.; Wang, H.; Fang, W.; Yang, Y.; Wang, L. Assessing socioeconomic drought based on an improved Multivariate Standardized Reliability and Resilience Index. J. Hydrol. 2019, 568, 904–918. [Google Scholar] [CrossRef]
- Guo, Y.; Huang, S.; Huang, Q.; Wang, H.; Fang, W. Copulas-based bivariate socioeconomic drought dynamic risk assessment in a changing environment. J. Hydrol. 2019, 575, 1052–1064. [Google Scholar] [CrossRef]
- Huang, S.; Chang, J.; Leng, G.; Huang, Q. Integrated index for drought assessment based on variable fuzzy set theory: A case study in the Yellow River basin, China. J. Hydrol. 2015, 527, 608–618. [Google Scholar] [CrossRef]
- Shi, H.; Hu, C.; Wang, Y.; Cheng, L.; Li, H. Analyses of trends and causes for variations in runoff and sediment load of the Yellow River. Int. J. Sediment Res. 2017, 32, 171–179. [Google Scholar] [CrossRef]
- Fu, G.; Chen, S.; Liu, C.; Shepard, D. Hydro-Climatic Trends of the Yellow River Basin for the Last 50 Years. Clim. Chang. 2004, 65, 149–178. [Google Scholar] [CrossRef] [Green Version]
- Zhang, J.; Li, D.; Li, L.; Deng, W. Decadal variability of droughts and floods in the Yellow River basin during the last five centuries and relations with the North Atlantic SST. Int. J. Climatol. 2013, 33, 3217–3228. [Google Scholar] [CrossRef]
- Schubert, S.; Gutzler, D.; Wang, H.; Dai, A.; Delworth, T.; Deser, C.; Findell, K.; Fu, R.; Higgins, W.; Hoerling, M. A US CLIVAR project to assess and compare the responses of global climate models to drought-related SST forcing patterns: Overview and results. J. Clim. 2009, 22, 5251–5272. [Google Scholar] [CrossRef]
- Seager, R.; Kushnir, Y.; Herweijer, C.; Naik, N.; Velez, J. Modeling of Tropical Forcing of Persistent Droughts and Pluvials Over Western North America: 1856–2000. J. Clim. 2004, 18, 4065–4088. [Google Scholar] [CrossRef]
- Aoa, B.; Ma, Z.; Zza, B.; Fsb, C. Natural and anthropogenic influences on the recent droughts in Yellow River Basin, China. Sci. Total Environ. 2020, 704, 135428. [Google Scholar]
- Yang, D.; Sun, F.; Liu, Z.; Cong, Z.; Ni, G.; Lei, Z. Analyzing spatial and temporal variability of annual water-energy balance in nonhumid regions of China using the Budyko hypothesis. Water Resour. Res. 2007, 43. [Google Scholar] [CrossRef]
- Zhang, Y.; Li, G.; Jing, G.; Yao, L.; Yu, Z.; Niu, H. sc_PDSI is more sensitive to precipitation than to reference evapotranspiration in China during the time period 1951–2015. Ecol. Indic. 2019, 96, 448–457. [Google Scholar] [CrossRef]
- Miao, M. Variation of Sunshine Percentage for the Last 40 Years in the Yellow River Basin. Meteorological 2006, 32, 62–66. [Google Scholar]
- Fuxing, L.I.; Chen, D.; Tang, Q. Variations of hydro-meteorological variables in the Yellow River basin and their relationships with the East Asian summer monsoon. Adv. Water Sci. 2015, 26, 481–490. [Google Scholar]
- Di, W.; Yan, D.H.; Yang, G.Y.; Wang, X.G.; Xiao, W. Assessment on agricultural drought vulnerability in the Yellow River basin based on a fuzzy clustering iterative model. Nat. Hazards 2013, 67, 919–936. [Google Scholar]
- Ma, X.; Zhang, M.; Wang, S.; Ma, Q.; Pan, S. Evaporation paradox in the Yellow River Basin. Acta Geogr. Sin. 2012, 67, 645–656. [Google Scholar]
- Shao, X.M.; Yan, C.R.; Wei, H.B. Spatial and temporal structure of precipitation in the Yellow River Basin based on Kriging method. Chin. J. Agrometeorol. 2006, 27, 65. [Google Scholar]
- Wang, F.; Wang, Z.; Yang, H.; Zhao, Y.; Li, Z.; Wu, J. Capability of Remotely Sensed Drought Indices for Representing the Spatio-Temporal Variations of the Meteorological Droughts in the Yellow River Basin. Remote Sens. 2018, 10, 1834. [Google Scholar] [CrossRef] [Green Version]
- Wang, Q.; Wu, J.; Lei, T.; He, B.; Wu, Z.; Ming, L.; Mo, X.; Geng, G.; Li, X.; Zhou, H. Temporal-spatial characteristics of severe drought events and their impact on agriculture on a global scale. Quat. Int. 2014, 349, 10–21. [Google Scholar] [CrossRef]
- Vicente-Serrano, S.M.; Beguería, S.; López-Moreno, J.; Angulo, M.; Kenawy, A.E. A New Global 0.5° Gridded Dataset (1901–2006) of a Multiscalar Drought Index: Comparison with Current Drought Index Datasets Based on the Palmer Drought Severity Index. J. Hydrometeorol. 2010, 11, 1033–1043. [Google Scholar] [CrossRef] [Green Version]
- Budyko, M.I. Climate and Life; Academic Press: New York, NY, USA, 1974. [Google Scholar]
- Gao, X.; Sun, M.; Zhao, Q.; Wu, P.; Zhao, X.; Pan, W.; Wang, Y. Actual ET modelling based on the Budyko framework and the sustainability of vegetation water use in the loess plateau. Sci. Total Environ. 2016, 579, 1550–1559. [Google Scholar] [CrossRef]
- Xu, K.; Yang, D.; Yang, H.; Li, Z.; Qin, Y.; Shen, Y. Spatio-temporal variation of drought in China during 1961–2012: A climatic perspective. J. Hydrol. 2015, 526, 253–264. [Google Scholar] [CrossRef]
- She, D.; Xia, J. The spatial and temporal analysis of dry spells in the Yellow River basin, China. Stoch. Environ. Res. Risk Assess. 2013, 27, 29–42. [Google Scholar] [CrossRef]
- Huang, S.; Chang, J.; Huang, Q.; Chen, Y. Spatio-temporal Changes and Frequency Analysis of Drought in the Wei River Basin, China. Water Resour. Manag. 2014, 28, 3095–3110. [Google Scholar] [CrossRef]
- Peng, G.H.; Xia, J.; Xiu-Feng, M.A.; Jian-Qin, M.A. Analysis on Drought Frequency Distribution and Digital Characteristics of Number of Turns of the Yellow River Basin. Yellow River 2011, 33, 3–5. [Google Scholar]
- Xing, W.; Wang, W.; Zou, S.; Deng, C. Projection of future runoff change using climate elasticity method derived from Budyko framework in major basins across China. Global Planet. Chang. 2018, 162, 120–135. [Google Scholar] [CrossRef]
- Zhang, Q.; Peng, J.; Singh, V.P.; Li, J.; Chen, Y.D. Spatio-temporal variations of precipitation in arid and semiarid regions of China: The Yellow River basin as a case study. Glob. Planet. Chang. 2014, 114, 38–49. [Google Scholar] [CrossRef]
- Wang, F.; Wang, Z.; Yang, H.; Zhao, Y. Study of the temporal and spatial patterns of drought in the Yellow River basin based on SPEI. Sci. China: Earth Sci. 2018, 61, 1098–1111. [Google Scholar] [CrossRef]
- Huang, S.; Li, P.; Huang, Q.; Leng, G.; Hou, B.; Ma, L. The propagation from meteorological to hydrological drought and its potential influence factors. J. Hydrol. 2017, 547, 184–195. [Google Scholar] [CrossRef]
- Miao, C.; Sun, Q.; Duan, Q.; Wang, Y. Joint analysis of changes in temperature and precipitation on the Loess Plateau during the period 1961–2011. Clim. Dyn. 2016, 47, 3221–3234. [Google Scholar] [CrossRef] [Green Version]
- Lü, Y.; Fu, B.; Feng, X.; Zeng, Y.; Liu, Y.; Chang, R.; Sun, G.; Wu, B. A Policy-Driven Large Scale Ecological Restoration: Quantifying Ecosystem Services Changes in the Loess Plateau of China. PLoS ONE 2012, 7, e31782. [Google Scholar] [CrossRef]
- Cui, Y.B. Spatial and temporal variability of annual precipitation during 1961–2006 in Yellow River Basin, China. J. Hydrol. 2008, 361, 330–338. [Google Scholar]
- Wang, Q.X.; Wang, M.B.; Fan, X.H.; Zhang, F.; Zhu, S.Z.; Zhao, T.L. Change trends of temperature and precipitation in the Loess Plateau Region of China, 1961–2010. Glob. Planet. Chang. 2012, 92, 138–147. [Google Scholar] [CrossRef]
- Fan, X.; Ma, Z.; Yang, Q.; Han, Y.; Mahmood, R.; Zheng, Z. Land use/land cover changes and regional climate over the Loess Plateau during 2001–2009. Part I: Observational evidence. Clim. Chang. 2015, 129, 427–440. [Google Scholar] [CrossRef] [Green Version]
- Wang, Y.; Yu, P.; Feger, K.H.; Wei, X.; Sun, G.; Bonell, M.; Xiong, W.; Zhang, S.; Xu, L. Annual runoff and evapotranspiration of forestlands and non-forestlands in selected basins of the Loess Plateau of China. Ecohydrology 2011, 4, 277–287. [Google Scholar] [CrossRef]
- Liu, Y.; Zhu, Y.; Ren, L.; Yong, B.; Singh, V.P.; Yuan, F.; Jiang, S.; Yang, X. On the mechanisms of two composite methods for construction of multivariate drought indices. Sci. Total Environ. 2018, 647, 981–991. [Google Scholar] [CrossRef] [PubMed]
- Zhang, K.X.; Pan, S.M.; Zhang, W.; Xu, Y.H.; Cao, L.G.; Hao, Y.P.; Wang, Y. Influence of climate change on reference evapotranspiration and aridity index and their temporal-spatial variations in the Yellow River Basin, China, from 1961 to 2012. Quat. Int. 2015, 380, 75–82. [Google Scholar] [CrossRef]
Figure 1.
Location of the Yellow River basin.

Figure 2.
Average monthly areal precipitation and ET0 in Yellow River basin during 1951–2017.

Figure 3.
The spatial distribution of average seasonal sc-PDSI in the YRB.

Figure 4.
Annual variations of sc-PDSI, P, ET0, and AET in the upper, middle, lower reach, and the whole basin from 1951 to 2017.
Figure 4.
Annual variations of sc-PDSI, P, ET0, and AET in the upper, middle, lower reach, and the whole basin from 1951 to 2017.


Figure 5.
Probability plot of sc-PDSI, P, ET0, and AET in YRB on the yearly scale from 1951 to 2017.
Figure 5.
Probability plot of sc-PDSI, P, ET0, and AET in YRB on the yearly scale from 1951 to 2017.
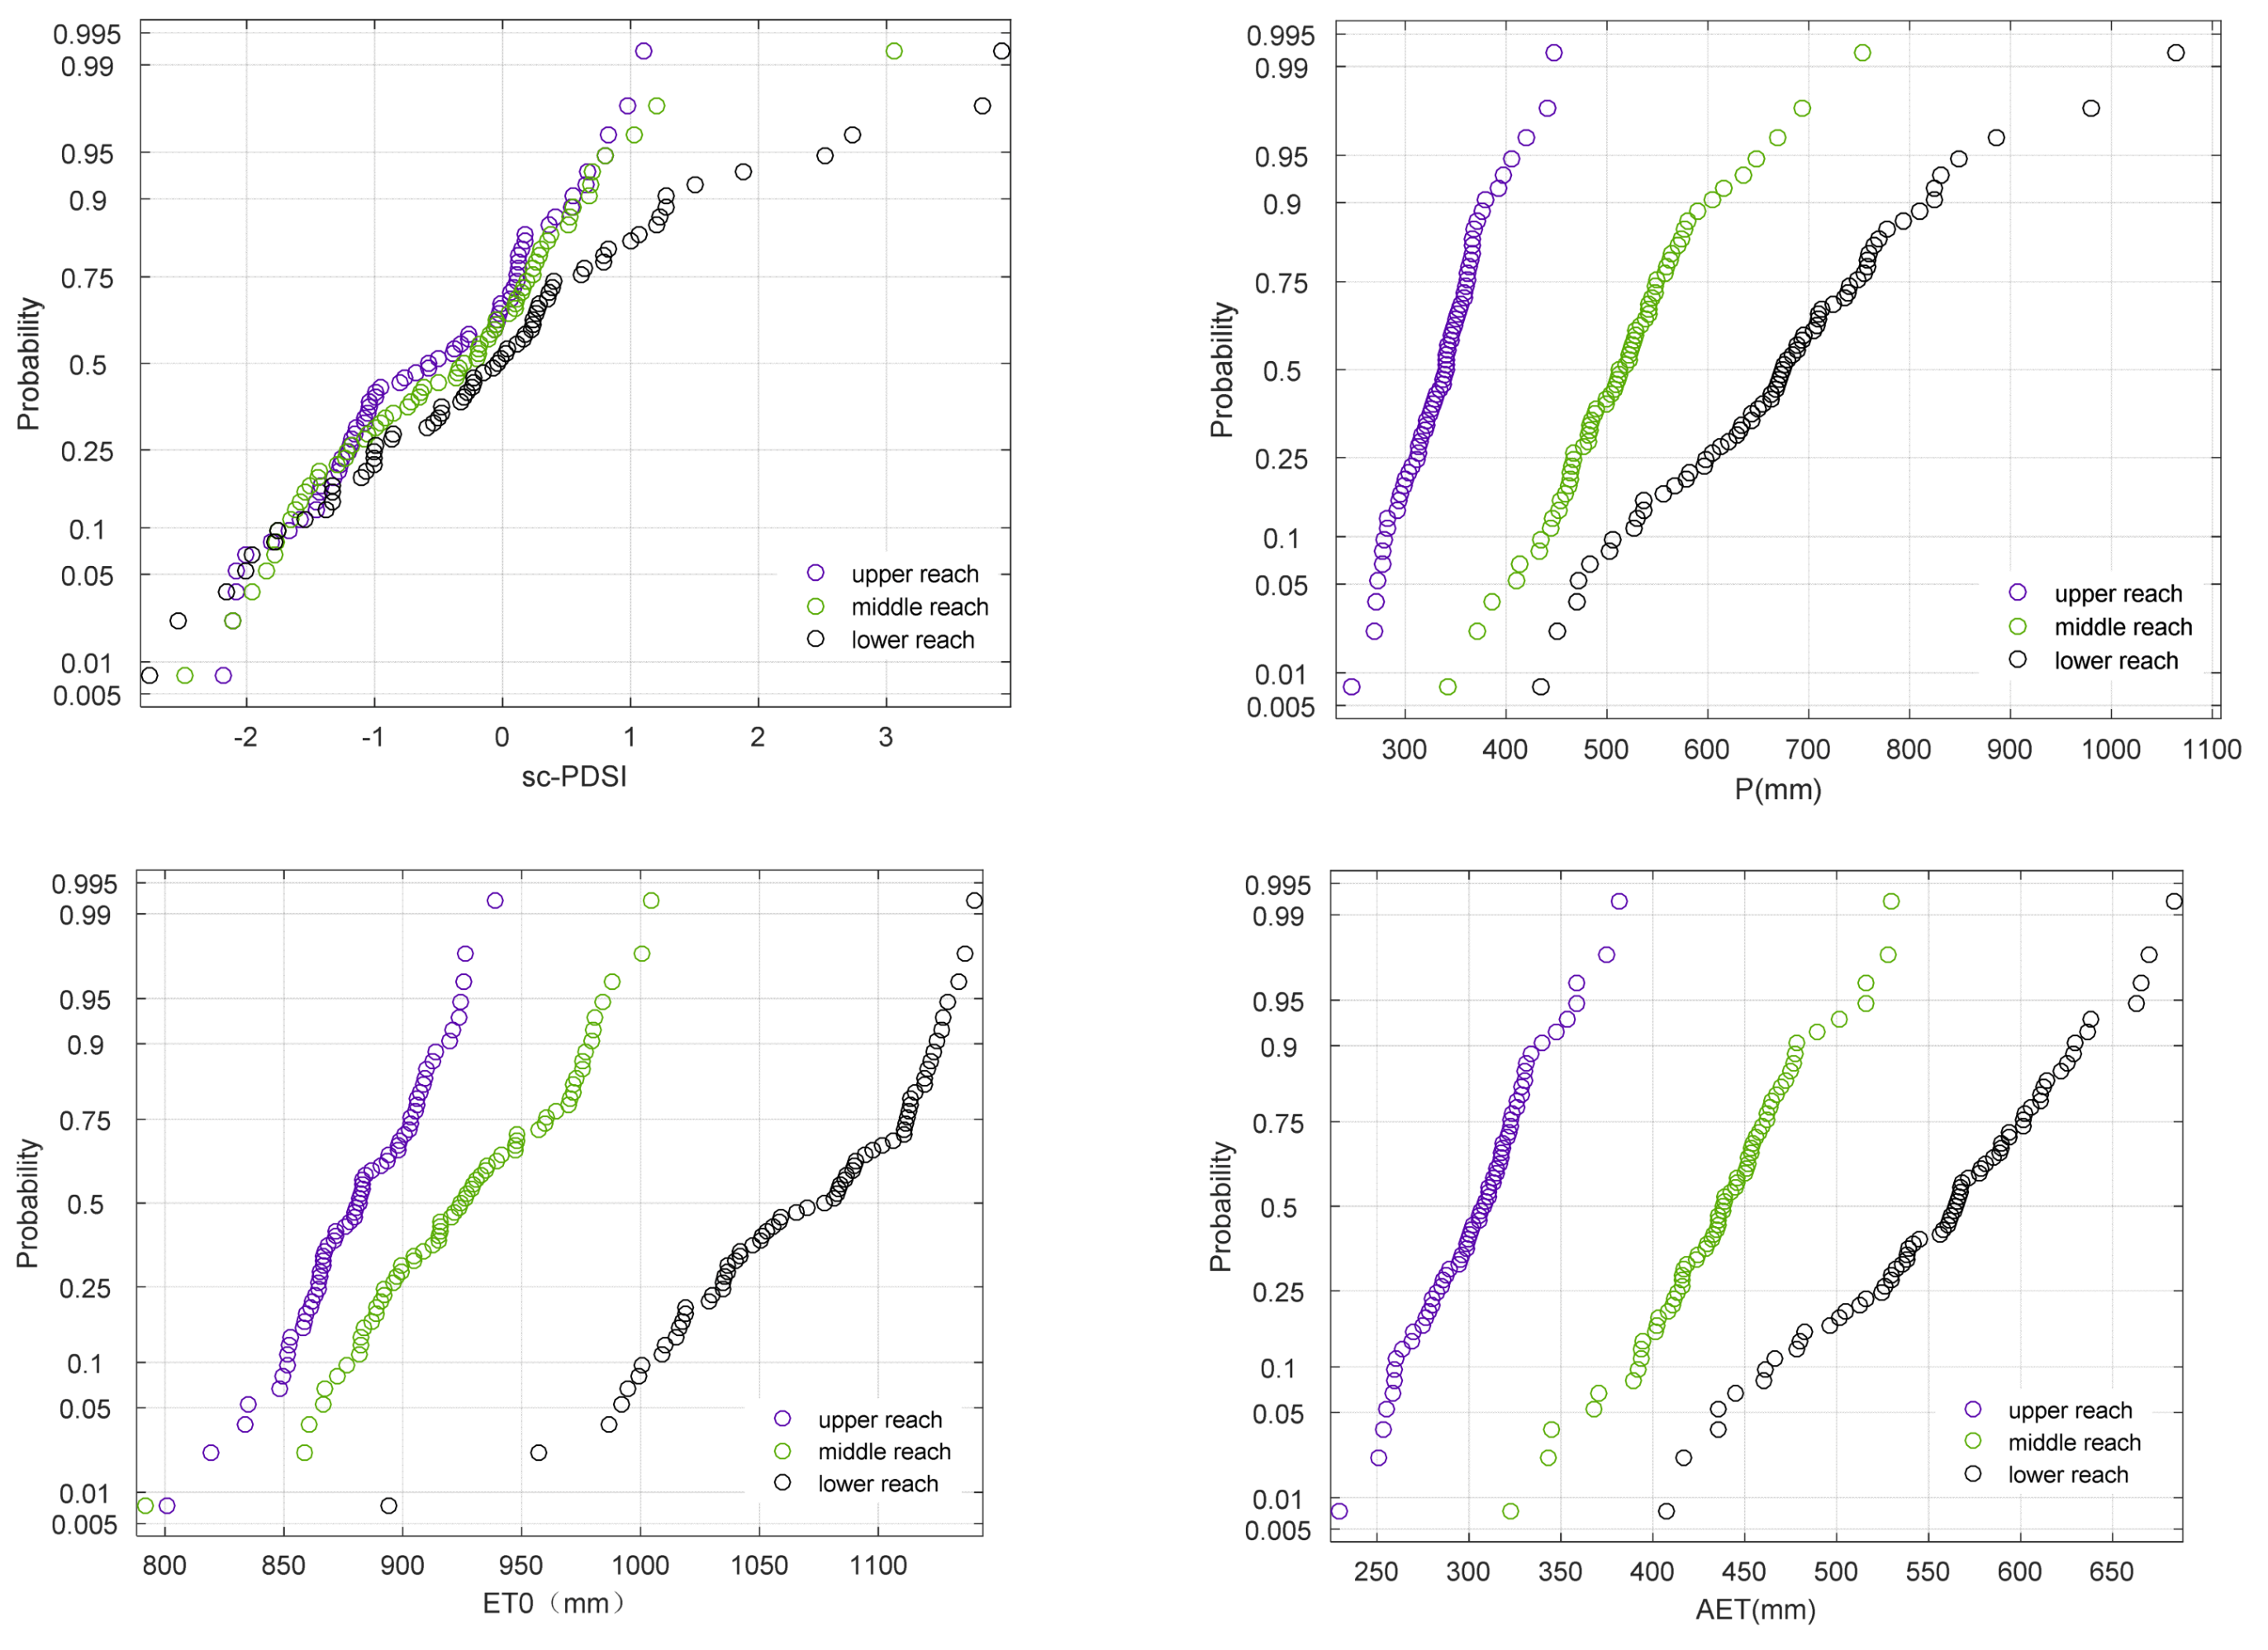
Figure 6.
Probability density of sc-PDSI in YRB on the monthly scale from 1951 to 2017.

Figure 7.
Spatial distribution of correlation coefficient between sc-PDSI and P, ET0, AET in annual, spring, summer, autumn, and winter from 1951 to 2017.
Figure 7.
Spatial distribution of correlation coefficient between sc-PDSI and P, ET0, AET in annual, spring, summer, autumn, and winter from 1951 to 2017.

Figure 8.
Spatial distribution of dominant factor that mainly affected the sc-PDSI on annual and seasonal time scales during 1951–2017 in YRB (a–o) (Green in the watershed indicates that the main driver of drought is P, blue indicates that the main driver is ET0, and yellow indicates that the main driver is AET).

Figure 9.
Pearson’s correlation coefficient between ET0 and AET.

Figure 10.
Pearson’s correlation coefficient between P and AET.
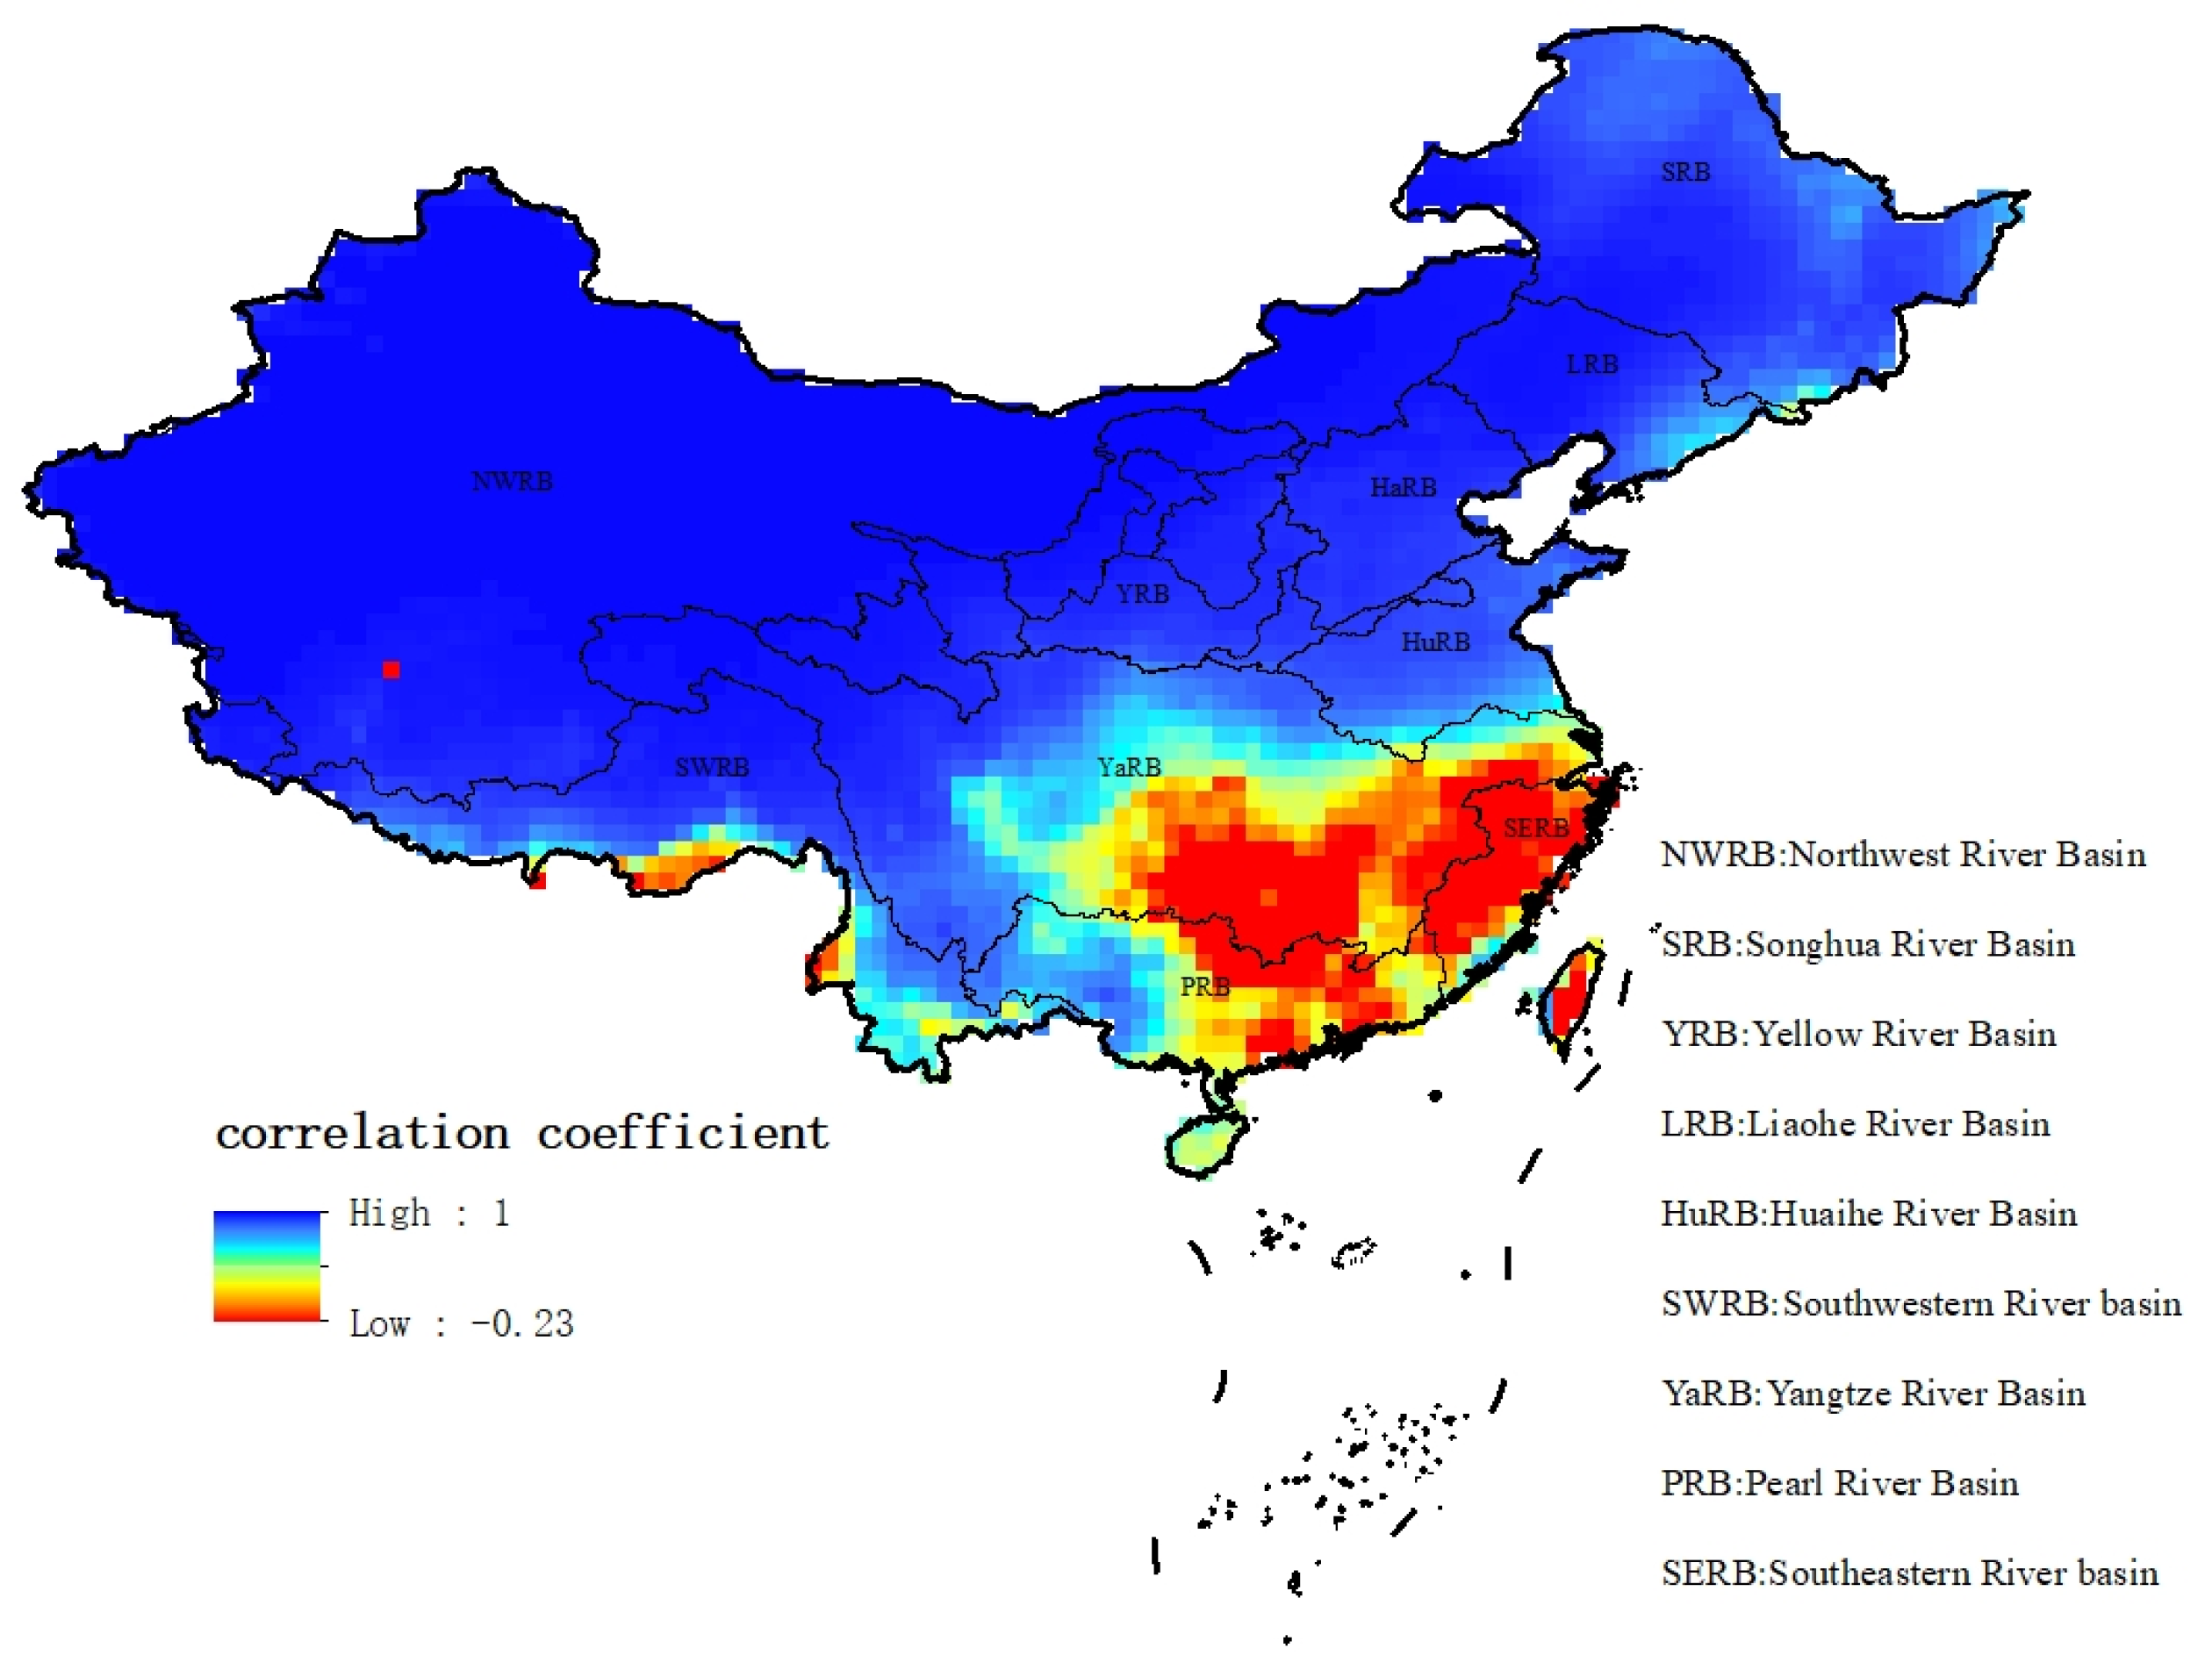
Figure 11.
Fitting analysis of actual evapotranspiration and precipitation scattered points in the YRB.
Figure 11.
Fitting analysis of actual evapotranspiration and precipitation scattered points in the YRB.


Table 1.
Classification of sc-PDSI values.
| sc-PDSI Value | sc-PDSI Category | sc-PDSI Value | sc-PDSI Category |
|---|---|---|---|
| ≥4 | extreme wet | −2~−1 | mild drought |
| 3~4 | severe wet | −3~−2 | moderate drought |
| 2~3 | moderate wet | −4~−3 | severe drought |
| 1~2 | mild wet | <−4 | extreme drought |
Table 2.
Trend magnitudes using Sen’s slope and Z statistic in the YRB from 1951 to 2017.
| Upper Reach | Middle Reach | Lower Reach | YRB | |||||
|---|---|---|---|---|---|---|---|---|
| S | Z | S | Z | S | Z | S | Z | |
| sc-PDSI | 0.007 * | 2.38 * | −0.02 * | −3.97 ** | −0.01 | −0.89 | −0.002 | −0.72 |
| P | 0.10 | 1.37 | −0.61 * | −3.29 ** | −0.31 | −1.01 | −0.17 | −1.16 |
| ET0 | 0.87 * | 7.52 ** | 1.32 * | 8.09 ** | 1.36 * | 22.43 ** | 1.18 * | 13.07 ** |
| AET | 0.13 * | 2.22 * | −0.15 | −1.22 | 0.09 | 0.46 | 0.05 | 0.44 |
S means Sen’ slope, Z means Z statistic. “*” and “**” denote that the trend magnitudes pass the significance test of α = 0.05 and α = 0.01, respectively.
Table 3.
Pearson’s correlation coefficient between sc-PDSI and P, ET0, AET at different time scales.
Table 3.
Pearson’s correlation coefficient between sc-PDSI and P, ET0, AET at different time scales.
| Time Scale | P | ET0 | AET | ||||||
|---|---|---|---|---|---|---|---|---|---|
| U | M | L | U | M | L | U | M | L | |
| 1 month | 0.19 | 0.22 | 0.25 | −0.01 | −0.07 | 0.00 | 0.15 | 0.09 | 0.12 |
| 3 months | 0.18 | 0.21 | 0.24 | −0.02 | −0.09 | −0.02 | 0.14 | 0.07 | 0.10 |
| 6 months | 0.18 | 0.24 | 0.28 | −0.06 | −0.14 | −0.14 | 0.13 | 0.06 | 0.09 |
| 9 months | 0.31 | 0.41 | 0.38 | −0.06 | −0.22 | −0.06 | 0.23 | 0.08 | 0.12 |
| 12 months | 0.74 | 0.78 | 0.69 | −0.43 | −0.48 | −0.13 | 0.72 | 0.20 | 0.36 |
| 15 months | 0.37 | 0.46 | 0.48 | −0.08 | −0.20 | −0.13 | 0.30 | 0.07 | 0.18 |
| 18 months | 0.25 | 0.36 | 0.41 | −0.08 | −0.18 | −0.02 | 0.60 | 0.08 | 0.14 |
U means upper reach, M means middle reach, L means lower reach.
Publisher’s Note: MDPI stays neutral with regard to jurisdictional claims in published maps and institutional affiliations. |
© 2022 by the authors. Licensee MDPI, Basel, Switzerland. This article is an open access article distributed under the terms and conditions of the Creative Commons Attribution (CC BY) license (https://creativecommons.org/licenses/by/4.0/).
Share and Cite
MDPI and ACS Style
Liu, W.; Zhang, Y. Spatiotemporal Changes of sc-PDSI and Its Dynamic Drivers in Yellow River Basin. Atmosphere 2022, 13, 399. https://doi.org/10.3390/atmos13030399
AMA Style
Liu W, Zhang Y. Spatiotemporal Changes of sc-PDSI and Its Dynamic Drivers in Yellow River Basin. Atmosphere. 2022; 13(3):399. https://doi.org/10.3390/atmos13030399
Chicago/Turabian StyleLiu, Wen, and Yuqing Zhang. 2022. "Spatiotemporal Changes of sc-PDSI and Its Dynamic Drivers in Yellow River Basin" Atmosphere 13, no. 3: 399. https://doi.org/10.3390/atmos13030399
Note that from the first issue of 2016, this journal uses article numbers instead of page numbers. See further details here.