
Effects of Landscape Patterns on Atmospheric Particulate Matter Concentrations in Fujian Province, China
1
School of Geographical Sciences, Fujian Normal University, Fuzhou 350007, China
2
Fujian Provincial Engineering Research Center for Monitoring and Assessing Terrestrial Disasters, Fujian Normal University, Fuzhou 350007, China
3
State Key Laboratory for Subtropical Mountain Ecology, Ministry of Science and Technology and Fujian Province, Fujian Normal University, Fuzhou 350007, China
*
Author to whom correspondence should be addressed.
Atmosphere 2023, 14(5), 787; https://doi.org/10.3390/atmos14050787
Submission received: 12 March 2023
/
Revised: 6 April 2023
/
Accepted: 24 April 2023
/
Published: 26 April 2023
(This article belongs to the Special Issue The Water Cycle and Climate Change (2nd Edition))
Abstract
:Based on the observation data from 37 national ambient air automatic monitoring stations and the land use/cover data in Fujian Province, the effects of land use/cover on the annual and seasonal variations in the air quality index (AQI), PM2.5 concentration and PM10 concentration are analyzed. In addition, buffer zones with different radii are established to calculate landscape pattern metrics and the influences of landscape patterns on the AQI, PM2.5 concentration and PM10 concentration at different scales are discussed. The results show that land use/cover types have remarkable impacts on the variations in the atmospheric particulate matter concentrations. The AQI and PM10 concentration are the highest for construction land, and the PM2.5 concentration is the highest for cultivated land. The seasonal variations in all air pollutant concentrations show similar characteristics, i.e., high in spring and winter and low in summer and autumn. Different landscape metrics have diverse effects on atmospheric particulate matter concentrations at different scales. In the buffer zone with a 5000 m radius, the patch number and patch density of forest land are positively correlated with the PM2.5 concentration, while the edge density of construction land has a negative correlation with it, indicating that landscape fragmentation affects the PM2.5 concentration. More fragmented forest land has a weaker effect on the reduction in the PM2.5 concentration, and more fragmented construction land has a weaker effect on the increase in the PM2.5 concentration. Moreover, the seasonal variations in the atmospheric particulate matter concentrations are different under different land use/cover types. Except for autumn, the AQI and PM2.5 concentration are most noticeably affected by forest land in all seasons, showing negative correlations. In autumn, the impacts of cultivated land on the AQI and PM2.5 concentration are more pronounced. The PM10 concentration is substantially affected by forest land in spring and summer and is markedly influenced by construction land in autumn and winter. The analysis of the landscape metrics of forest land and construction land at different scales indicates that the optimal scale is 5000 m for studying the annual average of the AQI and PM10 concentration and is 3000 m for investigating the annual average of the PM2.5 concentration. The optimal scales to research the seasonal variations in the AQI, PM2.5 and PM10 concentrations are 4000–5000 m for forest land and construction land, while the optimal scale is 1000 m for cultivated land to research the AQI and PM2.5 in autumn. This study can provide a scientific basis for the optimization of land use/cover and landscape patterns in Fujian Province, the planning and management of green space and the selection of research scales in the future.
1. Introduction
With the rapid development of urbanization and industrialization, atmospheric particulate matter has become the primary air pollutant in many cities [1]. Coal burning for heat-supplying and power generation, automobile exhaust emission, biomass burning (straw, firewood, etc.), dust emission from road and building constructions and other reasons lead to a dramatic increase in the atmospheric particulate matter concentrations, causing problems such as air pollution, visibility reduction and a continuous increase in the frequency and concentration of haze, which have become more and more harmful to human beings [2,3,4,5]. Therefore, with the acceleration of urbanization, air pollution has become more and more prominent in cities in the north and south of China. Atmospheric particulate matter concentrations are a direct measure for judging air quality, and the mass concentrations (hereafter referred to as concentrations) of particulate matter with diameters less than 2.5 μm (PM2.5) and 10 μm (PM10) have received the most attention [6] and have become fixed indexes for ambient air monitoring in China. Note that PM2.5 is also known as fine particulate matter, and PM10 is also called inhalable particulate matter. At present, some domestic cities have carried out studies on the compositions [7,8], sources [9] and spatio-temporal dynamics [10,11] of PM10 and PM2.5, and the impacts of land use on the PM2.5 concentration have been carried out in several cities of China [12]. SCHAUFLER et al. (2010) [13] investigated the influences of different land use types on air pollution and proved that changes in the land use types and landscape patterns could directly affect pollutant concentrations.
Fujian Province is an economic artery connecting the Yangtze River Delta and the Pearl River Delta and is one of the provinces with the closest exchanges between the Chinese mainland and Taiwan province. Since the reform and opening-up, Fujian has experienced rapid economic development, with a regional gross domestic product of 5.31 trillion yuan in 2022, making it one of the fastest-growing provinces in China. However, during economic development, the unbalanced spatial allocation of the population, resources and environment, the degradation of forests and other ecological lands, urban expansion and road network extension have caused ecological damage and a decline in the ecological environment quality to a certain extent. For example, Li et al. (2020) [14] showed that the main changes in the land use types in Fujian Province are the conversion of cultivated land and forest land to construction land, accounting for 14.5% (cultivated land) and 6.4% (forest land) of the total area change in the land use types, respectively. Hansen et al. (2013) [15] also suggested that Fujian is one of the most active provinces in China in terms of forest cover change. As an important ecological barrier in southern China, Fujian Province suffers from limited land resources, and thus it is urgent to investigate the spatio-temporal evolutions of PM2.5 and PM10 concentrations in this region and their relationships with landscape patterns during the process of implementing the ecological province strategy and accelerating the construction of an ecological civilization demonstration area.
In this research, Fujian Province was taken as the study area to compare the air quality index (AQI), PM10 concentration and PM2.5 concentration under different types of land use/cover and landscapes, analyze their correlations with the landscape metrics, and identify the distinct effects of landscape metrics on the atmospheric particulate matter concentrations in different buffer zones and different seasons. The results can provide a scientific basis for the planning of land use and landscape patterns, air pollution control and regional ecological civilization construction.
The remainder of this paper is organized as follows. Section 2 introduces the data and methods used in this study. Section 3 investigates the variations in the atmospheric particulate matter concentrations and their correlations with landscape patterns at different scales. The discussion and the main conclusions are presented in Section 3 and Section 4, respectively.
2. Study Area and Methods
2.1. Study Area
The study area for this research was Fujian Province, China (115°50′ N–120°43′ N, 23°31′ E–28°18′ E), which is adjacent to Zhejiang Province in the north, Guangdong Province in the south, Jiangxi Province in the west and Taiwan Province across the Taiwan Strait in the east. It connects the East China Sea with the South China Sea and faces directly to the Pacific Ocean. Famous for its beautiful ecological environment, Fujian had a forest coverage rate of 66.8% in 2021, ranking first in China. The topography of Fujian Province is known as “eighty percent of mountains, ten percent of waters and ten percent of fields”, indicating the geographical condition of mountainous areas. In recent years, the urbanization process in Fujian Province has been accelerated, while the development is increasingly restricted by limited land resources.
2.2. Data Sources
There are 37 national ambient air automatic monitoring stations (hereinafter referred to as national stations) in Fujian Province to carry out the real-time monitoring of air pollutants (Figure 1). The data on air pollutants (AQI, PM2.5, PM10) in 2018 are the real-time data derived from the national stations (http://www.cnemc.cn/ (accessed on 26 April 2021)).
The land use data were obtained from the Resource and Environment Science and Data Center (http://www.resdc.cn/ (accessed on 26 April 2021)). According to the land resource classification system, the land use data could be divided into 6 categories, i.e., cultivated land, forest land, grassland, water area, construction land and unused land.
2.3. Methods
2.3.1. Calculations of the Air Pollutant Concentrations at Stations under Different Land Use Types
According to the classification of land use types at 37 national stations, 24 stations are on construction land, 10 stations are on forest land, 2 stations are on grassland, and one station is on cultivated land. The daily air pollutant concentrations were the average during 00:00–23:00 (Beijing time) in one day. The annual and seasonal average values were calculated based on the daily values. December–February were considered as winter, March–May as spring, June–August as summer and September–November as autumn in this study.
2.3.2. Calculations of Landscape Metrics
Previous studies have demonstrated that landscape metrics can provide a good explanation of the PM concentrations, but the effectiveness is affected by the spatial scale of the analysis [16,17]. Under the suggestion of previous studies, we established different buffer zones with a radius of 1 km, 2 km, 3 km, 4 km and 5 km centered on the 37 national stations, respectively. Greenspace (i.e., forestland and grassland) provides a wide range of ecosystem services, such as air purification and climate regulation. It is very important to construct the landscape with green areas as pollutant filters [17,18]. Landscape metrics are widely used to measure landscape patterns [19], including the composition and structure of the landscape, which has a great impact on the PM concentrations [17,20]. According to Weber et al. (2014) [21] and Maimaiti et al. (2014) [22], six landscape metrics (Table 1) were selected to represent the landscape patterns of each land use type. Among these, the proportion of landscape (PLAND), largest patch index (LPI) and mean patch area (AREA_MN) represent the landscape composition for each land type; edge density (ED), number of patches (NP) and patch density (PD) represent the landscape structure for each land type. Then, based on the raster data on the land use types, the six landscape metrics for the five buffer zones were calculated using the Fragstats software version 4.2 [19].
2.3.3. Correlation Analysis
Pearson correlation coefficients are used to measure the correlation (linear correlation) between two variables X and Y, with a value between −1 and 1. The Pearson bi-variate correlation analysis was used to measure the correlations of the landscape metrics of land use/cover types with the AQI, PM2.5 concentration and PM10 concentration (both annual and seasonal means). Pearson correlation coefficients have a value between −1 and 1. The closer the value is to 1, the stronger the positive correlation between the two variables is; the closer the value to −1, the stronger the negative correlation between the two variables is; while its value is equal to or close to 0, the correlation between the two variables is not significant. In addition, the significant level was tested with the p value. Based on the Pearson correlation coefficients and the p values, the landscape metrics with significant correlations were selected to analyze the influence of the landscape metrics on air pollutants. The SPSS software version 26.0 was used for the correlation analysis, and the Origin software version 2019b was employed to draw charts. Through col-linearity judgment, variables strongly related to the reference variable (x) were eliminated. After the calculation, it was found that there was no significant correlation between the landscape metrics and the air pollutants in cultivated land, water area and unused land in the established buffer zones. Thus, they are not discussed in this study.
3. Results
3.1. Annual Atmospheric Particulate Matter Concentrations under Different Land Use/Cover Types and Landscape Patterns
Figure 2 presents the annual mean values of the AQI, PM2.5 concentration and PM10 concentration at each station under four land use/cover types. It can be seen that the land use/cover types ranked from the highest to lowest AQI were construction land (46.19), cultivated land (44.74), forest land (41.01) and grassland (39.05). The land use/cover types ranked by the PM2.5 concentration in descending order were cultivated land (26.87 μg m−3), construction land (26.07 μg m−3), grassland (23.93 μg m−3) and forest land (22.07 μg m−3). For the PM10 concentration ranked in descending order, the order was construction land (47.35 μg m−3), cultivated land (40.62 μg m−3), forest land (38.79 μg m−3) and grassland (36.86 μg m−3).
3.2. Seasonal Atmospheric Particulate Matter Concentrations under Different Land Use/Cover Types and Landscape Patterns
The seasonal variations in the AQI, PM2.5 concentration and PM10 concentration for each type of land use/cover and landscape were analyzed and are shown in Figure 3. The AQI, PM2.5 concentration and PM10 concentration showed similar trends of being high in the spring and winter and low in the summer and autumn under all the types of land use/cover and landscapes, but their seasonal variations under different landscape types were different. The AQI values in construction land were higher than those in the other land use/cover and landscape types except for cultivated land in the spring. The AQI values in grassland were higher than those in forest land in the winter. However, the AQI values in grassland were the lowest in the other three seasons and obviously lower than those in the other land types in the summer and autumn. The lowest AQI value could be found in forest land in the winter. The PM2.5 concentration in forest land was the lowest in all seasons, while in cultivated land it was the highest in the spring and summer, and in construction land it was the highest in the autumn and winter. The PM10 concentration in construction land was remarkably higher than in the other types of land use/cover and landscapes in all seasons. The PM10 concentration in grassland was the lowest except for in winter. In winter, it was the lowest in forest land, followed by cultivated land.
3.3. Correlations between Landscape Patterns and Air Pollutant Concentrations
3.3.1. Correlations with the Annual Air Pollutant Concentrations
Figure 4 presents the landscape metrics that had the strongest correlation with the AQI, PM2.5 and PM10 concentrations. Generally, all six landscape metrics were remarkably correlated with the atmospheric particulate matter concentrations, but there were differences among the different land use/cover types and buffer zone scales. All six landscape metrics of forest land were notably correlated with the AQI and PM10 concentration within the radii of 4000–5000 m, while the radius for the PM2.5 concentration with remarkable correlations varied greatly. Except for patch density (PD) and the number of patches (NP), the influences of the other metrics were mainly concentrated within the radius of 3000 m. All six landscape metrics of construction land and grassland were notably correlated with the AQI and PM10 concentration, but the correlations of the PM2.5 concentration with the NP and PD of construction land and the largest patch index (LPI) and AREA_MN of the grassland were not obvious.
The PD and NP of forest land were significantly positively correlated with the AQI, PM2.5 concentration and PM10 concentration in the buffer zone with a radius of 5000 m, while the proportion of landscape (PLAND) and mean patch area (AREA_MN) of the forest land were significantly negatively correlated with the PM10 concentration in the buffer zone with a radius of 4000 m. However, the PLAND and AREA_MN of forest land showed significant negative correlations with the PM2.5 concentration in the buffer zones with the 2000–3000 m radii. The PD and NP of construction land had significant negative correlations with the AQI and PM10 concentration within the 3000 m radius but did not have effects on the PM2.5 concentration. The PLAND and LPI of construction land were significantly positively correlated with the AQI, PM2.5 concentration and PM10 concentration in the radii of 4000–5000 m. All the metrics of the grassland had negative correlations with the atmospheric particulate matter concentrations and the specific reasons remain to be further discussed. According to the number of landscape metrics showing significant correlations with the air pollutants in the buffer zones with different radii, the optimal scale for studying the annual mean AQI and PM10 concentration is 5000 m, and the optimal scale for the PM2.5 concentration is 3000 m.
The AQI was significantly correlated with the edge density (ED) and AREA_MN of construction land in the buffer zone with the 1000 m radius (passing the significance test at the 0.01 significant level, i.e., p < 0.01). It was also significantly correlated with the AREA_MN of grassland within the 2000 m radius (passing the significance test at the 0.05 significant level, i.e., p < 0.05) and the PD and NP of construction land within the 3000 m radius (p < 0.05). In addition, the AQI had significant correlations with the PLAND (p < 0.01) and LPI (p < 0.05) of forest land and grassland and the PLAND (p < 0.01) and LPI (p < 0.01) of construction land within the 4000 m radius. In the buffer zone with the 5000 m radius, the AQI was significantly correlated with the ED (p < 0.01), LPI (p < 0.01), PD (p < 0.05) and AREA_MN (p < 0.01) of forest land, the ED (p < 0.01), PD (p < 0.01) and NP (p < 0.01) of grassland and the ED (p < 0.01) of construction land.
The PM2.5 concentration was significantly correlated with the PLAND (p < 0.05) and ED (p < 0.05) of construction land in the buffer zone with the 1000 m radius, and it was significantly correlated with the LPI (p < 0.01) and AREA_MN (p < 0.01) of forest land within the 2000 m radius. For the 3000 m radius, the PM2.5 concentration was significantly correlated with the PLAND (p < 0.01) and ED (p < 0.01) of forest land, the PLAND (p < 0.05) and ED (p < 0.01) of grassland, and the PLAND (p < 0.01), LPI (p < 0.01) and AREA_MN (p < 0.01) of construction land. In the buffer zone with the 5000 m radius, the PM2.5 concentration had significant correlations with the PD (p < 0.01) and NP (p < 0.01) of forest land, the PD (p < 0.01) and NP (p < 0.01) of grassland and the ED (p < 0.01) of construction land.
The PM10 concentration was significantly correlated with the ED (p < 0.01) and AREA_MN (p < 0.01) of construction land in the buffer zone with the 1000 m radius, and it was also significantly correlated with the LPI (p < 0.05) and AREA_MN (p < 0.05) of grassland within the 2000 m radius. For the radius of 3000 m, the PM10 concentration was significantly correlated with the PLAND (p < 0.01) of forest land and the PD (p < 0.05) and NP (p < 0.05) of construction land. In the buffer zone with the 4000 m radius, the PM10 concentration was correlated with the PLAND (p < 0.01), ED (p < 0.01) and AREA_MN (p < 0.01) of forest land and the LPI (p < 0.01) of construction land. Within the 5000 m radius, the PM10 concentration had correlations with the LPI (p < 0.01), PD (p < 0.05) and NP (p < 0.05) of forest land, the ED (p < 0.01), PD (p < 0.01) and NP (p < 0.01) of grassland, and the PLAND (p < 0.01) and ED (p < 0.01) of construction land.
3.3.2. Correlations with the Seasonal Air Pollutant Concentrations
By analyzing the correlations, the influences of landscape patterns on the air pollutants in different seasons are compared (Figure 5, Figure 6 and Figure 7). The results indicate that the correlation of the landscape metrics of water area and unused land with the air pollutant concentrations in the established buffer zones was not significant and thus not discussed in this study.
In the spring, the LPI of forest land had the most obvious influence on the AQI in the buffer zone with the 5000 m radius, and the correlation coefficient was −0.778. The LPI of forest land and the NP of grassland had the most significant correlations with the PM2.5 concentration within the 5000 m radius, with identical coefficients of −0.684. Within the radius of 4000 m, the PLAND of forest land had remarkable effects on the PM10 concentration, with a correlation coefficient of −0.733.
In the summer, the LPI of forest land had the most remarkable effect on the AQI within the radius of 5000 m, with a correlation coefficient of −0.739. The AREA_MN of forest land had the most significant correlation with the PM2.5 concentration within the 5000 m radius, and the correlation coefficient was −0.658. The LPI of forest land had the most remarkable effect on the PM10 concentration within the 4000 m radius, with a correlation coefficient of −0.732.
In autumn, the PLAND and LPI of cultivated land were most significantly correlated with the AQI within the radius of 1000 m, with coefficients of 0.834 and −0.834, respectively. The effects of PLAND and LPI of the cultivated land on the PM2.5 concentration were the most remarkable within the radius of 1000 m, and both correlation coefficients were 0.955. The PLAND of construction land had the most obvious effect on the PM10 concentration within the 4000 m radius, with a correlation coefficient of 0.719.
In the winter, the effect of the PLAND of forest land on the AQI was the most obvious within the 4000 m radius, with a correlation coefficient of −0.704. The effects of the PLAND and LPI of forest land on the PM2.5 concentration were the most remarkable within the radius of 1000 m, both with a correlation coefficient of −0.726. The PLAND of construction land was most significantly correlated with the PM10 concentration within the 4000 m radius, and the correlation coefficient was 0.723.
Overall, forest land had the most remarkable influence on the air pollutants for all the types of land use/cover and landscape, as shown by the fact that all the landscape metrics were significantly correlated with the AQI and PM2.5 and PM10 concentrations in the four different seasons. Some landscape metrics of cultivated land, construction land and grassland in different seasons were not correlated with the air pollutants. There was a significant correlation between the landscape metrics of forest land and the PM2.5 concentration at various spatial scales in autumn and winter, especially for the PLAND, AREA_MN and LPI. However, the correlations between the landscape metrics of forest land and the PM2.5 concentration were significant at only one spatial scale in spring and summer. The correlations of the NP and PD with the air pollutants were significant in the four different seasons, all appearing at large spatial scales of 4000–5000 m. The PLAND of construction land had the most remarkable influence on the PM10 concentration in the autumn and winter within a radius of 4000 m. The effects of the PLAND of cultivated land on the AQI and PM2.5 concentration were most significant only within the 1000 m radius in autumn.
4. Discussion
Studies on air pollution in Fujian Province are relatively rare, which are compensated to some extent by our research. Our study shows similar results compared with objective reality and previous research. For instance, the research on Sichuan Province, which is also located in the subtropics, showed low pollutant concentrations in the summer and high concentrations in the winter [23]. Studies on the Yangtze River Delta have also yielded consistent results [24,25]. The long-term variations in the air pollutant concentrations are mainly influenced by the long-term variations in pollutant emissions, climate change and other factors [26]. Therefore, atmospheric particulate pollutant concentrations can be effectively reduced under good meteorological conditions or through emission reduction measures. The short-term variations (such as the seasonal variation) in the atmospheric particulate matter pollutant concentration are mainly attributed to meteorological elements, especially in the winter and spring when the concentrations are high [25,27]. In the winter, the airflow in our study area is dominated by northwesterly wind, the wind speed is low in this area and the humidity is high. A temperature inversion layer can promote the accumulation of pollutants and makes them difficult to diffuse, which is also a key cause of winter PM pollution events in southeastern China [26,28]. Additionally, rainfall intensity has been observed to play an important role in the removal of PM concentrations [29]. Thus, the seasonal variations in PM concentrations may be further enhanced by the lower rainfall volume and frequency in the winter, and their higher counterparts in the summer in the study area.
The AQI and PM10 concentration in construction land were considerably higher than those in the other types of land use/cover and landscape in all four seasons, and the PM2.5 concentration in construction land was the highest in the winter when pollution is the most serious. The PM2.5 concentration in forest land was significantly lower than that in the other land use/cover and landscape types in different seasons, and the AQI and PM10 concentration were also the lowest in winter. This result further verifies previous research findings that the increase in the construction land proportion can cause an increase in the PM2.5 concentration, while the increase in the green space proportion can decrease the PM2.5 concentration [30]. It is worth noting that cultivated land has a higher PM2.5 concentration in the spring and summer, which is related to intensive cultivation activities in the spring and summer. Therefore, intensive production activities from humans, the urbanization degree and the land use/cover changes with the alternation of seasons are the main influencing factors for variations in the regional air pollutant concentrations [31].
With continuous economic and social development and an increasing urbanization level, car ownership has increased year by year, and the contribution of traffic emissions to atmospheric particulate pollutant concentrations increases sharply, which directly damages the urban environment and deserves further attention [32]. Moreover, an interesting phenomenon can be found in this study, whereby grassland showed the lowest AQI value and PM10 concentration in all seasons except for winter, even lower than forest land. This result suggests that forest land is more effective in mitigating the fine particulate matter concentration, while grassland has a better mitigation effect on the coarse particulate matter concentration. The mitigation effect of grassland on atmospheric particulate pollutant concentrations is weakened in winter, mainly because grassland withers in winter and the withering of grassland dramatically reduces its ability to absorb atmospheric particulate pollutants [31]. This conclusion can be further verified by the fact that the PM2.5 concentration in the grassland increased faster than in the other land use/cover types in winter (Figure 3).
Previous research demonstrated that the mitigation effects of forest land and grassland on the air pollutant concentrations increase with their area, while fragmented forest land and grassland have less of a mitigation effect. However, construction land has the opposite effect [23,31]. Our study obtains similar results. The PLAND and AREA_MN of forest land was significantly negatively correlated with the AQI, PM2.5 concentration and PM10 concentration, while the NP and PD of forest land had significant positive correlations. Additionally, the PLAND and LPI of construction land had significant positive correlations with the AQI and PM2.5 and PM10 concentrations, while the PD and NP of construction land were significantly negatively correlated with the AQI and PM10 concentration. Surprisingly, the NP and PD of grassland were significantly negatively correlated with the AQI and the PM2.5 and PM10 concentrations, which was mainly attributed to the small area of grassland in our study area and its frequent interspersed distribution with forest land. Therefore, the NP and PD of grassland were larger, which implies that the NP and PD of forest land were smaller. Such a landscape pattern is conducive to the mitigation of atmospheric particulate pollutants.
Although previous studies have compared the effects of land use/cover types and landscape patterns on the mitigation of air pollution in different seasons [23,31], the scale effects of land use/cover types and landscape patterns have been ignored. By constructing zone buffers with different radii from 1000 m to 5000 m, we explored the seasonal effects of landscape metrics on the atmospheric particulate pollutants at different scales in this study. We further found that the mitigation effect of forest land on the PM2.5 concentration in the autumn and winter could appear at multiple spatial scales, especially for the PLAND, AREA_MN and LPI of forest land. However, in the spring and summer, the significant correlation of landscape metrics with the PM2.5 concentration appeared at only one spatial scale (Figure 6). In addition, the impact range (generally 4000–5000 m) of the fragmentation indicators (such as the NP and PD) on the atmospheric particulate pollutants tended to be larger than that (typically 1000–3000 m) of the area-shape indicators (such as the PLAND and AREA_MN). This indicates that the spatial configuration of the integrity and connectivity of ecological green landscape patches should be fully considered on a large scale. On a smaller scale, atmospheric particulate pollution can be mitigated by increasing the proportion or size of the ecological green landscape patches.
5. Conclusions
Based on the air pollutant monitoring data of 37 national ambient air automatic monitoring stations and land use/cover data in Fujian Province in 2018, we investigated the distributions of the AQI, PM2.5 concentration and PM10 concentration and their seasonal variations in different land use/cover types and landscape patterns based on the ArcGIS, Fragstats and SPSS software. Through the analysis in the multi-loop buffer zones, we analyzed the correlations of different metrics of land use/cover and landscape types with air pollutant concentrations and discussed the effect of scale changes. The main conclusions are as follows.
In terms of the annual average, the AQI and PM10 concentration had the highest values on construction land, while the PM2.5 concentration was the highest on cultivated land.
For the seasonal average, the AQI, PM2.5 concentration and PM10 concentration showed similar variation trends of being high in the spring and winter and low in the summer and autumn.
The correlations with the annual air pollutant concentrations indicated that the landscape metrics significantly correlated with the AQI, PM2.5 concentration and PM10 concentration were distributed in forest land, grassland and construction land. The forest land plays a positive role in the mitigation of particulate pollutants and the construction land plays a positive role in promoting the emission of particulate pollutants.
The correlations with the seasonal air pollutant concentrations suggest that all landscape metrics of forest land were significantly correlated with air pollutant concentrations in the four different seasons, while some landscape metrics of cultivated land, construction land and grassland were not correlated with them. Except for autumn, the landscape metrics of forest land showed the most significant negative correlation with the AQI, PM2.5 concentration and PM10 concentration in all seasons. However, the landscape metrics of cultivated land had strong negative correlations with the AQI value and PM2.5 concentration in autumn. The positive correlations of the landscape metrics of construction land with the PM10 concentration were also significant in autumn and winter.
The optimal scale for studying the influences of forest land and construction land on the annual AQI and PM10 concentration is 5000 m, while the optimal scale is 3000 m for the PM2.5 concentration. The optimal scale for investigating the impacts of forest land and construction land on the AQI, PM2.5 concentration and PM10 concentration in different seasons is 4000–5000 m. Additionally, the optimal research scale for the effects of cultivated land on the AQI and PM2.5 concentration in autumn is 1000 m.
The results obtained in this research can help to further understand the influences of land use/cover types and landscape patterns on atmospheric particulate matters, can provide a reference for the optimization of land use/cover and landscape patterns in urban areas, and can serve as a scientific basis for the planning and management of forest land. Moreover, this study can provide a reference for decision-making on the prevention and mitigation of atmospheric particulate pollution.
Author Contributions
Conceptualization, F.L. and X.C.; methodology, F.L.; software, F.L.; validation, X.C.; formal analysis, F.L.; investigation, F.L.; data curation, F.L.; writing—original draft preparation, F.L.; writing—review and editing, X.C.; visualization, F.L.; supervision, X.C. All authors have read and agreed to the published version of the manuscript.
Funding
This research received no external funding.
Institutional Review Board Statement
Not applicable.
Informed Consent Statement
Not applicable.
Data Availability Statement
The data are contained within the article, and all data sources are mentioned.
Conflicts of Interest
The authors declare no conflict of interest.
References
- Dai, W.; Gao, J.Q.; Cao, G.; Ouyang, F. Chemical composition and source identification of PM2.5, in the suburb of Shenzhen, China. Atmos. Res. 2013, 122, 391–400. [Google Scholar] [CrossRef]
- Yan, G.X.; Yang, Z.; Xi, D.D. Characteristics and source analysis of Water-soluble ions in fine particulate matter PM2.5 in Xinxiang City in autumn. Acta Sci. Circumstantiae 2017, 38, 640–648. [Google Scholar]
- Chen, Y.; Xie, S.D.; Luo, B.; Zhai, C.Z. Pollution characteristics and sources of fine particulate matter in the main urban area of Chongqing. Acta Sci. Circumstantiae 2016, 37, 2420–2430. [Google Scholar]
- Duan, E.H.; Zhang, W.W.; Li, X.; Xiao, J.Y.; Yu, L.; Duan, L.L. Characteristics of PAHs pollution in fine particulate matter during heating period in Shijiazhuang City. Res. Environ. Sci. 2016, 30, 193–201. [Google Scholar]
- Song, H.X.; Yu, L.; Zhai, F.S.; Yu, S.C. Research progress in monitoring and controlling urban fine particulate matter PM2.5. J. Green Sci. Technol. 2018, 16, 29–32. [Google Scholar]
- Pui, D.Y.H.; Chen, S.C.; Zuo, Z. PM2.5 in China: Measurements, sources, visibility and health effects, and mitigation. Particuology 2014, 13, 1–26. [Google Scholar] [CrossRef]
- Yang, F.M.; He, K.B.; Ma, Y.L.; Chen, X.; Steven, H.C.; Tai, C.; Patricia, A.M. Variation characteristics and sources of trace elements in PM2.5 in Beijing. Environ. Sci. 2003, 24, 33–37. [Google Scholar]
- Wang, J.; Wang, X.K.; Zhang, H.X.; Lu, F.; Hou, P.Q. Study on the difference of PM2.5 concentration and element composition between two typical stations in Beijing urban area. Acta Sci. Circumstantiae 2012, 32, 74–80. [Google Scholar]
- Zhang, J.; Chen, Z.L. Analysis of pollution sources of small particulate matter in Beijing. Acta Sci. Circumstantiae 1998, 18, 62–67. [Google Scholar]
- Querol, X.; Alastuey, A.; Rodriguez, S.; Viana, M.M.; Artinano, B.; Salvador, P.; Mantilla, E.; Garcia do Santos, S.; Fernandez Patier, R.; de La Rosa, J.; et al. Levels of particulate matter in rural, urban and industrial sites in Spain. Sci. Total Environ. 2004, 334–335, 359–376. [Google Scholar] [CrossRef]
- Wang, Z.S.; Li, Y.T.; Chen, T.; Zhang, D.W.; Sun, F.; Pan, L.B. Spatial and temporal distribution of PM2.5 in Beijing in 2013. Acta Geogr. Sin. 2015, 70, 110–120. [Google Scholar]
- Li, S.; Deng, B.K.; Shao, J.X.; Xu, H.Q.; Li, L. Study on transition characteristics and influencing factors of PM2.5 mass concentration in Guiyang based on GIS. Ecol. Environ. Sci. 2014, 23, 1298–1304. [Google Scholar]
- Schaufler, G.; Kitzler, B.; Schindlbacher, A.; Skiba, U.; Sutton, M.A.; Zechmeister-Boltenstern, S. Greenhouse gas emissions from European soils under different land use: Effects of soil moisture and temperature. Eur. J. Soil Sci. 2010, 61, 683–696. [Google Scholar] [CrossRef]
- Li, S.P.; Liu, J.L.; Lin, J.; Fan, S.L. Spatial and temporal evolution of habitat quality based on land use change in Fujian Province from 1980 to 2018. Chin. J. Appl. Ecol. 2020, 31, 4080–4090. [Google Scholar]
- Hansen, M.C.; Potapov, P.V.; Moore, R.; Hancher, M.; Turubanova, S.A.; Tyukavina, A.; Thau, D.; Stehman, S.V.; Goetz, S.J.; Loveland, T.R.; et al. High-Resolution Global Maps of 21st-Century Forest Cover Change. Science 2013, 342, 850–853. [Google Scholar] [CrossRef]
- Liu, Y.P.; Wu, J.G.; Yu, D.Y. Characterizing spatiotemporal patterns of air pollution in China: A multiscale landscape approach. Ecol. Indic. 2017, 76, 344–356. [Google Scholar] [CrossRef]
- Łowicki, D. Landscape pattern as an indicator of urban air pollution of particulate matter in Poland. Ecol. Indic. 2019, 97, 17–35624. [Google Scholar] [CrossRef]
- Li, H.; Wu, J. Use and misuse of landscape indices. Landsc. Ecol. 2004, 19, 389–399. [Google Scholar] [CrossRef]
- McGarigal, K.; Cushman, S.A.; Neel, M.C.; Ene, E. FRAGSTATS: Spatial Pattern Analysis Program for Categorical Maps; University of Massachusetts: Amherst, MA, USA, 2002. [Google Scholar]
- Chen, A.L.; Sun, R.H.; Chen, L.D. The regulation function of green space pattern on urban surface thermal environment. Acta Ecol. Sin. 2013, 33, 2372–2380. [Google Scholar] [CrossRef]
- Weber, N.; Haase, D.; Franck, U. Assessing modelled outdoor traffic-induced noise and air pollution around urban structures using the concept of landscape metrics. Landsc. Urban Plan. 2014, 125, 105–116. [Google Scholar] [CrossRef]
- Maimaitiyiming, M.; Ghulam, A.; Tiyip, T.; Pla, F.; Latorre-Carmona, P.; Halik, M.; Sawut, M.; Caetano, M. Effects of green space spatial pattern on land surface temperature: Implications for sustainable urban planning and climate change adaptation. ISPRS J. Photogramm. Remote Sens. 2014, 89, 59–66. [Google Scholar] [CrossRef]
- Li, H.N.; Zeng, S.L. Correlation between land use change and air pollutants. J. Chengdu Univ. Inf. Technol. 2022, 37, 221–233. [Google Scholar]
- Han, B.W.; Ma, X.Y. Analysis on impact of strong haze events and weather situation in Yangtze River Delta during winter 2014–2018. Acta Sci. Circumstantiae 2020, 40, 2333–2345. [Google Scholar]
- Xiong, Y.F.; Ding, Q.J.; Shu, Z.Z.; Liu, Y.B.; Zhao, T.L. Meteorological impact of winter PM2.5 pollution process in the Yangtze River Delta based on numerical simulation and data assimilation. Acta Sci. Circumstantiae 2022, 42, 293–303. [Google Scholar]
- Chen, H.; Zhang, Y.J.; Zhan, Q.; Zhang, K.X.; Gai, X.L. Trend characteristics of atmospheric particulate matter in the Yangtze River Delta from 2015 to 2021 were analyzed based on KZ filtering method. Acta Sci. Circumstantiae 2023, 1–9. [Google Scholar] [CrossRef]
- Li, R.; Li, Q.; Xu, J.; Li, L.; Ge, C.J.; Huang, L.; Sun, D.H.; Liu, Z.Y.; Zhang, K.; Zhou, G.Z.; et al. Impact of regional air pollution processes in autumn and winter on typical cities in northern Yangtze River Delta. Environ. Sci. 2020, 41, 1520–1534. [Google Scholar]
- Zhang, X.Y.; Xu, X.D.; Ding, Y.H.; Liu, Y.J.; Zhang, H.D.; Wang, Y.Q.; Zhong, J.T. Impact of meteorological conditions on the decrease of PM2.5 mass concentration in key areas of China from 2013 to 2017. Sci. Sin. Terrae 2020, 50, 483–500. [Google Scholar]
- Zhou, S.J.; Cong, L.; Liu, Y.; Xie, L.M.; Zhao, S.Q.; Zhang, Z.M. Rainfall intensity plays an important role in the removal of PM from the leaf surfaces. Ecol. Indic. 2021, 128, 107778. [Google Scholar] [CrossRef]
- Tang, Y.K.; Liu, S.H. A study on the correlation between urban land use type and PM2.5 degree in Wuhan City. Resour. Environ. Yangtze Basin 2015, 24, 1458–1463. [Google Scholar]
- Ma, B.L.; Wang, L.; Hua, Y.C. Correlation analysis of fine particle pollutants and land cover landscape pattern in Beijing. For. Resour. Manag. 2021, 94–103. [Google Scholar] [CrossRef]
- Luo, B.R.; Cao, R.H.; Chen, X.; Hu, X.S.; Wang, Z.Y. Spatial and temporal distribution of traffic particles on urban slow roads. J. Shanghai Univ. (Nat. Sci. Ed.) 2022, 28, 582–593. [Google Scholar]
Figure 1.
(a) Distributions of landscape types and national ambient air automatic monitoring stations and (b) areas of various land cover types in Fujian Province.
Figure 1.
(a) Distributions of landscape types and national ambient air automatic monitoring stations and (b) areas of various land cover types in Fujian Province.

Figure 2.
Box plots of annual average atmospheric particulate matter concentrations.
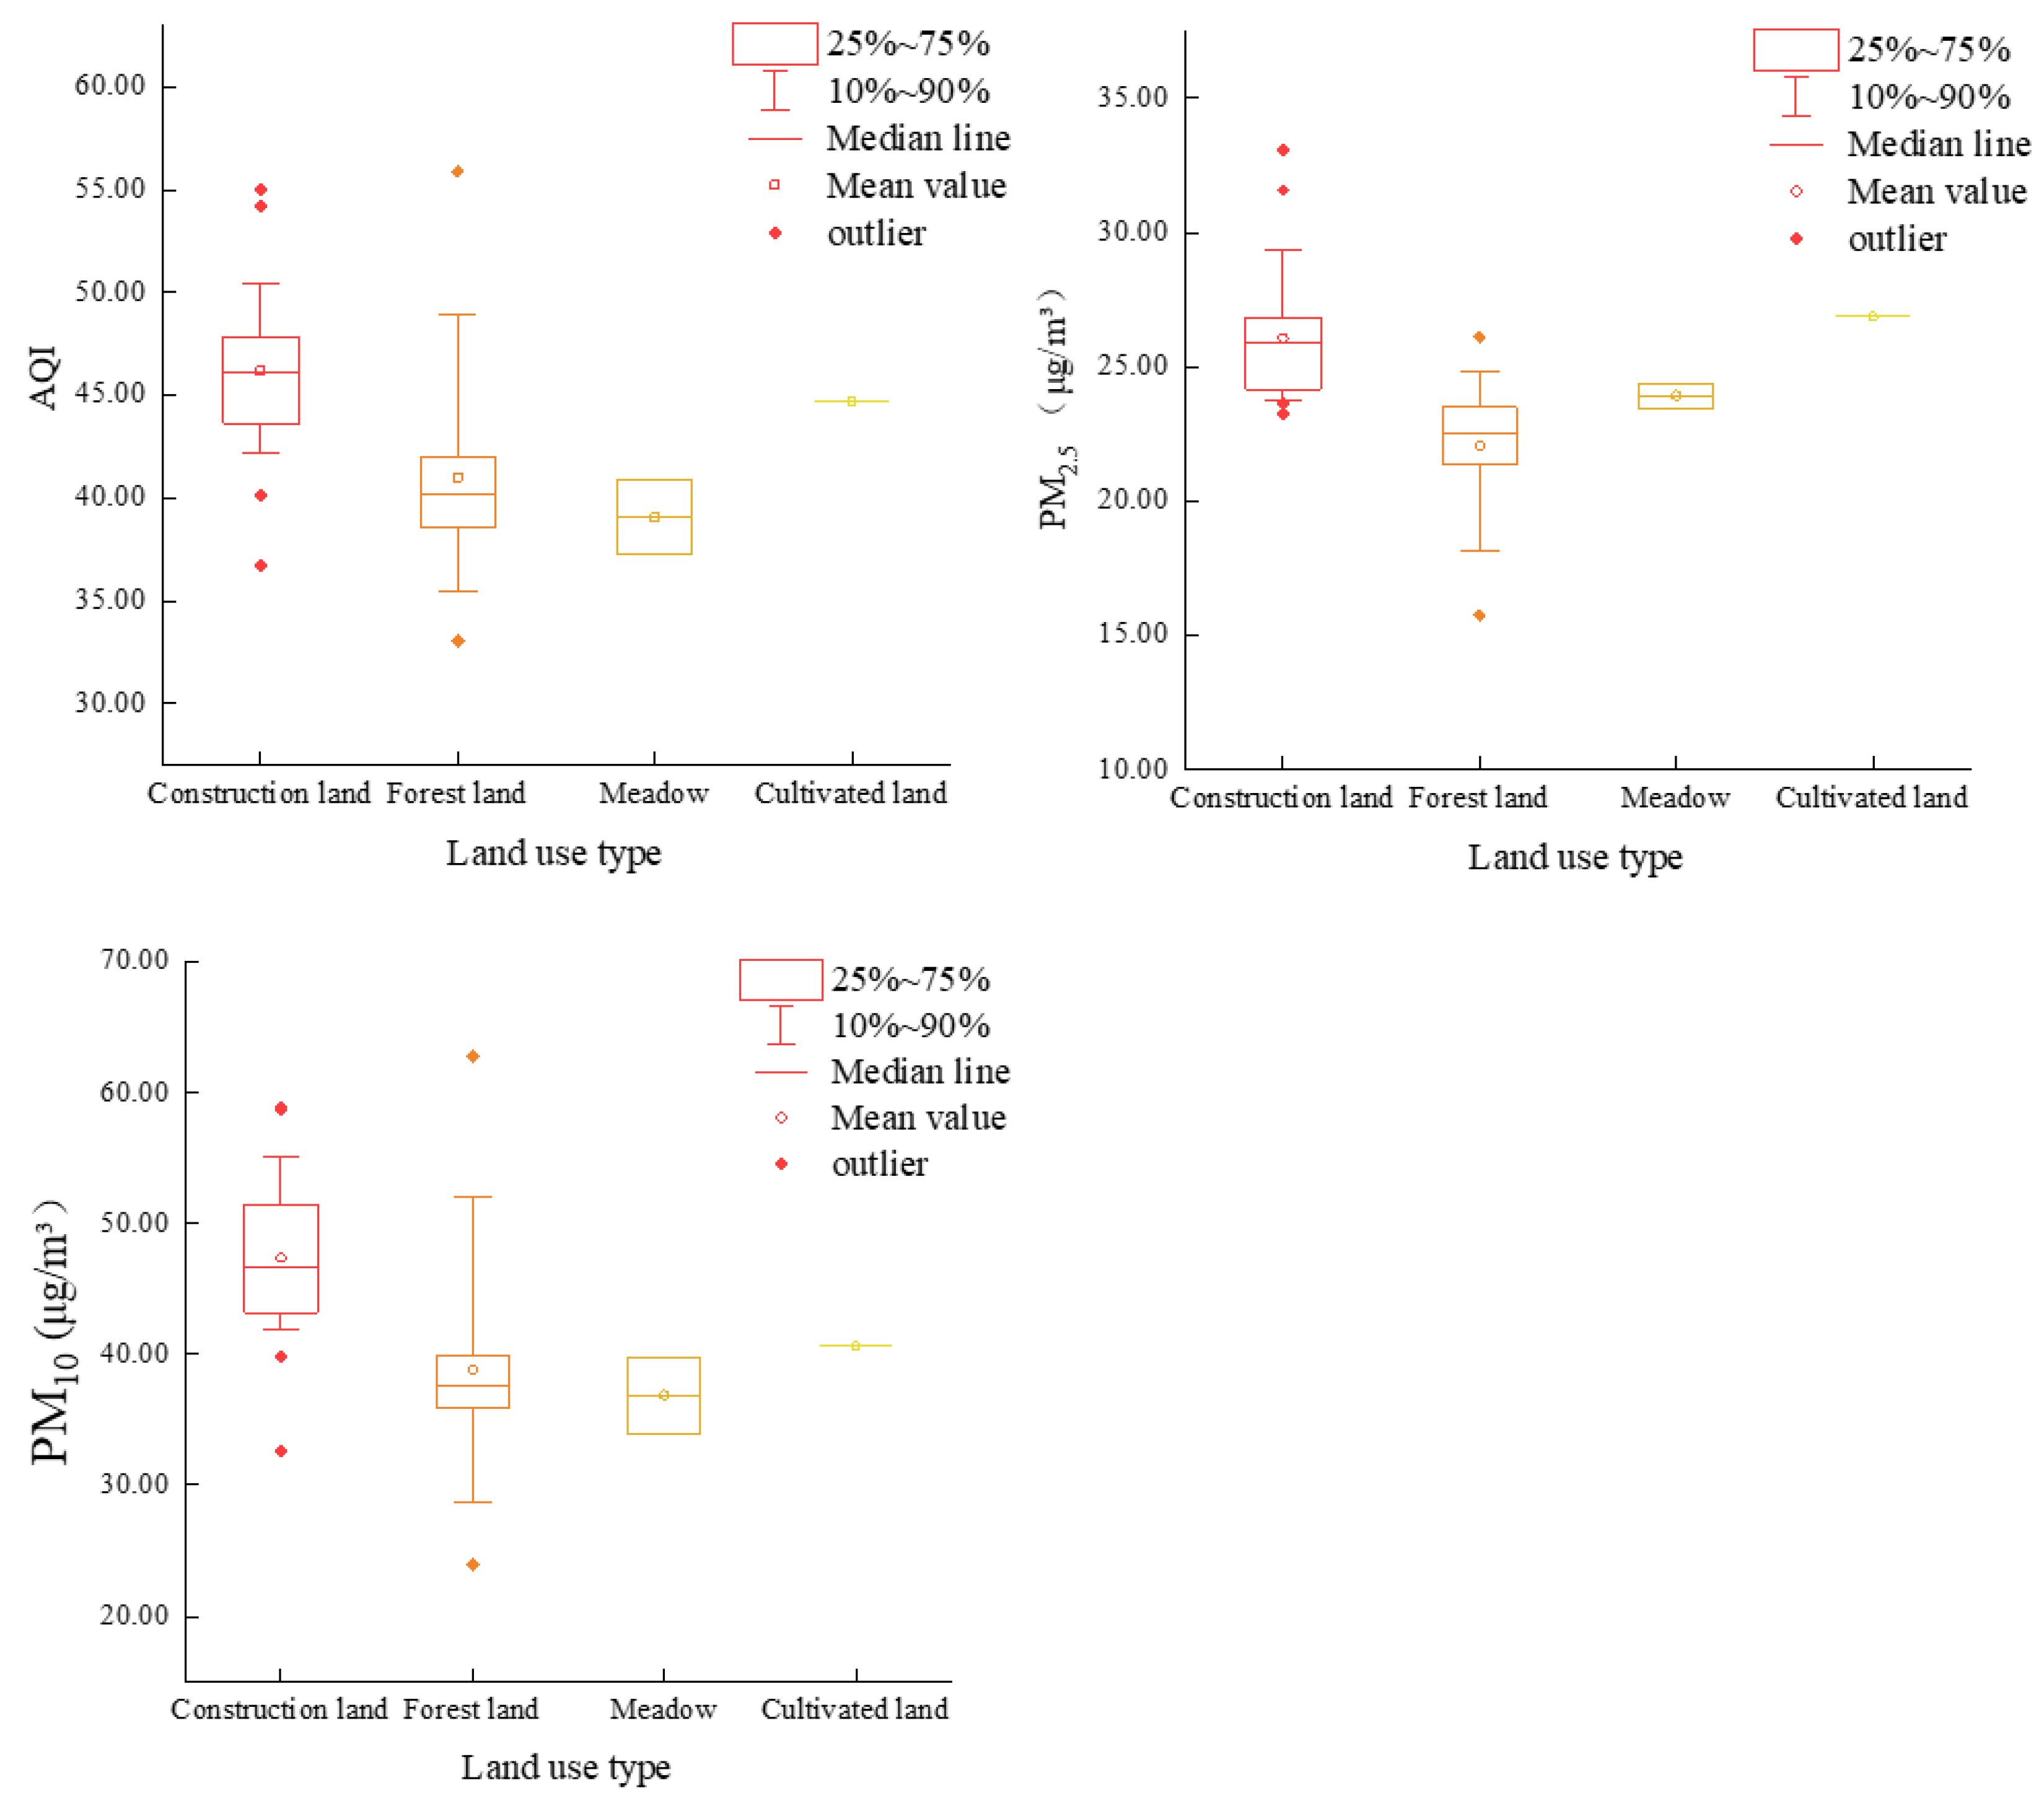
Figure 3.
Seasonal variations in the particulate matter concentrations for different land use types.
Figure 3.
Seasonal variations in the particulate matter concentrations for different land use types.

Figure 4.
Correlations of the landscape metrics with the averaged AQI, PM2.5 and PM10 concentration in the different buffer zones. * and ** indicate the statistical significance level of 0.05 and 0.01, respectively.
Figure 4.
Correlations of the landscape metrics with the averaged AQI, PM2.5 and PM10 concentration in the different buffer zones. * and ** indicate the statistical significance level of 0.05 and 0.01, respectively.
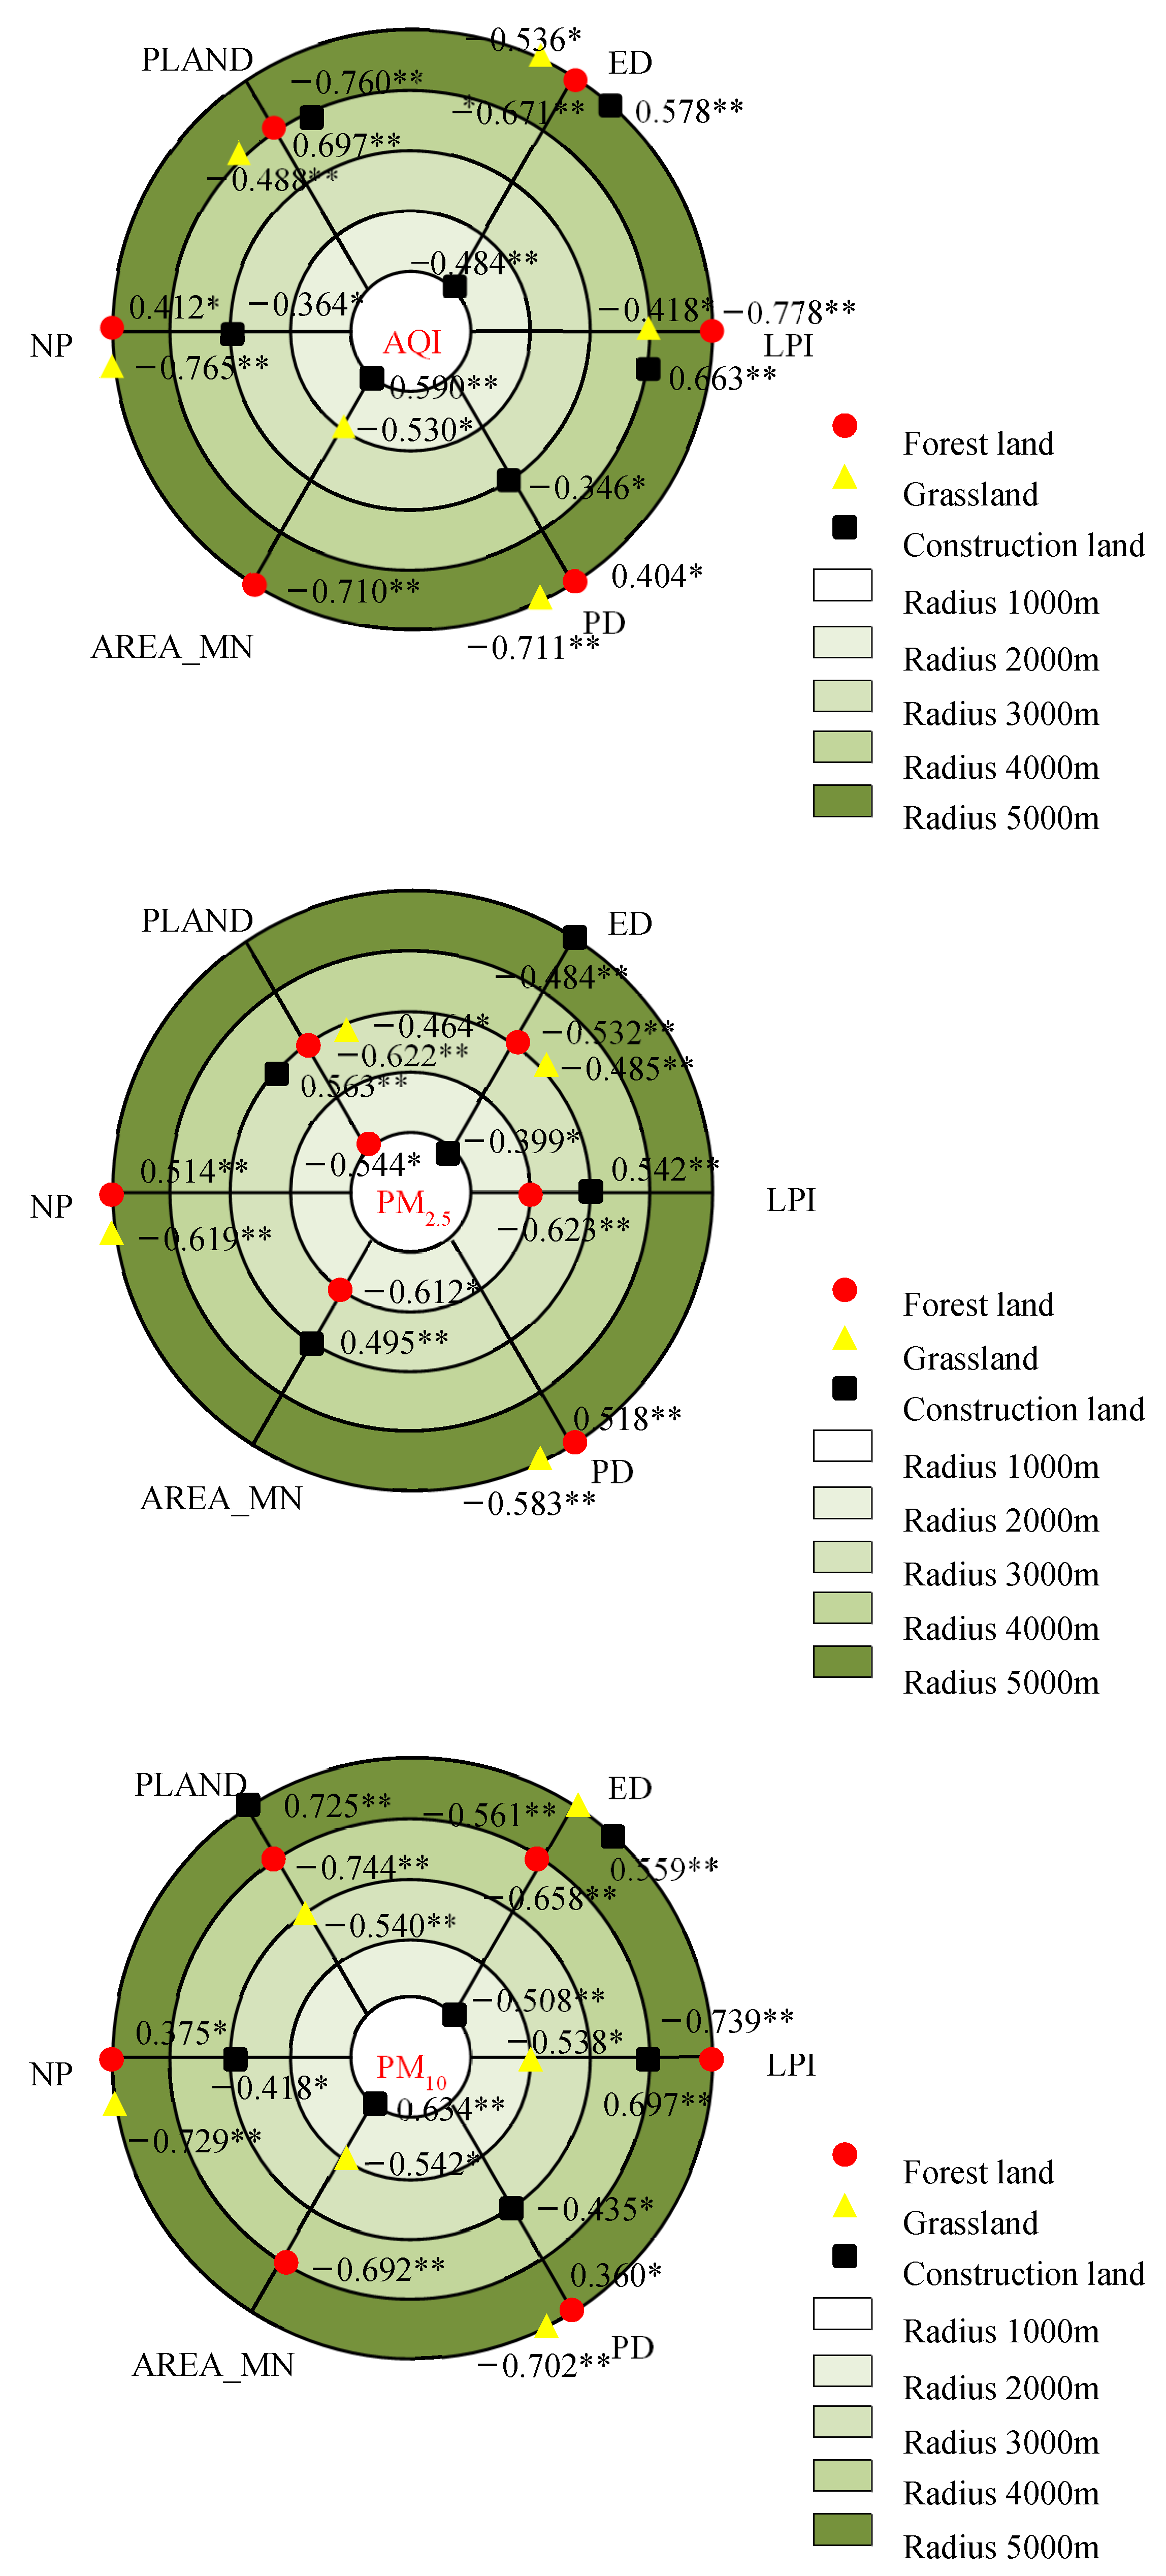
Figure 5.
Correlations of the landscape metrics with seasonal mean AQI in the different buffer zones. * and ** indicate the statistical significance level of 0.05 and 0.01, respectively.
Figure 5.
Correlations of the landscape metrics with seasonal mean AQI in the different buffer zones. * and ** indicate the statistical significance level of 0.05 and 0.01, respectively.


Figure 6.
Correlations of the landscape metrics with seasonal mean PM2.5 concentration in the different buffer zones. * and ** indicate the statistical significance level of 0.05 and 0.01, respectively.
Figure 6.
Correlations of the landscape metrics with seasonal mean PM2.5 concentration in the different buffer zones. * and ** indicate the statistical significance level of 0.05 and 0.01, respectively.


Figure 7.
Correlations of the landscape metrics with seasonal mean PM10 concentration in the different buffer zones. * and ** indicate the statistical significance level of 0.05 and 0.01, respectively.
Figure 7.
Correlations of the landscape metrics with seasonal mean PM10 concentration in the different buffer zones. * and ** indicate the statistical significance level of 0.05 and 0.01, respectively.


Table 1.
Landscape index selection.
| Landscape Index | Definition |
|---|---|
| Proportion of landscape (PLAND) | This index reflects the percentage of the total area of a certain patch type to the entire landscape area, determining the basis of judging dominant landscape elements in the landscape. |
| Largest patch index (LPI) | The proportion of the largest patch of a certain patch type to the entire landscape area, and the change in its values can reflect the direction and strength of human activities. |
| Mean patch area (AREA_MN) | The average area of patches in the landscape or in each type. |
| Edge density (ED) | The boundary length or total boundary length of each patch type on a unit area, which reveals the degree of fragmentation of the landscape or type divided by the boundaries. |
| Number of patches (NP) | The number of patches in the landscape or in each type, which reflects the degree of landscape fragmentation. |
| Patch density (PD) | The basic index in the landscape pattern analysis. When the landscape area is fixed, it conveys the same information as the NP. |
Disclaimer/Publisher’s Note: The statements, opinions and data contained in all publications are solely those of the individual author(s) and contributor(s) and not of MDPI and/or the editor(s). MDPI and/or the editor(s) disclaim responsibility for any injury to people or property resulting from any ideas, methods, instructions or products referred to in the content. |
© 2023 by the authors. Licensee MDPI, Basel, Switzerland. This article is an open access article distributed under the terms and conditions of the Creative Commons Attribution (CC BY) license (https://creativecommons.org/licenses/by/4.0/).
Share and Cite
MDPI and ACS Style
Lin, F.; Chen, X. Effects of Landscape Patterns on Atmospheric Particulate Matter Concentrations in Fujian Province, China. Atmosphere 2023, 14, 787. https://doi.org/10.3390/atmos14050787
AMA Style
Lin F, Chen X. Effects of Landscape Patterns on Atmospheric Particulate Matter Concentrations in Fujian Province, China. Atmosphere. 2023; 14(5):787. https://doi.org/10.3390/atmos14050787
Chicago/Turabian StyleLin, Fengyi, and Xingwei Chen. 2023. "Effects of Landscape Patterns on Atmospheric Particulate Matter Concentrations in Fujian Province, China" Atmosphere 14, no. 5: 787. https://doi.org/10.3390/atmos14050787
Note that from the first issue of 2016, this journal uses article numbers instead of page numbers. See further details here.