
An Assessment of the GLE Alert++ Warning System

 , , ,
, , ,
Abstract
:1. Introduction
2. GLE Alert++
Data
3. Assessment of the GLE Alert++
3.1. Availability of Real-Time Data
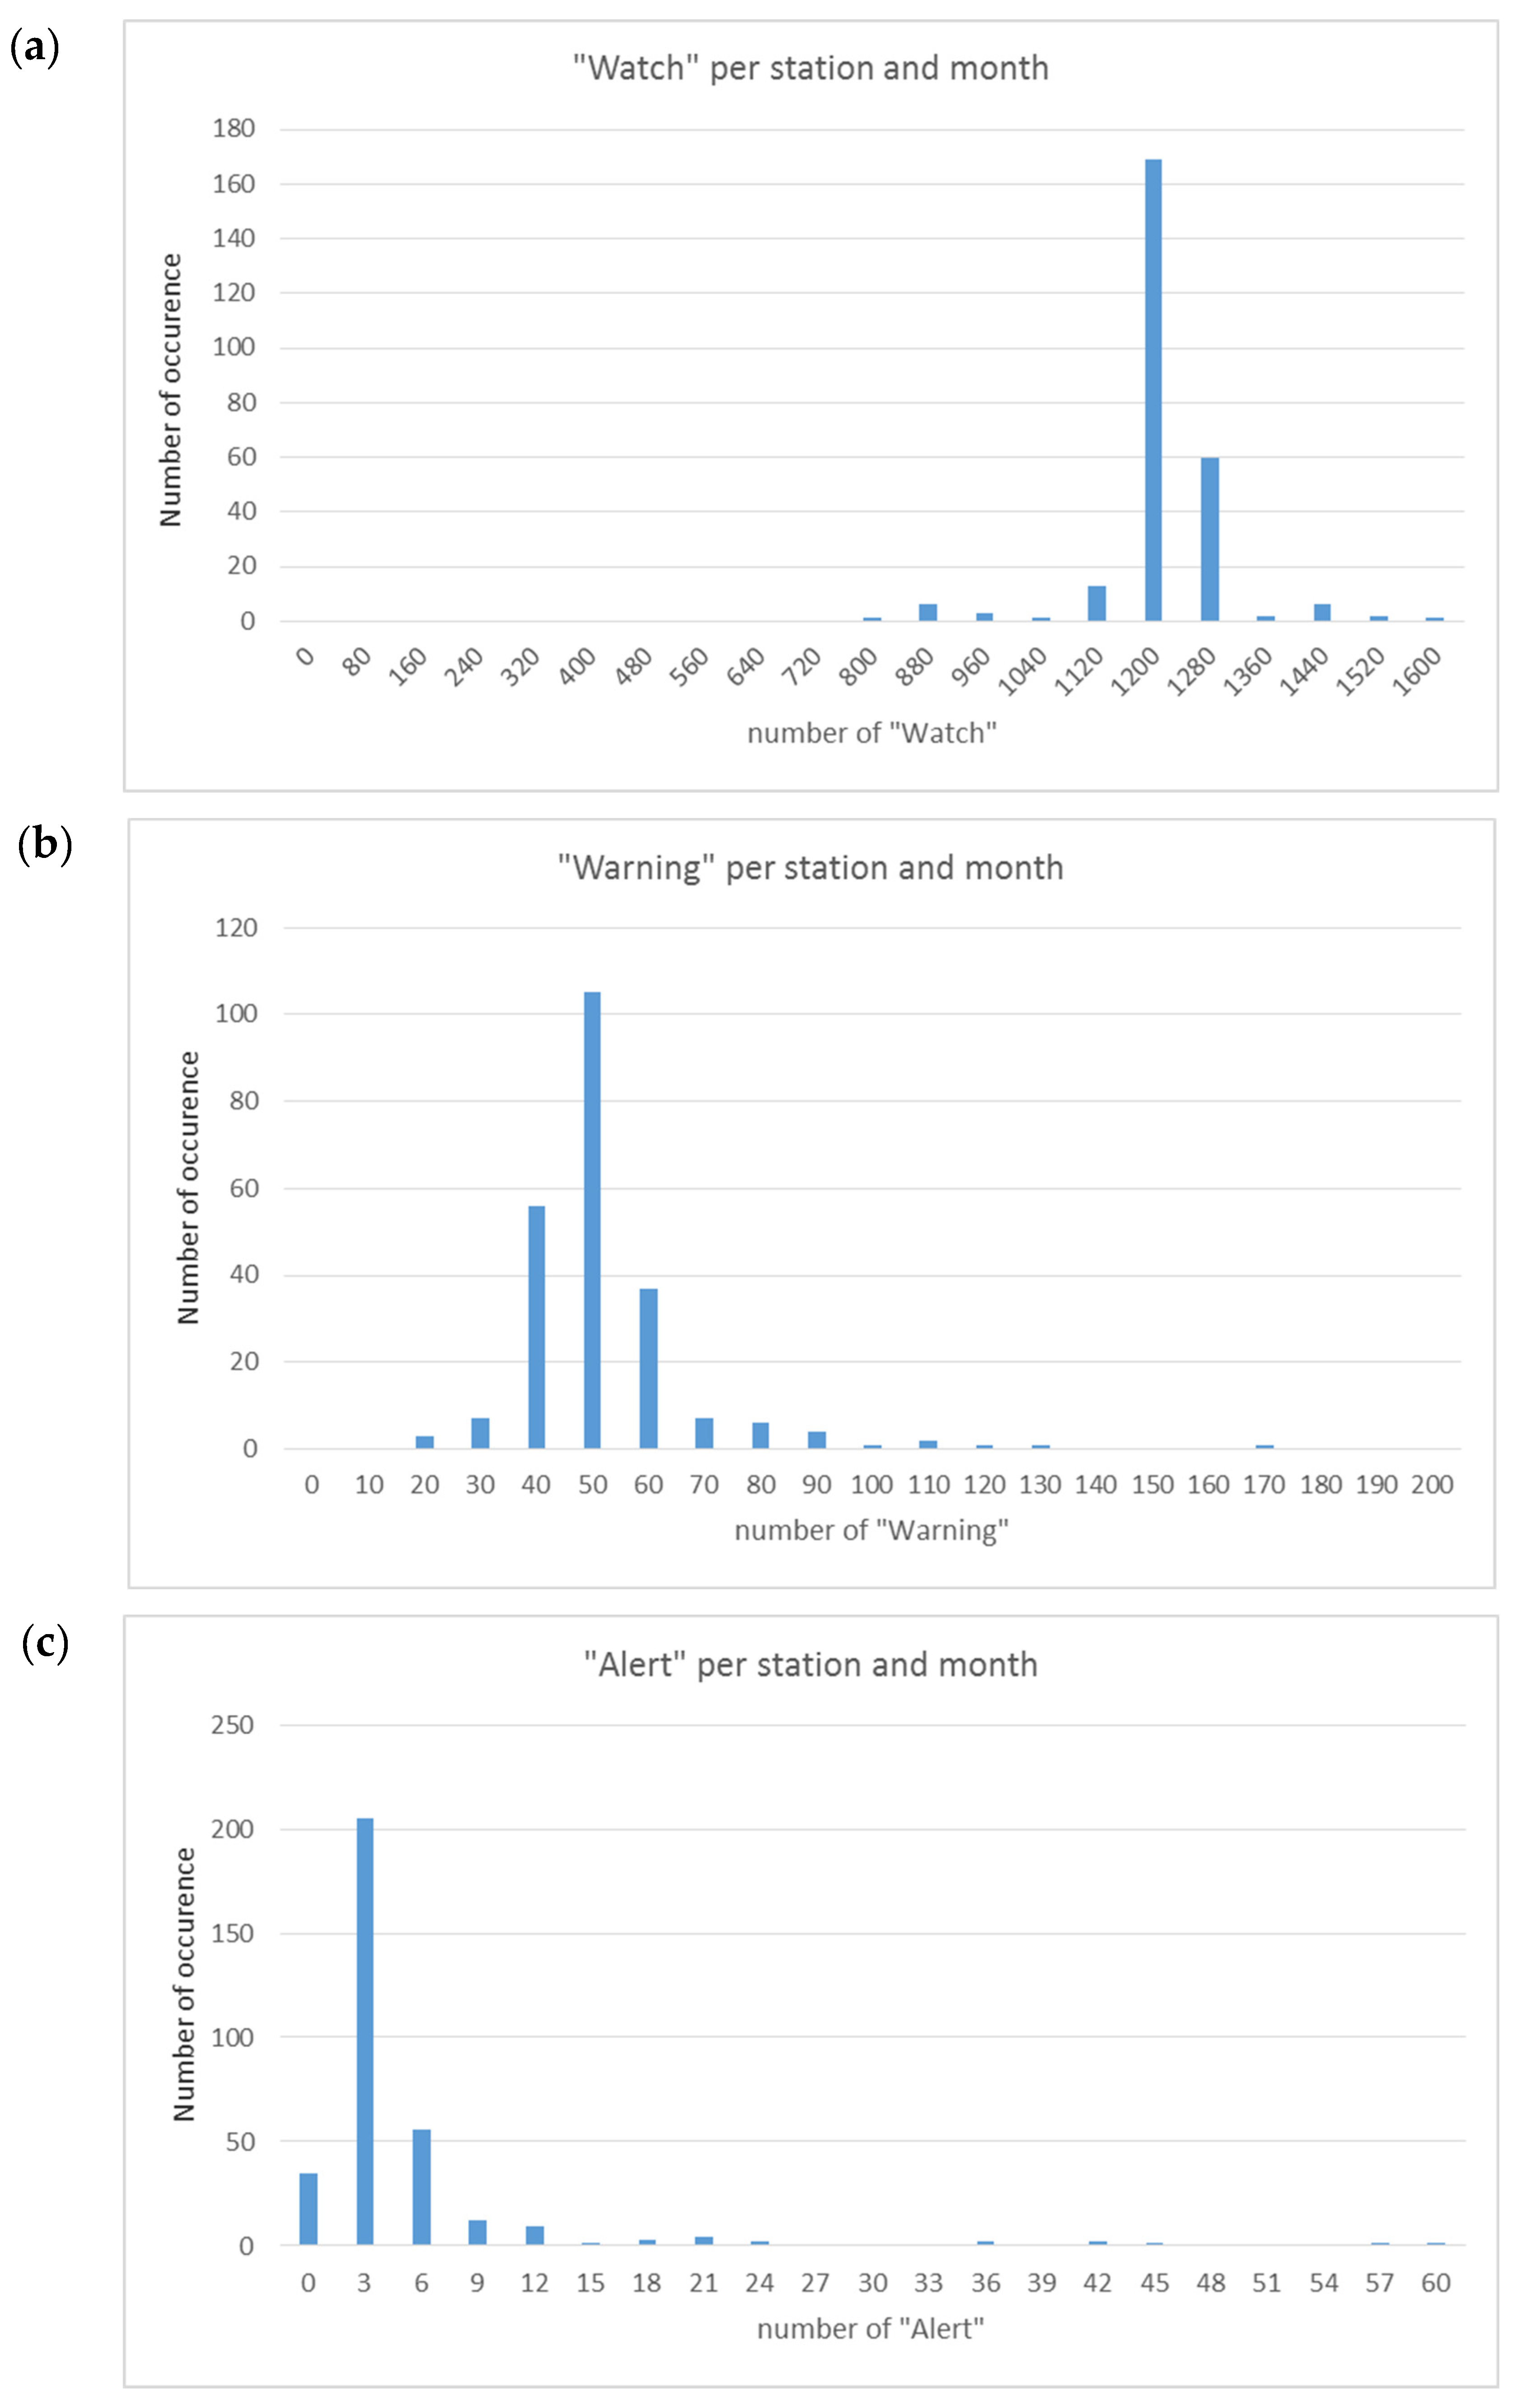
3.2. Assessment of the Different Levels of Alert Mode
- Watch assessment (green colour corresponds to 0–1300 watch modes in each month, yellow to 1301–1360 watch modes, and red to watch modes greater than 1361).
- Warning assessment (green colour corresponds to 0–60 warning modes in each month, yellow to 61–70 warning modes, and red to warning modes greater than 71).
- Alert assessment (green colour corresponds to 0–6 alert modes in each month, yellow to 7–9 alert modes, and red to alert modes greater than 10).

| NMs Used in the Current Version of GLE Alert++ (from Table 1) | |||||||||||||
|---|---|---|---|---|---|---|---|---|---|---|---|---|---|
| MM.YYYY | AATB | APTY | ATHN | BKSN | CALM | FSMT | INVK | IRK2 | IRK3 | IRKT | JUNG | JUNG1 | KERG |
| 08.2022 | 1 | 4 | 1 | 3 | 4 | 2 | 2 | 2 | 2 | 2 | 2 | 4 | |
| 07.2022 | 1 | 1 | 2 | 6 | 2 | 2 | 2 | 0 | 0 | 2 | 1 | 5 | |
| 06.2022 | 1 | 4 | 1 | 3 | 1 | 1 | 1 | 1 | 1 | 0 | 0 | 2 | 2 |
| 05.2022 | 2 | 4 | 2 | 1 | 1 | 1 | 0 | 3 | 2 | 1 | 1 | 6 | |
| 04.2022 | 1 | 2 | 0 | 1 | 1 | 3 | 2 | 3 | 6 | 8 | 2 | 4 | 2 |
| 03.2022 | 1 | 3 | 2 | 2 | 3 | 2 | 2 | 3 | 3 | 3 | 1 | 4 | 5 |
| 02.2022 | 0 | 3 | 2 | 2 | 1 | 2 | 1 | 3 | 2 | 2 | 2 | 1 | 6 |
| 01.2022 | 1 | 4 | 0 | 4 | 0 | 2 | 1 | 1 | 4 | 0 | 1 | 1 | 3 |
| 12.2021 | 1 | 1 | 2 | 2 | 1 | 1 | 1 | 1 | 1 | 3 | 3 | 2 | 4 |
| 11.2021 | 1 | 2 | 1 | 1 | 2 | 5 | 4 | 2 | 0 | 5 | 2 | 6 | 8 |
| 10.2021 | 0 | 4 | 2 | 0 | 3 | 2 | 3 | 2 | 1 | 5 | |||
| 09.2021 | 0 | 1 | 5 | 3 | 5 | 3 | 4 | 13 | 2 | 2 | |||
| 08.2021 | 0 | 0 | 0 | 5 | 4 | 6 | 2 | 1 | 4 | 2 | |||
| 07.2021 | 0 | 2 | 0 | 6 | 1 | 0 | 2 | 2 | 0 | 1 | |||
| 06.2021 | 2 | 2 | 3 | 9 | 3 | 3 | 1 | 3 | 2 | 1 | |||
| 05.2021 | 0 | 0 | 0 | 3 | 4 | 1 | 1 | 2 | 5 | 3 | 3 | ||
| 04.2021 | 0 | 1 | 3 | 3 | 1 | 4 | 2 | 2 | 0 | 2 | 1 | ||
| 03.2021 | 1 | 1 | 2 | 14 | 2 | 6 | 3 | 10 | 3 | 1 | 3 | ||
| 02.2021 | 1 | 4 | 2 | 7 | 1 | 2 | 5 | 0 | 5 | 1 | 4 | 6 | |
| 01.2021 | 4 | 2 | 3 | 4 | 0 | 0 | 2 | 2 | 0 | 3 | 4 | 1 | |
| 12.2020 | 1 | 5 | 3 | 2 | 1 | 8 | 2 | 4 | 0 | 5 | 3 | 1 | |
| 11.2020 | 2 | 2 | 2 | 4 | 1 | 7 | 3 | 4 | 1 | 1 | 1 | 2 | |
| 10.2020 | 4 | 2 | 3 | 0 | 2 | 1 | 1 | 2 | 4 | 1 | 2 | 4 | |
| 09.2020 | 1 | 4 | 1 | 6 | 0 | 3 | 0 | 0 | 0 | 2 | 2 | 5 | |
| 08.2020 | 2 | 0 | 2 | 6 | 0 | 6 | 1 | 3 | 4 | 1 | 3 | 12 | 0 |
| 07.2020 | 1 | 2 | 1 | 6 | 2 | 3 | 0 | 1 | 2 | 3 | 0 | 6 | 2 |
| 06.2020 | 1 | 2 | 0 | 8 | 3 | 6 | 1 | 0 | 0 | 3 | 1 | 0 | 9 |
| 05.2020 | 2 | 2 | 2 | 5 | 0 | 10 | 0 | 3 | 3 | 2 | 5 | 5 | 2 |
| 04.2020 | 6 | 0 | 2 | 3 | 11 | 1 | 1 | 3 | 2 | 6 | 3 | 4 | |
| 03.2020 | 1 | 6 | 2 | 3 | 13 | 0 | 0 | 10 | 0 | 3 | 1 | 2 | |
| 02.2020 | 1 | 3 | 0 | 3 | 3 | 14 | 0 | 2 | 0 | 0 | 1 | 2 | 2 |
| 01.2020 | 3 | 2 | 2 | 6 | 1 | 11 | 2 | 2 | 1 | 3 | 5 | 3 | |
| NMs Not Used in the Current Version of GLE Alert++ (from Table 2) | |||||||||||||
|---|---|---|---|---|---|---|---|---|---|---|---|---|---|
| MM.YYYY | AATA | BRBG | CALG | DJON | DOMB | DOMC | DRBS | HRMS | JBGO | MWSN | MXCO | NANM | NRLK |
| 08.2022 | 9 | 0 | 4 | 0 | 2 | 3 | 1 | 0 | |||||
| 07.2022 | 35 | 4 | 6 | 2 | 0 | 3 | 3 | 2 | |||||
| 06.2022 | 55 | 1 | 11 | 0 | 9 | 6 | 4 | 2 | |||||
| 05.2022 | 3 | 11 | 4 | 2 | 22 | 0 | 4 | ||||||
| 04.2022 | 1 | 11 | 1 | 1 | 2 | 2 | 1 | ||||||
| 03.2022 | 2 | 5 | 2 | 4 | 2 | 2 | 2 | ||||||
| 02.2022 | 3 | 3 | 2 | 3 | 1 | 2 | 2 | ||||||
| 01.2022 | 1 | 4 | 0 | 4 | 7 | 3 | 0 | ||||||
| 12.2021 | 2 | 0 | 3 | 3 | 3 | 0 | 1 | 2 | 2 | ||||
| 11.2021 | 7 | 1 | 2 | 1 | 4 | 4 | 0 | 5 | 0 | 5 | |||
| 10.2021 | 0 | 0 | 0 | 1 | 1 | 0 | 62 | 4 | 0 | ||||
| 09.2021 | 3 | 3 | 0 | 4 | 1 | 2 | 0 | 38 | 2 | 1 | |||
| 08.2021 | 3 | 3 | 5 | 0 | 2 | 5 | 0 | 0 | 2 | 1 | |||
| 07.2021 | 6 | 4 | 0 | 1 | 2 | 3 | 0 | 1 | 1 | 0 | |||
| 06.2021 | 11 | 5 | 1 | 0 | 2 | 0 | 5 | 1 | 3 | ||||
| 05.2021 | 19 | 2 | 0 | 3 | 1 | 0 | 4 | 1 | 47 | 1 | |||
| 04.2021 | 4 | 0 | 0 | 1 | 3 | 3 | 0 | 37 | 2 | 8 | 7 | ||
| 03.2021 | 5 | 1 | 1 | 2 | 1 | 0 | 1 | 0 | 5 | 1 | |||
| 02.2021 | 1 | 1 | 5 | 1 | 2 | 0 | 0 | 6 | 1 | 1 | 1 | ||
| 01.2021 | 0 | 1 | 2 | 3 | 3 | 0 | 3 | 2 | 2 | 6 | |||
| 12.2020 | 11 | 4 | 0 | 4 | 3 | 0 | 9 | 4 | 2 | 4 | |||
| 11.2020 | 0 | 1 | 4 | 4 | 14 | 2 | 7 | 2 | |||||
| 10.2020 | 10 | 1 | 0 | 2 | 4 | 1 | 2 | 0 | |||||
| 09.2020 | 1 | 4 | 2 | 4 | 14 | 4 | 4 | 2 | |||||
| 08.2020 | 5 | 3 | 2 | 5 | 6 | 12 | 1 | ||||||
| 07.2020 | 2 | 4 | 4 | 2 | 5 | 6 | 2 | 2 | 14 | 3 | |||
| 06.2020 | 2 | 1 | 144 | 8 | 1 | 4 | 0 | 1 | 4 | 3 | |||
| 05.2020 | 0 | 5 | 4 | 3 | 1 | 4 | 4 | 2 | 4 | ||||
| 04.2020 | 6 | 1 | 3 | 1 | 1 | 1 | 3 | 2 | 5 | ||||
| 03.2020 | 5 | 3 | 2 | 1 | 2 | 3 | 4 | 0 | 11 | ||||
| 02.2020 | 6 | 1 | 0 | 2 | 2 | 0 | 3 | 0 | 1 | 4 | |||
| 01.2020 | 15 | 2 | 0 | 3 | 2 | 1 | 1 | 0 | 0 | 4 | |||
3.3. Real Time Assessment Index
- Real-time Index = 100 × [61 × number of values with 1 min delay
- +60 × number of values with 2 min delay
- +59 × number of values with 3 min delay
- +…
- +2 × number of values with 60 min delay
- +1 × number of values with 61 min delay]/61 * total minutes of the month
4. Discussion and Conclusions
- The GLE Alert++ service needs timely and reliable real-time data
- GLE Alert++ uses historical NM data to validate and optimize the algorithm (access to the data, whether real-time or not, of all NM stations is therefore crucial for this study)
- A total of eight stations (BURE, ESOI, MCMU, MCRL, MGDN, MOSC, MRNY, NVBK) are constantly offline.
- Station LMKS cannot be evaluated because all required information was not available in the NMDB.
- The ATHN station was delayed until 02/2022 because of a problem with the clock of the NM registration system. The measurements were however instantly sent to NMDB with a delay timestamp, due to the clock’s delay. This problem has now been fixed.
- The DRBS NM station (currently not used by the GLE Alert++ and listed in Table 2) presents an acceptable real-time behaviour.
Author Contributions
Funding
Institutional Review Board Statement
Informed Consent Statement
Data Availability Statement
Acknowledgments
Conflicts of Interest
References
- Miroshnichenko, L.I. Retrospective analysis of GLEs and estimates of radiation risks. J. Space Weather Space Clim. 2018, 8, A52. [Google Scholar] [CrossRef]
- Poluianov, S.V.; Usoskin, I.G.; Mishev, A.L.; Shea, M.A.; Smart, D.F. GLE and Sub-GLE Redefinition in the Light of High-Altitude Polar Neutron Monitors. Solar Phys. 2017, 292, 176. [Google Scholar] [CrossRef]
- Mishev, A.L.; Kocharov, L.G.; Usoskin, I.G. Analysis of the ground level enhancement on 17 May 2012 using data from the global neutron monitor network. J. Geophys. Res. Space Phys. 2014, 119, 670–679. [Google Scholar] [CrossRef]
- Bütikofer, R.R.; Flückiger, E.O.; Desorgher, L.; Moser, M.; Pirard, B. The solar cosmic ray ground-level enhancements on 20 January 2005 and 13 December 2006. Adv. Space Res. 2009, 43, 499–503. [Google Scholar] [CrossRef]
- Papaioannou, A.; Kouloumvakos, A.; Mishev, A.; Vainio, R.; Usoskin, I.G.; Herbst, K.; Rouillard, A.P.; Anastasiadis, A.; Gieseler, J.; Wimmer–Schweingruber, R.F.; et al. The first ground-level enhancement of solar cycle 25 on 28 October 2021. Astron. Astrophys. 2022, 660, 9. [Google Scholar] [CrossRef]
- Malandraki, O.E.; Crosby, N.B. Solar energetic particles and space weather: Science and applications. In Solar Particle Radiation Storms Forecasting and Analysis; Malandraki, O.E., Crosby, N.B., Eds.; Springer International Publishing: Berlin/Heidelberg, Germany, 2018; Volume 444, pp. 1–26. [Google Scholar]
- Maurchev, E.A.; Shlyk, N.S.; Dmitriev, A.V.; Abunina, M.A.; Didenko, K.A.; Abunin, A.A.; Belov, A.V. Comparison of Atmospheric Ionization for Solar Proton Events of the Last Three Solar Cycles. Atmosphere 2024, 15, 151. [Google Scholar] [CrossRef]
- Poluianov, S.; Batalla, O.; Mishev, A.; Koldobskiy, S.; Usoskin, I. Two New Sub-GLEs Found in Data of Neutron Monitors at South Pole and Vostok: On 09 June 1968 and 27 February 1969. Sol. Phys. 2024, 299, 6. [Google Scholar] [CrossRef]
- Gopalswamy, N.; Yashiro, S.; Liu, Y.; Michalek, G.; Vourlidas, A.; Kaiser, M.L.; Howard, R.A. Coronal mass ejections and other extreme characteristics of the 2003 October–November solar eruptions. J. Geophys. Res. 2005, 110, A09S15. [Google Scholar] [CrossRef]
- Gopalswamy, N. A Catalog of Halo Coronal Mass Ejections from SOHO. Sun Geosph. 2010, 5, 7–16. [Google Scholar]
- Gopalswamy, N.; Xie, H.; Yashiro, S.; Akiyama, S.; Mäkelä, P.; Usoskin, I.G. Properties of Ground Level Enhancement Events and the Associated Solar Eruptions During Solar Cycle 23. Space Sci. Rev. 2012, 171, 23–60. [Google Scholar] [CrossRef]
- Shea, M.A.; Smart, D.F. A summary of major solar proton events. Sol. Phys. 1990, 127, 297–320. [Google Scholar] [CrossRef]
- Shea, M.A.; Smart, D.F. Significant Solar Proton Events for Five Solar Cycles (1954–2007). In Proceedings of the 30th ICRC, Merida, Mexico, 3–11 July 2007. [Google Scholar]
- Kuwabara, T.; Bieber, J.W.; Clem, J.; Evenson, P.; Pyle, R.; Munakata, K.; Yasue, S.; Kato, C.; Akahane, S.; Koyama, M.; et al. Real-time cosmic ray monitoring system for space weather. Space Weather 2006, 4, S08001. [Google Scholar] [CrossRef]
- Anashin, V.; Belov, A.V.; Eroshenko, E.; Kryakunova, O.; Mavromichalaki, H.; Ishutin, I.; Sarlanis, C.; Souvatzoglou, G.; Vashenyuk, E.; Yanke, V. The ALERT signal of ground level enhancements of solar cosmic rays: Physics basis, the ways of realization and development. In Proceedings of the 31st ICRC, Łódź, Poland, 7–15 July 2009. [Google Scholar]
- Mavromichalaki, H.; Souvatzoglou, G.; Sarlanis, C.; Mariatos, G.; Papaioannou, A.; Belov, A.; Eroshenko, E.; Yanke, V.; NMDB team. Implementation of the ground level enhancement alert software at NMDB database. New Astron. 2010, 15, 744–748. [Google Scholar] [CrossRef]
- Souvatzoglou, G.; Papaioannou, A.; Mavromichalaki, H.; Dimitroulakos, J.; Sarlanis, C. Optimizing the real-time ground level enhancement alert system based on neutron monitor measurements: Introducing GLE Alert Plus. Space Weather 2014, 12, 633–649. [Google Scholar] [CrossRef]
- Mavromichalaki, H.; Paschalis, P.; Gerontidou, M.; Papailiou, M.-C.; Paouris, E.; Tezari, A.; Lingri, D.; Livada, M.; Stassinakis, A.N.; Crosby, N.; et al. The Updated Version of the A.Ne.Mo.S. GLE Alert System: The Case of the Ground-Level Enhancement GLE73 on 28 October 2021. Universe 2022, 8, 378. [Google Scholar] [CrossRef]
- Sapundjiev, D.; Verhulst, T.; Stankov, S. International Database of Neutron Monitor Measurements: Development and Applications. In Knowledge Discovery in Big Data from Astronomy and Earth Observation; Škoda, P., Adam, F., Eds.; Elsevier: Amsterdam, The Netherlands, 2020. [Google Scholar]
- Malandraki, O.E.; Nunez, M.; Heber, B.; Labrenz, J.; Posner, A.; Milas, N.; Tsiropoula, G.; Pavlos, E.; Sarlanis, C. The real-time SEP forecasting tools of the ‘HESPERIA’ HORIZON 2020 project. EGU General Assembly Conference Abstracts. 2017. Available online: https://ui.adsabs.harvard.edu/abs/2017EGUGA..1919268M/abstract (accessed on 8 March 2024).
- Núñez, M.; Reyes-Santiago, P.J.; Malandraki, O. Real-time prediction of the occurrence of GLE events. Space Weather 2017, 15, 861–873. [Google Scholar] [CrossRef]
- Flückiger, E.; Bütikofer, R. Radiation doses along selected flight profiles during two extreme solar cosmic ray events. ASTRA 2011, 7, 105–109. [Google Scholar]
- Mishev, A.L.; Usoskin, I.G. Assessment of the radiation environment at commercial jet-flight altitudes during GLE 72 on 10 September 2017 using neutron monitor data. Space Weather 2018, 16, 1921–1929. [Google Scholar] [CrossRef]


| No | NM Station | Abbr. | Geogr. Coordinates | Altitude (m) | Cut-Off Rigidity (GV) | Downtime Fraction (%) |
|---|---|---|---|---|---|---|
| 1 | Alma Ata, Kazakhstan | AATB | 43.14° N 76.60° E | 3340 | 6.69 | 9% |
| 2 | Apatity, Russia | APTY | 67.57° N 33.40° E | 177 | 0.65 | 0% |
| 3 | Athens, Greece | ATHN | 37.97° N 23.78° E | 260 | 8.53 | 3% |
| 4 | Baksan, Russia | BKSN | 43.28° N 42.69° E | 1700 | 5.60 | 0% |
| 5 | Plateau de Bure, France | BURE | 44.38° N 5.54° E | 2555 | 5.00 | 100% |
| 6 | Castilla-La Mancha, Spain | CALM | 40.33° N 3.90° E | 708 | 6.95 | 19% |
| 7 | Emilio Segre, Israel | ESOI | 33.30° N 35.80° E | 2055 | 10.75 | 100% |
| 8 | Fort Smith, Canada | FSMT | 60.02° N 111.93° W | 180 | 0.30 | 10% |
| 9 | Inuvik, Canada | INVK | 68.36° N 133.72° W | 21 | 0.30 | 1% |
| 10 | Irkutsk 2, Russia | IRK2 | 52.37° N 100.55° E | 2000 | 3.64 | 55% |
| 11 | Irkutsk 3, Russia | IRK3 | 51.29° N 100.55° E | 3000 | 3.64 | 46% |
| 12 | Irkutsk, Russia | IRKT | 52.47° N 104.03° E | 475 | 3.64 | 27% |
| 13 | Jungfraujoch, Switzerland | JUNG | 46.55° N 7.98° E | 3570 | 4.50 | 0% |
| 14 | Jungfraujoch 1, Switzerland | JUNG1 | 46.55° N 7.98° E | 3475 | 4.50 | 0% |
| 15 | Kerguelen, Indian Ocean | KERG | 49.35° S 70.25° E | 33 | 1.14 | 3% |
| 16 | Kiel 2, Germany | KIEL2 | 54.34° N 10.12° E | 54 | 2.36 | 0% |
| 17 | Lomnicky stit, Slovakia | LMKS | 49.20° N 20.22° E | 2634 | 3.84 | 0% |
| 18 | Mc Murdo, Antarctica | MCMU | 77.95° S 166.60° E | 48 | 0.30 | 100% |
| 19 | Mobile CR Laboratory, Russia | MCRL | 55.47° N 37.32° E | 2000 | 2.43 | 100% |
| 20 | Magadan, Russia | MGDN | 60.04° N 151.05° E | 220 | 2.10 | 100% |
| 21 | Moscow, Russia | MOSC | 55.47° N 37.32° E | 200 | 2.43 | 100% |
| 22 | Mirny, Antarctica | MRNY | 66.55° N 93.02° E | 30 | 0.03 | 100% |
| 23 | Nain, Canada | NAIN | 56.55° N 61.68° W | 46 | 0.30 | 16% |
| 24 | Newark, USA | NEWK | 39.68° N 75.75° W | 50 | 2.40 | 10% |
| 25 | Novosibirsk, Russia | NVBK | 54.48° N 83.00° E | 163 | 2.91 | 100% |
| 26 | Oulu, Finland | OULU | 65.05° N 25.47° E | 15 | 0.81 | 0% |
| 27 | Peawanuk, Canada | PWNK | 54.98° N 85.44° W | 53 | 0.30 | 24% |
| 28 | Rome, Italy | ROME | 41.86° N 12.47° E | 0 | 6.27 | 1% |
| 29 | South Pole Bare, Antarctica | SOPB | 90.00° S N/A | 2820 | 0.10 | 5% |
| 30 | South Pole, Antarctica | SOPO | 90.00° S N/A | 2820 | 0.10 | 5% |
| 31 | Terre Adelie, Antarctica | TERA | 66.65° S 140.00° E | 32 | 0.00 | 6% |
| 32 | Thule, Greenland | THUL | 76.50° N 68.70° W | 26 | 0.30 | 3% |
| 33 | Tixie Bay, Russia | TXBY | 71.01° N 128.54° E | 0 | 0.48 | 0% |
| 34 | Yakutsk, Russia | YKTK | 62.01° N 129.43° E | 105 | 1.65 | 0% |
| No | NM Station | Abbr. | Geogr. Coordinates | Altitude (m) | Cut-Off Rigidity (GV) | Downtime Fraction (%) |
|---|---|---|---|---|---|---|
| 1 | Almaty, Kazakhstan | AATA | 43.25° N 76.92° E | 897 | 5.90 | 42% |
| 2 | Ahmedabad, India | AHMD | 23.01° N 72.61° E | 50 | 15.94 | 100% |
| 3 | Aragats, Armenia | ARNM | 40.22° N 44.15° E | 3200 | 7.10 | 100% |
| 4 | Barentsburg, Spitzbergen | BRBG | 78.06° N 14.22° E | 51 | 0.00 | 3% |
| 5 | Calgary, Canada | CALG | 51.08° N 24.13° W | 1123 | 1.08 | 95% |
| 6 | Climax, USA | CLMX | 39.37° N 106.18° W | 3400 | 3.03 | 100% |
| 7 | Daejeon, South Korea | DJON | 36.39° N 127.37° E | 200 | 11.20 | 84% |
| 8 | Mini Dome Bare, Antarctica | DOMB | 75.06° S 123.20° E | 3233 | 0.01 | 32% |
| 9 | Mini Dome C, Antarctica | DOMC | 75.06° S 123.20° E | 3233 | 0.01 | 0% |
| 10 | Dourbes, Belgium | DRBS | 50.10° N 4.60° E | 225 | 3.18 | 0% |
| 11 | Dourbes2, Belgium | DRBS2 | 50.10° N 4.60° E | 225 | 3.18 | 100% |
| 12 | Durham, USA | DRHM | 43.10° N 70.83° W | 0 | 1.58 | 100% |
| 13 | Haleakala1, Hawaii | HLE1 | 20.72° N 156.28° W | 3052 | 13.30 | 100% |
| 14 | Hermanus, South Africa | HRMS | 34.43° S 19.23° E | 26 | 4.58 | 80% |
| 15 | Huancayo, Perou | HUAN | 12.03° S 75.33° W | 3400 | 13.45 | 100% |
| 16 | Jang Bogo, Antarctica | JBGO | 74.6° S 164.2° E | 30 | 0.30 | 87% |
| 17 | Kingston, Australia | KGSN | 42.99° S 147.29° E | 65 | 1.88 | 100% |
| 18 | Kiel, Germany | KIEL | 54.34° N 10.12° E | 54 | 2.36 | 100% |
| 19 | Leadville, USA | LDVL | 39.15° N 106.14° W | 3094 | 3.03 | 100% |
| 20 | Mt. Wellington, Australia | MTWS | 42.92° S 147.25° E | 725 | 1.80 | 100% |
| 21 | Mawson, Antarctica | MWSN | 67.60° S 62.88° E | 0 | 0.22 | 13% |
| 22 | Mexico City, Mexico | MXCO | 19.33° N 260.82° E | 2274 | 8.20 | 4% |
| 23 | Nor-Amberd, Armenia | NANM | 40.22° N 44.15° E | 2000 | 7.10 | 53% |
| 24 | Neumayer III, Antarctica | NEU3 | 70.38° S 8.15° W | 40 | 0.10 | 100% |
| 25 | Norilsk, Russia | NRLK | 69.26° N 88.05° E | 0 | 0.63 | 7% |
| 26 | Ny-Alesund, Spitzbergen | NYAA | 78.90° N 11.90° E | 0 | 0.00 | 100% |
| 27 | Observatorio de Rayos Cósmicos Antártico, Antarctica | ORCA | 62.39° S 60.23° W | 12 | 100% | |
| 28 | Observatorio de Rayos Cósmicos Antártico B, Antarctica | ORCB | 62.39° S 60.23° W | 12 | 100% | |
| 29 | Polarstern, Atlantic Ocean | POL1 | Antarctica, ship | 0 | 100% | |
| 30 | Doi Inthanon, Thailand | PSNM | 18.59° N 98.49° E | 2565 | 16.80 | 100% |
| 31 | Potchefstroom, South Africa | PTFM | 26.68° S 27.09° E | 1351 | 6.94 | 58% |
| 32 | Sanae VIII, Antarctica | SANB | 70.31° S 02.40° W | 52 | 0.73 | 100% |
| 33 | Sanae IV, Antarctica | SNAE | 71.40° S 02.51° W | 856 | 0.73 | 100% |
| 34 | Tibet, China | TIBT | 30.11° N 90.53° E | 4300 | 14.10 | 100% |
| 35 | Tsumeb, Namibia | TSMB | 19.20° S 17.58° E | 1240 | 9.15 | 91% |
| 36 | Zugspitze, Germany | UFSZ | 47.40° N 11.00° E | 2650 | 4.10 | 100% |
| 37 | Zugspitze, Germany | ZUGS | 47.42° N 10.98° E | 2960 | 4.24 | 100% |
| Equivalent Mean Delay (min) | Real-Time Index | Equivalent Mean Delay (min) | Real-Time Index |
|---|---|---|---|
| 1 | 100.00 | 16 | 75.41 |
| 2 | 98.36 | 17 | 73.77 |
| 3 | 96.72 | 18 | 72.13 |
| 4 | 95.08 | 19 | 70.49 |
| 5 | 93.44 | 20 | 68.85 |
| 6 | 91.80 | 21 | 67.21 |
| 7 | 90.16 | 22 | 65.57 |
| 8 | 88.52 | 23 | 63.93 |
| 9 | 86.89 | 24 | 62.30 |
| 10 | 85.25 | 25 | 60.66 |
| 11 | 83.61 | 26 | 59.02 |
| 12 | 81.97 | 27 | 57.38 |
| 13 | 80.33 | 28 | 55.74 |
| 14 | 78.69 | 29 | 54.10 |
| 15 | 77.05 | 30 | 52.46 |
| NMs Used in the Current Version of GLE Alert++ (from Table 1) | |||||||||||||||||||||||||
|---|---|---|---|---|---|---|---|---|---|---|---|---|---|---|---|---|---|---|---|---|---|---|---|---|---|
| MM.YYYY | AATB | APTY | ATHN | BKSN | CALM | FSMT | INVK | IRK2 | IRK3 | IRKT | JUNG | JUNG1 | KERG | KIEL2 | NAIN | NEWK | OULU | PWNK | ROME | SOPB | SOPO | TERA | THUL | TXBY | YKTK |
| 08.2022 | 99.30 | 89.60 | 82.22 | 99.14 | 99.07 | 90.60 | 92.35 | 0.00 | 30.35 | 96.68 | 93.20 | 93.27 | 97.76 | 97.82 | 90.53 | 93.23 | 97.19 | 90.14 | 99.23 | 84.85 | 84.88 | 97.59 | 91.98 | 59.52 | 61.72 |
| 07.2022 | 99.23 | 48.69 | 90.80 | 98.17 | 99.35 | 81.00 | 88.51 | 0.00 | 13.04 | 63.01 | 92.91 | 92.97 | 96.27 | 69.59 | 76.82 | 88.39 | 97.86 | 86.76 | 89.41 | 77.91 | 77.98 | 97.66 | 83.91 | 76.74 | 77.18 |
| 06.2022 | 98.52 | 78.79 | 89.95 | 99.63 | 99.82 | 79.67 | 93.57 | 49.01 | 54.58 | 4.14 | 93.86 | 93.92 | 91.39 | 100.00 | 91.67 | 94.34 | 98.13 | 89.84 | 99.57 | 79.96 | 79.97 | 93.77 | 92.25 | 17.30 | 17.32 |
| 05.2022 | 94.49 | 86.74 | 96.43 | 39.04 | 99.82 | 90.64 | 94.34 | 72.12 | 90.58 | 0.00 | 94.15 | 94.23 | 97.38 | 96.30 | 89.92 | 87.35 | 98.35 | 93.75 | 99.19 | 90.42 | 90.43 | 95.51 | 92.85 | 80.94 | 82.61 |
| 04.2022 | 99.81 | 92.43 | 100.00 | 62.81 | 99.82 | 81.57 | 89.60 | 86.32 | 89.30 | 33.23 | 94.46 | 94.54 | 95.98 | 99.86 | 91.77 | 93.49 | 98.37 | 86.48 | 98.08 | 72.80 | 72.82 | 97.03 | 92.25 | 80.50 | 81.53 |
| 03.2022 | 99.97 | 74.75 | 95.33 | 99.71 | 99.82 | 92.43 | 94.10 | 86.12 | 3.08 | 94.15 | 94.80 | 94.87 | 95.03 | 99.98 | 91.44 | 87.53 | 98.37 | 92.54 | 98.53 | 86.07 | 83.59 | 98.00 | 92.52 | 79.85 | 81.79 |
| 02.2022 | 96.43 | 99.43 | 97.57 | 99.91 | 84.90 | 91.62 | 94.16 | 82.98 | 63.82 | 93.12 | 95.11 | 95.16 | 95.46 | 99.86 | 89.91 | 89.85 | 98.36 | 90.15 | 89.18 | 91.42 | 91.43 | 97.16 | 92.31 | 84.05 | 81.62 |
| 01.2022 | 99.79 | 62.59 | 62.89 | 99.69 | 15.09 | 49.50 | 94.09 | 79.01 | 83.51 | 88.42 | 95.23 | 95.28 | 89.16 | 99.84 | 57.47 | 90.40 | 98.06 | 92.61 | 98.95 | 89.85 | 89.91 | 94.53 | 92.59 | 80.53 | 83.25 |
| 12.2021 | 99.40 | 87.00 | 83.33 | 88.33 | 75.66 | 81.89 | 94.00 | 90.08 | 75.78 | 96.55 | 95.73 | 95.79 | 94.63 | 99.17 | 1.64 | 94.53 | 98.18 | 83.11 | 99.64 | 92.04 | 92.05 | 88.24 | 92.17 | 82.95 | 82.46 |
| 11.2021 | 98.44 | 69.53 | 89.48 | 97.61 | 98.25 | 72.87 | 92.79 | 45.71 | 0.71 | 16.36 | 94.52 | 94.56 | 75.52 | 98.44 | 31.58 | 92.88 | 96.83 | 92.37 | 97.76 | 90.74 | 90.66 | 90.84 | 88.19 | 81.96 | 82.06 |
| 10.2021 | 93.21 | 66.55 | 94.22 | 98.93 | 99.77 | 94.32 | 91.91 | 0.17 | 0.00 | 0.00 | 95.54 | 96.41 | 92.79 | 100.00 | 93.80 | 92.07 | 98.37 | 92.97 | 99.42 | 93.87 | 93.85 | 97.60 | 93.52 | 81.72 | 82.85 |
| 09.2021 | 99.99 | 60.71 | 93.51 | 99.82 | 99.79 | 87.58 | 92.84 | 0.14 | 0.00 | 0.00 | 96.66 | 96.72 | 94.05 | 100.00 | 93.68 | 95.66 | 96.40 | 93.40 | 99.32 | 92.16 | 92.30 | 98.05 | 94.51 | 76.78 | 86.06 |
| 08.2021 | 96.85 | 63.12 | 78.20 | 97.92 | 99.85 | 79.65 | 89.76 | 0.13 | 0.00 | 0.00 | 97.00 | 97.05 | 88.29 | 100.00 | 93.31 | 94.49 | 98.39 | 94.96 | 97.68 | 95.09 | 95.31 | 97.94 | 90.90 | 81.97 | 83.09 |
| 07.2021 | 94.26 | 29.11 | 86.62 | 95.40 | 96.44 | 73.10 | 92.48 | 0.00 | 0.00 | 0.00 | 94.03 | 94.09 | 89.14 | 96.62 | 90.29 | 89.02 | 93.66 | 86.27 | 94.56 | 91.68 | 91.80 | 94.45 | 89.58 | 78.23 | 72.67 |
| 06.2021 | 99.64 | 33.67 | 93.25 | 99.86 | 99.86 | 93.49 | 96.11 | 0.00 | 0.00 | 0.00 | 97.18 | 97.68 | 93.32 | 99.32 | 93.80 | 96.14 | 98.38 | 93.62 | 99.15 | 94.53 | 93.87 | 95.66 | 94.75 | 84.04 | 82.89 |
| 05.2021 | 99.74 | 45.98 | 89.98 | 99.63 | 99.84 | 82.47 | 84.25 | 0.00 | 0.00 | 84.74 | 92.58 | 98.04 | 90.93 | 98.57 | 82.29 | 91.06 | 98.45 | 74.57 | 99.38 | 68.63 | 68.48 | 97.15 | 89.44 | 85.03 | 83.69 |
| 04.2021 | 99.42 | 77.94 | 84.85 | 99.18 | 99.48 | 94.37 | 96.56 | 0.00 | 0.00 | 89.28 | 98.77 | 98.84 | 89.31 | 99.27 | 94.74 | 96.70 | 98.02 | 1.64 | 98.99 | 95.17 | 95.23 | 93.72 | 91.46 | 84.52 | 82.67 |
| 03.2021 | 99.60 | 59.43 | 88.59 | 96.23 | 75.91 | 91.36 | 92.75 | 0.00 | 0.00 | 25.13 | 98.92 | 98.90 | 87.55 | 99.74 | 91.81 | 92.57 | 98.09 | 1.64 | 99.12 | 89.61 | 89.69 | 93.51 | 91.27 | 73.92 | 80.21 |
| 02.2021 | 90.50 | 63.42 | 61.03 | 82.58 | 99.83 | 88.49 | 91.03 | 0.00 | 0.44 | 14.47 | 99.40 | 99.49 | 93.37 | 98.70 | 88.61 | 90.00 | 97.69 | 1.64 | 99.34 | 87.29 | 87.29 | 85.24 | 88.06 | 82.59 | 85.65 |
| 01.2021 | 99.96 | 64.61 | 81.95 | 85.11 | 99.82 | 95.10 | 97.44 | 0.00 | 41.66 | 26.32 | 99.53 | 99.61 | 88.28 | 99.98 | 95.35 | 95.72 | 97.49 | 1.64 | 81.75 | 92.36 | 92.50 | 90.49 | 93.94 | 66.85 | 74.55 |
| 12.2020 | 96.82 | 90.94 | 83.14 | 94.68 | 99.82 | 78.30 | 83.08 | 0.00 | 2.24 | 83.66 | 99.50 | 99.71 | 97.61 | 99.98 | 80.40 | 82.91 | 97.74 | 45.89 | 98.29 | 79.88 | 79.95 | 91.82 | 80.05 | 79.55 | 84.04 |
| 11.2020 | 99.68 | 69.82 | 91.27 | 99.70 | 99.59 | 77.62 | 84.28 | 0.00 | 82.59 | 95.89 | 99.32 | 99.40 | 97.23 | 99.78 | 81.94 | 83.09 | 98.49 | 82.67 | 99.11 | 81.26 | 81.31 | 89.94 | 82.50 | 80.86 | 83.37 |
| 10.2020 | 99.36 | 49.57 | 82.19 | 97.03 | 80.66 | 88.34 | 94.33 | 0.00 | 81.25 | 96.57 | 99.79 | 99.86 | 95.94 | 97.49 | 93.95 | 96.00 | 96.86 | 95.43 | 99.13 | 76.31 | 76.28 | 87.11 | 95.08 | 76.71 | 84.01 |
| 09.2020 | 98.96 | 61.18 | 86.12 | 96.43 | 7.90 | 82.29 | 81.85 | 0.00 | 69.53 | 96.01 | 15.76 | 99.91 | 94.91 | 99.99 | 83.53 | 82.42 | 98.22 | 78.12 | 92.52 | 82.18 | 82.21 | 87.77 | 38.27 | 78.73 | 81.43 |
| 08.2020 | 98.08 | 64.48 | 89.95 | 97.72 | 85.14 | 65.07 | 72.35 | 14.03 | 75.92 | 83.01 | 40.88 | 98.15 | 89.02 | 98.31 | 72.57 | 72.93 | 98.07 | 71.86 | 97.55 | 69.05 | 69.13 | 78.06 | 57.00 | 66.34 | 80.82 |
| 07.2020 | 99.51 | 82.65 | 85.23 | 99.07 | 49.67 | 72.86 | 75.18 | 62.58 | 15.53 | 82.32 | 99.91 | 99.96 | 91.43 | 99.26 | 75.78 | 76.63 | 99.89 | 75.44 | 98.74 | 72.99 | 73.00 | 89.83 | 75.28 | 68.29 | 84.08 |
| 06.2020 | 98.46 | 72.13 | 93.67 | 99.90 | 44.53 | 62.96 | 69.28 | 0.29 | 1.00 | 88.05 | 95.45 | 95.45 | 96.77 | 100.00 | 59.55 | 51.63 | 96.40 | 56.07 | 99.10 | 67.52 | 67.54 | 93.69 | 58.12 | 72.76 | 85.24 |
| 05.2020 | 97.76 | 35.14 | 98.24 | 98.58 | 30.96 | 24.90 | 55.70 | 21.37 | 30.02 | 98.33 | 100.00 | 99.93 | 91.23 | 100.00 | 55.37 | 1.64 | 98.28 | 1.64 | 80.28 | 52.73 | 52.75 | 35.73 | 38.14 | 53.99 | 71.47 |
| 04.2020 | 99.94 | 53.33 | 6.49 | 99.76 | 0.00 | 31.55 | 65.56 | 82.89 | 80.16 | 94.70 | 100.00 | 100.00 | 94.11 | 100.00 | 36.86 | 1.64 | 98.15 | 1.64 | 66.91 | 64.93 | 64.91 | 93.27 | 65.11 | 67.06 | 81.34 |
| 03.2020 | 99.80 | 22.40 | 29.08 | 99.64 | 0.00 | 33.95 | 56.94 | 85.20 | 80.67 | 98.23 | 100.00 | 100.00 | 95.46 | 100.00 | 1.64 | 38.55 | 98.25 | 34.35 | 99.54 | 56.02 | 56.08 | 90.91 | 56.39 | 66.41 | 82.73 |
| 02.2020 | 97.15 | 69.03 | 99.70 | 99.72 | 32.38 | 44.41 | 72.67 | 83.58 | 66.40 | 94.87 | 100.00 | 96.61 | 84.36 | 99.65 | 13.63 | 31.12 | 98.35 | 48.57 | 99.54 | 56.95 | 57.00 | 84.56 | 70.15 | 73.60 | 83.19 |
| 01.2020 | 99.93 | 25.27 | 99.61 | 98.93 | 34.30 | 49.97 | 75.14 | 64.48 | 0.00 | 72.04 | 98.97 | 98.97 | 85.59 | 99.99 | 45.82 | 71.73 | 64.48 | 73.72 | 98.33 | 73.78 | 73.86 | 54.17 | 74.19 | 67.25 | 69.43 |
| NMs Not Used in the Current Version of GLE Alert++ (from Table 2) | |||||||||||||||
|---|---|---|---|---|---|---|---|---|---|---|---|---|---|---|---|
| MM.YYYY | AATA | BRBG | CALG | DJON | DOMB | DOMC | DRBS | HRMS | JBGO | MWSN | MXCO | NANM | NRLK | PTFM | TSMB |
| 08.2022 | 93.33 | 0.00 | 65.41 | 0.00 | 1.64 | 1.64 | 98.84 | 0.00 | 0.00 | 27.96 | 36.48 | 0.00 | 32.32 | 0.00 | 0.00 |
| 07.2022 | 6.01 | 1.64 | 0.00 | 0.00 | 1.64 | 1.64 | 99.44 | 0.00 | 0.00 | 26.20 | 36.23 | 0.00 | 42.65 | 0.00 | 0.00 |
| 06.2022 | 7.21 | 1.64 | 0.00 | 0.00 | 1.64 | 1.64 | 99.78 | 0.00 | 0.00 | 22.40 | 36.47 | 0.00 | 35.68 | 0.00 | 0.00 |
| 05.2022 | 0.00 | 1.64 | 0.00 | 0.00 | 1.64 | 1.64 | 99.93 | 0.00 | 0.00 | 17.17 | 36.46 | 0.00 | 84.17 | 0.00 | 0.00 |
| 04.2022 | 0.00 | 1.64 | 0.00 | 0.00 | 1.64 | 1.64 | 99.84 | 0.00 | 0.00 | 23.66 | 36.48 | 0.00 | 84.54 | 0.00 | 0.00 |
| 03.2022 | 0.00 | 1.63 | 0.00 | 0.00 | 1.64 | 1.64 | 96.26 | 0.00 | 0.00 | 22.02 | 36.46 | 0.00 | 75.74 | 0.00 | 0.00 |
| 02.2022 | 0.00 | 1.64 | 0.00 | 0.00 | 1.64 | 1.64 | 88.91 | 0.00 | 0.00 | 22.58 | 36.42 | 0.00 | 77.60 | 0.00 | 0.00 |
| 01.2022 | 0.00 | 1.64 | 0.00 | 0.00 | 1.64 | 1.64 | 97.12 | 0.00 | 0.00 | 22.61 | 36.43 | 0.00 | 73.80 | 0.00 | 0.00 |
| 12.2021 | 0.00 | 1.64 | 0.00 | 0.81 | 1.64 | 1.52 | 98.78 | 0.00 | 0.66 | 22.22 | 36.45 | 0.00 | 74.16 | 0.00 | 0.00 |
| 11.2021 | 16.87 | 1.64 | 0.00 | 0.77 | 1.64 | 1.38 | 96.41 | 0.00 | 0.71 | 20.18 | 35.89 | 0.00 | 83.38 | 0.00 | 0.00 |
| 10.2021 | 0.09 | 1.62 | 0.00 | 0.90 | 1.64 | 1.64 | 99.95 | 0.00 | 0.73 | 13.39 | 36.42 | 0.00 | 71.45 | 0.00 | 0.00 |
| 09.2021 | 31.86 | 1.63 | 0.00 | 0.71 | 1.64 | 1.64 | 96.71 | 0.00 | 0.68 | 16.89 | 36.46 | 0.00 | 59.17 | 0.00 | 0.00 |
| 08.2021 | 79.18 | 1.64 | 0.00 | 0.69 | 1.64 | 1.64 | 98.77 | 0.00 | 0.29 | 22.72 | 33.63 | 0.00 | 65.70 | 0.00 | 0.00 |
| 07.2021 | 51.61 | 1.64 | 0.00 | 0.74 | 1.64 | 1.64 | 96.31 | 0.00 | 0.75 | 21.89 | 34.73 | 0.00 | 76.70 | 0.00 | 0.00 |
| 06.2021 | 60.76 | 1.64 | 0.00 | 0.00 | 1.64 | 1.64 | 82.24 | 0.00 | 0.76 | 23.67 | 36.33 | 0.00 | 82.40 | 0.08 | 0.00 |
| 05.2021 | 86.30 | 1.64 | 0.00 | 0.00 | 1.64 | 1.64 | 99.88 | 0.00 | 0.83 | 19.13 | 36.38 | 58.92 | 80.80 | 0.81 | 0.00 |
| 04.2021 | 92.26 | 1.64 | 0.00 | 1.07 | 1.64 | 1.64 | 98.68 | 0.00 | 0.75 | 24.21 | 36.05 | 92.58 | 80.13 | 1.05 | 0.00 |
| 03.2021 | 70.81 | 1.64 | 0.00 | 0.73 | 1.64 | 1.64 | 97.83 | 0.00 | 0.80 | 19.21 | 35.90 | 80.72 | 77.68 | 1.64 | 0.00 |
| 02.2021 | 87.67 | 1.64 | 0.00 | 0.73 | 1.64 | 1.64 | 96.85 | 0.04 | 0.86 | 23.84 | 31.87 | 93.20 | 14.51 | 1.64 | 0.00 |
| 01.2021 | 87.10 | 1.64 | 0.00 | 0.76 | 1.64 | 1.64 | 98.34 | 0.00 | 0.83 | 17.78 | 1.74 | 80.68 | 43.23 | 1.64 | 0.00 |
| 12.2020 | 58.52 | 1.64 | 0.00 | 0.00 | 1.64 | 1.64 | 93.04 | 0.00 | 0.78 | 20.31 | 1.74 | 57.47 | 26.04 | 1.48 | 0.00 |
| 11.2020 | 66.68 | 1.62 | 0.00 | 0.00 | 0.05 | 1.64 | 99.72 | 0.00 | 0.75 | 9.76 | 1.76 | 43.22 | 84.27 | 1.29 | 0.00 |
| 10.2020 | 50.41 | 1.63 | 0.00 | 0.00 | 0.00 | 1.64 | 93.59 | 0.00 | 0.78 | 23.67 | 1.75 | 94.02 | 49.93 | 1.54 | 0.00 |
| 09.2020 | 83.23 | 1.64 | 0.00 | 0.00 | 0.00 | 1.64 | 1.62 | 0.00 | 0.78 | 23.21 | 1.72 | 93.88 | 70.35 | 1.58 | 0.00 |
| 08.2020 | 90.11 | 1.63 | 0.00 | 0.00 | 0.00 | 1.64 | 1.64 | 0.00 | 0.79 | 23.20 | 1.41 | 91.65 | 66.96 | 1.47 | 0.00 |
| 07.2020 | 82.11 | 1.62 | 0.00 | 0.00 | 0.00 | 1.56 | 1.64 | 1.28 | 39.92 | 24.85 | 1.59 | 94.23 | 73.52 | 1.58 | 0.27 |
| 06.2020 | 93.58 | 1.64 | 0.00 | 0.00 | 0.00 | 1.52 | 37.34 | 1.56 | 32.64 | 22.20 | 1.74 | 91.84 | 71.39 | 2.13 | 0.32 |
| 05.2020 | 90.51 | 1.63 | 0.00 | 0.00 | 0.00 | 1.64 | 77.84 | 1.64 | 0.78 | 22.75 | 1.74 | 86.54 | 85.75 | 1.50 | 0.38 |
| 04.2020 | 96.30 | 1.64 | 0.00 | 0.00 | 0.00 | 1.54 | 1.62 | 1.64 | 0.73 | 8.02 | 1.74 | 91.95 | 87.22 | 1.24 | 0.53 |
| 03.2020 | 59.22 | 1.64 | 0.00 | 0.00 | 0.00 | 1.64 | 1.64 | 67.89 | 0.81 | 1.43 | 1.74 | 88.34 | 86.05 | 82.27 | 62.66 |
| 02.2020 | 72.95 | 1.64 | 0.00 | 0.16 | 0.00 | 1.64 | 65.27 | 67.20 | 1.29 | 1.51 | 1.74 | 93.48 | 83.23 | 64.09 | 55.57 |
| 01.2020 | 99.73 | 1.64 | 0.00 | 0.77 | 0.00 | 1.64 | 3.10 | 73.54 | 1.54 | 1.34 | 1.74 | 68.27 | 36.96 | 64.78 | 43.58 |
Disclaimer/Publisher’s Note: The statements, opinions and data contained in all publications are solely those of the individual author(s) and contributor(s) and not of MDPI and/or the editor(s). MDPI and/or the editor(s) disclaim responsibility for any injury to people or property resulting from any ideas, methods, instructions or products referred to in the content. |
© 2024 by the authors. Licensee MDPI, Basel, Switzerland. This article is an open access article distributed under the terms and conditions of the Creative Commons Attribution (CC BY) license (https://creativecommons.org/licenses/by/4.0/).
Share and Cite
Mavromichalaki, H.; Paschalis, P.; Gerontidou, M.; Tezari, A.; Papailiou, M.-C.; Lingri, D.; Livada, M.; Stassinakis, A.; Crosby, N.; Dierckxsens, M. An Assessment of the GLE Alert++ Warning System. Atmosphere 2024, 15, 345. https://doi.org/10.3390/atmos15030345
Mavromichalaki H, Paschalis P, Gerontidou M, Tezari A, Papailiou M-C, Lingri D, Livada M, Stassinakis A, Crosby N, Dierckxsens M. An Assessment of the GLE Alert++ Warning System. Atmosphere. 2024; 15(3):345. https://doi.org/10.3390/atmos15030345
Chicago/Turabian StyleMavromichalaki, Helen, Pavlos Paschalis, Maria Gerontidou, Anastasia Tezari, Maria-Christina Papailiou, Dimitra Lingri, Maria Livada, Argyris Stassinakis, Norma Crosby, and Mark Dierckxsens. 2024. "An Assessment of the GLE Alert++ Warning System" Atmosphere 15, no. 3: 345. https://doi.org/10.3390/atmos15030345