Article

Expected Changes in Heating and Cooling Degree Days over Greece in the near Future Based on Climate Scenarios Projections

by
Athanasios Karagiannidis
*,
Konstantinos Lagouvardos
,
Vassiliki Kotroni
and
Elisavet Galanaki
Institute for Environmental Research and Sustainable Development, National Observatory of Athens, 15236 Athens, Greece
*
Author to whom correspondence should be addressed.
Atmosphere 2024, 15(4), 393; https://doi.org/10.3390/atmos15040393
Submission received: 16 January 2024 / Revised: 14 March 2024 / Accepted: 20 March 2024 / Published: 22 March 2024
(This article belongs to the Special Issue Numerical Weather Prediction Models and Ensemble Prediction Systems)

Abstract

:
The change in heating and cooling needs of Greece in the near future due to the climate change is assessed in the present study. Global and regional climate models and two different representative concentration pathways (RCPs) are used to simulate the expected change in temperature. A widely used methodology of computation of heating degree days (HDDs) and cooling degree days (CDDs) is employed with a base temperature of 18 °C. In agreement with the expected temperature rise in the near future, an HDD decrease and CDD increase under both RCPs is also expected. The changes under RCP8.5 are stronger compared to those under RCP4.5. Differences related to topography are noted. The HDD decrease is stronger than CDD increase but the relative increase in CDDs is higher than the relative increase in HDDs. The highest absolute decreases in HDDs are expected for February and March while the highest absolute increases in CDDs are expected during the three summer months.

Graphical Abstract

1. Introduction

Heating and cooling degree days are widely used as indicators of the energy requirements of buildings, if temperature conditions favorable to humans are to be met. Different methods of HDD/CDD computation exist. For example, Morakinyo et al. [1] and Ramon et al. [2] computed HDDs and CDDs using hourly temperature data. Semmler et al. [3] and Spinoni et al. [4] used daily minimum and maximum temperature data, while Gaudard et al. [5], Fan et al. [6] and Chidiac et al. [7] used mean daily temperature data. In the present study, the methodology used by Spinoni et al. [4,8] and the UK Met-Office [9], that was also adopted by the European Environmental Agency [10], is used, which is based on daily minimum and maximum temperature data.
Regarding the past and present status of HDDs and CDDs in Greece, significant literature is available. Matzarakis and Balafoutis [11] concluded that the heating needs are higher in Northern Greece and they decrease towards the south, while they are higher in mainland areas compared to insular areas. By comparing features related to electricity demand of London, UK, and Athens, Greece, Psiloglou et al. [12] explored the association between such energy needs and climate and non-climate related factors. It was shown that the energy needs peak during winter due to the lower temperatures. A second peak during summer was identified for Athens that was attributed to the high cooling requirements. According to their analysis, the relationship between electrical energy needs and air temperature is not linear. The impact of urbanization in the greater Athens area was assessed by Moustris et al. [13], who used weather station temperature data to compute and analyze HDD and CDD values. The annual CDD values in the city center were found to be almost seven times higher than the peripheral areas. The annual HDD values of the peripheral areas were almost three times higher than in the city center. According to Kyriakopoulos et al. [14], who analyzed data from urban and rural weather stations for the coastal cities of Patras and Kalamata, located in the west part of Greece, the urban heat island has a significant impact on the cities’ heating and cooling energy needs. Finally, Karagiannidis et al. [15], analyzing the current and future heating and cooling degree days over Greece, concluded that the elevation, proximity to the sea and urban heat island effect play a significant role in the formulation of HDD/CDD average monthly values in the cities of Athens and Trikala. A stronger urban heat island effect, lower elevation and proximity to the sea result in general to lower (higher) heating (cooling) needs.
Significant research has been conducted on the impact of climate change on the heating and cooling energy requirements in the future. Andrade et al. [16] computed the HDDs and CDDs and the HDD + CDD sum for Portugal from an ensemble of seven high-resolution bias-corrected simulations attained from EURO-CORDEX under RCP4.5 and RCP8.5 pathways for the periods 1971–2000, 2011–2040 and 2041–2070. A decrease was predicted in HDDs mainly for RCP8.5 while an increase was predicted for CDD values for both RCPs. The expected decrease in HDDs was found to be higher than the increase in CDDs. Local differentiations were also identified. Chidiac et al. [7] analyzed the impact of climate change in eight Canadian cities by computing the changes in cooling and heating requirements for the 2020–2069 period under RCP4.5. An increase in the demand for cooling and a decrease in the demand for heating were found. Fan et al. [6] assessed the impact of climate change on the electricity demand on China, examining both climate and non-climate factors under three pathways (RCP2.6, RCP4.5 and RCP8.5). The climatic factors (temperature and precipitation) expected changes will lead to an increase in electrical energy demand in 2100. They also showed that the expected temperature increase will result in a much lower decrease in heating needs compared to the increase in cooling needs. Petri and Caldeira [17] analyzed the impact of global warming on HDDs, CDDs and HDD + CDD in the USA using observational data for the period 1981–2010 and modeled (CMIP5) data under RCP8.5 for the period 2080–2099. They found a location-dependent increase in CDD and decrease in HDD values. Ramon et al. [2] computed and analyzed future HDD and CDD values for Belgium using modeled data for the past (1975–2005) and future (2070–2098) under RCP8.5. They found an overall 27% decrease in HDDs and a remarkable 140% increase in CDDs. A global climate model under three emission scenarios (B1, A1B and A2) was employed by Semmler et al. [3] in order to examine the climate change impact on heating and cooling demands in Ireland for the periods 2021–2060 and 2061–2100. In general, a decrease in HDDs was found, resulting in lower heating demands for 2021–2060 and even lower for 2061–2100. Cooling needs, which are rather low, may increase towards 2100. Spinoni et al. [8] studied the changes in heating and cooling degree days in Europe from 1981 to 2100 using bias-adjusted EURO-CORDEX simulations data. Regarding the future projections, two representative concentration pathways (RCP4.5 and RCP8.5) were considered. A significant decrease in HDDs, especially over Scandinavia and European Russia, and an increase in CDDs which peaks over the Mediterranean region and the Balkans were found for all simulations. Jancović et al. [18] examining the expected changes in HDDs and CDDs for the period 2071–2100 under the emissions scenarios A1B and A2 over Serbia, finding a significant decrease in HDDs and increase in CDDs. They also found variations in these changes, depending on location and topography, and a doubling of the cooling season length and a shortening of the heating season length by about 25%. The HDD and CDD changes under the emissions scenario A1B for Spain were examined by OrtizBeviá et al. [19]. Regarding the future trends, they focused on winter and summer. Cooling degree days are expected to increase by 50%, while for the HDDs the results are rather inconclusive or do not indicate statistically significant trends.
Focusing on Greece, Cartalis et al. [20] using the ESCAPE climatic model developed by the University of East Anglia concluded that the heating (cooling) needs of 2030 will decrease (increase) compared to 1990. Local differences were also noted. Giannakopoulos and Psiloglou [21] employed the HadRM3P climatic model under the emissions scenarios A2 and B2 for periods 1961–1990 and 2070–2099. They identified a decreasing trend in energy demands for the cold part of the year especially under the A2 scenario (about 10%). An increasing trend was identified for the warm part of the year, again especially under the A2 scenario. Although the overall increase is about 5% for the two hot summer months of July and August, it can reach 30%. Mirasgedis et al. [22] compared monthly HDDs and CDDs for the period 2071–2100 derived from the regional climate model PRECIS under the A2 and B2 emission scenarios against HDDs and CDDs for the period 1961–1990. They found a decrease in the total number of HDDs and an increase in the CDDs that resulted in a 3–6% net increase in electricity demand on an annual basis. Giannakopoulos et al. [23], using daily data from the RACMO2 regional climate model (RCM) under the A1B emissions scenario, showed that the increased temperature expected for the period 2021–2050 will lead to more than 5 (±2) additional days of heavy cooling for most areas of Greece. Karagiannidis et al. [15], examining the relative change in heating and cooling needs in the near future (2021–2030) under RPC4.5 and RCP8.5, found a decreasing (increasing) tendency of annual HDD/CDD values over Greece which was stronger under RCP8.5.
Overall, the available literature suggests that the heating and cooling needs depend on topography features like the altitude and the proximity to the sea, while the urban heat island effect is also quite influential in the final formation of HDD and CDD. Regarding the impact of climate change, a general increase in cooling needs and a general decrease in heating needs was identified in agreement with the expected rise in temperature.
In the present study, an analysis of the expected changes in HDD and CDD in the near future (2021–2050) is attempted based on climate projections derived from general circulation models (GCMs)/regional climate models (RCMs) under two different representative concentration pathways, available on the EURO-CORDEX website [24]. Our work uses the latest climate scenarios (based on Coupled Model Intercomparison Project Phase 5—CMIP5 GCMs (Taylor et al. [25]), which are considered superior to the earlier versions used in previous studies as they exploit the latest developments in the field and they are offered in higher horizontal analysis. For example, Cartalis et al. [20], Giannakopoulos and Psiloglou [21], Mirasgedis et al. [22] and Giannakopoulos et al. [23] used models/datasets with a horizontal resolution of 2.5°, 50 km, 25 km and 25 km, respectively. Although such resolutions could be enough to adequately represent extensive and climatically homogenous regions, they would probably miss out on details of a complicated topography like the Greek one which hosts significant mountains, plains, coasts and hundreds of islands in close proximity. In our study, we use 11 km horizontal resolution datasets (more can be found in Section 2), which allows for the more detailed evaluation of local discrepancies and therefore the more accurate depiction of the expected changes in HDD and CDD. Updated climate scenarios are undoubtedly a necessity when examining the impact of climate change, especially during the last decade when the impact of anthropogenic activity on the weather and climate becomes more and more profound. Section 2 presents the data and the methods used in the study, Section 3 presents the results of the analysis and finally, Section 4 summarizes the main conclusions and briefly discusses some related subjects.

2. Data and Methods

2.1. Data

Global numerical climate models, generally known as general circulation models (GCMs), are usually employed in the study of climate change. Since their horizontal resolution is rather low, currently ranging from 100 to 500 km, they are not adequate for the investigation of local impacts. To overcome this deficiency, regional climate models (RCMs) are employed to focus on the local effects of climate change. Their horizontal resolution usually ranges for 10 to 50 km. However, RCM simulations show systematic deviations from the actual observations that are related to a variety of factors, like configuration errors or innate deficiencies of the models (Boberg and Christensen [26]). To correct these deviations, reliable datasets are used. In the present study, data with a horizontal resolution of 11 km for the Greek area were collected. The dataset had undergone bias correction using the regional reanalysis MESAN (Landelius et al. [27]), a specific version of the EURO4M reanalysis products tailored for the European region (Dahlgren et al. [28]). The MESAN reanalysis product provides a high spatial resolution (~5.5 km) on several surface-related parameters such as 2 m minimum and maximum daily temperatures, covering the period 1979–2013. It has been shown to produce accurate information, useful for the evaluation of climate conditions (Landelius et al. [27]; Isotta et al. [29]). The selected bias correction method is thought of as an extension of the quantiles-matching method (Haddad and Rosenfeld [30]) and it is based on the construction of a proper cumulative distribution function between simulated and observed datasets. This transfer function links the cumulative distribution function between large and local scale values, using non-parametric correspondences between the predictand and predictor data. The main advantage of this approach is that it takes into account the temporal change in the transfer function throughout the study period. More details for the method can be found in Michelangeli et al. [31].
GCMs have the option to be driven by different greenhouse emissions scenarios and representative concentration pathways in order to simulate the anthropogenic impact on climate. Various anthropogenic activities, like environmental, technological and socio-economic changes, are translated in GCMs as equivalent changes in greenhouse gas concentrations and land use. In the present study, the following representative concentration pathways were used:
  • RCP4.5: stabilization of radiative forcing (RF) at 4.5 W/m2, following adequate mitigation policies. This scenario is formulated on the premise that mitigation policies will be enforced by the end of the 21st century in order to reduce emissions. The global annual greenhouse gas emissions are expected to peak around 2040 with a graduate decline afterwards that will lead to RF = 4.5 W/m2 in 2100 (Clarke et al. [32], Wise et. al. [33], Thomson et al. [34], Van Vuuren et al. [35]);
  • RCP8.5: This RCP does not include mitigation policies and therefore RF is expected to rise to 8.5 W/m2 in 2100 (Riahi et al. [36], Riahi et al. [37], Van Vuuren et al. [35]).
Daily minimum and maximum temperature data from 3 global/regional models combinations (HadGEM2-ES/RCA4, HadGEM2-ES/RACMO22E and MPI-ESM-LR/RCA4) were collected from the WCRP CORDEX database [38] for the Greek area (34°–42° Ν, 18°–29° E), covering the periods 1991–2020 and 2021–2050. The 2021–2050 simulations are performed under the pathways RCP4.5 and RCP8.5. Using these models, ensembles (average values between the 3 global/regional models combinations) of daily Tmax and Tmin were computed for the period 1991–2020, which will act as the reference period (RP) and will be considered as representative of the present status of the climate. Then, daily Tmax and Tmin values for the future period (FP) 2021–2050 were computed under the two representative concentration pathways, RCP4.5 and RCP8.5.

2.2. Methodology

Heating and cooling degree days are computed on the hypothesis that when the temperature inside a building is lower or higher than a pre-specified base temperature (Tbase), heating or cooling is required to achieve optimum conditions. Typically, one heating or cooling degree day is equivalent to the average ambient temperature being one degree lower or higher than Tbase; however, variations in the actual computation formulae exist. Adding the daily values for a month or a year yields the monthly or annual HDD/CDDs, respectively, which are indicative of the energy needs required to heat or cool a building for that time period [39].
As stated in the introduction, a variety of HDD and CDD computation methods are available. In the present study, the formulae presented by Spinoni et al. [4,8] and the UK Met-Office [9] and adopted by the European Environmental Agency [10] are used. The selection was based on the fact that the methodology is recognized and used by the mentioned major environmental organizations. Moreover, initial first computations showed that besides the expected numerical deviations, the qualitative results were in essence similar; therefore, the selection of methodology is not expected to have a significant impact on the qualitative conclusions of the study. Maximum and minimum daily temperatures (Tmax and Tmin, respectively) and the average daily temperature (Taver = (Tmin + Tmax)/2) are used as input. The widely used temperature of 18 °C is adopted as a base temperature value. In Table 1 and Table 2, the computation formulae for daily HDD and CDD are presented. The monthly and annual values can then be derived by the addition of the respective daily values.
To assess the expected changes in HDD and CDD, their daily, monthly and annual values are computed for the reference period (RP) and the future period (FP). Then the deviations of the average FP values from those of RP are examined to identify expected changes in HDD/CDD in the near future. To illustrate the inter-annual changes, timelines of annual HDD and CDD values at specific grids, which include selected settlements of varying elevation, size and population in continental and insular Greece, are also produced and discussed. Figure 1 presents a topographic map of the Greek area and its surrounding areas along with the location of the selected cities. The map was plotted using the EU-DEM—version 1.1 (at 25 m horizontal resolution), included the geospatial data catalogue of the European Environmental Agency [40]. The impact of elevation of the HDD/CDD changes is also examined. Finally, a table summarizing intra-annual (monthly) characteristics of HDD/CDD changes in the future climate is presented and discussed.

3. Results

Figure 2 presents the average absolute change in annual HDD/CDD over Greece for the future period compared to the reference period under RCP4.5 and RPC8.5. The RCP8.5–RCP4.5 difference is also shown. An obvious overall decrease in HDD and increase in CDD is found, both in agreement with the expected temperature rise due to the ongoing climate change.
The average HDD decrease over the Greek area is 135.5 degree days under RCP4.5 and 160.4 degree days under RCP8.5. The average CDD increase is 111.9 degree days under RCP4.5 and 135.1 degree days under RCP8.5. The changes are milder for RPC4.5 compared to RCP8.5, as a result of the milder temperature increase in RCP4.5 due to the emissions mitigation policies that it includes. These results are confirmed by the negative HDD and positive CDD RCP8.5–RCP4.5 differences (Figure 2e,f). The HDD decrease is higher for the mountainous areas, as can be seen by the combined examination of Figure 2a,c with Figure 1 where the topography is presented. It reaches a maximum value of 348.6 and 367.2 degree days under the pathways RCP4.5 and RCP8.5, respectively. The CDD increase is more pronounced for low-elevation and island areas, reaching 240.0 and 257.2 degree days under the pathways RCP4.5 and RCP8.5, respectively. Finally, a few cases of local HDD increase are found but the increase is small, below 44.8 degree days under RCP8.5 and 10.9 degree days under RCP4.5.
The relative increase in CDD (Figure 3) is stronger than the relative decrease in HDD. The relative change in HDD/CDD under RCP8.5 is stronger in comparison to RCP4.5 as indicated by the negative HDD and positive CDD RCP8.5–RCP4.5 differences in Figure 3e,f. The average CDD relative increase over the Greek area is 17.6% under RCP4.5 and 21.1% under RCP8.5. The average HDD relative decrease is 7.3% under RCP4.5 and 8.7% under RCP8.5. The maximum CDD relative increase over the Greek area is 56.0% under RCP4.5 and 63.3% under RCP8.5, while the maximum HDD relative decrease is 19.5% under RCP4.5 and 21.6% under RCP8.5. However, as seen in Figure 2, when examining the absolute change in HDD/CDD the situation seems reversed, with the absolute HDD decrease being higher than the absolute increase in CDD. This is attributed to the fact that the CDD values of the reference period (the average annual minimum, mean and maximum CDD are 105.1, 698.2 and 1312.5 degree days, respectively) are relatively lower than the HDD values (the average annual minimum, mean and maximum HDDs are 559.8, 1987.5 and 3894.4 degree days, respectively) while the absolute changes, presented in the previous paragraph, are comparable, thus resulting in a higher “future period/reference period” ratio and consequently higher relative differences.
The relative decrease in HDD (Figure 3a,c) does not present significant dependence on elevation which clearly suggests that the absolute decrease is proportional to the existing heating needs of the Greek area under the present climate.
Finally, the relative CDD increase (Figure 3b,d) seems to be stronger in mountainous areas. The strong relative increase is associated with the fact that mountainous areas have practically no needs for cooling in the reference period and therefore even small absolute increases in the cooling needs of the future period result in higher relative increases.
The characteristics of the influence of the elevation on the HDD/CDD absolute and relative change are verified by the information of Table 3 where the average absolute and relative annual HDD/CDD changes are computed for different elevation bins. The average elevation inside each grid-box was considered as the elevation of the grid-box and then seven bins were created, with a comparable number of grid-boxes assigned to each bin. For both RCPs, the absolute HDD decrease strengthens with elevation while the relative HDD decrease weakens. Only minor fluctuations from this pattern are found, mainly for the absolute decrease below 500 m of elevation. The absolute CDD increase weakens with elevation while the relative increase strengthens. Minor fluctuations from this pattern are found for the relative increase below 500 m of elevation.
The inter-annual variation in the HDD/CDD change, averaged over the Greek region, under the two representative concentration pathways and the best linear fit of the change are presented in Figure 4. Clear year-to-year fluctuations can be seen, but an overall CDD increase and HDD decrease is obvious. The examination of the timelines and the best linear fits confirms our findings that the HDD decrease is in general stronger than the relative CDD increase and that RCP8.5 has a stronger impact compared to RCP4.5.
The timelines of the average HDD/CDD annual values of 14 selected cities for the FP (2021–2050) under both RCPs are computed (Appendix A), aiming to confirm the general tendencies for grids that include cities of different size, elevation, sea proximity, latitude, etc. For example, Athens and Thessaloniki are large cities of low elevation and quite close to the sea, Larissa is a medium size land-locked and low-elevation city, Ioannina and Tripolis are mid-size cities of high elevation while Karlovasi is a low-elevation, small-size island city. The HDD decrease and CDD increase is evident for every city under both RCPs. The stronger increase in CDD under RCP8.5 is clear for all cities in agreement with our previous findings while the HDD difference between the two pathways is not so profound.
Table 4 shows the average monthly HDD/CDD values of the reference period and the expected changes for the future period under the two RCPs. Regarding the HDD, a stronger decrease is found for February and March under both RCPs, followed by January and December under RCP4.5 and by October, November and December under RCP8.5. However, since the reference period average HDD values for these months are high, the relative change is rather low. Higher relative decreases are found during the summer months and September. This is attributed to the fact that during the warm period of the year only very minor heating needs in high-elevation areas exist in the reference period. Therefore, the further reduction in the very small values of HDD results in a high “future period/reference period” ratio.
The average CDD values of the reference period are higher from June to September, while from November to April they are negligible or zero. In order to avoid unrealistic results, no relative change is computed from November to April. The stronger CDD increase is found for June, July and August; however, since during these months CDD values of the reference period are high, the relative change is weaker than that of May, September and October.

4. Conclusions

In the present study, we analyze the changes in heating degree days (HDD) and cooling degree days (CDD) in Greece in the near future (2021–2050), using general circulation models/regional climate models (GCM/RCM) simulations under two representative concentration pathways (RPC4.5 and RPC8.5). The analysis is performed using the more recent climate scenarios that include the latest developments and data that are considered superior to those used in previous studies focusing on Greece. The higher horizontal analysis allows a more detailed depiction of the expected changes.
According to our analysis regarding the expected changes in HDD and CDD in the near future (2021–2050), it was found that:
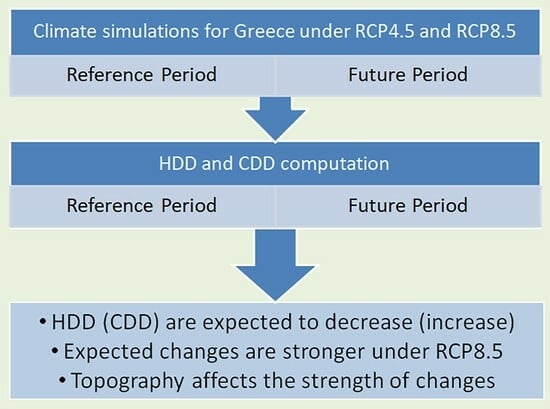
  • HDD are expected to decrease, while CDD are expected to increase, both in agreement with the expected temperature rise due to climate change;
  • The absolute reduction in HDD is stronger than the absolute increase in CDD. However the relative change is weaker for HDD, since in the reference period the average annual HDD value over Greece is higher than the average annual CDD value by a factor close to three;
  • Both the average annual decrease in HDD and the average annual increase in CDD are stronger under RCP8.5 compared to RCP4.5. This is in agreement with the fact that RCP8.5 does not include any gas emissions mitigation policies and therefore the radiative forcing and global temperature will continue to rise until the end of the century;
  • The absolute HDD decrease is stronger than the CDD increase for mountainous areas. However, the relative decrease in HDD is weaker than the CDD increase. That is due to the fact that the high-elevation areas need almost no cooling in the reference period. But in the future period, some cooling will be required, resulting in a high relative change;
  • The HDD absolute decrease in high-elevation areas is expected to be higher than in the rest of the Greek territory. However, the HDD relative changes do not seem to present a preference related to elevation or topography, suggesting that the absolute decrease is proportional to the reference period heating needs;
  • Regarding the inter-annual relative change in HDD/CDD values, year-to-year fluctuations were found, but the overall increase in cooling needs and decrease in heating needs is confirmed. The stronger relative increase in CDD compared to the relative decrease in HDD and the stronger impact of RCP8.5 compared to RCP4.5 are also confirmed;
  • Regarding the intra-annual characteristics of the impact of climate change in heating needs, it was shown that the stronger absolute decrease is expected in February and March under both RCPs. January and December follow for RCP4.5 and October, November and December follow for RCP8.5. The relative change, however, is not so pronounced due to the high HDD values of the reference period. A stronger relative decrease in HDD is expected from June to September, where only mountainous areas need some very limited heating in the reference period and even small reductions in that heating result in high relative decreases;
  • The cooling needs of Greece in the reference period are higher for from June to September while from November to April they are negligible to zero. The stronger CDD absolute increase is expected for the three summer months (June, July and August), but their relative increase is lower during these months, compared to May, September and October because the summer months present much higher CDD values in the reference period, resulting in a lower “future period/reference period” ratio.
It becomes evident that a reduction in heating needs and increase in cooling needs is expected in the near future for Greece, regardless of representative concentration pathway. Location and year-to-year differences and fluctuations will also be present. This finding is in agreement with the expected temperature increase due to climate change. Cartalis et al. [20], Giannakopoulos and Psiloglou [21], Giannakopoulos et al. [23] and Karagiannidis et al. [15] also highlighted the expected increase in cooling needs during summer and decrease in heating needs during winter over Greece for various future periods. The results are similar for other areas of Europe (e.g., Spinoni et al. [8], Janković et al. [18], Christenson et al. [41], Larsen et al. [42], Reine Nishimwe and Reiter [43] and Fallmann et al. [44]).
A total change in the energy required for temperature regulation could be associated to the sum of HDD and CDD. However, this could lead to misleading results because the methods and efficiency of heating and cooling methods vary greatly. For example, the energy needed for cooling is mainly electrical while, at least for Greece, the energy needed for heating comes mainly from petrol, gas or even wood-burning in fireplaces.
The selection of the HDD/CDD methodology of computation and of the base temperature in the present study was one of the most commonly used worldwide. Different methodologies or base temperatures may lead to different numeric results. Our preliminary testing showed that the qualitative characteristics of the analysis do not change significantly. Since our primary goal is to identify and analyze the averaged changes in heating and cooling needs in the near future, our results remain valid, regardless of the method and base temperature selection.
Finally, higher horizontal resolution datasets will be quite valuable when attempting to highlight local discrepancies influenced by topographic features in regions of increased geographic diversity like Greece. The application of spatial downscaling techniques for land-surface temperature data may prove successful in producing the desired high-resolution datasets and could be examined in the context of a future work.

Author Contributions

Conceptualization, A.K., K.L. and V.K.; methodology, A.K., K.L. and V.K.; software, A.K. and E.G.; formal analysis, A.K., K.L. and V.K.; resources, A.K., K.L., V.K. and E.G.; data curation, A.K. and E.G.; writing—original draft preparation, A.K.; writing—review and editing, A.K., K.L. and V.K.; visualization, A.K.; supervision, K.L. and V.K. All authors have read and agreed to the published version of the manuscript.

Funding

This work has been co-funded by the project Centers of Competence (Grant Agreement: Action ΓΓ2CC-0131674) financed by the GSRI (Greece).

Institutional Review Board Statement

Not applicable.

Informed Consent Statement

Not applicable.

Data Availability Statement

Publicly available datasets were analyzed in this study. This data can be found here: https://esgf-node.ipsl.upmc.fr/search/cordex-ipsl/.

Conflicts of Interest

The authors declare no conflicts of interest.

Appendix A

Figure A1. Inter-annual HDD variation for (a) Alexandroupolis, (b) Athens, (c) Corfu, (d) Heraclion, (e) Ioannina, (f) Karlovasi, (g) Larissa, (h) Mytilene, (i) Orestiada, (j) Patras, (k) Rhodes, (l) Thessaloniki, (m) Tripolis and (n) Zakynthos under the two representative concentration pathways (RCP4.5/RCP8.5).
Atmosphere 15 00393 g0a1aAtmosphere 15 00393 g0a1bAtmosphere 15 00393 g0a1c
Figure A2. Inter-annual CDD variation for (a) Alexandroupolis, (b) Athens, (c) Corfu, (d) Heraclion, (e) Ioannina, (f) Karlovasi, (g) Larissa, (h) Mytilene, (i) Orestiada, (j) Patras, (k) Rhodes, (l) Thessaloniki, (m) Tripolis and (n) Zakynthos under the two representative concentration pathways (RCP4.5/RCP8.5).
Atmosphere 15 00393 g0a2aAtmosphere 15 00393 g0a2bAtmosphere 15 00393 g0a2c

References

  1. Morakinyo, T.E.; Ren, C.; Shi, Y.; Lau, K.K.-L.; Tong, J.W.; Choy, C.-W.; Ng, E. Estimates of the impact of extreme heat events on cooling energy demand in Hong Kong. Renew. Energy 2019, 142, 73–84. [Google Scholar] [CrossRef]
  2. Ramon, D.; Allacker, K.; De Troyer, F.; Wouters, H.; van Lipzig, N.P.M. Future heating and cooling degree days for Belgium under a high-end climate change scenario. Energy Build. 2020, 216, 109935. [Google Scholar] [CrossRef]
  3. Semmler, T.; McGrath, R.; Steele-Dunne, S.; Hanafin, J.; Nolana, P.; Wanga, S. Influence of climate change on heating and cooling energy demand in Ireland. Int. J. Climatol. 2010, 30, 1502–1511. [Google Scholar] [CrossRef]
  4. Spinoni, J.; Vogt, J.; Barbosa, P. European degree-day climatologies and trends for the period 1951–2011. Int. J. Climatol. 2015, 35, 25–36. [Google Scholar] [CrossRef]
  5. Gaudard, L.; Romerio, F.; Dalla Valle, F.; Gorret, R.; Maran, S.; Ravazzani, G.; Stoffel, M.; Volonterio, M. Climate change impacts on hydropower in the Swiss and Italian Alps. Sci. Total Environ. 2014, 493, 1211–1221. [Google Scholar] [CrossRef]
  6. Fan, J.-L.; Hu, J.-W.; Zhang, X. Impacts of climate change on electricity demand in China: An empirical estimation based on panel data. Energy 2016, 170, 880–888. [Google Scholar] [CrossRef]
  7. Chidiac, S.E.; Yao, L.; Liu, P. Climate Change Effects on Heating and Cooling Demands of Buildings in Canada. Civil Eng. 2022, 3, 277–295. [Google Scholar] [CrossRef]
  8. Spinoni, J.; Vogt, J.V.; Barbosa, P.; Dosio, A.; McCormick, N.; Biganob, A.; Fόssele, H.-M. Changes of heating and cooling degree-days in Europe from 1981 to 2100. Int. J. Climatol. 2018, 38, e191–e208. [Google Scholar] [CrossRef]
  9. Kendon, M.; McCarthy, M.; Jevrejeva, S.; Matthews, A.; Sparks, T.; Garforth, J.; Kennedy, J. State of the UK Climate 2021. Int. J. Climatol. 2022, 42, 1–80. [Google Scholar] [CrossRef]
  10. European Environmental Agency—Projected Linear Trend in Heating (HDD) and Cooling Degree Days (CDD) over the Period 1981–2100 under Two Scenarios. Available online: https://www.eea.europa.eu/data-and-maps/figures/projected-linear-trend-in-heating (accessed on 14 March 2024).
  11. Matzarakis, A.; Balafoutis, C. Heating degree-days over Greece as an index of energy consumption. Int. J. Climatol. 2004, 24, 1817–1828. [Google Scholar] [CrossRef]
  12. Psiloglou, B.E.; Giannakopoulos, C.; Majithia, S.; Petrakis, M. Factors affecting electricity demand in Athens, Greece and London, UK: A comparative assessment. Energy 2009, 34, 1855–1863. [Google Scholar] [CrossRef]
  13. Moustris, K.P.; Nastos, P.T.; Bartzokas, A.; Larissi, I.K.; Zacharia, P.T.; Paliatsos, A.G. Energy consumption based on heating/cooling degree days within the urban environment of Athens, Greece. Theor. Appl. Climatol. 2015, 122, 517–529. [Google Scholar] [CrossRef]
  14. Kyriakopoulos, P.; Giannopoulos, A.; Caouris, Y.G.; Souliotis, M.; Santamouris, M. Degree-hours and Degree-days in Coastal Mediterranean Cities, Patras and Kalamata, Greece. Adv. Environ. Eng. Res. 2021, 2, 4. [Google Scholar] [CrossRef]
  15. Karagiannidis, A.; Lagouvardos, K.; Kotroni, V.; Galanaki, E. Analysis of Current and Future Heating and Cooling Degree Days over Greece Using Observations and Regional Climate Model Simulations. In Proceedings of the 16th International Conference on Meteorology, Climatology and Atmospheric Physics—COMECAP 2023, Athens, Greece, 25–29 September 2023. [Google Scholar]
  16. Andrade, C.; Mourato, S.; Ramos, J. Heating and Cooling Degree-Days Climate Change Projections for Portugal. Atmosphere 2021, 12, 715. [Google Scholar] [CrossRef]
  17. Petri, Y.; Caldeira, K. Impacts of global warming on residential heating and cooling degree-days in the United States. Sci. Rep. 2015, 5, 12427. [Google Scholar] [CrossRef]
  18. Janković, A.; Podraščanin, Z.; Djurdjevic, V. Future climate change impacts on residential heating and cooling degree days in Serbia. Idojaras 2019, 123, 351–370. [Google Scholar] [CrossRef]
  19. OrtizBeviá, M.J.; Sánchez-López, G.; Alvarez-Garcìa, F.J.; RuizdeElvira, A. Evolution of heating and cooling degree-days in Spain: Trends and interannual variability. Glob. Planet Change 2012, 92–93, 236–247. [Google Scholar] [CrossRef]
  20. Cartalis, C.; Synodinou, A.; Petrou, M.; Tsangrassoulis, A.; Santamouris, M. Modifications in energy demand in urban areas as a result of climate changes: An assessment for the southeast Mediterranean region. Energy Convers. Manag. 2001, 42, 1647–1655. [Google Scholar] [CrossRef]
  21. Giannakopoulos, C.; Psiloglou, B.E. Trends in energy load demand for Athens, Greece: Weather and non-weather related factors. Clim. Res. 2006, 31, 97–108. [Google Scholar] [CrossRef]
  22. Mirasgedis, S.; Sarafidis, Y.; Georgopoulou, E.; Kotroni, V.; Lagouvardos, K.; Lalas, D.P. Modeling framework for estimating impacts of climate change on electricity demand at regional level: Case of Greece. Energy Convers. Manag. 2007, 48, 1737–1750. [Google Scholar] [CrossRef]
  23. Giannakopoulos, C.; Kostopoulou, E.; Varotsos, K.V.; Tziotziou, K.; Plitharas, A. An integrated assessment of climate change impacts for Greece in the near future. Reg. Environ. Change 2011, 11, 829–843. [Google Scholar] [CrossRef]
  24. EURO_CORDEX. Available online: https://www.euro-cordex.net/ (accessed on 14 March 2024).
  25. Taylor, K.E.; Stouffer, R.J.; Meehl, G.A. An overview of CMIP5 and the experiment design. Bull. Amer. Meteor. Soc. 2012, 93, 485–498. [Google Scholar] [CrossRef]
  26. Boberg, F.; Christensen, J.H. Overestimation of Mediterranean summer temperature projections due to model deficiencies. Nat. Clim. Change 2012, 2, 433–436. [Google Scholar] [CrossRef]
  27. Landelius, T.; Dahlgren, P.; Gollvik, S.; Jansson, A.; Olsson, E. A high-resolution regional reanalysis for Europe. Part 2: 2D analysisof surface temperature, precipitation and wind. Q. J. R. Meteorol. Soc. 2016, 142, 2132–2142. [Google Scholar]
  28. Dahlgren, P.; Landelius, T.; Kållberg, P.; Gollvik, S. A high-resolution regional reanalysis for Europe. Part 1: Three-dimensional reanalysis with the regional HIgh-ResolutionLimited-Area Model (HIRLAM). Q. J. R. Meteorol. Soc. 2016, 142, 2119–2131. [Google Scholar]
  29. Isotta, F.A.; Vogel, R.; Frei, C. Evaluation of European regional reanalyses and downscalings for precipitation in the Alpine region. Meteorol. Zeitschrift. 2015, 24, 15–37. [Google Scholar] [CrossRef]
  30. Haddad, Z.S.; Rosenfeld, D. Optimality of empirical Z-R relations. Q. J. R. Meteorol. Soc. 1997, 123, 1283–1293. [Google Scholar]
  31. Michelangeli, P.-A.; Vrac, M.; Loukos, H. Probabilistic downscaling approaches: Application to wind cumulative distribution functions. Geophys. Res. Lett. 2009, 36, 11. [Google Scholar] [CrossRef]
  32. Clarke, L.; Edmonds, J.; Jacoby, H.; Pitcher, H.; Reilly, J.; Richels, R. Scenarios of Greenhouse Gas Emissions and Atmospheric Concentrations. Sub-Report 2.1 A of Synthesis and Assessment Product 2.1 by the US Climate Change Science Program and the Subcommittee on Global Change Research; US Climate Change Science Program: Washington, DC, USA, 2007. [Google Scholar]
  33. Wise, M.; Calvin, K.; Thomson, A.; Clarke, L.; Bond-Lamberty, B.; Sands, R.; Smith, S.J.; Janetos, A.; Edmonds, J. Implications of limiting CO2 concentrations for land use and energy. Science 2009, 324, 1183–1186. [Google Scholar] [CrossRef] [PubMed]
  34. Thomson, A.M.; Calvin, K.V.; Smith, S.J.; Kyle, G.P.; Volke, A.; Patel, P.; Delgado-Arias, S.; Bond-Lamberty, B.; Wise, M.A.; Clarke, L.E.; et al. RCP4.5: A pathway for stabilization of radiative forcing by 2100. Clim. Change 2011, 109, 77–94. [Google Scholar] [CrossRef]
  35. Van Vuuren, D.P.; Edmonds, J.; Kainuma, M.; Riahi, K.; Thomson, A.; Hibbard, K.; Hurtt, G.C.; Kram, T.; Krey, V.; Lamarque, J.F.; et al. The representative concentration pathways: An overview. Clim. Change 2011, 109, 5–31. [Google Scholar] [CrossRef]
  36. Riahi, K.; Grübler, A.; Nakicenovic, N. Scenarios of long-term socio-economic and environmental development under climate stabilization. Technol. Forecast Soc. Change 2007, 74, 887–935. [Google Scholar] [CrossRef]
  37. Riahi, K.; Rao, S.; Krey, V.; Cho, C.; Chirkov, V.; Fischer, G.; Kindermann, G.; Nakicenovic, N.; Rafaj, P. RCP 8.5-A scenario of comparatively high greenhouse gas emissions. Clim. Change 2011, 109, 33–57. [Google Scholar] [CrossRef]
  38. WCRP CORDEX Database. Available online: https://esgf-node.ipsl.upmc.fr/search/cordex-ipsl/ (accessed on 14 March 2024).
  39. Quayle, R.G.; Diaz, H.F. Heating degree day data applied to residential heating energy consumption. J. Appl. Meteorol. 1980, 3, 241–246. [Google Scholar] [CrossRef]
  40. ΕΕA Geospatial Data Catalogue. Available online: https://sdi.eea.europa.eu/catalogue/srv/eng/catalog.search#/home (accessed on 14 March 2024).
  41. Christenson, M.; Manz, H.; Gyalistras, D. Climate warming impact on degree-days and building energy demand in Switzerland. Energy Convers. Manag. 2006, 47, 671–686. [Google Scholar] [CrossRef]
  42. Larsen, M.A.D.; Petrović, S.; Radoszynski, M.A.; McKenna, R.; Balyk, O. Climate change impacts on trends and extremes in future heating and cooling demands over Europe. Energy Build. 2020, 226, 110397. [Google Scholar] [CrossRef]
  43. Reine Nishimwe, A.M.; Reiter, S. Estimation, analysis and mapping of electricity consumption of a regional building stock in a temperate climate in Europe. Energy Build. 2021, 253, 111535. [Google Scholar] [CrossRef]
  44. Fallmann, J.; Wagner, S.; Emeis, S. High resolution climate projections to assess the future vulnerability of European urban areas to climatological extreme events. Theor. Appl. Climatol. 2017, 127, 667–683. [Google Scholar] [CrossRef]
Figure 1. Topographic map of Greece and its surrounding areas along with the location of the 14 selected cities.
Atmosphere 15 00393 g001
Figure 2. Average absolute annual HDD (a) and CDD (b) change over Greece for FP compared to RP under RCP4.5. Average absolute annual HDD (c) and CDD (d) change over Greece for FP compared to RP under RCP8.5. The RCP8.5–RCP4.5 differences for HDD (e) and CDD (f) are also illustrated.
Atmosphere 15 00393 g002aAtmosphere 15 00393 g002b
Figure 3. Average relative annual HDD (a) and CDD (b) change in Greece for FP compared to RP under RCP4.5. Average relative annual HDD (c) and CDD (d) change in Greece for FP compared to RP under RCP8.5. The RCP8.5–RCP4.5 differences for HDDs (e) and CDDs (f) are also illustrated.
Atmosphere 15 00393 g003aAtmosphere 15 00393 g003b
Figure 4. Inter-annual variation (solid line) and the associated best linear fit (dotted line) of the mean annual HDD (a) and CDD (b) deviation, averaged over the Greek region, under the two representative concentration pathways.
Atmosphere 15 00393 g004
Table 1. Computation formulae of daily HDDs.
Temperature CriterionHDD
Tmax ≤ TbaseHDD = Tbase − Taver
Taver ≤ Tbase < TmaxHDD = [(Tbase − Tmin)/2] − [(Tmax − Tbase)/4]
Tmin < Tbase < TaverHDD = (Tbase − Tmin)/4
Tmin ≥ TbaseHDD = 0
Table 2. Computation formulae of daily CDDs.
Temperature CriterionCDD
Tmax ≤ TbaseCDD = 0
Taver ≤ Tbase < TmaxCDD = (Tmax − Tbase)/4
Tmin < Tbase < TaverCDD = [(Tmax − Tbase)/2] − [(Tbase − Tmin)/4]
Tmin ≥ TbaseCDD = Taver − Tbase
Table 3. Average absolute and relative annual HDD/CDD changes under RCP4.5 and RCP8.5 for different elevation bins.
Elevation Bin (m)0–100100–200200–300300–500500–750750–10001000+
RCP4.5Average absolute annual HDD change (degree days)−117.8−117.5−125.3−121.5−151.4−155.8−176.0
Average relative annual HDD change (%)−8.8−8.2−8.1−6.9−6.7−5.9−5.6
Average absolute annual CDD change (degree days)141.3133.4131.0112.7101.981.261.7
Average relative annual CDD change (%)15.214.816.015.518.520.226.3
RCP8.5Average absolute annual HDD change (degree days)−139.1−140.6−150.5−147.2−176.4−182.6−204.4
Average relative annual HDD change (%)−10.4−9.8−9.8−8.5−7.9−7.0−6.5
Average absolute annual CDD change (degree days)172.2162.8159.6137.1119.396.074.0
Average relative annual CDD change (%)18.518.019.418.821.523.731.2
Table 4. Average monthly HDD/CDD values of the reference period (RP) and expected changes for the future period (FP) under RCP4.5 and RCP8.5 expressed as degree days and percentages.
HDD RPHDD Change RCP4.5HDD Change RCP8.5CDD RPCDD Change RCP4.5CDD Change RCP8.5
Degree DaysDegree Days%Degree Days%Degree DaysDegree Days%Degree Days%
January386.7−14.9−4.2−10.1−3.00.00-0.0-
February333.1−21.0−6.5−23.8−7.50.00.0-0.0-
March283.9−31.1−11.6−36.2−13.40.40.7-1.1-
April176.8−5.6−4.1−8.3−5.86.01.2-2.1-
May76.8−9.8−14.2−12.5−19.3045.210.026.313.535.6
June23.3−6.6−28.0−6.0−38.1127.121.818.824.020.9
July9.5−3.1−39.0−3.4−59.7196.126.414.828.716.1
August10.0−3.1−39.0−4.0−68.4191.926.015.033.018.9
September33.5−6.8−28.3−6.0−26.398.216.820.018.721.6
October96.9−10.7−13.4−15.6−20.330.77.942.011.657.9
November213.6−8.4−4.9−19.6−11.32.51.1-2.4-
December343.4−14.4−4.8−14.9−5.20.00.0-0.1-
Disclaimer/Publisher’s Note: The statements, opinions and data contained in all publications are solely those of the individual author(s) and contributor(s) and not of MDPI and/or the editor(s). MDPI and/or the editor(s) disclaim responsibility for any injury to people or property resulting from any ideas, methods, instructions or products referred to in the content.

