
Global Precipitation for the Year 2023 and How It Relates to Longer Term Variations and Trends

Earth System Science Interdisciplinary Center, University of Maryland, College Park, MD 20740, USA
*
Author to whom correspondence should be addressed.
Atmosphere 2024, 15(5), 535; https://doi.org/10.3390/atmos15050535
Submission received: 14 March 2024
/
Revised: 16 April 2024
/
Accepted: 25 April 2024
/
Published: 27 April 2024
(This article belongs to the Special Issue The Water Cycle and Climate Change (2nd Edition))
Abstract
:In this paper, the global distribution of precipitation for 2023, in terms of global totals and regional anomaly patterns, is analyzed using information from the new Global Precipitation Climatology Project (GPCP) V3.2 Monthly product, including how the precipitation amounts and patterns from 2023 fit into the longer record from 1983–2023. The tropical pattern of anomalies for 2023 is dominated by the effect of the El Nino which began during the Northern Hemisphere spring, after three plus years of La Nina conditions. The transition from La Nina conditions through 2022 shows the rapid change in many regional features from positive to negative anomalies or the reverse. Comparison of the observed regional trend maps with climate model results indicates similarity between the observations and the model results forced by observed SSTs, while the “free-running” model ensemble shows only a broad general agreement over large regions. Global total precipitation shows about a 3% range over the span of data, with El Nino and La Nina years prominent as positive and negative features, with 2023 showing a small positive global anomaly. The ITCZ (Inter-Tropical Convergence Zone) latitude band, 0–10° N, sets a record high mean rain rate in 2023 after a steady upward trend over the decades, probably a response related to global warming.
1. Introduction
Global precipitation and its distribution in time and space is obviously important to life on the planet’s land surfaces and is a key ingredient in the Earth’s water and energy cycles [1]. In the last 40 years or so, scientists have integrated a combination of satellite and surface observations to produce analyses that can be used to better understand the means and climate variations, both regionally and globally, of this key parameter. With the current upward trend over recent decades in surface temperature due to human activity, it is useful to quickly analyze the just completed year and understand the precipitation distributions for that year and how the year fits into the scheme of past decades of global warming.
Global mean surface temperatures set a record for the year 2023 related to both the increase in greenhouse gases (GHG) in our atmosphere plus inter-annual to inter-decadal time-scale variations in temperature and other variables which all affect the variations of precipitation both globally and regionally [2]. For global precipitation, the year 2023 saw a transition from a Pacific Ocean sea surface temperature (SST) pattern associated with La Nina conditions to El Nino conditions. The high mean surface temperatures were helped by the warm El Nino SST conditions during the last two-thirds of the year. With the ability now to monitor precipitation globally using satellites and ground information and provide global analyses within a relatively short time (within a few weeks of the end of the month), it is now possible to quickly assess the previous year in terms of global precipitation using an observation-based global analysis and to analyze that year in the context of the long-term record. This relatively quick analysis is the primary objective of this short paper, along with exploring the impact of recent inter-annual variations (El Nino/La Nina) and longer term effects (global warming) on global and regional precipitation changes.
The data sets and methodology used in this study are described in Section 2. Results are described in Section 3, including anomaly maps for both 2022 and 2023, how they are related to different phases of ENSO, and how 2023 fits into the long-term regional trend pattern, including comparison with climate model results. Record-setting 2023 results from the ITCZ zone are also described.
2. Data and Methodology Used in This Study
The satellite-based monthly precipitation analysis from the Global Precipitation Climatology Project (GPCP) product Version 3.2 [3] is used to examine variation and changes in global precipitation amount and intensity. GPCP is a merged product using a variety of satellite/ground data sources: passive microwave-based (PMW) rainfall estimates from the Special Sensor Microwave/Imager (SSM/I) and the Special Sensor Microwave Imager Sounder (SSMIS), infrared (IR) rainfall estimates from a series of geostationary and polar-orbiting satellites, and surface rain gauges from the Global Precipitation Climatology Centre (GPCC). Climatological ocean means based on information from the Global Precipitation Measurement (GPM) core satellite, the Tropical Rainfall Measuring Mission (TRMM) and CloudSat are also utilized. Gauge-based analyses are critical over land areas, along with satellite-based estimates in regions where gauges are sparsely distributed. Inter-annual variations over oceans are driven by passive microwave satellite-based estimates. The method of combining input data sets is designed to take advantage of strengths of individual datasets, especially in terms of bias reduction and temporal homogeneity and is described in detail in the following references [4,5,6]. Archived on a global 0.5° × 0.5° grid, the monthly GPCP V3.2 product spans from January 1983 to the present and can be accessed from https://disc.gsfc.nasa.gov/datasets/GPCPMON_3.2/summary?keywords=GPCPMON_3.2 (accessed on 20 January 2024).
The methodology for this study utilizes the GPCP results for 2023 and compares them first to 2022 to show the recent ENSO transition and then for the entire record (1983–2023) to place the last year in the context of the entire period for examination of global-scale variations and regional trends, including comparison of regional trends with climate models.
3. Results
3.1. Anomaly Maps for 2023 and 2022
Examination of the annual mean precipitation map for 2023 (Figure 1, top panel) indicates the typical features across the globe, with precipitation maxima of the tropics and mid-latitudes and dry zones in the subtropics. However, the bottom panel of Figure 1 shows that there are significant anomaly features from the long-term (1979–2022) climatology. La Nina conditions were still dominant in January 2023 in the central tropical Pacific (Nino 3.4 Index of −0.72). A rapid warming in the central Pacific Ocean evolved over the next few months, resulting in a change to a positive Index by April with continued SST warming as the El Nino emerged, reaching a December Index of +2.07. For all of 2023, the mean Nino 3.4 Index was +0.83.
Because the El Nino-type conditions dominate the year, the tropical anomaly pattern has a stronger weight in that category, although the overall annual pattern is affected by the La Nina conditions in the early part of the year. Across the central Pacific there is a strong positive anomaly along the ITCZ, with negative anomalies to the north and south, indicating an intensification of the ITCZ in this region [7,8,9]. The western Pacific Ocean also has a wet anomaly, but wider compared to the central Pacific. Over the Maritime Continent there is a general negative anomaly with some small positive areas. To the southwest of the Maritime Continent, stronger negative anomalies extend into the Indian Ocean. Over the western Indian Ocean, a positively anomaly exists overlapping the Equator and reaching into Africa. A strong negative anomaly is present over southern Africa. Australia was generally dry, as is expected during generally El Nino conditions. The Amazon in South America has a large rainfall deficit amid continuing drought conditions there. However, just to the south, surrounding the border between Brazil and Argentina a small area of precipitation surplus is present.
It is useful to extend our analysis back through 2022 to set the recent context. In early 2020, central Pacific Ocean surface temperatures cooled with the start of the 2020–2023 La Nina, one of the longest on record. The year 2022 had La Nina conditions for the entire year. Figure 2 shows the anomaly fields for 2022 and 2023, along with annual composites for La Nina and El Nino conditions using previous years, based on the Nino 3.4 Index. The annual 2022 anomaly field matches the La Nina composite very well, especially over both tropical ocean and land areas, but even to a fair degree at higher latitudes. The La Nina and El Nino composites are very close mirror images of each other. For 2022, the La Nina resulted in central Pacific dryness, Maritime Continent wet conditions, dryness over much of the Indian Ocean, extending well south of the Equator, and wet conditions over southern Africa and northern South America. The wet feature over the Maritime Continent extends far to the southeast to the Straits of Magellan. Somewhat weaker matches are found over the North Pacific and Atlantic Oceans and North America.
To quantify the relation of the annual anomaly map to El Nino conditions, the pattern correlation is computed between the anomaly maps for 2023 and the El Nino composite for the 40° N–40° S band. For the whole year it is positive +0.34, but small compared to December 2023 with +0.59, when the El Nino was very intense with a Nino 3.4 of +2.07. Therefore, the annual anomaly map shows generally El Nino conditions, but not overwhelmingly so, due to the La Nina conditions during the early months of the year.
North America for 2023 was generally drier than normal, but interrupted by a relatively wet zone from the Pacific into the U.S. west coast and extending eastward. This general pattern is dissimilar from that of typical El Nino years.
Over Europe and northern Asia, positive precipitation anomalies dominated for the year, except for the Iberian Peninsula and the Mediterranean Sea. The South Asian monsoon produced positive anomalies over the water and a varying result over land, as was the case over China.
3.2. Evolution of Precipitation Patterns during 2023
The evolution of the anomaly patterns through the year is shown in Figure 3. The January–March pattern (Figure 3a) indicates a La Nina in the Pacific and elsewhere (Nino 3.4 Index of −0.4). This La Nina-like pattern has a large deficit of rain over the central equatorial Pacific, with the V-shaped positive anomaly to the west over the Maritime Continent, with arms reaching to the northeast and southeast, and a mostly dry Indian Ocean. The Australia and Amazon regions are unexpectedly dry due to the weakening phase of the La Nina. The dry feature over the Amazon in these early months continues throughout the year into the El Nino phase, exasperating the drought there.
The El Nino begins to show in the April–June pattern (Figure 3b) with the start of a Pacific ITCZ and western Pacific wet anomaly (Nino 3.4 Index +0.47). This El Nino pattern continues to intensify through July–September (Figure 3c, Nino 3.4 Index +1.1) into the full tropical El Nino pattern of the final period (Figure 3d, Index +1.9). Floods and landslides, for example over Somalia and eastern Africa (see https://floodlist.com/africa/east-africa-floods-november-2023-somalia-ethiopia-kenya-burundi-malawi, accessed on 20 January 2024), are associated with this El Nino pattern, as is the continuation of the drought over the Amazon. Independent of ENSO, over Europe and northern Asia positive anomalies exist over the cool months and negative anomalies over the warm months.
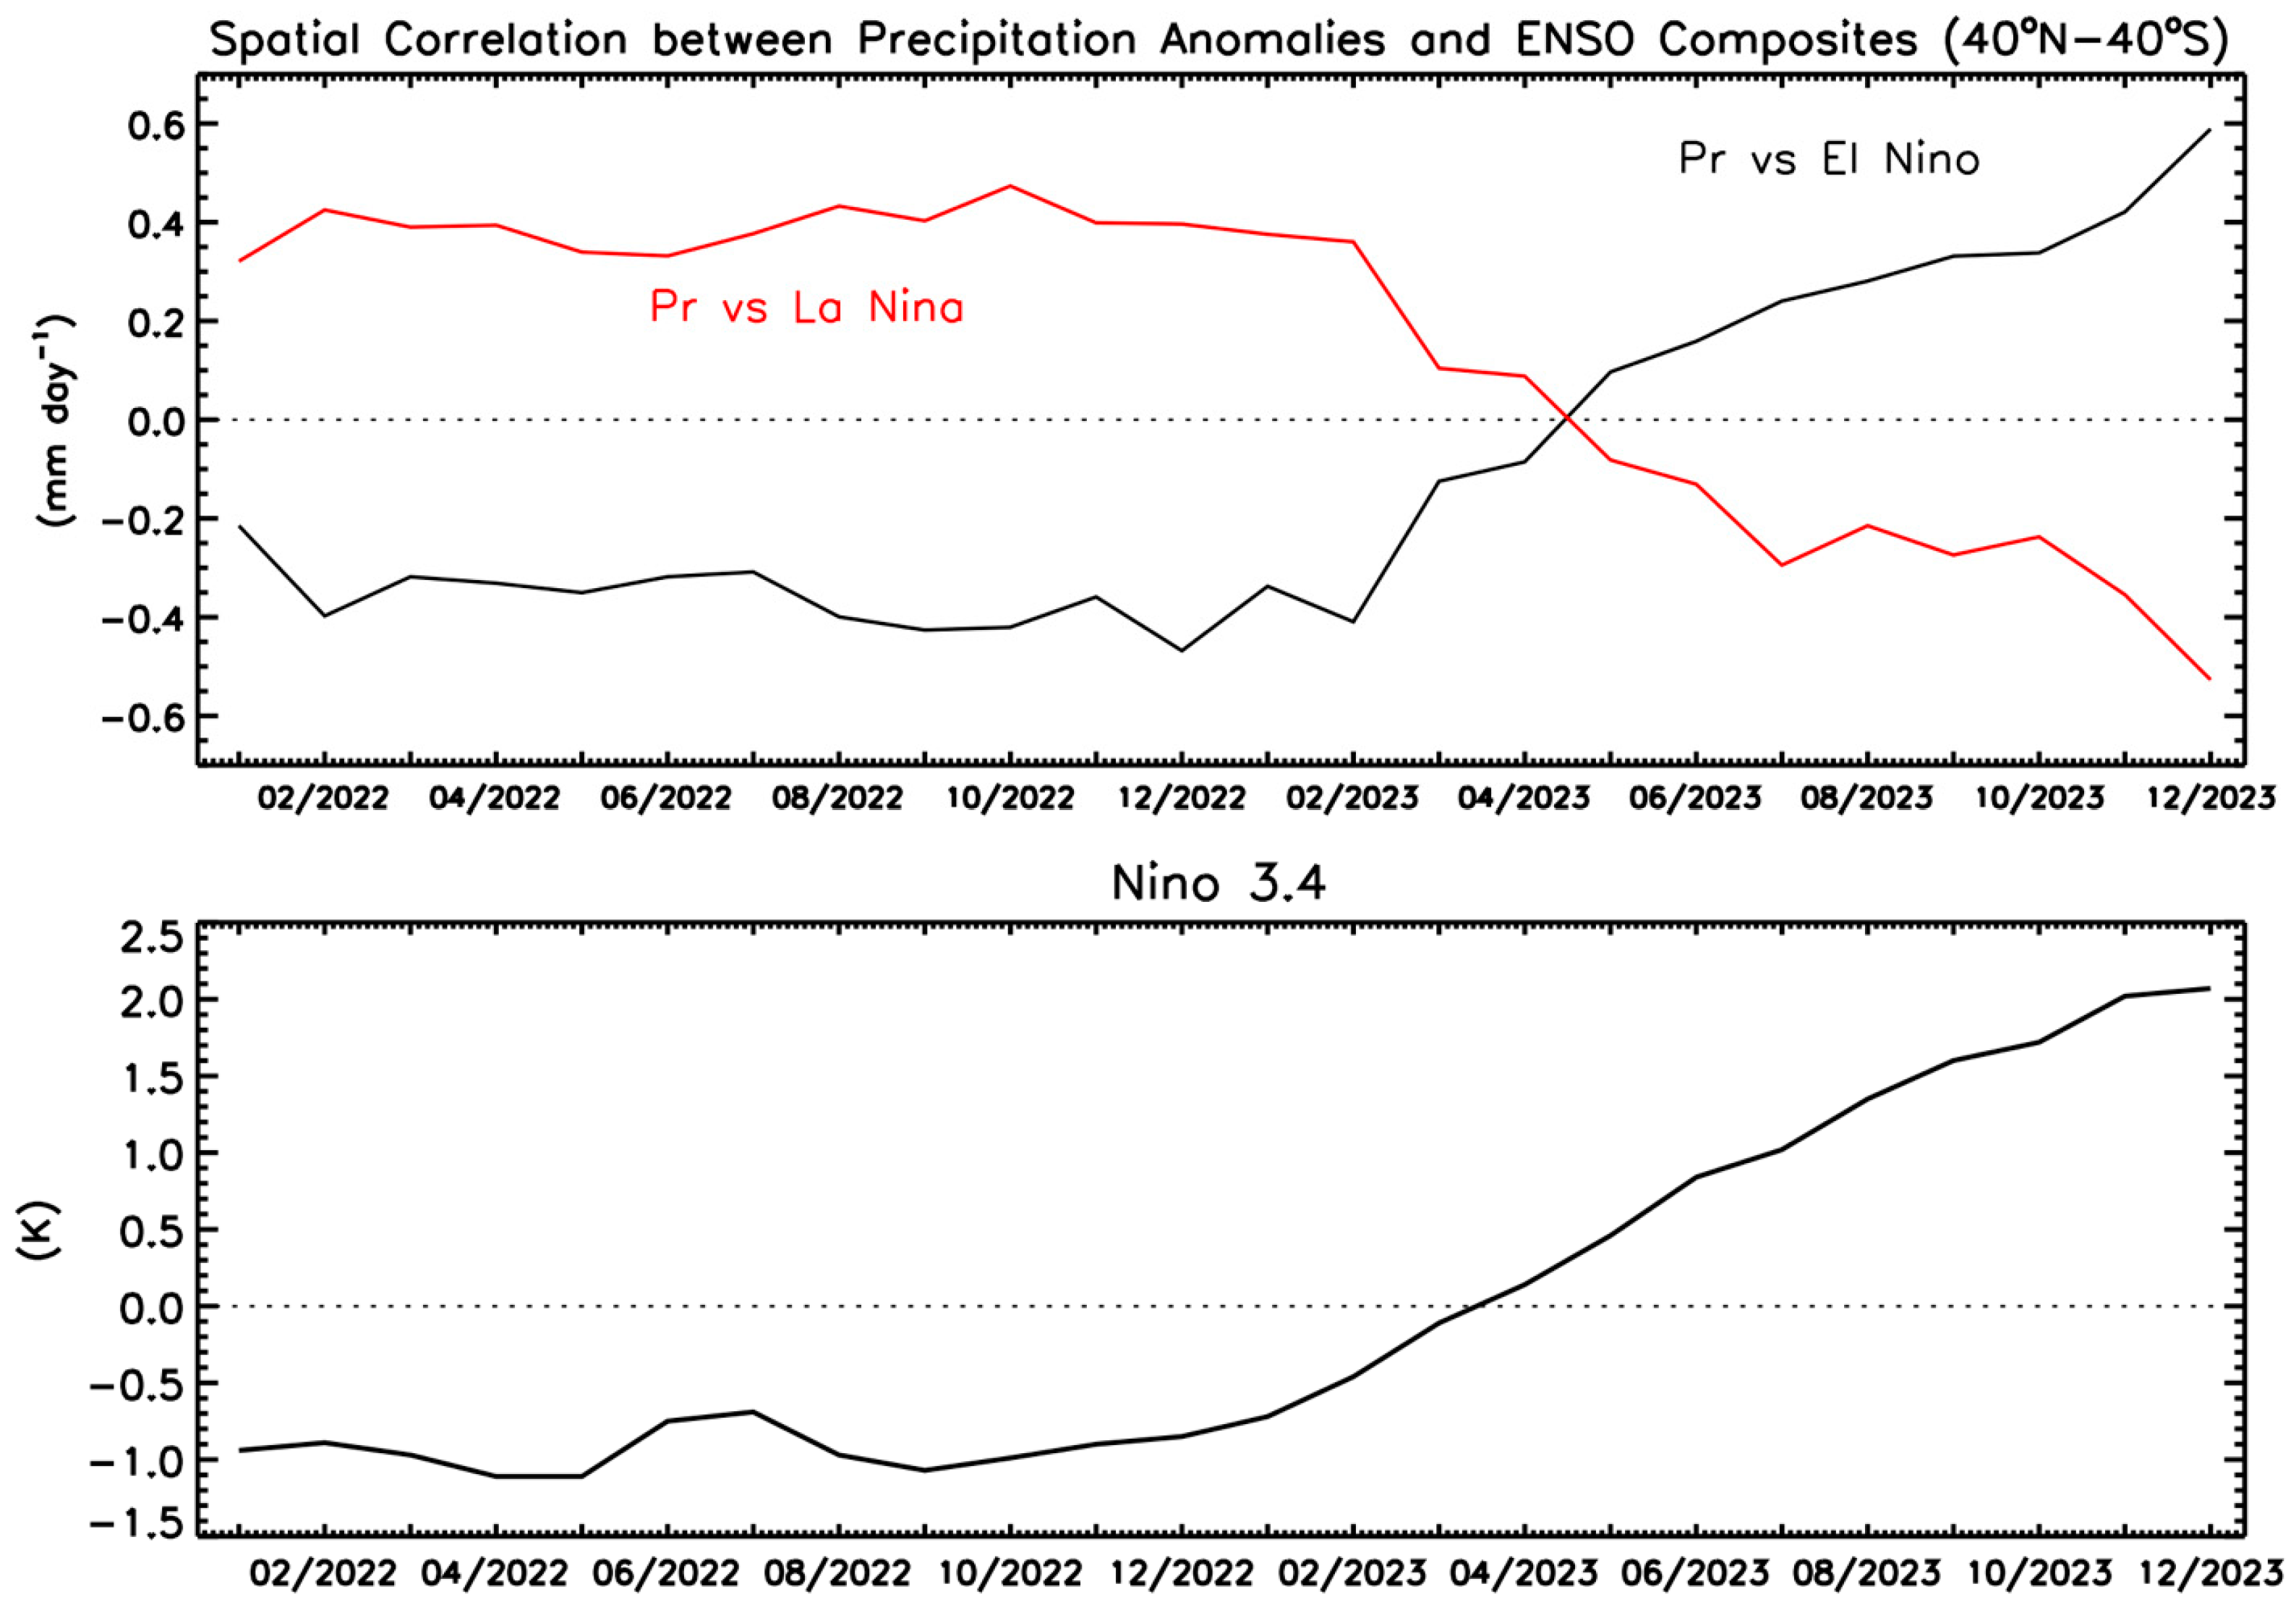
This transition from La Nina to El Nino is quantified in Figure 4, examining the pattern correlation over the latitude band 40° N–40° S. This band was chosen to cover the deep tropics and much of the subtropics and include both wet and dry regions where ENSO has significant effect. For the entirety of 2022, when the Nino 3.4 SST Index was near −1.0, the correlation between the monthly anomaly patterns and the composite La Nina patterns is about +0.4 (and about -0.4 against the El Nino composites). As time crosses into 2023, the Nino 3.4 Index begins to increase, crossing into positive territory in March on its way to a maximum of ~+2.0 at the end of 2023. The anomaly/composite correlations also rapidly change, with the positive El Nino correlation continuously increasing until the last few months, reaching a value of +0.6 at the end of 2023.
3.3. Global Regional Trends and 2023 Anomalies
The global trend map based on the GPCP analysis of satellite and gauge observations has been described [3,10] and compared to climate model results [11]. Figure 5 (top panel) shows a 1983–2022 version of the GPCP trend map. In the tropical Pacific, the ITCZ has intensified and shifted northward during the last 40+ years. The western Pacific shows a positive change, along with the tropical Indian Ocean and the Atlantic ITCZ region. Land areas also show trends, e.g., wet and dry trends over South America and drying over southwest North America. Regional trends are obviously the accumulation over the years of regional annual departures from climatology. So, how does 2023 fit in to that long-term trend map? The 2023 anomaly map is repeated in the bottom panel of Figure 5 for comparison and shows some positive overlaps with the long-term trend map, indicating 2023 playing a role in the long-term changes. Examples include matching positive signs between the two panels in the western Pacific, western Indian Ocean, and the Pacific ITCZ, and matching negative signs over the southwestern U.S. and the Amazon. The pattern of trends and anomalies also are similar over the South Pacific Convergence Zone (SPCZ) and the high latitudes of the Northern Hemisphere. As one would expect, the comparison is noisy, however, the correlation between the two fields (40° N–40° S) is positive, at +0.21, indicating that overall the anomaly field from 2023 has contributed positively to the long-term trend pattern.
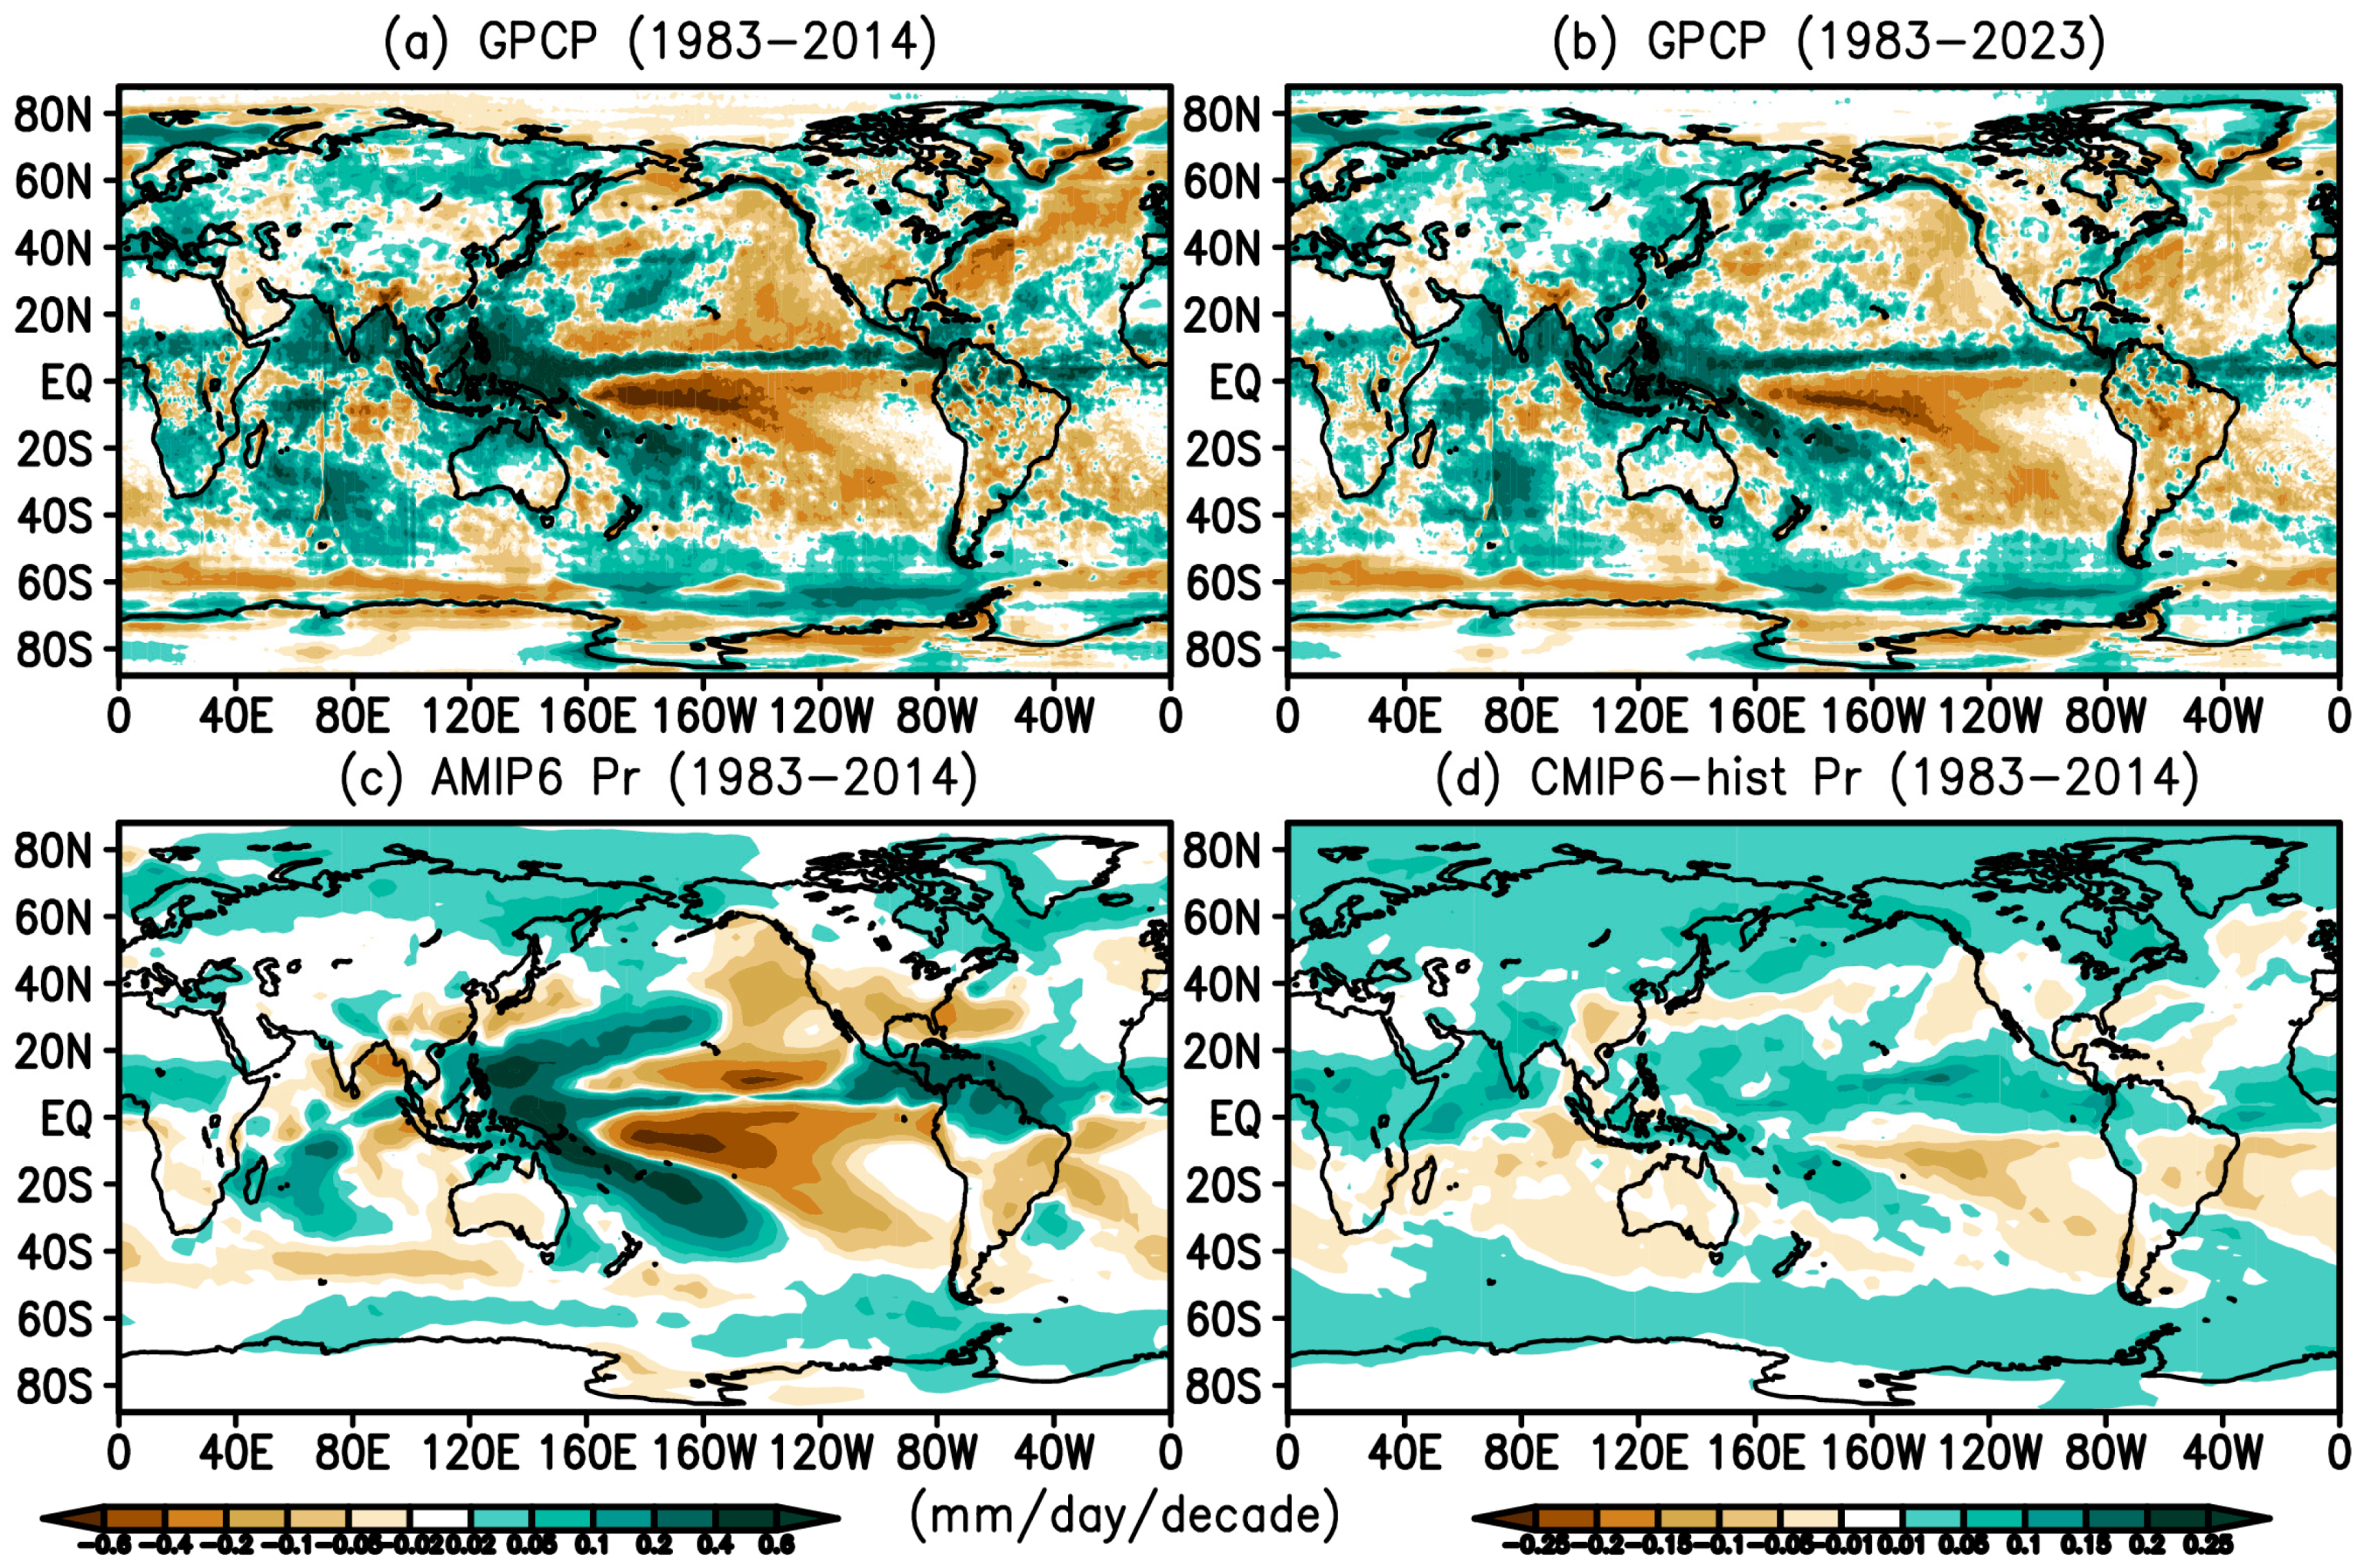
Comparison of the GPCP trend map with climate model results, but for the earlier GPCP V2.3, has been discussed in [11]. Figure 6 shows a similar set of maps but for the new GPCP V3.2, with the time period of the GPCP maps and climate model results shortened to overlap exactly (1983–2014) in three of the panels, with a fourth panel (top right) showing the entire GPCP V3.2 record (as in Figure 5).
For this analysis, we utilized the monthly calculated precipitation from the climate model outputs [12], with one realization (the first) chosen from each. The models used are:
(1) the coupled ocean-atmosphere, full radiative forcing runs (CMIP6-hist; here referred to as CMIP6, 28 models) driven by natural (solar variation, volcanic eruptions, etc.) and anthropogenic (GHG and aerosols) radiative forcings, and (2) the atmosphere-only (AMIP6, 28 models) simulations from the CMIP6 models forced by observed SST and sea ice extent, along with the radiative forcings used in the CMIP6 historical full forcing experiments.
The results with the new GPCP V3.2 are very similar to that with V2.3 in the earlier paper [11], and readers are referred to that paper for a detailed discussion. In brief, the trend patterns between Figure 6a (GPCP) and 6c (AMIP) are broadly similar, despite the coarser resolution and multiple ensemble members producing smoother patterns. This similarity is not unexpected because the forcing from the observed SSTs helps to drive the large-scale pattern and intensity of the resulting precipitation features. However, there are differences, for example, along the central-eastern Pacific ITCZ, where the distinct, but narrow, GPCP feature of increase becomes near zero or even a decrease in AMIP6. However, the precipitation trends in the CMIP6 ensemble (Figure 6d) tend to show broader and weaker features from those in the GPCP. However, regional similarities between CMIP6-hist and either GPCP or AMIP6 results can readily be seen in the deep tropics and over the mid–high latitudes. For example, all of the trend maps have positive trends along the Pacific ITCZ and SPCZ, in the Indian Ocean, and along the Atlantic ITCZ extending across part of the West African continent. Subtropical drying and high-latitude wetting are generally seen as well in all three. These general similarities indicate the climate-change (GHG) effect on precipitation change in these regions. It is also important to note that the magnitudes of regional trends in the CMIP6 results are generally smaller than those in either the GPCP or AMIP6 (a different scale is used in the CMIP6 panel). As the global precipitation observed record (e.g., GPCP) becomes longer, the effects of inter-annual and inter-decadal variations should become more subdued and the effects of long-term changes (e.g., GHG effects) should become more obvious and can be a better tool with which to compare to the CMIP6-hist results which naturally smooth out those shorter term variations.
3.4. Global Total Precipitation
Global total precipitation has remained nearly steady over the GPCP era, with only a small 1.5%/K rise (not statistically significant) compared to global surface temperature, and similar to climate models [11]. But, the annual global precipitation mean value does fluctuate, mainly due to ENSO, with years dominated by El Nino conditions having a positive global anomaly and La Nina years having the opposite. With El Nino dominating during 2023, the global total is 2.82 mm day−1, just higher than (+0.01 mm day−1) the long-term mean (2.81 mm day−1). For the ocean, the mean for 2023 is 3.13 mm day−1 (a +0.05 anomaly) and the land mean is 2.10 mm day−1 (a −0.08 anomaly). This land–ocean offset is also characteristic of El Nino conditions.
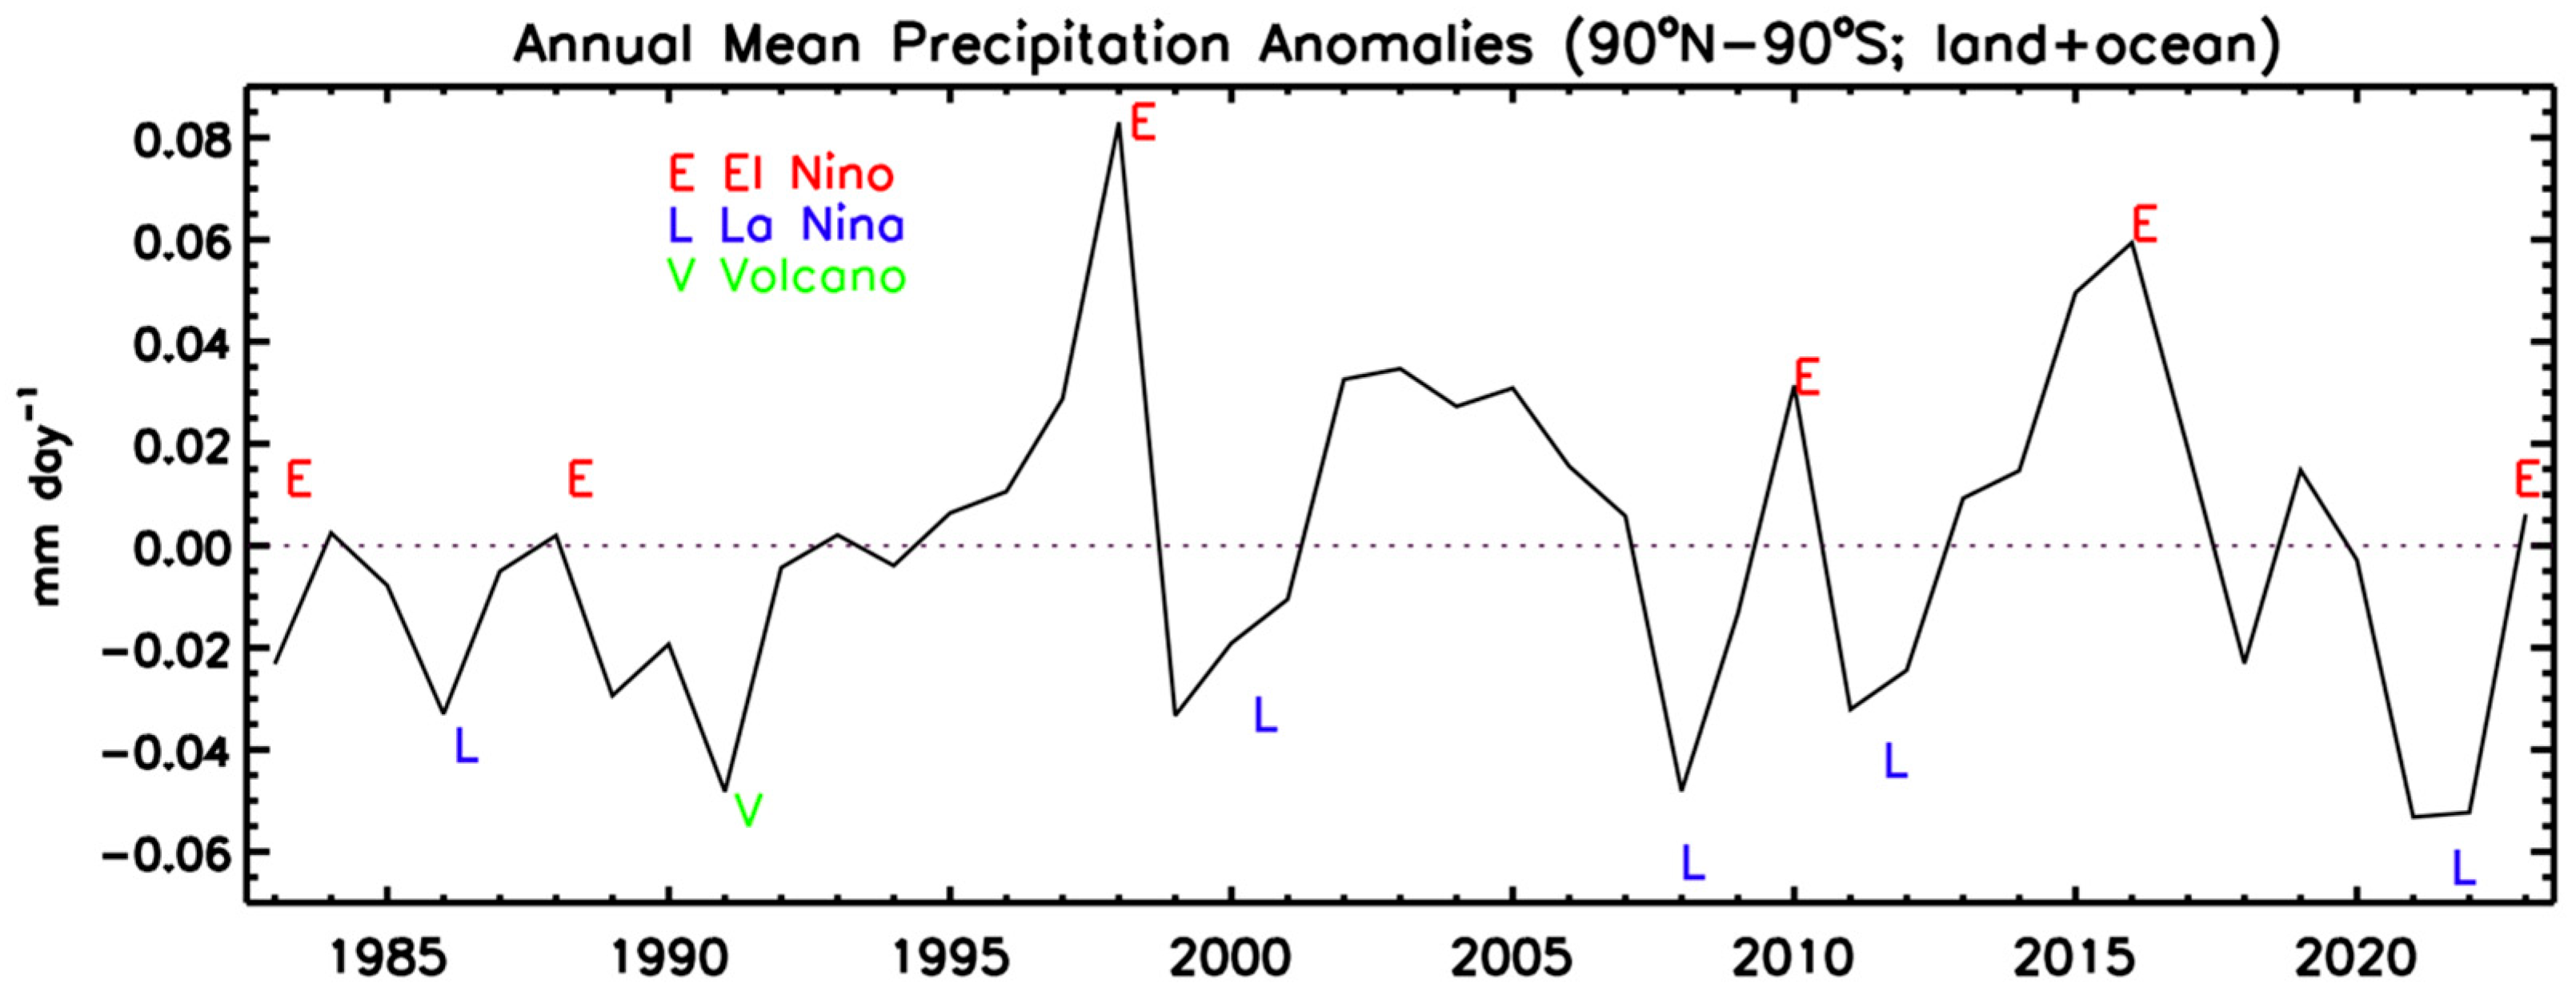
Figure 7 is a plot of annual global total precipitation anomalies from 1983 to 2023. The variations have about a 3% range around the mean of 2.81 mm day−1 and there is a slight upward trend (not statistically significant) as previously mentioned, which may be more of an effect of a shift in the Pacific Decadal Oscillation (PDO) around 1998 [11]. The peaks and valleys in the curve are closely associated with ENSO, with letters designating years or times with either El Nino or La Nina conditions. The minimum for 1991, the record low for this span of time, is related not to a La Nina, but to the effect of the Pinatubo volcano negatively affecting solar radiance at the surface and causing lower than normal surface temperatures and ocean evaporation and atmospheric convection [10].
3.5. Large-Scale Intensity Changes
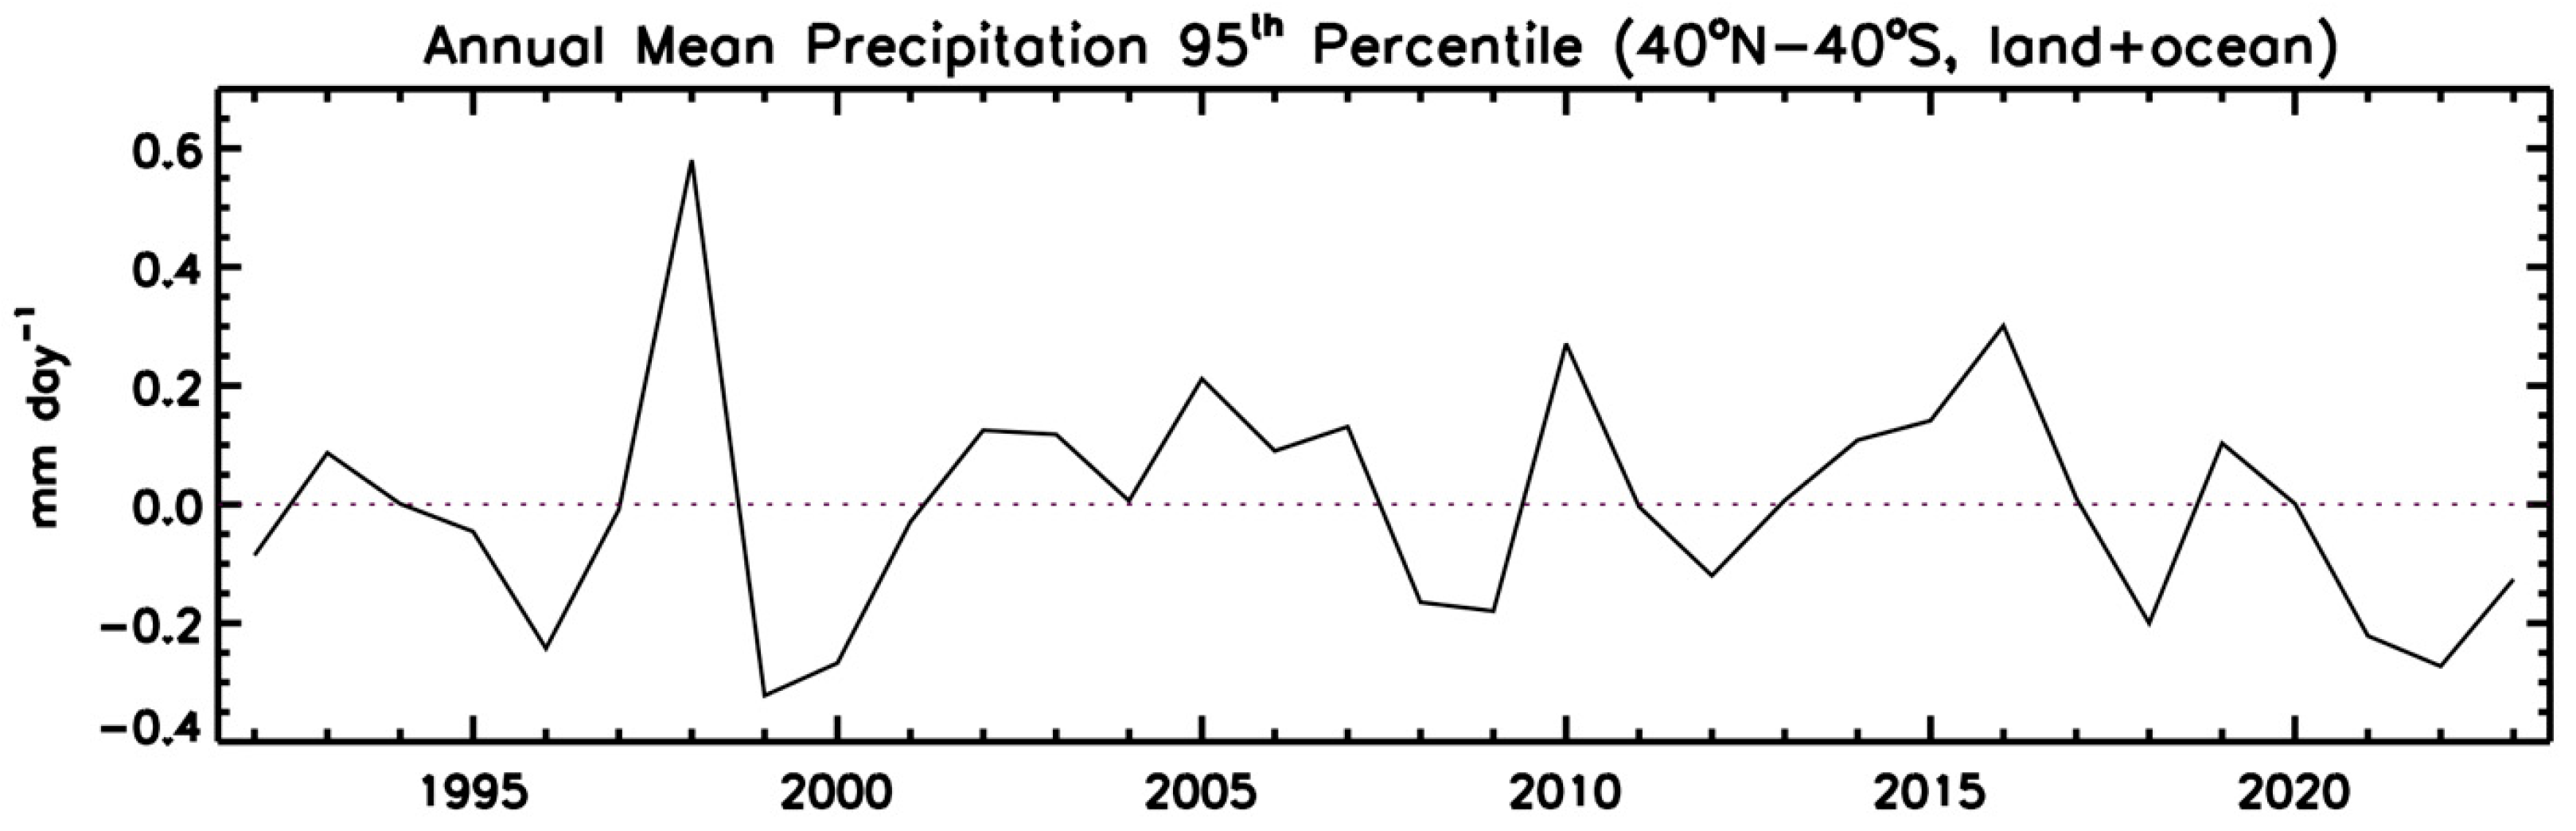
Examining the distribution of monthly precipitation as a function of intensity (mean monthly precipitation at a grid) tracks the changes of intensity (at the monthly scale) over time [13,14,15]. Figure 8 shows an annual plot of the 95th percentile precipitation rates (anomalies) for each year for the 1992–2023 period (when microwave observations are part of the GPCP analyses) for the 40° N–40° S zone (land and ocean combined). The 95th percentile is chosen as representative of intense precipitation (at the monthly time-scale) because it is high enough to capture the variations, but not too high to be possibly affected by data issues. The key observation to be taken from the figure is the significant amplitude of the inter-annual variations related mostly to ENSO again, with El Ninos having peaks in the intense rainfall and La Ninas often having minima. Near the end of the plot, one can see the 95th percentile at relatively low values for the years 2020–2022 during the multi-year La Nina, before an uptick in intense rain in 2023, as ENSO transitioned to El Nino.
3.6. Variations in Two Latitude Bands
Examination of the observed trend maps in Figure 5 and Figure 6 indicates the ITCZ zone (0–10° N) is dominated by upward trends, over both land and ocean regions. In examining the 2023 results, a key finding was the record-setting mean annual value for the 0–10° N zone (land plus ocean) as seen in Figure 9. In addition, the latitude band 30–40° N (land plus ocean) shows a relatively low mean value, indicating a very strong gradient in mean rainfall between these two latitude bands. The first zone is along the ITCZ in the deep tropics and the second in the dry northern hemisphere subtropics. Looking at the entire record (1983–2023) for these zones indicates a definite wet-getting-wetter and dry-getting-drier type of climate trend at a large scale as the mean values in these two bands are different by about a factor of two, with the larger value at the lower latitude. The year 2023 obviously contributes to this trend, and indeed sets the record by a significant amount for the ITCZ latitude zone, likely an effect of the added contribution of the ongoing El Nino. Indeed, the effect of ENSO is noticeable, with maxima associated with the El Nino years (e.g., 1998, 2015, 2023) and relative minima with La Nina periods (e.g., 1998–2000, 2020–2022) in the figure. The subtropical band shows a negative trend over the period shown, with 2022 and 2023 showing the lowest values in recent years, giving a record value of the gradient between the two bands as seen in the figure.
4. Summary and Conclusions
Global total precipitation and its distribution across the globe is a function of processes across a wide range of time and space scales, including those at inter-annual, inter-decadal and trend scales. The 2023 year reflects the effects of all these scales. The mean global surface temperature set a record in 2023 as global warming continued, with an added warming effect related to the El Nino that started in the first half of the year increasing ocean temperatures in the tropical mid-Pacific Ocean. After a three-year La Nina from 2020 through all of 2022 and into the beginning of 2023, a rapid switch to El Nino SST conditions occurred in the first months of 2023 and continued to intensify until the end of the year. The precipitation anomaly pattern in the tropics and beyond followed that change, being well correlated with composite La Nina maps from previous years through 2022 and early 2023, and then rapidly switching to typical El Nino patterns later in 2023. The overall 2023 anomaly pattern reinforced the long-term trend pattern, with the two fields having a positive correlation.
Global mean precipitation is shown to have variations related to ENSO, and perhaps PDO and global warming, with 2023 showing an increase from the previous La Nina years. Large-scale rainfall intensity also shows shifts over the last decades and short-term variations related to ENSO. And in a clear positive trend with a record peak in 2023, the mean rain in the ITCZ latitude band (0–10° N) is indicative of the wet-getting-wetter, dry-getting-drier phenomenon when paired with a subtropic band. These results emphasize the importance of analyzing global precipitation over the last 40 years using the GPCP analyses, and especially the value of near-real-time climate monitoring to gain better understanding of how recent individual years are related to longer time-scale climate changes.
Author Contributions
Conceptualization, R.F.A.; methodology, R.F.A. and G.G.; formal analysis, R.F.A. and G.G.; writing and editing, R.F.A. and G.G. All authors have read and agreed to the published version of the manuscript.
Funding
The development of the V3 GPCP Monthly analysis method was supported by the NASA MEaSUREs program, grant NNH17ZDA001N-MEASURES, while the development and implementation of the GPCP Interim Climate Data Record (ICDR) analysis necessary for real-time climate monitoring was supported by NOAA’s National Centers for Environmental Information (NCEI) Climate Data Record (CDR) program through a Riverside Technology, Inc. Subcontract; Contract No: ST1330-17-CQ-0058, Task Order No: 1332KP19FNEEN0003.
Institutional Review Board Statement
Not applicable.
Informed Consent Statement
Not applicable.
Data Availability Statement
The monthly GPCP V3.2 product used in this study can be accessed at https://disc.gsfc.nasa.gov/datasets/GPCPMON_3.2/summary?keywords=GPCPMON_3.2 (accessed on 13 March 2024).
Acknowledgments
The authors acknowledge many useful conversations with colleagues during 2023 about the evolution of the global precipitation patterns described herein.
Conflicts of Interest
The authors declare that they have no conflicts of interest.
References
- Allan, R.P.; Barlow, M.; Byrne, M.P.; Cherchi, A.; Douville, H.; Fowler, H.J.; Gan, T.Y.; Pendergrass, A.G.; Rosenfeld, D.; Swann, A.; et al. Advances in understanding large-scale responses of the water cycle to climate change. Ann. N. Y. Acad. Sci. 2020, 1472, 49–75. [Google Scholar] [CrossRef] [PubMed]
- Hegerl, G.C.; Bronnimann, S.; Cowan, T.; Friedman, A.; Hawkins, E.; Iles, C.; Muller, M.; Schurer, A.; Undorf, S. Causes of climate change over the historical record. Environ. Res. Lett. 2019, 14, 123006. [Google Scholar] [CrossRef]
- Huffman, G.J.; Adler, R.F.; Behrangi, A.; Bolvin, D.; Nelkin, E.; Gu, G.; Ehsani, M. The New Version 3.2 Global Precipitation Climatology Project (GPCP) Monthly and Daily Precipitation Products. J. Clim. 2023, 36, 7635–7655. [Google Scholar] [CrossRef]
- Adler, R.F.; Huffman, G.J.; Chang, A.; Ferraro, R.; Xie, P.; Janowiak, J.; Rudolf, B.; Schneider, U.; Curtis, S.; Bolvin, D.; et al. The version 2 Global Precipitation Climatology Project (GPCP) monthly precipitation analysis (1979–present). J. Hydrometeor. 2003, 4, 1147–1167. [Google Scholar] [CrossRef]
- Adler, R.F.; Sapiano, M.; Huffman, G.J.; Wang, J.; Gu, G.; Bolvin, D.; Chiu, L.; Schneider, U.; Becker, A.; Nelkin, E.; et al. The Global Precipitation Climatology Project (GPCP) Monthly Analysis (New Version 2.3) and a Review of 2017 Global Precipitation. Atmosphere 2018, 9, 138. [Google Scholar] [CrossRef] [PubMed]
- Huffman, G.J.; Adler, R.F.; Bolvin, D.; Gu, G. Improvements in the GPCP global precipitation record: GPCP Version 2.1. Geophys. Res. Lett. 2009, 36, L17808. [Google Scholar] [CrossRef]
- Lau, K.-M.; Kim, K.-M. Robust Hadley circulation changes and increasing global dryness due to CO2 warming from CMIP5 model projections. Proc. Natl. Acad. Sci. USA 2015, 112, 3630–3635. [Google Scholar] [CrossRef] [PubMed]
- Liu, C.; Liao, X.; Qiu, J.; Yang, Y.; Feng, X.; Allan, R.P.; Cao, N.; Long, J.; Xu, J. Observed variability of intertropical convergence zone over 1998–2018. Environ. Res. Lett. 2020, 15, 104011. [Google Scholar] [CrossRef]
- Wodzicki, K.R.; Rapp, A.D. More intense, organized deep convection with shrinking tropical ascent regions. Geophys. Res. Lett. 2022, 49, e2022GL098615. [Google Scholar] [CrossRef]
- Adler, R.F.; Gu, G.; Sapiano, M.; Wang, J.; Huffman, G.J. Global Precipitation: Means, Variations and Trends During the Satellite Era (1979–2014). Surv. Geophys. 2017, 38, 679–699. [Google Scholar] [CrossRef]
- Gu, G.; Adler, R.F. Observed Variability and Trends in Global Precipitation During 1979–2020. Clim. Dyn. 2023, 61, 131–150. [Google Scholar] [CrossRef]
- Eyring, V.; Bony, S.; Meehl, G.A.; Senior, C.A.; Stevens, B.; Stouffer, R.J.; Taylor, K.E. Overview of the Coupled Model Intercomparison Project Phase 6 (CMIP6) experimental design and organization. Geosci. Model. Dev. 2016, 9, 1937–1958. [Google Scholar] [CrossRef]
- Liu, C.; Allan, R.P. Observed and simulated precipitation responses in wet and dry regions 1850–2100. Environ. Res. Lett. 2013, 8, 34002. [Google Scholar] [CrossRef]
- Gu, G.; Adler, R.F. Precipitation Intensity Changes in the Tropics from Observations and Models. J. Clim. 2018, 31, 4775–4790. [Google Scholar] [CrossRef]
- Schurer, A.P.; Ballinger, A.P.; Friedman, A.R.; Hergerl, G.C. Human influence strengthens the contrast between tropical wet and dry regions. Environ. Res. Lett. 2020, 15, 104026. [Google Scholar] [CrossRef]
Figure 1.
Global annual precipitation for 2023 and anomalies from 1983–2022 climatology.

Figure 2.
ENSO composites and annual anomaly fields for 2022 and 2023.

Figure 3.
Anomaly maps for each quarter of 2023.

Figure 4.
Correlations between anomaly patterns of individual months (40° N–40° S) and El Nino and La Nina composites for 2022 and 2023 (top panel); Nino 3.4 SST Index for 2022 and 2023 (bottom panel).
Figure 4.
Correlations between anomaly patterns of individual months (40° N–40° S) and El Nino and La Nina composites for 2022 and 2023 (top panel); Nino 3.4 SST Index for 2022 and 2023 (bottom panel).

Figure 5.
Map of precipitation trend 1983–2022 (top panel) and 2023 anomaly map.

Figure 6.
Annual precipitation trend from GPCP V3.2, AMI6, and CMIP6 historical simulations.

Figure 7.
Global total precipitation anomaly from 1983 to 2023. The climatological global mean is estimated to be 2.81 mm day−1.
Figure 7.
Global total precipitation anomaly from 1983 to 2023. The climatological global mean is estimated to be 2.81 mm day−1.

Figure 8.
Large-scale precipitation intensity variation represented by the 95th percentile (40° N–40° S) during 1992–2023.
Figure 8.
Large-scale precipitation intensity variation represented by the 95th percentile (40° N–40° S) during 1992–2023.

Figure 9.
Annual mean rainfall anomalies in two latitude bands: 0–10° N and 30–40° N (land and ocean) and the difference between them (bottom panel).
Figure 9.
Annual mean rainfall anomalies in two latitude bands: 0–10° N and 30–40° N (land and ocean) and the difference between them (bottom panel).

Disclaimer/Publisher’s Note: The statements, opinions and data contained in all publications are solely those of the individual author(s) and contributor(s) and not of MDPI and/or the editor(s). MDPI and/or the editor(s) disclaim responsibility for any injury to people or property resulting from any ideas, methods, instructions or products referred to in the content. |
© 2024 by the authors. Licensee MDPI, Basel, Switzerland. This article is an open access article distributed under the terms and conditions of the Creative Commons Attribution (CC BY) license (https://creativecommons.org/licenses/by/4.0/).
Share and Cite
MDPI and ACS Style
Adler, R.F.; Gu, G. Global Precipitation for the Year 2023 and How It Relates to Longer Term Variations and Trends. Atmosphere 2024, 15, 535. https://doi.org/10.3390/atmos15050535
AMA Style
Adler RF, Gu G. Global Precipitation for the Year 2023 and How It Relates to Longer Term Variations and Trends. Atmosphere. 2024; 15(5):535. https://doi.org/10.3390/atmos15050535
Chicago/Turabian StyleAdler, Robert F., and Guojun Gu. 2024. "Global Precipitation for the Year 2023 and How It Relates to Longer Term Variations and Trends" Atmosphere 15, no. 5: 535. https://doi.org/10.3390/atmos15050535
Note that from the first issue of 2016, this journal uses article numbers instead of page numbers. See further details here.