Article

Linking Nutrient Dynamics with Urbanization Degree and Flood Control Reservoirs on the Bahlui River

by
Nicolae Marcoie
1,
Șerban Chihaia
1,
Tomi Alexăndrel Hrăniciuc
1,*,
Cătălin Dumitrel Balan
2,
Elena Niculina Drăgoi
2 and
Mircea-Teodor Nechita
2,*
1
Faculty of Hydrotechnics, Geodesy and Environmental Engineering, “Gheorghe Asachi” Technical University of Iasi, Bd. Prof. Dimitrie Mangeron, No. 65, 700050 Iaşi, Romania
2
Faculty of Chemical Engineering and Environmental Protection “Cristofor Simionescu”, “Gheorghe Asachi” Technical University of Iasi, Bd. Prof. Dimitrie Mangeron, No. 73, 700050 Iaşi, Romania
*
Authors to whom correspondence should be addressed.
Water 2024, 16(10), 1322; https://doi.org/10.3390/w16101322
Submission received: 22 March 2024 / Revised: 3 May 2024 / Accepted: 3 May 2024 / Published: 7 May 2024
(This article belongs to the Section Urban Water Management)

Abstract

:
This work analyzed the nutrient dynamics (2011–2022) and discharge (2005–2022) for the Bahlui River at four distinctive locations: Parcovaci—a dam-protected area that has been untouched by agriculture or urbanization; Belcesti—a primarily agricultural area, also dam-protected; Podu Iloaiei—a region influenced by agriculture and urbanization; and Holboca—placed after a heavily urbanized area. The analysis focused on determining a series of statistical indicators using the Minitab 21.2 software. Two drought intervals and one flood interval were analyzed to highlight daily discharge evolution during the selected period, showing that the constructed reservoirs successfully control the streamflow. For the entire period, the evolution of mean and median values of the streamflow is consistent, considering the locations’ positions from the source to the river’s end. The total nitrogen and total phosphorus were selected as representative quality indicators. The study follows the influence of the analyzed areas’ characteristics and reservoirs’ presence on nutrient dynamics. The results showed that the most influential factor that impacts nutrient dynamics is the reservoirs’ presence, which controls the discharge, creates wetlands and swamps, and implicitly impacts nutrient concentration.

1. Introduction

Rivers’ eutrophication is not a new problem [1], and it is an expected natural phenomenon in climates with prolonged dry seasons [2]. It is caused by an uncontrolled increase in nutrient concentration (e.g., nitrogen and phosphorus) followed by excessive growth of various aquatic plants that leads to water poisoning, death of aquatic animals, and sometimes irreversible damage to aqueous ecosystems. In regions without natural dry seasons, “nutritional pollution” can result from climate changes and human activities like urbanization, intensive agriculture, and industrial growth, all of which are interconnected and contribute to climate change [3]. It is generally recognized that extensive urbanization affects river courses [4]; industrial expansion is the cradle for countless pollutants, while intensive agriculture is the primary source of inorganic nutrients like nitrogen and phosphorus. Climate change causes intense events that generate heavy rainfalls and floods followed by severe and prolonged droughts. The former washes the lands and transports the nutrients to rivers and water reservoirs. At the same time, the latter ensures the concentrations increase due to water evaporation and the temperatures required for the occurrence of unnatural eutrophication. Unfortunately, this global phenomenon affects the rivers and coastal regions on all continents [5,6,7]. There are numerous reports in the literature regarding the spatiotemporal evolution of nutrients in various rivers across the globe—see Table S1 and Figure S1 in Supplementary Materials.
A bibliometric study performed using the Scopus platform and the VOSviewer software, version 1.6.19, yielded 1210 results for “climate change and eutrophication and nutrients or nitrogen or phosphorus” search terms in title/abstract/keywords, starting from 2000 till the present day. The four significant clusters identified by VOSviewer were eutrophication, nitrogen, water quality, and nutrients, as shown in Figure 1.
Based on previous experiences, predictions can be made to prevent unwanted phenomena through various actions: reducing the amount of fertilizers during the rainy season and using reservoirs and dams for sustainable river-flow management during drought periods.
Unfortunately, for various reasons, e.g., political—some countries keep the data private; economic—some countries cannot afford such studies, some regions are not yet integrated into the global perspective [8]. In some countries, there are records for hundreds of years regarding river floods, discharge variation, and drought periods [9], while in others, such types of analysis and data records are incipient. Nevertheless, the importance of such studies on a global scale is generally acknowledged nowadays, and the impact of climate change on nutrient dynamics reflected in water quality in rivers is undeniable [8].
This paper contributes to the knowledge in the particular field of river nutrient monitoring with information regarding the long-term (2011–2022) evolution of nitrogen and phosphorus in Bahlui River, Iasi County, Romania. The nutrient dynamics were linked with urbanization degree and flood control reservoirs based on the data recorded at four specific locations: (i) Parcovaci—as a pristine location—close to the river’s spring, in a forest region, where the first dam on the river course was built; (ii) Belcesti—as a rural location—where the main activity is agriculture/farming, the place of the second reservoir (Tansa); (iii) Podu Iloaiei—a small town with mixed industrial/farming activities; and (iv) Holboca—located close to the river mouth, after Iasi, the third largest city in Romania. The primary hypothesis is that a correlation between the analyzed aspects is present and can be the basis for predicting river discharge and nutrient variation in a specific context.
To the authors’ knowledge, such a comprehensive report with such a manner of data interpretation on the Bahlui River has never been published. However, some reports regarding nutrients’ evolution/concentrations have been presented in local or low-circulation magazines [10,11,12,13]. These reports only present daily analysis and/or short periods of nutrient/pollutant evolution and are usually focused on specific areas, such as the Iasi municipal area [14,15]. The flow discharge data span a longer period (2005–2022) than the nutrient monitoring (2011–2022), having been systematically conducted at the sites studied since 2011.

2. Materials and Methods

2.1. Research Area and Sampling Locations

The length of the hydrographical network of the Bahlui River is more than 3.100 km, of which only 119 km are included in the main river from spring to mouth [16]. The surface of the Bahlui River catchment covers 2025 km2 and is the most important tributary of the Jijia River [17]. The river basin has a hilly terrain with large successive valleys and terraces. The valleys are deep and narrow, flanked by high hills with a slope of around 10%. The river basin has an average altitude of approximately 155 m. The mean slope of the river system varies, being 3‰ in the most upstream part, 1.6‰ in the middle part, and 0.5‰ in the downstream part. Precipitation runoff is the main water source for the river, accounting for 85–95% of the inflow [18]. The Bahlui River basin is located in an area with an annual precipitation of approximately 500 mm. Several factors contribute to the high complexity of the main river, its tributaries, and reservoirs. (i) Intense soil erosion during flood waves and moderate soil erosion in agricultural areas, leading to high levels of suspended solids. (ii) Sedimentation, gradually altering riverbeds and reservoirs, reducing water storage capacity and flood protection. High precipitation in the Bahlui River basin causes significant soil erosion [19], occasionally resulting in landslides [20].
The Bahlui River is a rain-fed river system with many ungauged and temporary tributaries for which no data were available [13,21]. The average discharge ranges between 2.8 m3/s [10,14] and 4 m3/s [19,22]. Only approximately 30% of the length of the network has permanent flow [22]. The length and surface area of the main tributaries of the Bahlui River are presented in Table 1 [16,22].
Four sampling sites were selected from the Bahlui River catchment, as shown in Figure 2: Pârcovaci, Belcești, Podu Iloaiei, and Holboca. Each site has specific particularities: (i) Pârcovaci is placed relatively close to Bahlui’s spring, in a forest area, and is actually the first village crossed by the river—there is no significant influence of agriculture or urbanization on this site; the first important dam on the Bahlui River is placed in Pârcovaci; (ii) Belcești is a commune, in an agricultural region; in the vicinity of Belcești, the important Tansa-Belcești dam was built on the Bahlui River in order to prevent flooding; (iii) Podu Iloaiei is a small town with less than 10,000 inhabitants; a dam lake performing as a water reservoir is located on the Bahlueț River from the Bahlui River basin; and (iv) prior to reaching the commune of Holboca that is a part of the Iaşi metropolitan area, the Bahlui River crosses Iasi city, the third largest city in Romania by number of inhabitants. To summarize, the data come from four sites, representing (i) a region with no influence from agriculture or urbanization that is dam protected; (ii) a predominantly agricultural region that is dam protected; (iii) a mixed region influenced by both agriculture and urbanization; and (iv) a highly urbanized region. The GPS coordinates where the measurements were performed are 47°27′03.7″ N, 26°49′08.2″ E—Parcovaci, 47°18′04.7″ N, 27°06′02.0″ E—Belcesti, 47°12′33.4″ N, 27°17′41.5″ E—Podu Iloaiei, 47°07′46.2″ N, 27°44′12.0″ E—Holboca. The Google Earth images for the selected sites are presented in Figures S3, S5, S7, and S9, while the corresponding Corine land cover images are displayed in Figures S4, S6, S8, and S10.

2.2. Historical Milestones: Flood and Drought Periods

Iasi, the historic city that served as the capital of Moldavia and later Romania, has a complex history with the Bahlui River, which cuts through the middle of the city. The evolution of the river’s color and smell through the seasons was the subject of many local debates. A long series of floods were recorded during the 19th century. Between 1950 and 2006, 62 floods were reported for the Bahlui River basin [23], of which 15 were with flows between 50 and 90 m3/s [24]. However, there are 4 floods with impressive flows (Table 2) that left a mark in Iasi history [24], the most representative being the one registered in 1932 (Figure S2, Supplementary Materials) [25].
Since the Bahlui’s discharge is rain-dependent, two distinct periods affect the flow: (i) the winter, when water is stored as snow and ice; and (ii) the drought periods. During the second half of the 19th century, minimum discharges were lower than 0.001 m3/s (Table 3), and even water depletion was reported [26].

2.3. Hydrotechnical Infrastructure

Nowadays, approximately 70% of the Bahlui basin is hydrotechnically managed [26]. No less than 17 reservoirs with different functions, such as flood protection, irrigation, water supply, and fishery, have been built in the river’s basin (Table 3) [21,22].
The critical roles of hydrotechnical structures and engineering infrastructure are to act as protection instruments, reduce hydrological vulnerability, and contribute to a sense of security [27]. In addition to that, a series of socioeconomic aspects are directly influenced by the presence of hydrotechnical structures such as the formation of characteristic ecosystems (lakes, wetlands, and swamps), diversification of land use given by the water supply, irrigation facilities, fish farming, watersports, and tourism. There are also several drawbacks related to forest loss, sediment and nutrient gathering, and landscape modification, but the mentioned benefits compensate to some extent [28]. The impact of these storage lakes on river discharge, water quality, and nutrient dynamics is fundamental. However, while floods can be prevented and, to some extent, controlled, the prolonged drought periods are difficult to manage for a rainfall-dependent river, particularly for a region where agriculture and farming are the main economic activities.

2.4. Statistical Analysis

In order to analyze the available data supplied by the Administratia Nationala Apele Romane (National Administration Romanian Waters, https://rowater.ro (accessed on 5 February 2024)), a set of preprocessing steps was applied. First, the data were verified to ensure their validity; no digitized data were used during the preparation of this manuscript. After that, the data were centralized and analyzed using the Minitab® 21.2 (64-bit) statistical software.

3. Results and Discussion

3.1. Bahlui River Discharge Monitoring during 2005–2022 Period

There are huge oscillations between the hydro-climatic extremes (droughts and floods) typically reflected by minimum and maximum discharge values. Maximum flows generate concerns about engineering flood risks, water systems infrastructure, and flood response strategies. In contrast, minimum flows generate concerns for agriculture–irrigation engineering, ecosystems, and natural resources management [29].
The classic statistical streamflow indicators for the selected locations on the Bahlui River during the 2005–2022 period are presented in Table 4. The daily discharges from 2005 to 2022 for selected locations are presented in Figure 3. Two insets associated with drought periods (2006–2007, Figure 4; and 2011–2013, Figure 5) are marked in Figure 4 and selected for further discussion in Section 3.1.1. A period of heavy rainfalls (May–August 2010, not marked in Figure 3) is also selected to be individually discussed in Section 3.1.2.
Q1 is also known as the lower quartile and shows that 25% of the data fall below this threshold. The second quartile (Q2, or median) shows that 50% of the data are below it. The third quartile (Q3, or upper quartile) shows that 75% of the data are below this value. Thus, the quartiles divide the data into four equal portions. The distance between Q1 and Q3 denotes the interquartile range and reflects the variability. It shows the distribution of the middle 50% of the data.
In Table 4, the highest variability is obtained for Holboca’s discharge. This can be explained by the fact that the measurements for this location are taken after the wastewater treatment plant, and it incorporates the runoff gathered from the entire area of Iasi city. Also, in case of heavy floods, this location registered high values, as shown by the peaks in Figure 2, which reach (or go over) 50 m3/s.
The evolution of the mean and median values of the streamflow is consistent, considering the locations’ positions from the source to the river’s end (Figure 2). The considerably higher values computed for Holboca could be related to the tributaries feeding the river after Podu Iloaiei (Figure 2). When it comes to minimum and maximum values, some inconsistencies can be noted, such as that the minimum from Belcesti is 6-fold lower than the minimum in Parcovaci or the maximum in Parcovaci is 1.6 times higher than Belcesti and Podu Iloaiei. These inconsistencies are related to the Parcovaci and Tansa (Belcesti) dams on the main river course. The Tansa is a multi-purpose reservoir, being used as protection against floods, as a drinking water supply for the Belceşti village, the biggest commune in Iasi county, with more than 10,000 inhabitants [30], as an irrigation source, and for aquaculture [31]. Therefore, the Bahlui’s level is extremely low during drought periods, sometimes close to complete depletion [32], particularly after the Belcesti reservoir. Since the mean and the median are significantly closer to the minimum than the maximum values, it can be concluded that drought periods are predominant compared to flooding intervals (see Table 2).

3.1.1. Drought Periods Examination

During the first drought interval (Figure 4), the discharge in Parcovaci and Belcesti is controlled by the Parcovaci and Tansa (Belcesti) reservoirs. The values are remarkably constant throughout the drought period, even during the few rainy days. The oscillations registered for Podu Iloaiei and Holboca are related to the increased number of permanent and temporary tributaries after Belcesti and the rare rainfalls.
The Parcovaci and Tansa dams considerably impacted the drought period 2011–2013 by maintaining a constant flow rate. Table 5 displays the streamflow statistical indicators for the chosen places on the Bahlui River during the drought years of 2006–2007 and 2011–2013. As observed, although the entire period analyzed is considered as drought, the most severe drought manifestation was in 2007, where, for all sites except Holboca, the lowest mean values and variations in Q1–Q3 are obtained. The somewhat peculiar data obtained for Holboca are related to the location of the measuring site. It is placed after Iasi and its wastewater treatment plant, that discharges into the Bahlui River, sometimes has a higher flow rate than the river itself [33].
During the first drought period, the annual evolution of mean and median values of the streamflow is consistent, considering the locations’ positions from the source to the river’s end (Table 5, 2006; 2007). The evolution of the median and maximum values is inconsistent with the locations’ positions, highlighting the influence of the Parcovaci and Tansa (Belcesti) reservoirs. The mean and maximum values analysis during the 2011–2013 drought shows that 2012 was the driest year of the period. The second drought period (Figure 5) was also analyzed by other authors, who highlighted that 2012 was a dry year from the hydrological point of view [34].

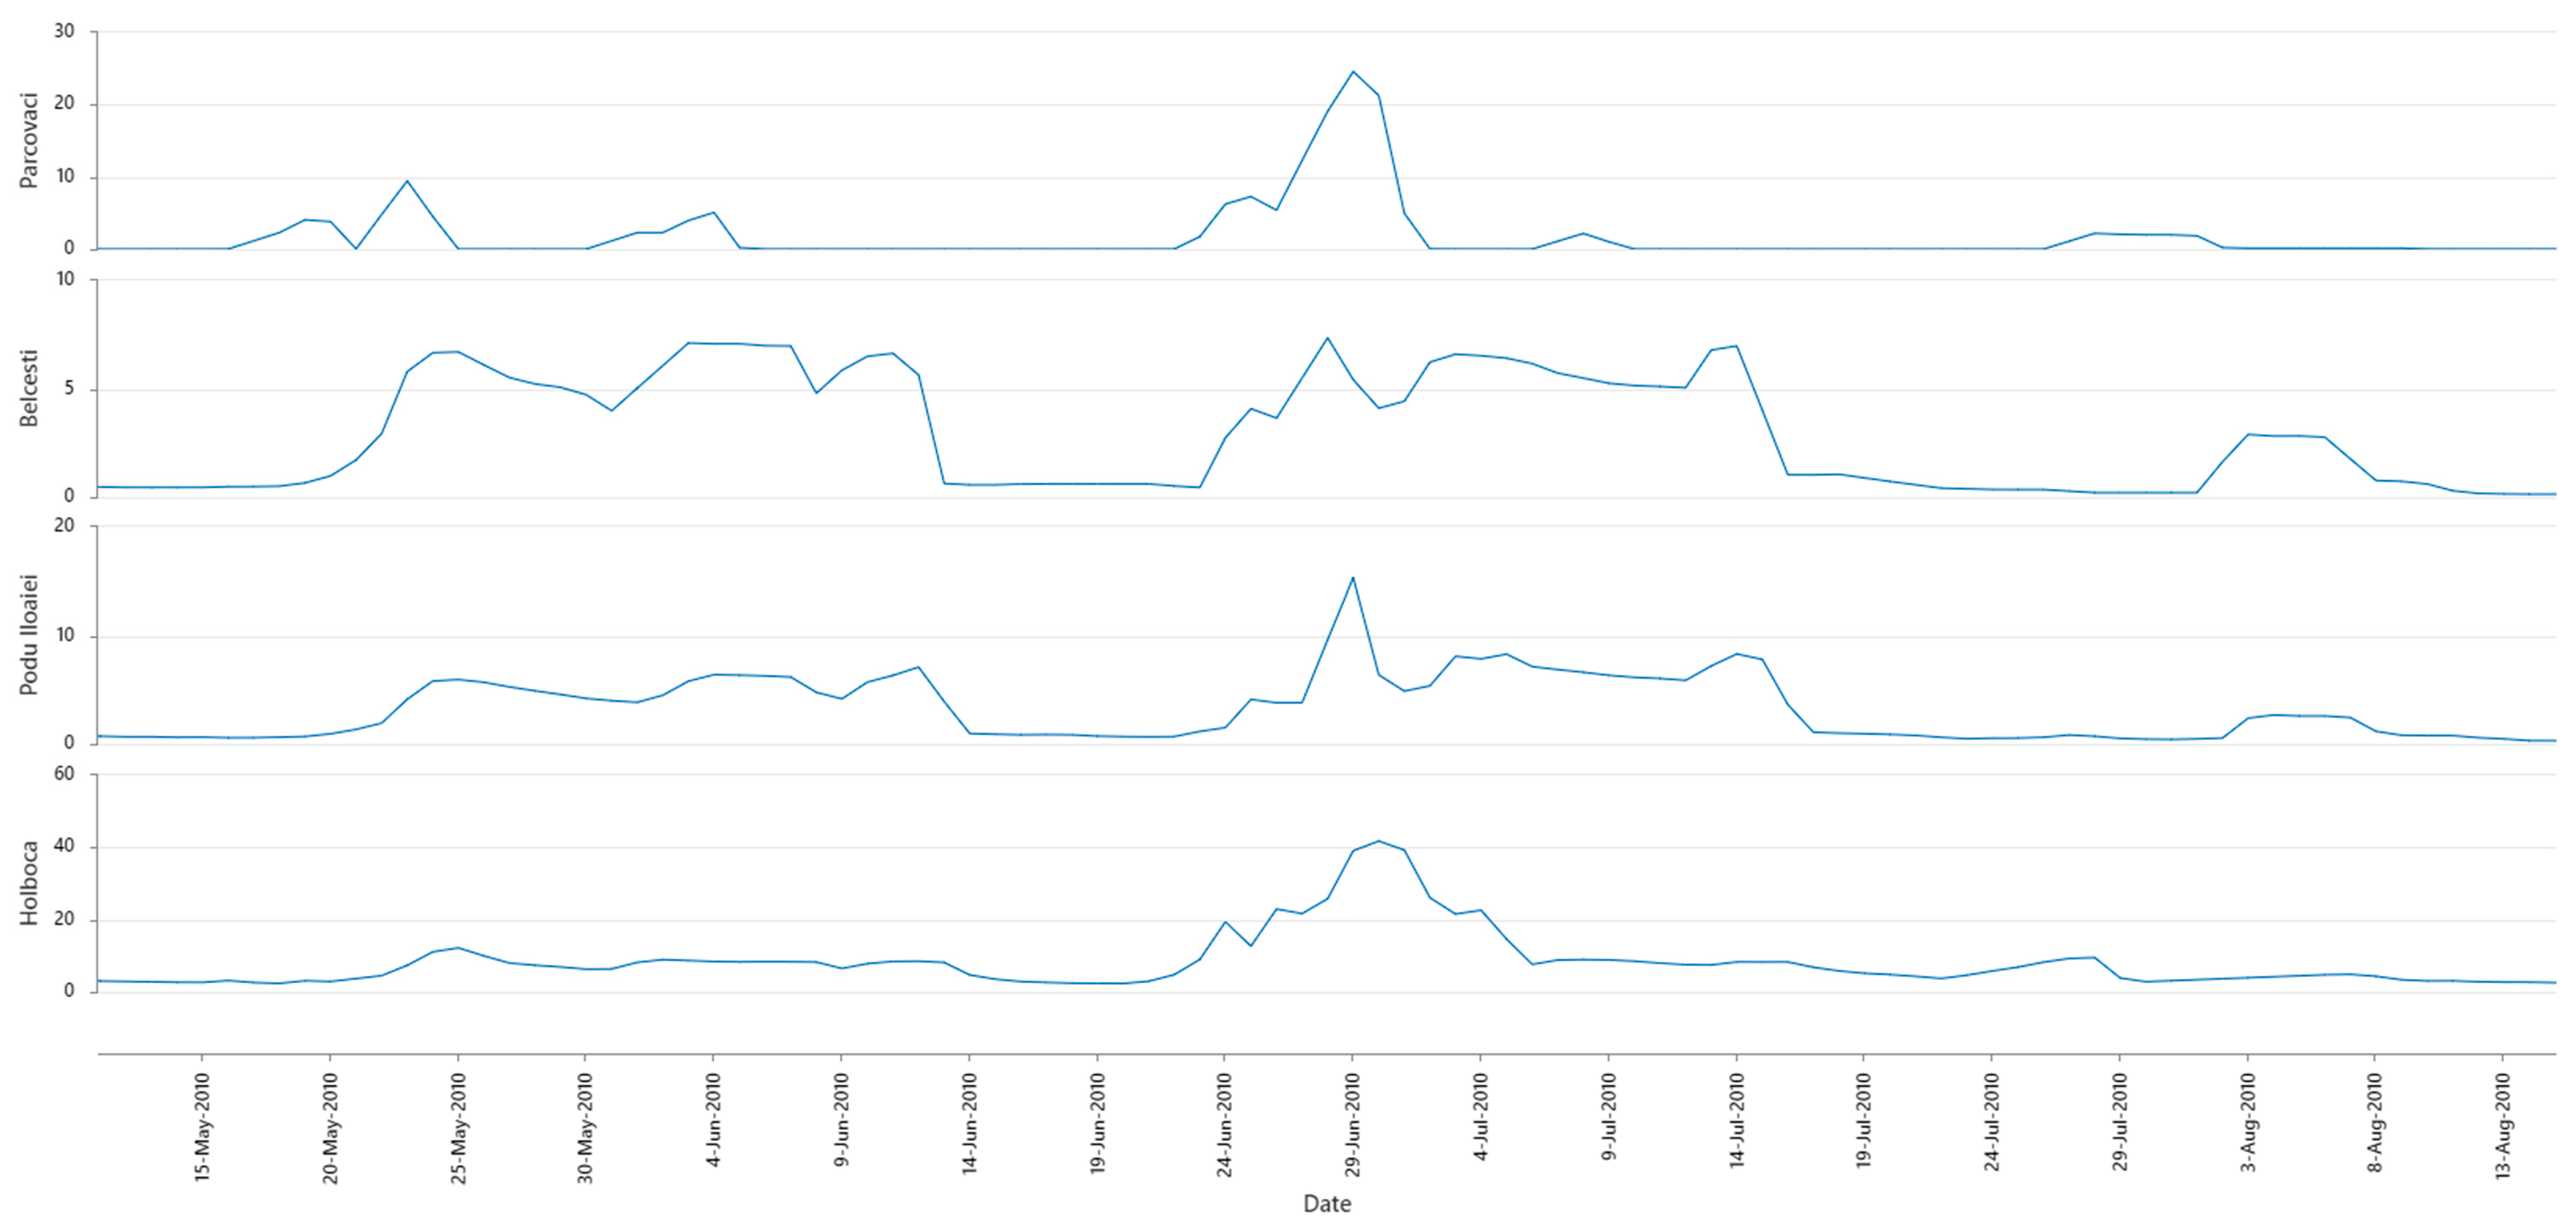
3.1.2. Flood Episode Examination

From a hydrological point of view, the year 2010 is remembered as a year of devastating floods across Central and Eastern Europe, including Romania, Czech Republic, Slovakia, Bosnia-Herzegovina, Hungary, Croatia, southern Poland, and southern and eastern Germany [35,36]. Romanescu and Stoleriu analyzed the” exceptional” floods in the Prut basin in the summer of 2010, where river discharge reached 1600 m3/s [37]. This event was caused by heavy rainfall, snowmelt, and saturated soil conditions.
The highest peaks for discharge values were registered on 28–29 July 2010 (Figure 6). These high discharges were preceded by heavy rainfalls on the 24th and 25th of July [36]. Unlike the previous flood intervals at the turn of the century, the urban area of the city of Iasi was protected by Bahlui’s waters.
The analysis of the daily discharge statistical indicators during the May–August heavy rainfall interval from 2010 (Table 6) shows that during June 2010 the streamflow achieved the highest peaks. Only the mean values are consistent with the locations’ positions on the map; the other indicators were influenced by reservoir activity.

3.2. Nutrient Dynamics on Bahlui River during 2011–2022 Period

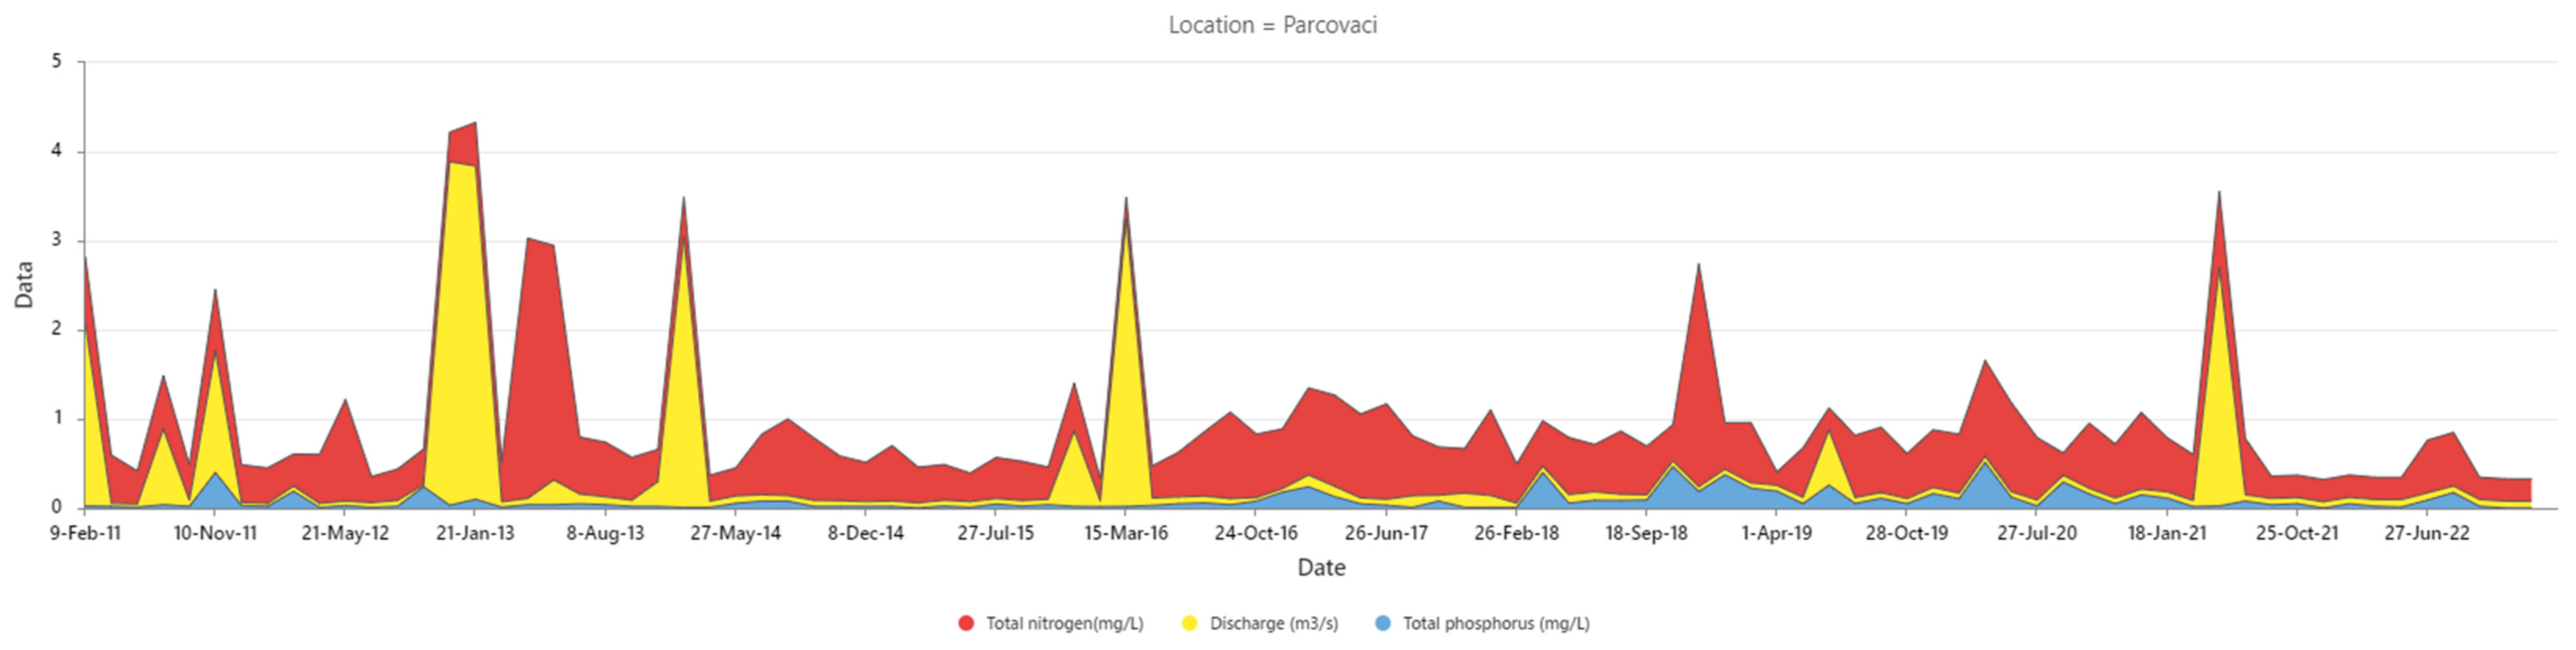
Individual Nutrient Analysis

The primary anthropogenic sources of N and P in rural areas are fertilizers from agriculture, animal manure from livestock production, and septic systems such as household wastewater [38]. Both N and P can be produced via natural soil processes through mineralization, weathering, and/or dissolution [39]. However, in some urban areas it was found that household activities such as lawn fertilization and pet ownership contribute more to nutrient watersheds than commercial, municipal, or industrial actions [40]. Urban runoff, including stormwater and snowmelt, drainage networks, and yard waste, is the primary carrier of pollutants in the urban environment [41].
As can be observed from Figure 7, the distribution of individual measurements indicates that the lowest values for both TN and TP are for Parcovaci. On the other hand, the largest domains are obtained for Belcesti and Holboca, where outliers are identified.
As expected, the average TN for the Parcovaci location during the analyzed period (0.6303 mg/L, Table 7) is way below the limit value of 10 mg/L [42], and the TN value is relatively constant during the entire period (Figure 8). The same behavior is observed for the TP evolution at Parcovaci (Figure 9).
The unexpected high level of TN in the Belcesti area (Figure 8) can be correlated with the uncontrolled use of nitrogen-based fertilizers necessary for agricultural and farming activities. Other authors also observed this aspect [19]. The highest level of TN (except 2018) was reported for the Holboca location during the entire period under study, and it is obviously correlated with the urban area of Iasi.
The highest variability is observed for TN in Belcesti, while the lowest is in Parcovaci. On the other hand, for TP, the highest variability is observed in Holboca and the lowest in Parcovaci. Excluding the 2022 reports where the TP average value is atypically high for Belcesti (Figure 9), there is a “normal” trend for this specific indicator: the pristine location exhibits the lowest values, the agricultural and mixed urban/agricultural locations show comparable values (except for in 2018, where the value is higher for the agricultural area), while after the major urban area, the value almost doubles. For the monitored period, the average values of TP (Table 7) are 0.0819 mg/L for Parcovaci and almost 13-fold higher for Holboca (1.0586 mg/L), yet below the NTPA 001/2002 [42] limit of 2 mg/L.

3.3. Discharge–Nutrient Correlation

It is generally recognized that discharge measurement is essential in nutrient load estimation. However, certain degrees of uncertainty should be considered, especially for small streams [43]. It was shown that even for the high frequency of data prelevation, paired data levels of uncertainties of up to 25% can occur in correlations between discharge and nutrients [43]. In order to correlate the nutrient dynamics with the Bahlui River’s discharge, the plots presented in Figure 10, Figure 11, Figure 12 and Figure 13 were drawn for the selected sites. It is relatively challenging to find rational correlations between nutrient dynamics and river discharge for the first two locations (Figure 10 and Figure 11). The presence of the two dams (Parcovaci and Tansa) on the main river course can disturb the correspondence. The dams usually trap the nutrients and sediments transported by runoff from heavy rains. The dilution phenomenon that should typically occur with the increase in the water flow is rarely present, and at some points the TN level seems unaffected by the discharge values (e.g., January 2013 vs. August 2013, Figure 10, Parcovaci; September 2018 vs. April 2019, Figure 11, Podu Iloaiei).
A correlation between the river flow rate, TN, and TP can be observed for Parcovaci between the two discharge peaks in March 2016 and June 2021 (Figure 10). As for the Belcesti site, neither TN nor TP seems to evolve in a visible connection with the river flow oscillations. The nitrogen level is relatively high in this location and exhibits peaks even at low and constant discharge, e.g., April 2019–February 2021, revealing a predisposition to eutrophication that was also reported by other authors [44]. A relatively “normal” correspondence can be seen for Podu Iloaiei in Figure 12, where the TN and TP levels typically increase with the discharge growth, with three exceptions: (i) the period June 2011–July 2013, that overlaps with the drought period (analyzed in Section 3.1.1); (ii) the period September 2018–September 2020, when another prolonged drought period was reported [45], when the TN values are high despite the low river level; and (iii) February 2018, when the TP level is atypically high. The best (visual) correlation can be observed for the last location, Holboca (Figure 13), which is close to the river’s end. There, the discharge levels are higher than in all other locations, being relatively unaltered by the dam’s presence and influenced by the wastewater treatment plant discharge.
A Pearson analysis was performed on the data to determine whether any statistically significant correlations could be obtained. After the data were placed in a scatter plot (Figure S11), the outliers were removed (maximum 5%). Next, the correlation indicators were determined (Table S1). As can be observed, for most cases p > 0.05, indicating that no significant data can support the affirmation that a correlation between parameters exists. The exceptions are for (i) Parcovaci, in the case of TP vs. TN, where a correlation of 0.35 (which is considered moderate positive) was obtained; (ii) for Belcesti, in the case of TN vs. discharge, where a correlation of −0.29 (which is considered low negative) was obtained; and (iii) for Holboca in the cases of TN vs. discharge and TP vs. TN, where correlations of −0.342 (moderate negative) and 0.417 (moderate positive), respectively, were obtained.
In order to determine if a seasonal variation can be observed for each location, analyzed parameter, and season, the means of the values were computed and are shown in Figure 14. The seasons were identified as follows: winter—December, January, and February; spring—March, April, and May; summer—June, July, and August; autumn—September, October, and November. As observed, TN’s highest concentrations are obtained during the coldest season of the year for all analyzed locations, while the lowest are in the summer. Most probably due to the dam’s presence, no significant seasonal correlations were observed for the other analyzed parameters.

3.4. Nutrient Dynamics: Influence of Urbanization Degree and Flood Control Reservoirs on the Course of Bahlui River

It is evident that the nutrient dynamics are affected by a combination of natural and anthropogenic factors, each having relative influences that change with temporal and spatial scale. Like many other rivers, the Bahlui provides water for the inhabitants of its basin for irrigation, industrial, and drinking purposes. It also assimilates and/or carries industrial and municipal wastewater and manure discharges and runoff from agricultural fields, roadways, and streets [46]. From its spring to its mouth, the Bahlui River crosses lands with different degrees of development, including forests, small towns, villages, agricultural regions, and one major urban area. Two major flood-controlling reservoirs were built on the main river course, Parcovaci and Tansa (Belcesti), and another 15 with different functions, such as flood protection, water storage, and fishery, on the tributaries in its hydrographic basin. The existence of these reservoirs attenuates the impact of significant climate change effects such as extreme floods and prolonged drought periods but also affects many physical and ecological aspects and processes, including sediment transport and nutrient exchange [47]. The hydrological alterations produced by river-placed reservoirs are changes in flood frequency and magnitude, reduction in overall flow, increased or decreased summer baseflows, and altered timing of releases [48]. In addition, the grassy vegetation, especially common reed (Phragmites australis) and bulrush (Typha latifolia), plays an essential role in the retention of nutrients in the wetlands and swamps that usually form at the base of reservoirs or nearby, with small, temporary river tributaries [49,50].

3.4.1. Urbanization Degree

Halecki and coworkers discussed the lower nutrient retention capacity in urban areas compared to rural and suburban areas [51]. The high surface runoff, that is correlated with lower retention capacity, could explain the growth in both TN and TP in urban areas [46,51,52,53].
Holboca, the fourth location from spring to mouth considered for this study, is placed after Iasi, the third city in Romania, close to the Bahlui confluence with the Jijia River. Many authors have studied the effect of anthropogenic activities on the water quality in this part of the river [10,14,15,33,54]. As pointed out by the current report, in Holboca the nutrient levels reach the highest values of all the selected locations. Moreover, compared with the nutrient level in the first location, Parcovaci, which is a forest area with minimal human activities, there are considerable differences in magnitude. The mean value for Holboca during 2011–2022 is nearly 14-fold higher for TN and 13-fold higher for TP (Table 7). As for the rural and mixed regions, represented by the Belcesti and Podu Iloaiei locations, respectively, the nutrient level is influenced by the presence of the Tansa reservoir that controls the flow regime and by the increased number of permanent and temporary tributaries after Belcesti, which contributes to the flow development between the two locations. For most of the monitored period, except 2017, when the values were comparable, the TN values were higher in Belcesti than in Podu Iloaiei (Figure 8). As for the TP, except for the peak in 2022 in Belcesti, the values were reasonably low [42], following a similar trend (Figure 9).

3.4.2. Flood Control Reservoirs

During the past century, the Bahlui basin was highly vulnerable to floods [24] and droughts [32,55]; the inundation frequencies and the color and odor of the Bahlui waters during eutrophication periods were notorious. Nowadays, owing to massive investments in hydrotechnical structures, the vulnerability of the studied area, particularly of the selected locations, is highly diminished. Between 1960 and 1990, as many as 17 reservoirs were constructed in the Bahlui basin, as shown in Table 3. As for the selected locations, it is evident that the Parcovaci and Tansa reservoirs control the daily discharge even during drought periods, preventing river depletion (Figure 4). Hydrotechnical developments placed on the main course and/or in a river basin fundamentally impact the environment [56], producing geographical, ecological, and social changes [28], and the Bahlui River is no exception [21].
The reservoir and/or dam-induced hydrological control of the flow regime may affect the nutrient dynamics similarly (yet less aggressively) to the succession of flood and drought periods [48]. The formation of wetlands and swamps as tails of the reservoirs is also essential for nutrient dynamics. The balance in nutrient retention and release from swamps and wetlands from the river’s hydrographic basin is directly related to the water level, which can be controlled naturally (flood–drought cycles) or artificially (dam discharge). The succession of seasons also plays a vital role in supplying rivers and reservoirs with organic matter that can be further (gradually) decomposed in nutrients (e.g., leaves fallen from the forest canopy in early autumn; leaves on the ground and agricultural waste brought by spring floods) [57].
The TN and TP levels are within natural limits in the Parcovaci location, presenting small fluctuations (seasonal) through the studied interval. On the contrary, the values of nutrients, particularly TN, are relatively high for the Belcesti location, which is protected by the Tansa reservoir (Figure 8). Dughilă et al. [31] analyzed the most significant water quality indicators for the Tansa Lake, including TN and TP, in 2010. It was found that the lake level of TN was much lower than that of the Bahlui River (mainly due to the nitrate component of TN). This resulted from using nitrogen fertilizers in agriculture and wastewater discharge from commercial companies and wastewater treatment plants. The TP values in the reservoir were lower than in the river, though of a different order of magnitude compared to TN (similar to the current study; Figure 8 and Figure 9). The orthophosphate components (that are produced in sewage effluents) were considered responsible for the elevated TP values in the Bahlui River in the Belcesti location [31]. The water quality for the main reservoirs (lakes) in the Bahlui drainage basin was studied by Minea, where it was found that it is worsening, most probably due to the contribution of the tributaries that bring pollutants from uncontrolled discharges from industrial sources and malfunctioning water treatment plants [26].

4. Conclusions

The current analysis focused on a long period and aimed to cover the gaps in the reported discharge data on the Bahlui River. The results revealed that the reservoirs constructed to regulate the streamflow successfully managed the water discharge. The mean and median streamflow values followed a similar trend for the entire period, consistent with the locations from the river’s source to its endpoint. This indicates that the reservoirs effectively controlled the streamflow and mitigated the effects of drought and flood periods.
The analysis of nutrients considered the impact of reservoir presence and the features of the investigated locations on their dynamics. The results indicate that reservoirs have a significant impact because they control water discharge during floods and droughts. Also, reservoirs favor the occurrence of wetlands and swamps, important aquatic habitats, which, in turn, affect the nutrient concentration. Moreover, areas with high levels of urbanization and agricultural activities showed higher nutrient concentrations, which can be explained by the accidental release of pollutants into the water bodies.
A statistical evaluation of discharge and nutrient links in different locations revealed weak correlations only for some particular cases: TN–TP in Parcovaci, TN–discharge in Belcesti, and TN–discharge and TP–TN in Holboca. Therefore, the analyzed data cannot support the initial hypothesis that the analyzed characteristics are correlated. This suggests a highly complex interaction between many factors, and a more in-depth study with a higher frequency of data acquisition, more locations, and a higher number of parameters such as chemical and biochemical oxygen demand, water and air temperature, and precipitation level is required.

Supplementary Materials

The following supporting information can be downloaded at: https://www.mdpi.com/article/10.3390/w16101322/s1, Table S1. Literature reports on the spatiotemporal evolution of nutrients in various rivers across the globe; Table S2. Pairwise Spearman correlations; Figure S1. Scopus bibliometric analysis on eutrophication, climate change, and nutrients; Figure S2. Iasi, the flood in 1932: (a) The railway station; (b) the central area. Figures S3, S5, S7, S9. Google Earth images for the selected sites: Parcovaci, Belcesti, Podu Iloaie, Holboca. Figures S4, S6, S8, S10. Corresponding Corine land cover images for the designated locations. Figure S11. Scatter plot of all available data in all locations for (A) discharge (m3/s) versus TN (mg/L); (B) discharge (m3/s) versus TP (mg/L); (C) TP (mg/L) versus TN (mg/L). References [58,59,60,61,62,63,64,65,66,67,68,69,70,71,72,73,74,75,76,77,78,79] are cited in the supplementary materials.

Author Contributions

Conceptualization, N.M. and M.-T.N.; methodology, N.M.; software, E.N.D.; validation, T.A.H., Ș.C. and C.D.B.; formal analysis, Ș.C.; investigation, Ș.C.; resources, C.D.B.; data curation, T.A.H.; writing—original draft preparation, N.M.; writing—review and editing, M.-T.N., END; visualization, E.N.D.; supervision, N.M.; project administration, C.D.B.; funding acquisition N.M. All authors have read and agreed to the published version of the manuscript.

Funding

This research received no external funding.

Data Availability Statement

Data are available upon reasonable request.

Conflicts of Interest

The authors declare no conflicts of interest.

References

  1. O’Hare, M.T.; Baattrup-Pedersen, A.; Baumgarte, I.; Freeman, A.; Gunn, I.D.M.; Lázár, A.N.; Sinclair, R.; Wade, A.J.; Bowes, M.J. Responses of Aquatic Plants to Eutrophication in Rivers: A Revised Conceptual Model. Front. Plant Sci. 2018, 9, 451. [Google Scholar] [CrossRef]
  2. Boyd, C.E. Eutrophication. In Water Quality: An Introduction; Springer International Publishing: Cham, Switzerland, 2020; pp. 311–322. [Google Scholar]
  3. Jeppesen, E.; Moss, B.; Bennion, H.; Carvalho, L.; DeMeester, L.; Feuchtmayr, H.; Friberg, N.; Gessner, M.O.; Hefting, M.; Lauridsen, T.L.; et al. Interaction of Climate Change and Eutrophication. In Climate Change Impacts on Freshwater Ecosystems; John Wiley & Sons: Hoboken, NJ, USA, 2010; pp. 119–151. [Google Scholar]
  4. Moldovan, A.C.; Micle, V.; Hrăniciuc, T.A.; Marcoie, N. Research on the Sustainable Development of the Bistrita Ardeleana River through the Resizing of Weirs. Water 2022, 14, 3333. [Google Scholar] [CrossRef]
  5. McDowell, R.W.; Noble, A.; Pletnyakov, P.; Mosley, L.M. Global database of diffuse riverine nitrogen and phosphorus loads and yields. Geosci. Data J. 2021, 8, 132–143. [Google Scholar] [CrossRef]
  6. Newcomer Johnson, T.A.; Kaushal, S.S.; Mayer, P.M.; Smith, R.M.; Sivirichi, G.M. Nutrient Retention in Restored Streams and Rivers: A Global Review and Synthesis. Water 2016, 8, 116. [Google Scholar] [CrossRef]
  7. Payen, S.; Cosme, N.; Elliott, A.H. Freshwater eutrophication: Spatially explicit fate factors for nitrogen and phosphorus emissions at the global scale. Int. J. Life Cycle Assess. 2021, 26, 388–401. [Google Scholar] [CrossRef]
  8. Graham, D.J.; Bierkens, M.F.P.; van Vliet, M.T.H. Impacts of droughts and heatwaves on river water quality worldwide. J. Hydrol. 2024, 629, 130590. [Google Scholar] [CrossRef]
  9. Garnier, J.; Brion, N.; Callens, J.; Passy, P.; Deligne, C.; Billen, G.; Servais, P.; Billen, C. Modeling historical changes in nutrient delivery and water quality of the Zenne River (1790s–2010): The role of land use, waterscape and urban wastewater management. J. Mar. Syst. 2013, 128, 62–76. [Google Scholar] [CrossRef]
  10. Neamtu, M.; Ciumasu, I.M.; Costica, N.; Costica, M.; Bobu, M.; Nicoara, M.N.; Catrinescu, C.; van Slooten, K.B.; De Alencastro, L.F. Chemical, biological, and ecotoxicological assessment of pesticides and persistent organic pollutants in the Bahlui River, Romania. Environ. Sci. Pollut. Res. 2009, 16, 76–85. [Google Scholar] [CrossRef]
  11. Oiște, A.M.; Gabriela, I. Nitrate trends during the seasons on Bahlui river and its tributaries in build-up area of Iasi city. Bull. Univ. Agric. Sci. Vet. Med. Cluj-Napoca Agric. 2011, 68, 116–123. [Google Scholar] [CrossRef]
  12. Benchea, R.E.; Cretescu, I.; Macoveanu, M. Monitoring of water quality indicators for improving water resources management of Bahlui River. Environ. Eng. Manag. J. 2011, 10, 327–332. [Google Scholar] [CrossRef]
  13. Barjoveanu, G.; Teodosiu, C.; Cojocariu, C.; Augustijn, D.; Craciun, I. Instruments for integrated water resources management: Water quality modeling for sustainable wastewater management. Environ. Eng. Manag. J. (EEMJ) 2013, 12, 1679–1690. [Google Scholar]
  14. Zaharia, C. Evaluation of water pollution status in Bahlui River (Iasi town area) due to domestic and urban wastewater treatment activities. J. Eng. Stud. Res. 2015, 21, 79–88. [Google Scholar] [CrossRef]
  15. Zaharia, C.; Teslaru, M.I. Control and analysis of some water quality indicators of Bahlui River in Iasi county area (spring season). Bull. Polytech. Inst. Iasi Ser. Chem. Chem. Eng. Sect. 2012, 58, 69–79. [Google Scholar]
  16. Mihu-Pintilie, A.; Romanescu, G. Determining the potential hydrological risk associated to maximum flow in small hydrological subbasins with torrential character of the river Bahlui. Present Environ. Sustain. Dev. 2011, 5, 255–266. [Google Scholar]
  17. Tutunaru, I.D.; Blindaru, T.; Pricop, I.C. The assessment of the cultural heritage’s vulnerability to flash floods in Bahlui river basin, Iasi County. Eur. J. Sci. Theol. 2013, 9, 233–242. [Google Scholar]
  18. Crenganiş, L.M.; Telişcă, M. GIS application in water resources management and environmental engineering. Glob. J. Adv. Pure Appl. Sci. [Online] 2013, 1, 657–664. [Google Scholar]
  19. Boers, P.; Lammens, E.; Perjoiu, M.; Clipa, H.; Coman, I. Nutrients and Silt in the Bahlui River System; National Administration “Apele Romane”: Bucharest, Romania, 2006. [Google Scholar]
  20. Rotaru, A.; Raileanu, P. Alunecarea de teren de la Pârcovaci, Judetul Iasi [Pârcovaci landslide, Iasi County]. In Proceedings of the International PIARC Seminar on “Managing Operational Risk on Roads”, Iaşi, Romania, 5–7 November 2009. [Google Scholar]
  21. Giurma, I.; Craciun, I.; Giurma, C.-R. The analysis of the impact of storage lake on environment using the chemical characterization of the water resources. Case study Bahlui Basin River. “Ovidius” Univ. Ann. Constantza. Ser. Civ. Eng. 2007, 1, 119. [Google Scholar]
  22. Ludikhuize, D.; Savin, A.; Schropp, M. A Sobek Model for the Bahlui River; National Administration "Apele Romane": Iasi, Romania, 2004. [Google Scholar]
  23. Nicu, I.C. Hydrography. In Hydrogeomorphic Risk Analysis Affecting Chalcolithic Archaeological Sites from Valea Oii (Bahlui) Watershed, Northeastern Romania: An Interdisciplinary Approach; Springer International Publishing: Cham, Switzerland, 2016; pp. 19–29. [Google Scholar]
  24. Schropp, M.; Savin, A. Reducing the Flood Frequency for the City of Iaşi; National Administration "Apele Romane": Arnhem, The Netherlands; Iaşi, Romania, 2003. [Google Scholar]
  25. Bălinișteanu, O. Iașiul anului 1932, un oraș calamitat; Ziarul Lumina: Bucharest, Romania, 2019. [Google Scholar]
  26. Minea, I. The evaluation of the water chemistry and quality for the lakes from the south of the Hilly Plain of Jijia (Bahlui drainage basin). Lakes Reserv. Ponds 2010, 4, 131–144. [Google Scholar]
  27. Albulescu, A.-C.; Minea, I.; Boicu, D.; Larion, D. Comparative Multi-Criteria Assessment of Hydrological Vulnerability—Case Study: Drainage Basins in the Northeast Region of Romania. Water 2022, 14, 1302. [Google Scholar] [CrossRef]
  28. Połomski, M.; Wiatkowski, M. Impounding Reservoirs, Benefits and Risks: A Review of Environmental and Technical Aspects of Construction and Operation. Sustainability 2023, 15, 16020. [Google Scholar] [CrossRef]
  29. Langat, P.K.; Kumar, L.; Koech, R. Identification of the Most Suitable Probability Distribution Models for Maximum, Minimum, and Mean Streamflow. Water 2019, 11, 734. [Google Scholar] [CrossRef]
  30. Prezentare Generala. Available online: https://comunabelcesti.ro/despre-comuna/prezentare-generala/ (accessed on 3 April 2024).
  31. Dughilă, A.; Iancu, O.G.; Râșcanu, I.D. Geochemical evaluation of quality indicators for the water of the Tansa Lake from the Jijia catchment, Romania. Carpathian J. Earth Environ. Sci. 2012, 7, 79–88. [Google Scholar]
  32. Minea, I. Minimum discharge in Bahlui basin and associated hydrologic risks. Aerul Si Apa. Compon. Ale Mediu. 2010, 508. Available online: https://www.proquest.com/scholarly-journals/minimum-discharge-bahlui-basin-associated/docview/1335068855/se-2 (accessed on 3 April 2024).
  33. Breabăn, I.G.; Stan, O.C. The Influence of the Anthropogenic Activities on the Bahlui Water Quality, Holboca Section (Iassy county). Seminarul Geografic “D. Cantemir” 2006, 26, 169–179. [Google Scholar]
  34. Tutunaru, D.-I.; Pricop, C.-I.; Crăciun, I.; Blidaru, T.-V.; Crăciun, E.; Timofte, M.-C. Assessment of the impact and type of drought recorded in 2012 in the lower basin of the river Jijia. Lucr. Semin. Geogr. “Dimitrie Cantemir” 2013, 35, 5–16. [Google Scholar]
  35. Bissolli, P.; Friedrich, K.; Rapp, J.; Ziese, M. Flooding in eastern central Europe in May 2010—Reasons, evolution and climatological assessment. Weather 2011, 66, 147–153. [Google Scholar] [CrossRef]
  36. Ionita, M.; Nagavciuc, V. Extreme Floods in the Eastern Part of Europe: Large-Scale Drivers and Associated Impacts. Water 2021, 13, 1122. [Google Scholar] [CrossRef]
  37. Romanescu, G.; Stoleriu, C.C. Exceptional floods in the Prut basin, Romania, in the context of heavy rains in the summer of 2010. Nat. Hazards Earth Syst. Sci. 2017, 17, 381–396. [Google Scholar] [CrossRef]
  38. Blaas, H.; Kroeze, C. Excessive nitrogen and phosphorus in European rivers: 2000–2050. Ecol. Indic. 2016, 67, 328–337. [Google Scholar] [CrossRef]
  39. Guignard, M.S.; Leitch, A.R.; Acquisti, C.; Eizaguirre, C.; Elser, J.J.; Hessen, D.O.; Jeyasingh, P.D.; Neiman, M.; Richardson, A.E.; Soltis, P.S.; et al. Impacts of Nitrogen and Phosphorus: From Genomes to Natural Ecosystems and Agriculture. Front. Ecol. Evol. 2017, 5, 70. [Google Scholar] [CrossRef]
  40. Hobbie, S.E.; Finlay, J.C.; Janke, B.D.; Nidzgorski, D.A.; Millet, D.B.; Baker, L.A. Contrasting nitrogen and phosphorus budgets in urban watersheds and implications for managing urban water pollution. Proc. Natl. Acad. Sci. USA 2017, 114, 4177–4182. [Google Scholar] [CrossRef] [PubMed]
  41. Müller, A.; Österlund, H.; Marsalek, J.; Viklander, M. The pollution conveyed by urban runoff: A review of sources. Sci. Total Environ. 2020, 709, 136125. [Google Scholar] [CrossRef]
  42. Normative of February 28, 2002 Regarding the Establishment of Limits of Pollutant Loading of Industrial and Urban Wastewater at Discharge into Natural Receptors; NTPA-001/2002 Published in the Official Gazette, Part I nr. 187 of 20 March 2002; Romanian Government Decision: Bucharest, Romania, 2002.
  43. Lloyd, C.E.M.; Freer, J.E.; Johnes, P.J.; Coxon, G.; Collins, A.L. Discharge and nutrient uncertainty: Implications for nutrient flux estimation in small streams. Hydrol. Process. 2016, 30, 135–152. [Google Scholar] [CrossRef]
  44. Stoleriu, A.F.; Breaban, I.G.; Stoleriu, A.P. Assessing Water Quality from Tansa Barrier Lake (Romania) Using Sentinel-2 Data. Int. Multidiscip. Sci. GeoConf. SGEM 2021, 21, 247–254. [Google Scholar]
  45. Rakovec, O.; Samaniego, L.; Hari, V.; Markonis, Y.; Moravec, V.; Thober, S.; Hanel, M.; Kumar, R. The 2018–2020 Multi-Year Drought Sets a New Benchmark in Europe. Earth’s Future 2022, 10, e2021EF002394. [Google Scholar] [CrossRef]
  46. Mouri, G.; Takizawa, S.; Oki, T. Spatial and temporal variation in nutrient parameters in stream water in a rural-urban catchment, Shikoku, Japan: Effects of land cover and human impact. J. Environ. Manag. 2011, 92, 1837–1848. [Google Scholar] [CrossRef]
  47. Yang, F.; Yu, Z.; Bouwman, A.F.; Chen, H.; Jian, H.; Beusen, A.H.W.; Liu, X.; Yao, Q. Human-driven long-term disconnect of nutrient inputs to the Yellow River basin and river export to the Bohai Sea. J. Hydrol. 2023, 618, 129279. [Google Scholar] [CrossRef]
  48. Batalla, R.J.; Gómez, C.M.; Kondolf, G.M. Reservoir-induced hydrological changes in the Ebro River basin (NE Spain). J. Hydrol. 2004, 290, 117–136. [Google Scholar] [CrossRef]
  49. Fisher, J.; Acreman, M.C. Wetland nutrient removal: A review of the evidence. Hydrol. Earth Syst. Sci. 2004, 8, 673–685. [Google Scholar] [CrossRef]
  50. Jiang, B.; Mitsch, W.J. Influence of hydrologic conditions on nutrient retention, and soil and plant development in a former central Ohio swamp: A wetlaculture mesocosm experiment. Ecol. Eng. 2020, 157, 105969. [Google Scholar] [CrossRef]
  51. Halecki, W.; Stachura, T.; Fudała, W. Capacity of River Valleys to Retain Nutrients from Surface Runoff in Urban and Rural Areas (Southern Poland). Water 2022, 14, 3259. [Google Scholar] [CrossRef]
  52. Mallin, M.A.; Johnson, V.L.; Ensign, S.H. Comparative impacts of stormwater runoff on water quality of an urban, a suburban, and a rural stream. Environ. Monit. Assess. 2009, 159, 475–491. [Google Scholar] [CrossRef]
  53. Khatri, N.; Tyagi, S. Influences of natural and anthropogenic factors on surface and groundwater quality in rural and urban areas. Front. Life Sci. 2015, 8, 23–39. [Google Scholar] [CrossRef]
  54. Oişte, A.M.; Breabăn, I.G. Organic and Inorganic contaminants in the Bahlui River in the built-up area of Iasi city. In Proceedings of the Water Resources and Wetlands, Tulcea, Romania, 14–16 September 2012. [Google Scholar]
  55. Minea, I.; Sfîcă, L. Assessment of hydrological drought in the north-eastern part of Romania. Aerul Si Apa. Compon. Ale Mediu. 2017, 93–100. Available online: https://scholar.google.com/scholar?hl=en&as_sdt=0%2C5&q=Assessment+of+hydrological+drought+in+the+north-eastern+part+of+Romania&btnG= (accessed on 3 April 2024).
  56. Moldovan, A.C.; Hrăniciuc, T.A.; Micle, V.; Marcoie, N. Research on the Sustainable Development of the Bistrita Ardeleana River in Order to Stop the Erosion of the Riverbanks and the Thalweg. Sustainability 2023, 15, 7431. [Google Scholar] [CrossRef]
  57. Udeigwe, T.K.; Wang, J.J. Biochemical Oxygen Demand Relationships in Typical Agricultural Effluents. Water Air Soil Pollut. 2010, 213, 237–249. [Google Scholar] [CrossRef]
  58. Soro, M.-P.; N’Goran, K.M.; Ouattara, A.A.; Yao, K.M.; Kouassi, N.G.L.B.; Diaco, T. Nitrogen and phosphorus spatio-temporal distribution and fluxes intensifying eutrophication in three tropical rivers of Côte d’Ivoire (West Africa). Mar. Pollut. Bull. 2023, 186, 114391. [Google Scholar] [CrossRef] [PubMed]
  59. Mbaye, M.L.; Gaye, A.T.; Spitzy, A.; Dähnke, K.; Afouda, A.; Gaye, B. Seasonal and spatial variation in suspended matter, organic carbon, nitrogen, and nutrient concentrations of the Senegal River in West Africa. Limnologica 2016, 57, 1–13. [Google Scholar] [CrossRef]
  60. Mararakanye, N.; Le Roux, J.J.; Franke, A.C. Long-term water quality assessments under changing land use in a large semi-arid catchment in South Africa. Sci. Total Environ. 2022, 818, 151670. [Google Scholar] [CrossRef] [PubMed]
  61. Dalu, T.; Wasserman, R.J.; Magoro, M.L.; Froneman, P.W.; Weyl, O.L.F. River nutrient water and sediment measurements inform on nutrient retention, with implications for eutrophication. Sci. Total Environ. 2019, 684, 296–302. [Google Scholar] [CrossRef]
  62. Green, W.J.; Stage, B.R.; Preston, A.; Wagers, S.; Shacat, J.; Newell, S. Geochemical processes in the Onyx River, Wright Valley, Antarctica: Major ions, nutrients, trace metals. Geochim. Cosmochim. Acta 2005, 69, 839–850. [Google Scholar] [CrossRef]
  63. Kim, D.; Lim, J.-H.; Chun, Y.; Nayna, O.K.; Begum, M.S.; Park, J.-H. Phytoplankton nutrient use and CO2 dynamics responding to long-term changes in riverine N and P availability. Water Res. 2021, 203, 117510. [Google Scholar] [CrossRef] [PubMed]
  64. Nguyen, T.T.N.; Némery, J.; Gratiot, N.; Strady, E.; Tran, V.Q.; Nguyen, A.T.; Aimé, J.; Peyne, A. Nutrient dynamics and eutrophication assessment in the tropical river system of Saigon – Dongnai (southern Vietnam). Sci. Total Environ. 2019, 653, 370–383. [Google Scholar] [CrossRef] [PubMed]
  65. Yang, H.F.; Zhu, Q.Y.; Liu, J.A.; Zhang, Z.L.; Yang, S.L.; Shi, B.W.; Zhang, W.X.; Wang, Y.P. Historic changes in nutrient fluxes from the Yangtze River to the sea: Recent response to catchment regulation and potential linkage to maritime red tides. J. Hydrol. 2023, 617, 129024. [Google Scholar] [CrossRef]
  66. Ravi, N.K.; Srivastava, A.; Ram, K.; Jha, P.K. Nutrient chemistry and eutrophication risk assessment of the Ghaghara river, India. Water Supply 2021, 21, 3486–3502. [Google Scholar] [CrossRef]
  67. Salim Aoubid, H.; Opp, C. Nitrogen and Phosphorus Discharge Loads Assessment Using the SWAT Model: A Case Study of the Shatt Al-Arab River Basin. Appl. Sci. 2023, 13, 8376. [Google Scholar] [CrossRef]
  68. Mosley, L.M.; Priestley, S.; Brookes, J.; Dittmann, S.; Farkaš, J.; Farrell, M.; Ferguson, A.J.; Gibbs, M.; Hipsey, M.; Huang, J.; et al. Extreme eutrophication and salinisation in the Coorong estuarine-lagoon ecosystem of Australia’s largest river basin (Murray-Darling). Mar. Pollut. Bull. 2023, 188, 114648. [Google Scholar] [CrossRef] [PubMed]
  69. Johnston, S.G.; Maher, D.T. Drought, megafires and flood - climate extreme impacts on catchment-scale river water quality on Australia’s east coast. Water Res. 2022, 218, 118510. [Google Scholar] [CrossRef] [PubMed]
  70. Tenebe, I.T.; Julian, J.P.; Emenike, P.C.; Dede-Bamfo, N.; Maxwell, O.; Sanni, S.E.; Babatunde, E.O.; Alves, D.D. Multi-Dimensional Surface Water Quality Analyses in the Manawatu River Catchment, New Zealand. Water 2023, 15, 2939. [Google Scholar] [CrossRef]
  71. Jarosiewicz, A.; Obolewski, K.; Ożgo, M. Long-term trends in nutrient concentrations in Polish coastal rivers. Ocean Coast. Manag. 2015, 118, 37–46. [Google Scholar] [CrossRef]
  72. Garnier, J.; Némery, J.; Billen, G.; Théry, S. Nutrient dynamics and control of eutrophication in the Marne River system: Modelling the role of exchangeable phosphorus. J. Hydrol. 2005, 304, 397–412. [Google Scholar] [CrossRef]
  73. Soana, E.; Gervasio, M.P.; Granata, T.; Colombo, D.; Castaldelli, G. Climate change impacts on eutrophication in the Po River (Italy): Temperature-mediated reduction in nitrogen export but no effect on phosphorus. J. Environ. Sci. 2024, 143, 148–163. [Google Scholar] [CrossRef]
  74. Yin, S.; Gao, G.; Li, Y.; Xu, Y.J.; Turner, R.E.; Ran, L.; Wang, X.; Fu, B. Long-term trends of streamflow, sediment load and nutrient fluxes from the Mississippi River Basin: Impacts of climate change and human activities. J. Hydrol. 2023, 616, 128822. [Google Scholar] [CrossRef]
  75. Rattan, K.J.; Corriveau, J.C.; Brua, R.B.; Culp, J.M.; Yates, A.G.; Chambers, P.A. Quantifying seasonal variation in total phosphorus and nitrogen from prairie streams in the Red River Basin, Manitoba Canada. Sci. Total Environ. 2017, 575, 649–659. [Google Scholar] [CrossRef] [PubMed]
  76. Castillo, M.M.; Carrillo, L.; Jarquín-Sánchez, A.; Alcérreca-Huerta, J.C.; Álvarez-Merino, A.; Lázaro-Vázquez, A. Transport of nutrients into the southern Gulf of Mexico by the Grijalva–Usumacinta rivers. Hydrol. Process. 2023, 37, e14838. [Google Scholar] [CrossRef]
  77. Pacheco, F.S.; Ometto, J.P.H.B.; Gomes, L.; Tôsto, K.; Miranda, M.; Loverde-Oliveira, S.; Pessi, D.D.; Cox, C. Nutrient Balance and Use Efficiency in Agricultural Lands in the Vermelho River Watershed, Upper Pantanal, Brazil. J. Geophys. Res. Biogeosci. 2021, 126, e2020JG005673. [Google Scholar] [CrossRef]
  78. Perillo, V.L.; Bohn, V.Y.; Menéndez, M.C.; Ronda, A.C.; Vitale, A.J.; Perillo, G.M.E.; Piccolo, M.C.; Cuadrado, D.G. Spatial and seasonal dynamics of phosphorous and physicochemical variables in the Negro River Estuary (Argentina): A preliminary approach. Environ. Sci. Pollut. Res. 2022, 29, 15490–15500. [Google Scholar] [CrossRef]
  79. Pizarro, J.; Vergara, P.M.; Rodríguez, J.A.; Sanhueza, P.A.; Castro, S.A. Nutrients dynamics in the main river basins of the centre-southern region of Chile. J. Hazard. Mater. 2010, 175, 608–613. [Google Scholar] [CrossRef] [PubMed]
Figure 1. VOSviewer bibliometric map linking nutrient dynamics with climate change.
Water 16 01322 g001
Figure 2. Sampling locations placement on Bahlui River catchment.
Water 16 01322 g002
Figure 3. The Bahlui River’s daily discharge variation at the selected sites (Parcovaci, Belcesti, Podu Iloaiei, and Holboca) for the 2005–2021 period *. * Insets 1 and 2 present selected drought periods, further detailed in Figure 4 and Figure 5.
Water 16 01322 g003
Figure 4. (Inset 1 from Figure 3). Comparative display of daily discharge (m3/s) of Bahlui River during the 2006–2007 drought at Parcovaci, Belcesti, Podu Iloaiei, and Holboca.
Water 16 01322 g004
Figure 5. (Inset 2 from Figure 3). Comparative display of daily discharge (m3/s) of Bahlui River during the 2011–2013 drought at Parcovaci, Belcesti, Podu Iloaiei, and Holboca.
Water 16 01322 g005
Figure 6. Comparative display of Bahlui River’s daily discharge during heavy rainfalls from May to August 2010 at Parcovaci, Belcesti, Podu Iloaiei, and Holboca.
Water 16 01322 g006
Figure 7. Variations in TN (a) and TP (b) in the selected locations for 2011–2022. Unfortunately, the TN and TP data are unavailable for all considered locations during the analyzed period. The 2011–2014 interval is missing for Belcesti.
Water 16 01322 g007
Figure 8. Average annual variation in total nitrogen.
Water 16 01322 g008
Figure 9. Average annual variation in total phosphorus.
Water 16 01322 g009
Figure 10. The variations in discharge, total nitrogen, and total phosphorus at Parcovaci for 2011–2022.
Water 16 01322 g010
Figure 11. The variations in discharge, total nitrogen, and total phosphorus at Belcesti for 2011–2022.
Water 16 01322 g011
Figure 12. The variations in discharge, total nitrogen, and total phosphorus at Podu Iloaiei for 2011–2022.
Water 16 01322 g012
Figure 13. The variations in discharge, total nitrogen, and total phosphorus at Holboca for 2011–2022.
Water 16 01322 g013
Figure 14. Average seasonal variations: discharge, total nitrogen, total phosphorus.
Water 16 01322 g014
Table 1. The main tributaries of the Bahlui River.
No.BankRiverLength [km]Surface Area [km2]
1RightBahluet40500
2Voinesti25131
3Nicolina18171
4Magura2578
5LeftGurguiata31129
6Cacaina2160
7Ciric1956
8Hoisesti1127
9Chirita1539
10Totoesti1125
11Bogonos936
12Fundu Vaii 712
Various ungauged tributaries838
Table 2. The most important documented floods and drought periods on the Bahlui River.
FloodsDrought Periods
YearMonthFlow [m3/s]YearsSeasonFlow [m3/s]
1932April6001953–1954Winter>0.001
1969July1601962–1963
1971August1081963–1964
1975June1821954, 1958, 1959, 1962, 1992, 2000Summer
Table 3. The reservoirs in the Bahlui River system.
No.YearRiverReservoirAverage Flow [m3/s]Sub-Basin Area [km2]
11964BahluetPodu Iloaiei1.06500
2CiricAroneanu0.1050
3Valea LociiCiurbesti0.2282
4Valea LungaChirita0.0840
5EzareniEzareni0.0627
61968VoinestiCucuteni0.25131
71975BahluiTansa0.84346
81978GurguiataPlopi0.21117
91980CiricCiric III0.1157
101982Carlig (Cacaina)Carlig0.0646
11NicolinaCiurea0.1036
12EzareniCornet0.0313
13Valea LociiBarca0.0840
141983Carlig (Cacaina)Vanatori0.0323
15Valea OiiSarca0.2091
161985BahluiParcovaci0.4295
171988Fundu VaiiRediu0.028.6
Table 4. Statistical indicators for the river discharge (m3/s) for the 2005–2022 period.
LocationMeanStDev *MinimumQ1 *Median *Q3 *Maximum
Parcovaci0.28571.13290.01800.04190.05950.070024.5915
Belcesti0.54801.29750.00300.04850.11230.306314.8447
Podu Iloaiei0.81031.38470.02440.16050.33580.720415.3273
Holboca4.01993.89820.56172.12222.96674.365862.1468
Notes: * StDev represents the standard deviation; Q1, median, and Q3 represent the data quantiles.
Table 5. Statistical indicators for the river discharge during selected drought periods (m3/s).
LocationYearMeanStDevMinimumQ1MedianQ3Maximum
Parcovaci20060.44221.22620.02200.03400.04900.06909.6892
20070.0383770.0059640.0264000.0334530.0394240.0436080.047896
20110.38321.24670.02550.03490.03940.064915.4678
20120.08270.26360.03270.04250.04690.05612.4989
20130.24620.69660.01800.05220.05750.06704.2317
Belcesti20060.89881.90290.09800.17870.21630.389910.1955
20070.23800.63810.06000.08200.15990.25396.4773
20110.63461.02180.00490.00490.00530.78564.6467
20120.31820.68960.00300.00490.11230.28504.6488
20130.35550.79080.00890.01660.01820.39514.1781
Podu Iloaiei20061.2581.9130.0880.4160.5530.8118.510
20070.39950.56600.10180.15600.36270.49986.0000
20111.01561.04340.10330.22590.60241.46054.9478
20120.43860.75140.02440.06670.16020.47224.9810
20130.81271.15010.11420.28390.42230.724110.2434
Holboca20066.2195.8592.8863.3904.0985.41034.349
20073.10511.02141.65172.44863.04583.33469.3919
20114.4423.5372.0472.6013.2265.30634.140
20123.12951.43001.76232.32282.60223.335810.0813
20134.5605.1171.6082.5393.3074.39062.147
Table 6. Statistic indicators for the discharge during 2010 floods (m3/s).
LocationMonthMeanStDevMinimumQ1MedianQ3Maximum
ParcovaciMay1.0322.1550.0280.0280.0281.1659.462
June3.746.770.030.030.035.1724.59
July0.6231.1270.0280.0280.0281.1134.971
August0.12760.32560.03090.03710.04470.14091.8596
BelcestiMay2.1632.2890.4510.4890.7834.7246.704
June3.8342.7340.4470.6134.4496.5347.355
July3.0392.7250.210.3561.0555.7246.977
August0.6510.9430.140.140.140.7322.894
Podu IloaieiMay2.0541.940.5770.6910.944.1315.947
June4.1443.2960.6630.8944.0196.29715.327
July3.7733.170.4220.6253.6326.8678.309
August0.8270.7830.3040.4220.4740.7862.679
HolbocaMay4.612.742.3762.8983.0476.38212.204
June10.9410.092.344.438.359.9341.77
July9.677.762.855.177.998.9639.28
August3.2790.8052.4422.6572.8354.0314.925
Table 7. Statistical indicators for some water quality indicators analyzed in the 2011–2022 period.
IndicatorLocationMeanStDevMinimumQ1MedianQ3Maximum
TN Belcesti7.3674.5281.2303.8956.22010.25019.890
Holboca8.9723.4831.4706.4008.52010.59025.400
Parcovaci0.63030.44880.15000.40000.54000.70002.9200
Podu Iloaiei3.9712.2970.2502.3603.4604.67012.300
TPBelcesti0.41840.52620.06000.19300.30800.41453.7300
Holboca1.05860.49690.25000.67000.97401.31252.4270
Parcovaci0.08190.09800.00250.02000.04000.10000.4670
Podu Iloaiei0.37290.26920.06800.21000.29800.47301.9820
Disclaimer/Publisher’s Note: The statements, opinions and data contained in all publications are solely those of the individual author(s) and contributor(s) and not of MDPI and/or the editor(s). MDPI and/or the editor(s) disclaim responsibility for any injury to people or property resulting from any ideas, methods, instructions or products referred to in the content.

