
Influence of Urban Park Pathway Features on the Density and Intensity of Walking and Running Activities: A Case Study of Shanghai City

Department of Landscape Architecture, School of Design, Shanghai Jiao Tong University, Shanghai 200240, China
*
Author to whom correspondence should be addressed.
Land 2024, 13(2), 156; https://doi.org/10.3390/land13020156
Submission received: 9 December 2023
/
Revised: 27 January 2024
/
Accepted: 28 January 2024
/
Published: 30 January 2024
(This article belongs to the Special Issue Landscape Design, Evaluation and Management Created by Novel Technologies)
Abstract
:Walking and running activities (W&RAs), encompassing strolling, slow walking, brisk walking, jogging, and running, hold significant importance as popular forms of exercise within urban parks. Recognized for their efficacy in promoting public health and preventing chronic diseases, understanding the nuanced impact of pathway features on W&RAs is crucial for advancing health-centric urban park planning. Based on extensive, high-frequency field observation data, we utilize multiple OLS regression models and univariate OLS regression models to investigate the relationship between urban park pathway features and variations in W&RAs, specifically examining activity density and intensity. Subsequently, we propose corresponding pathway optimization strategies. Our findings highlight the primary determinants, with vegetation coverage ratio, path type, and security facility density influencing activity density; and control value, time required to reach the nearest entrance, and pavement type influencing activity intensity. Significantly, increased vegetation coverage enhances density, while interconnected spaces and improved accessibility elevate intensity. In conclusion, our study delineates key features that merit prioritization, specifies their optimal ranges and proposes optimization design strategies for urban park pathways. By shedding light on these considerations, our research contributes valuable insights to the realm of health-oriented urban park planning and design.
1. Introduction
The World Health Organization (WHO) released the “Global Report on Urban Health” in 2016, indicating that chronic diseases constitute a primary health concern for contemporary urban areas. These conditions contribute to approximately 63% of the total mortality rate [1]. In contemporary society, numerous chronic diseases such as obesity and cardiovascular disorders pose a significant threat to human well-being and health. An increasing body of research indicates a close association between the occurrence of chronic diseases and the lack of physical activity(PA), as well as reduced exposure to natural environments [2,3].
Since the 1990s, rapid urbanization in China has led to a substantial increase in the urban population, posing increasingly severe challenges to urban environments and public health. The prevalence of chronic diseases, including obesity and cardiovascular disorders, has surged among urban residents [4]. In recent years, as living standards have improved, there has been a growing emphasis on both physical and mental health as a focal point of public concern. Initiatives such as “Healthy China”, “Park Cities”, and “National Fitness”, coupled with a burgeoning body of public health research, underscore that engaging in physical activity (PA) is recognized as a crucial pathway to enhance public health [5,6,7]. Engaging in PA has become a pivotal response to national health initiatives, contributing significantly to the enhancement of public health. Among various activities, walking and running activities (W&RAs) have become popular and accessible forms of exercise due to their practicality, broad appeal, and ease of participation. Simultaneously, they stand out as common activities within urban parks and are closely linked to the improvement of health [8]. Research suggests that engaging in moderate-intensity brisk walking activities, accumulating 8–9 MET hours per week, can significantly improve cardiorespiratory health in healthy adults [9].
W&RAs typically take place within various pathways in urban parks. Pathways, proven to be significant park features in numerous studies, are closely associated with promoting park visitation and levels of PA [10,11,12]. Previous studies have indicated a correlation between various factors and W&RAs, including accessibility [13,14], spatial topology [15,16], spatial form [17,18,19], facilities [20,21], natural elements [22,23,24,25,26], aesthetic perception [27,28], and safety perception [29,30,31]. For instance, a study from Shanghai examined two large urban forest parks and explored the relationship between walking behavior and pathway topology by measuring variables such as integration, control value, and connectivity. It found that pathways with shorter average distances to park gates and more topologically accessible pathways were more preferred by visitors [32]. Another study from Chile explored the relationship between spatial place features of urban park pathways and walking behavior within the park. The study measured variables such as pathway width, pavement type, and vegetation coverage, and collected data on walking behavior. The findings revealed that factors such as increased vegetation, connectivity to activity areas, tranquility along pathways, and the presence of benches along the pathway significantly influenced the promotion of walking activities within the park. [33]. Additionally, a study from Harbin measured variables such as green view ratio and sky view ratio, exploring the association between aesthetic perception of park pathway spaces and W&RAs. It found that open skies and higher green view ratios significantly increased the intensity of these activities [27]. Furthermore, a literature review compared qualitative studies with previous quantitative research and emphasized the importance of park attributes reflecting spatial safety perception, such as the quantity of streetlights and safety facilities, in encouraging park use [34]. Based on the review of past research, we categorized these indicators into three dimensions: organizational relationships between spaces, place features within spaces, and subjective perception of spaces. The organizational dimension includes spatial accessibility and spatial topology, the place dimension includes spatial form, facilities, natural elements, and the perception dimension includes safety and aesthetics.
However, most previous studies have tended to focus on specific features influencing W&RAs, lacking a systematic discussion of multiple factors. For example, an Australian study explored the relative importance of micro-place features of urban park pathways in promoting walking among the elderly, finding that pathway slope, shaded trees, and pavement type played crucial roles in walking choices for the elderly [35]. However, this study only focused on place features within spaces and did not investigate the impact of organizational relationships between spaces and spatial perception on W&RAs. Therefore, we incorporate features from all three dimensions into regression models to comprehensively examine the influence of pathway features on W&RAs.
Activity density and activity intensity are two essential aspects used to measure different facets of W&RAs [27,33], reflecting the quantity and intensity of these activities, respectively. We hypothesize that various pathway features may influence different aspects of W&RAs, with certain features promoting more widespread and intense occurrences of these activities, while others may have the opposite effect. Identifying these key features is crucial for a comprehensive understanding of the impact of pathway features on W&RAs and providing better guidance for the planning and design of urban park pathways. Therefore, in this study, we concurrently examine both aspects, with activity density as the population density engaging in W&RAs within a sampling area in a day (daily W&RA density). Activity intensity is measured as the metabolic equivalent of tasks (METs) expended per capita in a day due to W&RAs (daily per capita W&RA METs), providing a holistic observation of the impact of pathway features on W&RAs.
Our study focuses on the pathway spaces within Xu Jiahui Park, Fu Xing Park, and Lujiazui Center Green in Shanghai as illustrative examples. Utilizing long-term, high-frequency field observation data, we constructed multiple OLS regression models and univariate OLS regression models for daily W&RA density and daily per capita W&RA METs. The models aimed to identify significant urban park pathway features influencing the density and intensity of W&RAs, as well as determining their optimal value ranges. The study addresses the following three research questions:
- (1)
- Is there a significant correlation between urban park pathway features and the level of W&RAs?
- (2)
- What are the significant urban park pathway features that influence the density and intensity of W&RAs?
- (3)
- How do the effects and optimal value ranges of urban park pathway features differ concerning the density and intensity of W&RAs?
This study aims to systematically explore the relationship between urban park pathway features and the density and intensity of W&RAs from a micro-scale perspective. The study quantifies the impact of urban park pathway features on the density and intensity of W&RAs. Corresponding pathway optimization design strategies are proposed based on the quantitative results. The findings are anticipated to provide scientific support for the optimization design of urban park spaces with a focus on public health. This, in turn, aims to offer insights for urban park planning and design, contributing to the enhancement of public health.
2. Methodology
Figure 1 provides an illustrative overview of the research workflow. Based on the three research questions proposed, we selected 16 pathway plots from three parks as observation objects according to pre-survey and collected W&RA data and pathway feature data. We then tested the correlation between pathway features and W&RAs, then selected indicators with significant correlations for regression model construction. We first built a multiple linear regression model to observe the overall impact of pathway features on W&RAs. Subsequently, we constructed univariate regression models to determine the optimal range of each pathway feature in promoting W&RAs. This serves as the basis for proposing corresponding strategies for the optimization design of urban park pathway spaces to promote W&RAs.
2.1. Selection of Sample Parks and Plots
For this study, three urban parks located within the inner ring of Shanghai, characterized by substantial foot traffic and suitability for various physical activities, were chosen as sample parks: Xu Jiahui Park, Fu Xing Park, and Lujiazui Center Green. Following a preliminary investigation, a total of 5, 5, and 6 pathways conducive to W&RAs, respectively, were selected from these three parks for data collection and analysis (Figure 2). Selection criteria comprised the following:
- (1)
- Plots should constitute a continuous part of the internal park pathway system.
- (2)
- Plots should exhibit a smooth and continuous linear form.
- (3)
- Plots should be devoid of outdoor elements like steps or stairs that could hinder W&RAs.
- (4)
- The length of the plots should exceed 50 m.
- (5)
- Plots should be uniformly distributed throughout the sample parks.
2.2. Selection of Pathway Features and Data Collection
PA is not only a physiological behavior but also a complex perceptual one. The willingness to engage in PA is influenced both directly by spatial environmental elements and indirectly by certain micro-space elements impacting subjective perception [36]. Integrating subjective perception factors with objective factors in green open spaces can overcome the limitations of describing PA from a single perspective. Therefore, building on relevant previous studies and incorporating on-site survey data, we selected indicators proven to be correlated with W&RAs in past research for regression model construction. These indicators were categorized into three aspects: spatial organization features, spatial place features, and spatial perception features. This categorization aimed to clearly demonstrate the ways of different indicators’ influences and simultaneously examine the impact of features at different levels of urban park pathways on W&RAs (Table 1).
Within the realm of spatial organization features, indicators like integration value, choice value, and control value draw upon the principles of spatial syntax theory. This theory quantifies and elucidates spatial structures, aiming to explore the correlation between spatial organization features and human society [37]. Established methods and indicators for urban-scale application have evolved within the framework of spatial syntax theory. Research indicates its adaptability to the exploration of the relationship between small-scale open spaces and physical activity [16], with specific applications in investigating the interplay between park pathway spatial composition and walking behavior [38]. Hence, we strategically employ this theory to delve into the spatial topology of urban park pathways. Utilizing DepthmapX v0.8.0 software to abstract the spatial composition of the park through the depiction of its axial map, we acquire essential indicators such as integration, choice value, and control value. Spatial perception features, including sky view ratio and green view ratio, are determined by invoking the GluonCV model, a deep learning toolkit in computer vision. This involves conducting image semantic segmentation on plot photos and calculating the proportion of pertinent features in the images. The remaining indicators are sourced through meticulous on-site surveys (Figure 3).
2.3. Data Collection of W&RAs and Calculation of Activity Levels
2.3.1. Data Collection of W&RAs
Our study conducted a total of 12 sets of on-site observations over 24 days from January 2021 to December 2021 to collect data on W&RAs within the three mentioned parks. Based on preliminary investigations, we selected 5, 5, and 6 plots in Xu Jiahui Park, Fu Xing Park, and Lujiazui Center Green, respectively, as the observation targets. Field observations were carried out on two clear days each month (including one weekday and one weekend day) for each park. The method employed for data collection primarily involved behavioral annotation, and the data collected included the types of W&RAs within each plot and the number of individuals engaging in each activity. The data collection periods were divided into five time slots: 6:00–8:00, 8:00–10:00, 11:00–13:00, 14:00–16:00, and 18:00–20:00. Single observations lasting 8 min were conducted during each time slot for each plot, aiming to comprehensively capture the real occurrences of W&RAs throughout the day. After a year of data collection, a total of 49,726 valid observation samples were collected. Participants were categorized into five activity types based on their different speeds: slow walking, strolling, brisk walking, jogging, and running. Specifically, slow walking refers to activities with an average speed of 4.0 km per hour, strolling at 4.5 km per hour, brisk walking at 5.6 km per hour, jogging at 7.0 km per hour, and running at 7.8 km per hour.
2.3.2. Calculation of W&RA Density and Intensity
Due to variations in plot size and notable differences in the number of participants within each plot, we employ the metrics of daily W&RA density and daily per capita W&RA METs to mitigate the impact of plot size and participant count on the assessment of W&RAs.
The formula for calculating daily W&RA density is as follows:
Daily W&RA density (persons/m2) = Daily W&RA participants (persons)/Plot area (m2)
The formula for calculating daily per capita W&RA METs is as follows:
Daily per capita W&RA METs (METs/person) = Cumulative daily W&RA METs (METs)/Daily W&RA
participants (persons)
participants (persons)
Due to the challenge of real-time monitoring of the metabolic equivalents expended by all participants, we referenced the 2011 edition of the “Compendium of Physical Activities” (CPA) [39], which provides graded assessments of energy expenditure and intensity for physical activities. This classification was applied to the five types of activities involved in this study—strolling, slow walking, brisk walking, jogging, and running—to determine the corresponding metabolic equivalent values (Table 2). The cumulative daily W&RA METs are the product sum of the metabolic equivalents expended for different types of W&RAs and the corresponding total daily activity participants. The calculation formula is as follows:
Cumulative daily W&RA METs (METs) = 3.0 (METs) × Daily slow walking participants (persons) + 3.5
(METs) × Daily strolling participants (persons) + 4.3 (METs) × Daily brisk walking participants (persons)
+ 7.0 (METs) × Daily jogging participants (persons) + 8.0 (METs) × Daily running participants (persons)
(METs) × Daily strolling participants (persons) + 4.3 (METs) × Daily brisk walking participants (persons)
+ 7.0 (METs) × Daily jogging participants (persons) + 8.0 (METs) × Daily running participants (persons)
2.4. Statistical Analysis Methods
We employed the ordinary least squares (OLS) model to investigate the overall impact of urban park pathway features on the density and intensity of W&RAs. The strength of this model lies in its simplicity, ease of interpretation, and ability to quantify the influence of each pathway feature on W&RAs. It helps establish a clear and interpretable relationship between pathway features and W&RAs, providing a concise analysis of how pathway features impact W&RAs. Prior to constructing regression models, a correlation analysis was conducted to examine the relationships between independent and dependent variables, with non-significant factors being excluded. The filtered results were then incorporated into the regression models, where pathway features served as independent variables, and daily W&RA density and daily per capita W&RA METs as dependent variables. Multiple linear regression models were established for each, and standardized coefficients were computed to assess the relative importance of each pathway feature on daily W&RA density and daily per capita W&RA METs (refer to Section 3.1 below). All independent variables passed the covariance test, with VIF values below 7.5.
To further understand the optimal ranges of pathway features promoting W&RA density and intensity, univariate linear regression models were constructed. Nine continuous variables from the pathway features were selected as independent variables, while daily W&RA density and daily per capita W&RA METs served as dependent variables. This facilitated the observation of the impact variations and optimal ranges of individual pathway features on W&RA density and intensity (refer to Section 3.2 below). Statistical significance for all models was set at p < 0.05. The entire analysis was conducted using SPSS 26.0.
3. Results
3.1. Analysis of the Impact of Pathway Features
We employed Pearson’s correlation analysis, independent sample t-tests, and ANOVA analysis to identify pathway features significantly correlated with daily W&RA density as well as daily per capita W&RA METs, as shown in Table 3 and Table 4. Features with significant correlations (p < 0.05) were selected to construct models for daily W&RA density and daily per capita W&RA METs.
3.1.1. Results of the Daily W&RA Density Model
Thirteen pathway features with significant correlations (p < 0.05) were selected to construct the model for daily W&RA density. Due to the presence of multicollinearity among some features, we examined the correlation coefficients between each pair of independent variables and removed features with severe multicollinearity to avoid their impact on the model results. The final model incorporated 12 pathway features with a VIF < 7.5 and adjusted R2 = 0.430. The specific results are presented in Table 5. The density of security facilities, the density of streetlights, integration value, path type, vegetation coverage ratio, and sky view ratio all exhibited a positive impact on daily W&RA density. Notably, the vegetation coverage ratio emerged as the most influential positive factor, while the positive impact of the sky view ratio was relatively weaker. Vegetation structure had a negative impact on daily W&RA density. Additionally, choice value, density of seating, green view ratio, waterfront proximity, and path width did not demonstrate statistical significance.
3.1.2. Results of the Daily per Capita W&RA METs Model
The final model for daily per capita W&RA METs incorporated 11 pathway features with a VIF < 7.5 and adjusted R2 = 0.589. The detailed results are presented in Table 6. Control value, the density of security facilities, and pavement type exhibited positive effects on daily per capita W&RA METs. Control value emerged as the most influential positive factor, while the density of security facilities showed a relatively weaker positive impact. Five features, namely time required to reach the nearest entrance, path length-to-width ratio, sky view ratio, density of seating, and path type, demonstrated negative effects on daily per capita W&RA METs. The negative impact of time required to reach the nearest entrance was the strongest, while the negative impact of path type was the weakest. Additionally, the density of streetlights, waterfront proximity, and vegetation structure did not exhibit statistical significance.
3.2. Analysis of the Optimal Range of Pathway Features
The above regression models explored the pathway features influencing the density and intensity of W&RAs, along with their variations in impact strength. To further identify the optimal range of pathway features significantly affecting W&RA density and intensity, we established univariate OLS regression models for the nine continuous variable features that demonstrated significance (Table 7). The optimal range of each feature was observed through scatter plots (Figure 4).
3.2.1. Results of the Univariate OLS Regression Models for Spatial Organization Features
The model results (Figure 4a) indicate a weak positive correlation between integration value and daily W&RA density. Daily W&RA density shows a slow increase with the improvement of integration value.
Control value demonstrates an overall positive correlation with daily per capita W&RA METs. When the control value ranges from 0 to 1.3, daily per capita W&RA METs increase with the rise of the control value. As the control value ranges from 1.3 to 2.5, daily per capita W&RA METs exhibit an extremely gradual decline with the increase of the control value. When the control value exceeds 2.5, daily per capita W&RA METs rapidly increase with the ascent of the control value.
Time required to reach the nearest entrance is negatively correlated with overall daily per capita W&RA METs. When the time required to reach the nearest entrance remains between 0 and 100 s, the daily per capita W&RA METs decrease with the increase in the time required. When the time required to reach the nearest entrance exceeds 100 s, daily per capita W&RA METs remain relatively constant.
3.2.2. Results of the Univariate OLS Regression Models for Spatial Place Features
Vegetation coverage ratio demonstrates a positive correlation with daily W&RA density. Within different ranges of values, the impact of vegetation coverage ratio on daily W&RA density varies. When the vegetation coverage ratio is <0.75, the increase in daily W&RA density is relatively slow. However, when the vegetation coverage ratio exceeds 0.75, the daily W&RA density shows a relatively rapid increase.
Path length-to-width ratio is negatively correlated with overall daily per capita W&RA METs. When the path length-to-width ratio is less than 10, the daily per capita W&RA METs decrease with the increase in the path length-to-width ratio. When the path length-to-width ratio is between 10 and 35, the daily per capita W&RA METs increase with the rise in path length-to-width ratio, reaching its peak at a ratio of 35. For ratios greater than 35, the daily per capita W&RA METs rapidly decrease with an increase in path length-to-width ratio.
Density of seating is negatively correlated with overall daily per capita W&RA METs. When the density of seating is less than 0.01 per square meter, daily per capita W&RA METs increase with the rise in the density of seating, reaching its peak at a density of 0.01 per square meter. When the density of seating ranges from 0.01 per square meter to 0.045 per square meter, daily per capita W&RA METs decrease with the increase in seating density, reaching a minimum at a density of 0.045 per square meter (Figure 4b).
3.2.3. Results of the Univariate OLS Regression Models for Spatial Perception Features
Density of streetlights is positively correlated with overall daily W&RA density. When the density of streetlights is less than 0.01 per square meter, the daily W&RA density exhibits a gradual decline with increasing streetlight density. With streetlight density ranging from 0.01 to 0.035 per square meter, daily W&RA density gradually increases, reaching its peak at a density of 0.035 per square meter. However, when the streetlight density exceeds 0.035 per square meter, daily W&RA density declines again with an increase in streetlight density.
Density of security facilities significantly influences both daily W&RA density and daily per capita W&RA METs. The impact of security facility density on daily W&RA density is generally positive. When the density of security facilities is less than 0.005 per square meter, daily W&RA density experiences an extremely slow decline with an increase in the density of security facilities. However, when the density of security facilities exceeds 0.005 per square meter, the daily W&RA density rapidly increases. On the other hand, the density of security facilities has an overall negative correlation with the daily per capita W&RA METs. When the density of security facilities is less than 0.01 per square meter, the daily per capita W&RA METs increase with rising safety facility density, reaching its peak at a density of 0.01 per square meter. Conversely, when the density of security facilities exceeds 0.01 per square meter, daily per capita W&RA METs decrease with an increase in safety facility density.
Sky view ratio also significantly influences both daily W&RA density and daily per capita W&RA METs. There is a positive overall correlation trend between the sky view ratio and daily W&RA density. When the sky view ratio is less than 0.025, daily W&RA density decreases with an increase in the sky view ratio. However, when the sky view ratio is between 0.025 and 0.125, the daily W&RA density rapidly increases with an increase in the sky view ratio. The sky view ratio has a weak negative correlation with the daily per capita W&RA METs. When the sky view ratio is less than 0.05, daily per capita W&RA METs show a gradual decline with increasing sky view ratio. When the sky view ratio exceeds 0.05, the daily per capita W&RA METs remain relatively stable with an increase in the sky view ratio (Figure 4c).
4. Discussion
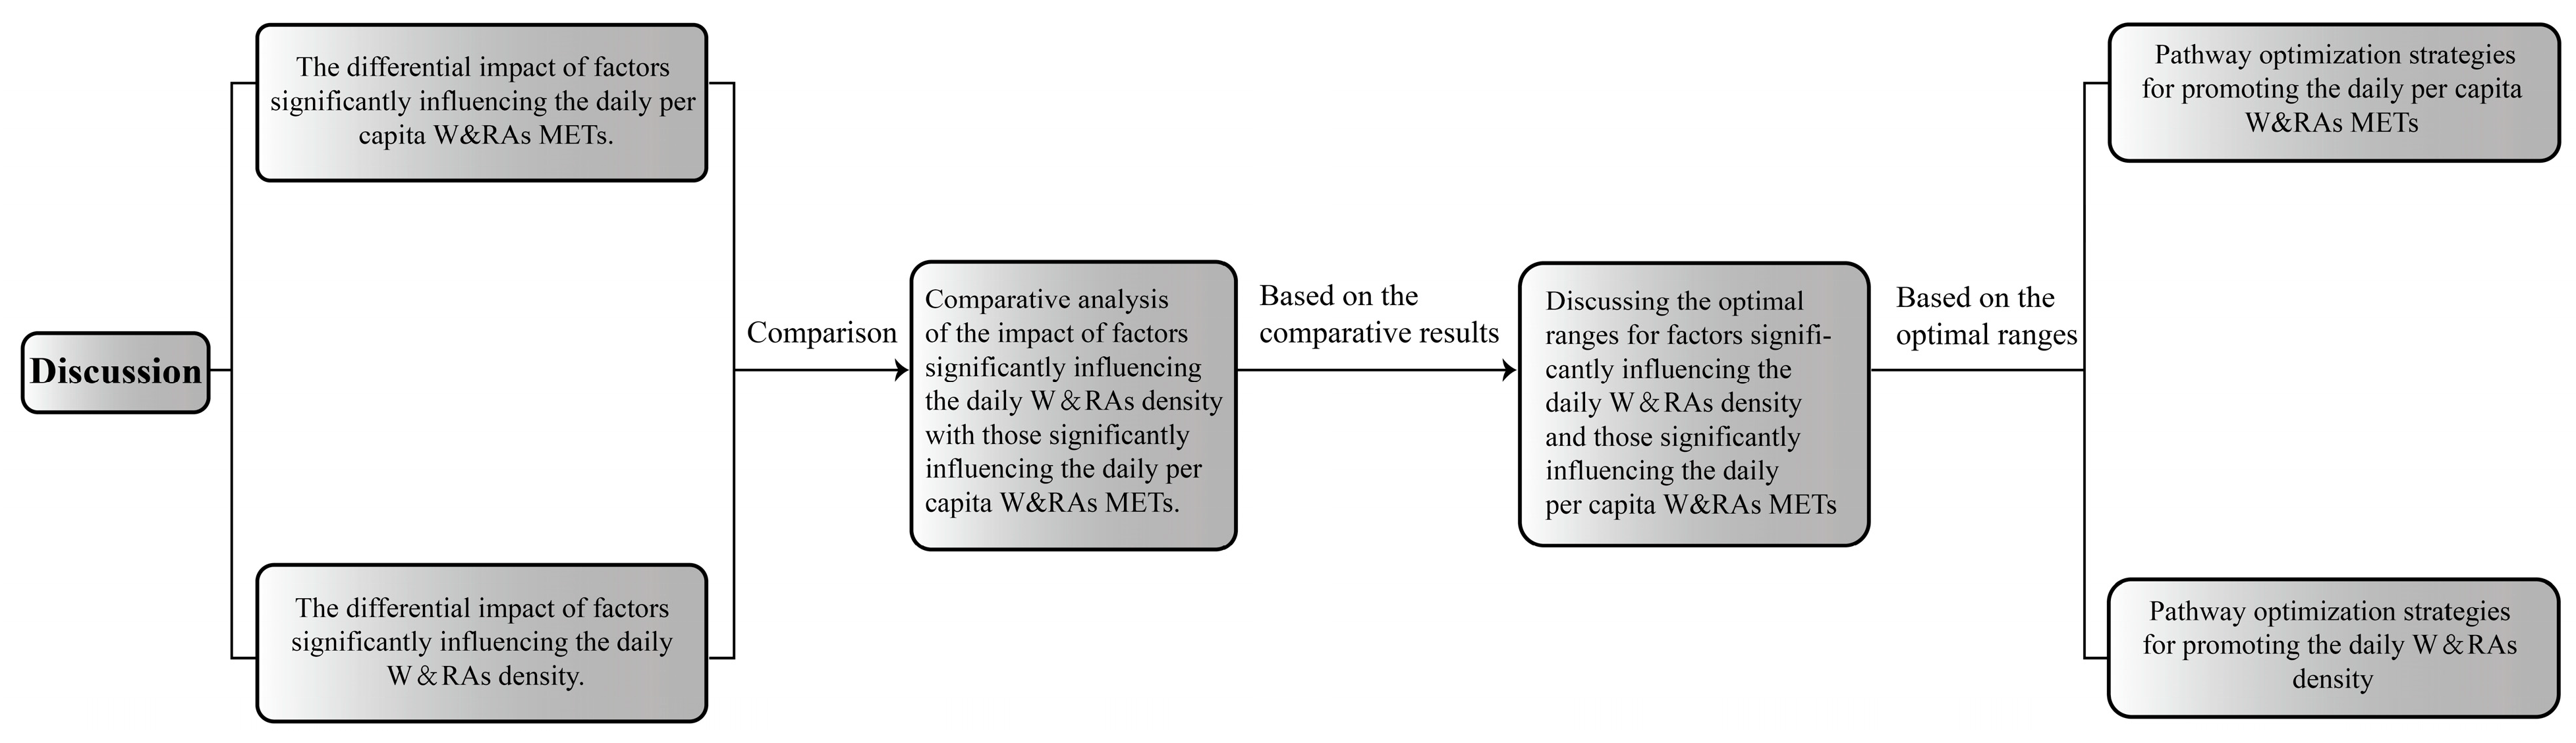
Figure 5 provides an illustrative overview of the discussion structure. We first discussed the differential impact of factors influencing daily W&RA density and daily per capita W&RA METs, comparing and contrasting their effects. Through this comparative discussion, we identified the most crucial influencing factors. Utilizing scatter plot results, we further explored the optimal ranges for these key factors in promoting W&RAs. Based on these findings, we ultimately proposed pathway optimization strategies to enhance W&RAs, aiming to provide insights for health-oriented urban park planning and design.
4.1. Factors Influencing Daily W&RA Density
Regarding the factors influencing daily W&RA density, pathway features significantly affecting the density are arranged in descending order based on their impact. These features include vegetation coverage ratio (Beta = 0.413), path type (Beta = 0.232), density of security facilities (Beta = 0.210), integration value (Beta = 0.205), density of streetlights (Beta = 0.195), sky view ratio (Beta = 0.154), and vegetation structure (Beta = −0.136). Among these, vegetation coverage ratio, path type, density of security facilities, integration value, density of streetlights, and sky view ratio demonstrate a positive impact on daily W&RA density. Higher vegetation coverage indicates a greener space, and existing research suggests that green spaces can alleviate stress, soothe emotions, and motivate people to engage in W&RAs [40]. Furthermore, the occurrence of W&RAs is associated with the quality of vegetation. Spaces with higher-quality vegetation promote the occurrence of W&RAs more effectively [22], indicating a close relationship between the quantity and quality of vegetation and W&RAs. To encourage the occurrence of W&RAs, attention should be paid not only to increasing vegetation coverage but also to vegetation selection, combination, and daily maintenance to enhance the quality of green spaces. Daily W&RA density is positively influenced by path type, suggesting that curved paths are more likely to attract W&RAs. This is because the observed W&RAs in our study mainly involve moderate-intensity activities such as strolling and slow walking, with the primary purpose of relaxation. Compared to high-intensity activities such as jogging and running, which focus more on exercise and fitness, these moderate-intensity activities prioritize the landscape and touring experience during the activity. Curved paths offer more varied scenic changes on both sides than straight paths, creating a richer visual experience for participants [41]. Both the density of security facilities and the density of streetlights have a positive impact on daily W&RA density, indicating that spaces with sufficient security facilities and good lighting are more likely to attract W&RA participants. Adequate lighting and well-equipped security facilities reduce potential safety risks during activities, boost the psychological sense of security for participants, and stimulate the willingness to engage in W&RAs [20]. Further studies indicate that W&RAs are more likely to occur in spaces with multiple lighting sources and diverse colors [42]. Integration value also has a positive impact on daily W&RA density. Higher integration value indicates better accessibility [15], a prerequisite for attracting participants to enter the space [43]. Additionally, the sky view ratio positively influences daily W&RA density. A larger visible sky range increases the quantity of W&RAs, and as the distance of W&RAs increases, the influence of a large visible sky range on daily W&RA density becomes stronger. This is because an open sky can help individuals alleviate psychological and physical stress, thereby improving quality of life [44].
Vegetation structure exhibits a negative impact on daily W&RA density, indicating that a complex vegetation structure is unfavorable for the occurrence of W&RAs. A possible explanation is that a complex vegetation structure may create a spatial environment with high canopy closure, obstructing lines of sight during activities [45]. Such spaces are associated with higher crime rates [46], compromising the safety of visitors. Conversely, a simple vegetation structure is more likely to attract W&RAs, such as open lawns and tree-lined squares. This is because open spaces provide clear lines of sight, accommodating a greater number of activities, and thereby enhancing the willingness of individuals to engage in W&RAs [33].
In addition, choice value, density of seating, green view ratio, water proximity, and path width did not exhibit significance in influencing daily W&RA density. The regression results for green view ratio, water proximity, and path width differed from expectations. Vegetation, as a critical natural element in parks, is generally believed to enhance people’s willingness to engage in PA [23,24,25,26]. In our study, green view ratio did not significantly affect daily W&RA density. However, the correlation analysis revealed a negative correlation between green view ratio and daily W&RA density, possibly due to the high levels of green view ratio in the plots (≥45%). An excessively high green view ratio may lead to a sense of insecurity among visitors [47], hindering the occurrence of W&RAs. Moreover, the green view ratio shows significant seasonal variations, and its impact on W&RAs may fluctuate. Studies in different regions [27,47] suggest that the impact of the green view ratio can be either positive or negative, influenced primarily by climate and seasonal changes. Water proximity is generally believed to attract more activities [26], but it did not significantly affect daily W&RA density in our study. The reason for this result may be that the water bodies selected in our study are relatively small and often appear in the form of artificial water features such as fountains and cascades, lacking significant appeal for W&RAs. Another explanation could be the abundant water resources in the Shanghai region, where the differences in water features among parks are not pronounced. In regions with scarce water resources, water features tend to have a stronger attraction for visitors [48]. Path width did not significantly affect daily W&RA density in our study. Previous research has indicated a significant positive influence of path width on W&RAs, with studies demonstrating a noticeable relationship between path width and the quantity of W&RAs typically involving differences of 5 m or more [49]. The selected width range for path segments in our study was 2.0–5.0 m, suggesting that subtle differences in path width are unlikely to impact the occurrence of W&RAs. Further research is needed to explore the path width intervals that result in significant differences in W&RA density.
4.2. Factors Influencing Daily per Capita W&RA METs
In terms of factors influencing daily per capita W&RA METs, the significant pathway features are arranged in descending order based on their impact. They are control value (Beta = 0.533), time required to reach the nearest entrance (Beta = −0.290), pavement type (Beta = 0.247), density of security facilities (Beta = 0.239), path length–width ratio (Beta = −0.196), density of seating (Beta = −0.174), sky view ratio (Beta = −0.168), and path type (Beta = −0.107). Among these, three features—control value, pavement type, and density of security facilities—demonstrate a positive impact on daily per capita W&RA METs. A higher control value indicates greater spatial importance, a central position within the spatial system, and closer connections with the surrounding space. Consequently, it is more likely to enhance the intensity of W&RAs [15]. The regression results for pavement type indicate that asphalt-paved paths contribute to higher daily per capita W&RA METs, suggesting that asphalt paving is more conducive to elevating the level of W&RAs compared to other paving materials. This finding aligns with previous research; Deleen et al. and Ettema emphasized the role of the “comfort” of path surfaces in influencing the frequency of running and the attractiveness of routes [17,18]. Similarly, the density of security facilities exhibits a significant positive impact, indicating that an ample provision of security facilities promotes higher levels of W&RAs. Security facilities create a secure, clean, and well-maintained environment, providing individuals with a sense of psychological security and are considered essential for an ideal running space [17]. In a Danish study, 33.4% of respondents believed that security facilities such as signs and traffic lights play a role in promoting W&RAs levels [21], supporting the conclusions drawn in our study.
Five pathway features, including time required to reach the nearest entrance, path length–width ratio, density of seating, sky view ratio, and path type, exhibit a negative impact. This suggests that the mentioned park features are not conducive to high-intensity W&RAs. The negative impact of the time required to reach the nearest entrance implies that high-intensity W&RAs tend to occur near the park entrance. High-intensity W&RAs, characterized by continuity, require spaces with clear pathways and minimal disturbances [50]. Our observations reveal that dedicated running tracks are typically situated along the periphery of parks. This layout is designed to minimize interference from other activities within the park on running exercises. The significant negative impact of path length–width ratio on daily per capita W&RA METs concurs with the findings of Hou [51]. Long and narrow paths contribute to a monotonous exercise experience, reducing the appeal and diversity of activities. In contrast, spacious paths provide more activity space, lower safety risks, and are more conducive to high-intensity activities [19]. The negative impact of the density of seating on daily per capita W&RA METs suggests that an abundance of seating decreases the intensity of W&RAs in the space. This is because seating, benches, and similar resting facilities offer visitors more opportunities to pause and engage in diverse activities, such as sitting, chatting, or playing instruments, maintaining the intensity of W&RAs at a lower level [25]. The unexpected negative impact of the sky view ratio contradicts prior research that demonstrated a positive association between the sky view ratio and PA levels as well as mental well-being [44]. Paths with higher intensity activities often have a greater sky view ratio, providing both a spacious exercise experience and increased sunlight for improved microclimates [27]. The differences between our study and previous conclusions may be influenced by vegetation and climatic conditions. For instance, in colder climates, open environments are believed to promote W&RAs [52], while in hotter regions, unshaded environments are less conducive to such activities [53]. The negative impact of path type implies that straight paths enhance the intensity of W&RAs. This is because when running along a curved path, individuals tend to lean towards the center of the curve, requiring additional centripetal force. At the same metabolic energy expenditure level, running speed on curved paths is significantly lower than on straight paths [54]. Straight paths not only minimize energy consumption but also provide clear directional guidance, making them more attractive for high-intensity W&RAs.
Additionally, density of streetlights, water proximity, and vegetation structure did not exhibit significance regarding daily per capita W&RA METs. The impact of streetlight density on daily per capita W&RA METs did not reach statistical significance. Through on-site observations, we noted that high-intensity W&RAs such as jogging and running often occurred between 14:00 and 16:00. Perception of lighting among park visitors may be influenced by the time of day, potentially contributing to the non-significant regression results. The effects of vegetation structure and water proximity were also found to be non-significant. This could be attributed to the regulation of vegetation’s impact on W&RAs by factors such as seasonal changes and climatic conditions [27]. Despite the belief that abundant vegetation and water features may enhance people’s willingness to engage in activities [55], they do not appear to significantly influence the intensity of W&RAs.
4.3. Comparison of Factors Influencing Daily W&RA Density and Daily per Capita W&RA METs
Upon examination of the standardized coefficients of the influencing factors in the regression model, it is evident that, overall, daily W&RA density is primarily influenced by natural elements and safety perception features. Spatial safety is a prerequisite for visitors engaging in activities within a space [29]. Lower spatial safety, such as insufficient security facilities, can heighten people’s alertness and potentially pose risks to users, thereby reducing the willingness of individuals to participate in W&RAs [56]. Additionally, aesthetically pleasing natural elements have been proven to have a positive correlation with W&RAs. The larger the proportion of natural elements, the higher users rate their aesthetic appeal, facilitating the occurrence of W&RAs [28]. In contrast, daily per capita W&RA METs are more significantly influenced by spatial topology, spatial form, and facilities. In other words, spatial organizational relationships and spatial place features dominate the intensity of W&RAs within the space. It is evident that spatial safety and beautiful natural scenery are crucial for enhancing visitors’ willingness to engage in W&RAs. To increase the intensity of such activities, there is a need for greater attention to spatial organization, spatial form optimization, and the configuration of functional facilities.
Among the significant influencing factors, we observed that three pathway features, namely path type, sky view ratio, and density of security facilities, simultaneously exert significant effects on both daily W&RA density and daily per capita W&RA METs. Specifically, path type and sky view ratio exhibit a significant positive influence on daily W&RA density. However, they manifest a significantly negative impact on daily per capita W&RA METs, indicating that a winding road and expansive skies promote the quantity of W&RAs while maintaining the intensity of W&RAs at a lower level. This is conducive to accommodating activities with a larger number of participants and lower intensity, such as strolling and slow walking. Therefore, in the spatial design of urban park paths, emphasis should be placed on creating winding paths and open scenic views. The density of security facilities shows a significant positive impact on both daily W&RA density and daily per capita W&RA METs. This implies that an ample provision of security facilities not only attracts more W&RA participants but also enhances the intensity of these activities. Once again, this reaffirms that spatial safety is a prerequisite for visitors engaging in activities within a space [29]. Regardless of the design of paths, safety should be a primary consideration. Specifically, crime-related safety can be enhanced by increasing the number of cameras and reducing visual blind spots created by tall trees [30]. Environmental safety can be ensured through the configuration of security facilities such as traffic lights and signs, as well as amenities like paved surfaces, handrails, and fences [31].
4.4. Optimal Range of Factors Influencing Daily W&RA Density and Daily per Capita W&RA METs
Our study discusses the differences in the impact of various pathway features on the density and intensity of W&RAs at a global level. Building upon this, the study further constructs univariate OLS regression models to explore the optimal range of each pathway feature. The results reveal that the trends and intensities of the effects of these features on the density and intensity of W&RAs in univariate OLS regression models are consistent with the global model results. However, factors such as control value, path length-to-width ratio, density of seating, density of streetlights, density of security facilities, and sky view ratio do not exhibit a linear impact on the density and intensity of W&RAs. Instead, they show specific positive and negative impact intervals.
The control value exhibits a basic positive correlation with daily per capita W&RA METs. Since there is only one survey plot where the control value exceeds 2.5, the model results can only reflect the trend of daily per capita W&RA METs when the control value is within a range from 0 to 3.0. The positive impact interval is from 0 to 1.3, and the negative impact interval is from 1.3 to 2.5. A higher spatial control value implies a greater influence of that space on adjacent areas, designating it as a primary space within the spatial system [15]. The model results indicate that both excessively high and low spatial control values are unfavorable for enhancing the intensity of W&RAs. Therefore, we infer that spaces with high levels of W&RA intensity are more likely to occur in sub-central spaces within the spatial system, where spaces with a moderate number of adjacent spaces. Taking the example of an urban park in a high-density urban area of 7–10 hectares, conducive to high-intensity W&RAs, its suitable control value is around 1.3.
Path length-to-width ratio exhibits a predominantly negative correlation with daily per capita W&RA METs. Since there is only one survey plot where the path length-to-width ratio is less than 10, the model results can only reflect the trend of daily per capita W&RA METs when the ratio ranges from 10 to 50. The positive impact interval is from 10 to 35, and the negative impact interval is from 35 to 50. The model results indicate that when path length-to-width ratio is maintained within the 10–35 range, the intensity of W&RAs within the space can be sustained at a higher level. Additionally, when the path length-to-width ratio reaches around 35, the intensity of W&RAs within the space can reach its highest level, further promoting activities such as jogging and running. However, when path length-to-width ratio exceeds 35, daily per capita W&RA METs within the space rapidly decline, hindering the enhancement of activity intensity. This result provides an appropriate path length-to-width ratio conducive to increasing W&RA intensity. For example, for a 5 m-wide path, its length should ideally not exceed 175 m to avoid causing a fatiguing exercise experience.
Density of seating demonstrates a primarily negative correlation with daily per capita W&RA METs. Since there is only one survey plot where the seat density exceeds 0.03 per square meter, the model results can only reflect the trend of daily per capita W&RA METs when seat density is less than or equal to 0.03 per square meter. The positive impact interval is from 0.00 to 0.01 per square meter, and the negative impact interval is from 0.01 to 0.03 per square meter. The model results indicate that a lower density of seating in the space is more conducive to enhancing W&RA intensity. For example, for an urban park in a high-density urban area covering 7–10 hectares, the suitable seating density for spaces promoting high-intensity W&RAs is approximately 0.01 per square meter.
Density of streetlights exhibits a primarily positive correlation with daily W&RA density. The model results reflect the trend of daily W&RA density when streetlight density is in the range of 0.00–0.04 per square meter. The positive impact interval is from 0.010 to 0.035 per square meter, while the negative impact interval is 0.00–0.01 per square meter and 0.035–0.040 per square meter. The model results indicate that insufficient or excessive streetlight density reduces willingness to engage in W&RAs. The presence of a moderate number of streetlights in a space is more conducive to the occurrence of W&RAs. Taking an urban park in a high-density urban area covering 7–10 hectares as an example, the suitable streetlight density for spaces promoting the quantity of W&RAs is approximately 0.035 per square meter.
Both density of security facilities and sky view ratio have simultaneous effects on daily W&RA density as well as daily per capita W&RA METs. The density of security facilities is generally positively correlated with daily W&RA density and negatively correlated with daily per capita W&RA METs. The model results reflect the trends of daily W&RA density and daily per capita W&RA METs when the density of security facilities is in the range of 0.00–0.02 per square meter. The results indicate that when the density of security facilities is in the range of 0.010–0.013 per square meter, both W&RA density and intensity can reach higher levels. Within this range, it is possible to increase the quantity of W&RAs on the basis of a relatively small impact on W&RA intensity. Taking an urban park in a high-density urban area covering 7–10 hectares as an example, maintaining the density of security facilities within the range of 0.010–0.013 per square meter can promote the quantity of W&RAs while maintaining W&RA intensity at a higher level.
Sky view ratio is generally positively correlated with daily W&RA density and negatively correlated with daily per capita W&RA METs. As the overall level of sky view ratio in the surveyed plots is relatively low, the model results can only reflect the trends of daily W&RA density and daily per capita W&RA METs when the sky view ratio is low (0.000–0.125). The results indicate that when the sky view ratio is in the range of 0.035–0.125, both the quantity and intensity of W&RAs can reach higher levels, allowing for a rapid increase in W&RAs quantity with a relatively small impact on W&RA intensity. Using an urban park in a high-density urban area covering 7–10 hectares as an example, maintaining the sky view ratio within the range of 0.035–0.125 can simultaneously promote the number and intensity of W&RAs. However, further exploration is needed to understand the impact of high levels of sky view ratio on W&RA density and intensity.
Our study, through the construction of univariate OLS regression models and the analysis of scatter plots, explores the optimal range of various pathway features for the density and intensity of W&RAs. The optimal ranges for the mentioned features can serve as references for the spatial design of urban parks in high-density urban areas in Asia. However, due to the limitations of the surveyed parks and plots, these optimal ranges may not be applicable to other countries or regions. In the future, it is essential to strengthen cross-regional comparative studies on urban park pathway features under different climatic conditions.
4.5. Pathway Optimization Strategies
Under the premise of ensuring the multi-functional use of urban parks, optimization and enhancement strategies are proposed for pathway spaces oriented towards W&RAs. Based on quantitative analysis clues, selected pathway plots within the park are used for design optimization demonstrations. By setting specific pathway plots the plot to be optimized and reference pathway plots, optimization strategies are proposed through the comparison of key pathway features.
4.5.1. Pathway Optimization Strategies to Promote W&RA Density
Based on the discussion of pathway features that significantly impact daily W&RA density and their optimal ranges, selected plots within the same park with significant differences in W&RA density are chosen for optimization and transformation demonstrations. Using plot 4 in Xujiahui Park as the plot to be optimized and plot 5 as the reference plot, optimization strategies are proposed to promote W&RA density without changing their location conditions and morphological features. These strategies include increasing spatial openness, providing appropriate lighting and safety facilities and simplifying vegetation structure to create visually clear and aesthetically appealing pathway spaces, attracting more W&RA participants (Table 8).
- (1)
- Increase spatial openness to create an open activity field of vision
This is mainly achieved through adjustments in roadside trees, selecting combinations of deciduous and evergreen trees with higher branching points to create as open a top boundary surface as possible. Based on quantitative analysis results, it is recommended that the sky view ratio be maintained within the range of 3.5–12.5% in Xujiahui Park sample 4 to ensure clear visibility for people engaged in W&RA activities. Simultaneously, enhance pruning and management of plants to avoid excessive growth of roadside trees leading to excessively low sky view ratio.
- (2)
- Equip lighting and safety facilities to ensure activity safety
Combine appropriate lighting and safety facilities along the pathway border. Based on quantitative analysis results, we recommend adding 1 group of streetlights and 2 groups of safety facilities in Xujiahui Park sample 4, maintaining the streetlight density and safety facility density at 0.035/m2 and 0.013/m2, respectively, to ensure sufficient lighting and safety for the pathway. Additionally, attention should be paid to the choice of light source color and brightness, using a mix of warm and cool light colors and increasing lighting brightness to promote W&RAs [20].
- (3)
- Simplify vegetation structure to enhance visual connections
Based on quantitative analysis results, we suggest appropriately reducing the proportion of shrub greenery and increasing the area of lawns and ground cover in Xujiahui Park sample 4. This creates a double-layered vegetation structure dominated by trees and ground cover, forming a more open facade space to strengthen visual connections with other spaces and improve pathway accessibility.
4.5.2. Pathway Optimization Strategies to Promote W&RA Intensity
Based on the discussion of pathway features and optimal ranges that significantly impact daily per capita W&RA METs, we selected plots from the same park with significant differences in W&RA intensity for optimization and transformation demonstrations. Using Lujiazui Central Green Plot 5 as the plot to be optimized and Lujiazui Central Green Plot 2 as the reference plot, we proposed strategies to enhance the intensity of W&RAs on the pathway without changing their location conditions and morphological characteristics. The strategies include enhancing the ground pavement for W&RAs, adjusting the ratio of safety facilities and seats, increasing visual length of pathways, and providing ample tree shade, creating a pathway space with some shelter and conducive to high-intensity W&RAs (Table 9).
- (1)
- Enhancing the Ground Pavement for W&RAs
Based on quantitative analysis results, we recommend replacing the brick pavement with asphalt pavement in Lujiazui Central Green Plot 5. Simultaneously, with the use of spray-painted mile markers and a sports guidance system on the ground pavement, distances between different points in the park and information on energy consumption during activities are visualized. This encourages users to engage in W&RAs, providing a better exercise experience.
- (2)
- Adjusting the Ratio of Safety Facilities and Seats to Minimize Disturbance
Appropriately reduce the number of existing seats and add a suitable number of safety facilities along the pathway, such as monitoring devices and railings, to enhance the safety of W&RAs. Based on quantitative analysis results, we recommend reducing the number of seats in Lujiazui Central Green Plot 5 to three groups and adding two groups of safety facilities, maintaining seat density and safety facility density at 0.01 per square meter. This reduces interference with high-intensity W&RAs while enhancing safety.
- (3)
- Increasing Visual Length and Tree Shade for Pathways, Creating a Positive Activity Experience
Achieve this by adding plants along the pathway to partially obstruct the line of sight, reducing the visible range of the pathway. This creates a visual illusion of a long and narrow pathway, reducing sky view ratio and causing a visual illusion of continuous movement space for high-intensity walkers and runners. Based on quantitative analysis results, we recommend maintaining a length-to-width ratio of around 35:1 for the pathway in Lujiazui Central Green Plot 5. This involves planting a row of tall deciduous trees along the pathway, 2 m away from the pathway centerline in the direction of pathway travel. This enhances the length-to-width ratio without affecting the multi-purpose use of the pathway. It is important to choose tree species with a small trunk diameter, high branching points, dense foliage, and a large crown, providing more tree shade while minimizing occupation of the pathway ground space.
4.6. Research Contributions and Limitations
Our study makes significant contributions on three fronts. Firstly, it conducted year-long field observations for data collection, thereby mitigating errors stemming from variables such as climate, seasons, day–night cycles, weekdays, and weekends. The extensive dataset facilitated a thorough exploration of the influence of urban park pathway features on W&RAs, incorporating both objective and subjective aspects associated with spatial organization, place, and perception. Secondly, the study delves into the impact of urban park pathway features on W&RAs from a micro-perspective, identifying optimal ranges of pathway features with a focus on promoting health. This addresses a gap in prior research that often lacked a nuanced examination of specific physical activity types and internal features of green open spaces. Lastly, the study concurrently investigates the effects of urban park pathway features on both the density and intensity of W&RAs, striving for a more comprehensive understanding of how these features shape such activities and avoiding potential discrepancies arising from a singular focus.
Nevertheless, the study is subject to certain limitations. Firstly, its cross-sectional design constrains the establishment of causal relationships. Secondly, the study exclusively examines the overall impact of urban park pathway features on the density and intensity of W&RAs at a global level. In reality, variations in the temporal and spatial utilization of pathways within urban parks exist. Subsequent research is imperative to categorize different types of pathways within urban parks, discerning differences in influencing factors across various spatial types. Thirdly, the study is confined to three urban parks in Shanghai, and variations in park construction, living habits, and other factors across different regions and countries may yield disparate results. Therefore, the findings of our study may not be universally applicable, and future research should amplify cross-regional comparative studies on park spaces.
5. Conclusions
This study focused on pathways within three urban parks in Shanghai, utilizing mathematical models to investigate the influence of urban park pathway features on the density and intensity of W&RAs and proposing specific pathway optimization strategies. The research aimed to establish optimal ranges for various pathway features and to elucidate the underlying mechanisms through which these features impact W&RAs. The findings contribute quantifiable insights to inform the construction of high-quality urban park pathways. The study discerned that daily W&RA density is predominantly shaped by natural elements and safety perception features, while daily per capita W&RA METs are chiefly influenced by spatial topology, spatial form, and facilities. Noteworthy factors attracting higher W&RAs participation encompass abundant vegetation cover, curved paths, sufficient security facilities and lighting, good accessibility, open skies, and simple vegetation structures. Conversely, elements enhancing the intensity of W&RAs include connectivity to the surroundings, asphalt pavement, ample security facilities, proximity to entrances, spacious paths, a limited number of seats, less open skies, and straight paths. Therefore, prioritizing these influential factors in the design of urban park pathways is crucial for fostering W&RAs, promoting public health, and creating versatile exercise environments that cater to diverse citizen needs. The study’s conclusions provide valuable insights and foundational guidance for the design and development of urban park spaces in densely populated Asian cities, ultimately contributing to the enhancement of public health.
Author Contributions
Conceptualization, J.C., D.C. and L.W.; methodology, J.C.; software, J.C.; validation, Z.T. and W.W.; formal analysis, J.C.; investigation, J.C. and Z.T.; data curation, J.C.; writing—original draft preparation, J.C.; writing—review and editing, Z.T.; visualization, J.C.; supervision, D.C. and L.W.; funding acquisition, D.C. All authors have read and agreed to the published version of the manuscript.
Funding
This research was funded by National Natural Science Foundation of China, grant number 32001361.
Data Availability Statement
The raw data supporting the conclusions of this article will be made available by the authors on request.
Conflicts of Interest
The authors declare no conflicts of interest.
References
- World Health Organization. Global Report on Urban Health. Available online: https://www.who.int/publications/i/item/9789241565271 (accessed on 3 September 2023).
- Jackson, L.E. The relationship of urban design to human health and condition. Landsc. Urban Plan. 2003, 64, 191–200. [Google Scholar] [CrossRef]
- Warburton, D.E.; Charlesworth, S.; Ivey, A.; Nettlefold, L.; Bredin, S.S. A systematic review of the evidence for Canada’s Physical Activity Guidelines for Adults. Int. J. Behav. Nutr. Phys. Act. 2010, 7, 39. [Google Scholar] [CrossRef]
- World Health Organization. Global Health Risks: Mortality and Burden of Disease Attributable to Selected Major Risks. Available online: https://www.who.int/publications/i/item/9789241563871 (accessed on 3 September 2023).
- Boarnet, M.G. About this issue: Planning’s role in building healthy cities: An introduction to the special issue. J. Am. Plan. Assoc. 2006, 72, 5–9. [Google Scholar] [CrossRef]
- Piercy, K.L.; Troiano, R.P.; Ballard, R.M.; Carlson, S.A.; Fulton, J.E.; Galuska, D.A.; George, S.M.; Olson, R.D. The physical activity guidelines for Americans. JAMA 2018, 320, 2020–2028. [Google Scholar] [CrossRef]
- Xiao, M. Strengthening Physical Activity and Preventing Chronic Diseases Viewing from the Perspective of “Healthy China”. Sport Sci. Technol. 2020, 3, 18–20. [Google Scholar] [CrossRef]
- Althoff, T.; Sosič, R.; Hicks, J.L.; King, A.C.; Delp, S.L.; Leskovec, J. Large-scale physical activity data reveal worldwide activity inequality. Nature 2017, 547, 336–339. [Google Scholar] [CrossRef]
- Garber, C.E.; Blissmer, B.; Deschenes, M.R.; Franklin, B.A.; Lamonte, M.J.; Lee, I.M.; Nieman, D.C.; Swain, D.P. Quantity and quality of exercise for developing and maintaining cardiorespiratory, musculoskeletal, and neuromotor fitness in apparently healthy adults: Guidance for prescribing exercise. Med. Sci. Sports Exerc. 2017, 43, 1334–1359. [Google Scholar] [CrossRef]
- Schmidt, T.; Kerr, J.; Schipperijn, J. Associations between neighborhood open space features and walking and social interaction in older adults—A mixed methods study. Geriatrics 2019, 4, 41. [Google Scholar] [CrossRef]
- Veitch, J.; Ball, K.; Rivera, E.; Loh, V.; Deforche, B.; Best, K.; Timperio, A. What entices older adults to parks? Identification of park features that encourage park visitation, physical activity, and social interaction. Landsc. Urban Plan. 2022, 217, 104254. [Google Scholar] [CrossRef]
- Van Puyvelde, A.; Deforche, B.; Mertens, L.; Rivera, E.; Van Dyck, D.; Veitch, J.; Poppe, L. Park features that encourage park visitation among older adults: A qualitative study. Urban For. Urban Green. 2023, 86, 128026. [Google Scholar] [CrossRef]
- Kowaleski-Jones, L.; Fan, J.X.; Wen, M.; Hanson, H. Neighborhood context and youth physical activity: Differential associations by gender and age. Am. J. Health Promot. 2017, 31, 426–434. [Google Scholar] [CrossRef] [PubMed]
- Kaczynski, A.T.; Besenyi, G.M.; Stanis, S.A.; Koohsari, M.J.; Oestman, K.B.; Bergstrom, R.; Potwarka, L.R.; Reis, R.S. Are park proximity and park features related to park use and park-based physical activity among adults? Variations by multiple socio-demographic characteristics. Int. J. Behav. Nutr. Phys. Act. 2014, 11, 146. [Google Scholar] [CrossRef] [PubMed]
- Hou, Y.; Zhao, X.; Zhang, B. Significance Analysis between Morning Exercise and Spatial Organization Characteristics of Urban Park—Taking 4 Urban Parks in Harbin for Example. Landsc. Archit. 2017, 2, 109–116. [Google Scholar] [CrossRef]
- Koohsari, M.J.; Kaczynski, A.T.; Mcormack, G.R.; Sugiyama, T. Using space syntax to assess the built environment for physical activity: Applications to research on parks and public open spaces. Leis. Sci. 2014, 36, 206–216. [Google Scholar] [CrossRef]
- Deelen, I.; Janssen, M.; Vos, S.; Kamphuis, C.B.; Ettema, D. Attractive running environments for all? A cross-sectional study on physical environmental characteristics and runners’ motives and attitudes, in relation to the experience of the running environment. BMC Public Health 2019, 19, 366. [Google Scholar] [CrossRef] [PubMed]
- Ettema, D. Runnable cities: How does the running environment influence perceived attractiveness, restorativeness, and running frequency? Environ. Behav. 2016, 48, 1127–1147. [Google Scholar] [CrossRef]
- Zhai, Y.; Li, D.; Wu, C.; Wu, H. Urban park facility use and intensity of seniors’ physical activity—An examination combining accelerometer and GPS tracking. Landsc. Urban Plan. 2021, 205, 103950. [Google Scholar] [CrossRef]
- Hu, B.; Zhao, J. Factors promoting nature-based outdoor recreation during the daytime and evening. J. Outdoor Recreat. Tour. 2022, 40, 100572. [Google Scholar] [CrossRef]
- Schipperijn, J.; Bentsen, P.; Troelsen, J.; Toftager, M.; Stigsdotter, U.K. Associations between physical activity and characteristics of urban green space. Urban For. Urban Green. 2013, 12, 109–116. [Google Scholar] [CrossRef]
- Chiang, Y.C.; Weng, P.Y.; Li, D.; Ho, L.C. Quantity and quality: Role of vegetation in park visitation and physical activity. Landsc. Ecol. Eng. 2023, 19, 337–350. [Google Scholar] [CrossRef]
- Rivera, E.; Timperio, A.; Loh, V.H.; Deforche, B.; Veitch, J. Critical factors influencing adolescents’ active and social park use: A qualitative study using walk-along interviews. Urban For. Urban Green. 2021, 58, 126948. [Google Scholar] [CrossRef]
- Christian, H.; Lester, L.; Trost, S.G.; Trapp, G.; Schipperijn, J.; Boruff, B.; Maitland, C.; Jeemi, Z.; Rosenberg, M.; Barber, P.; et al. Shade coverage, ultraviolet radiation and children’s physical activity in early childhood education and care. Int. J. Public Health 2019, 64, 1325–1333. [Google Scholar] [CrossRef]
- Chen, Y.; Liu, X.; Gao, W.; Wang, R.Y.; Li, Y.; Tu, W. Emerging social media data on measuring urban park use. Urban For. Urban Green. 2018, 31, 130–141. [Google Scholar] [CrossRef]
- Zhang, S.; Zhou, W. Recreational visits to urban parks and factors affecting park visits: Evidence from geotagged social media data. Landsc. Urban Plan. 2018, 180, 27–35. [Google Scholar] [CrossRef]
- Zhao, X.; Hou, Y.; Qiu, X.; Lv, F. The Study on Morphological Characteristics of Pathway in Urban Parks Based on Walking and Running Capacity—A Case of Harbin City. Chin. Landsc. Archit. 2019, 6, 12–17. [Google Scholar] [CrossRef]
- Brownson, R.C.; Baker, E.A.; Housemann, R.A.; Brennan, L.K.; Bacak, S.J. Environmental and policy determinants of physical activity in the United States. Am. J. Public Health 2001, 91, 1995–2003. [Google Scholar] [CrossRef]
- Weimann, H.; Rylander, L.; van den Bosch, M.A.; Albin, M.; Skärbäck, E.; Grahn, P.; Björk, J. Perception of safety is a prerequisite for the association between neighborhood green qualities and physical activity: Results from a cross-sectional study in Sweden. Health Place 2017, 45, 124–130. [Google Scholar] [CrossRef] [PubMed]
- Foster, S.; Giles-Corti, B. The built environment, neighborhood crime and constrained physical activity: An exploration of inconsistent findings. Prev. Med. 2008, 47, 241–251. [Google Scholar] [CrossRef] [PubMed]
- Molnar, B.E.; Gortmaker, S.L.; Bull, F.C.; Buka, S.L. Unsafe to play? Neighborhood disorder and lack of safety predict reduced physical activity among urban children and adolescents. Am. J. Health Promot. 2004, 18, 378–386. [Google Scholar] [CrossRef] [PubMed]
- Zhai, Y.; Baran, P.K.; Wu, C. Can trail spatial attributes predict trail use level in urban forest park? An examination integrating GPS data and space syntax theory. Urban For. Urban Green. 2018, 29, 171–182. [Google Scholar] [CrossRef]
- Paydar, M.; Kamani Fard, A.; Gárate Navarrete, V. Design Characteristics, Visual Qualities, and Walking Behavior in an Urban Park Setting. Land 2023, 12, 1838. [Google Scholar] [CrossRef]
- McCormack, G.R.; Rock, M.; Toohey, A.M.; Hignell, D. Characteristics of urban parks associated with park use and physical activity: A review of qualitative research. Health Place 2010, 16, 712–726. [Google Scholar] [CrossRef] [PubMed]
- Paudel, C.; Timperio, A.; Loh, V.; Deforche, B.; Salmon, J.; Veitch, J. Understanding the relative importance of micro-level design characteristics of walking paths in parks to promote walking among older adults. Urban For. Urban Green. 2023, 89, 128129. [Google Scholar] [CrossRef]
- Ma, M.; Mugerauer, B.; Cai, Z. Research on the Determinants of Urban Open Green Space Design Affecting the Physical Activity from the Perspective of Health. Landsc. Archit. 2018, 4, 92–97. [Google Scholar] [CrossRef]
- Penn, A. Space syntax and spatial cognition: Or why the axial line? Environ. Behav. 2003, 35, 30–65. [Google Scholar] [CrossRef]
- Zhai, Y.; Baran, P. Application of space syntax theory in study of urban parks and walking. In Proceedings of the Ninth International Space Syntax Symposium 2013, Seoul, Republic of Korea, 31 October–3 November 2013; Sejong University Press: Seoul, Republic of Korea, 2013; Volume 32, pp. 1–13. Available online: http://sss9sejong.or.kr/paperpdf/gusd/SSS9_2013_REF032_P.pdf (accessed on 17 January 2024.).
- Ainsworth, B.E.; Haskell, W.L.; Herrmann, S.D.; Meckes, N.; Bassett, D.R., Jr.; Tudor-Locke, C.; Greer, J.L.; Vezina, J.; Whitt-Glover, M.C.; Leon, A.S. 2011 Compendium of Physical Activities: A second update of codes and MET values. Med. Sci. Sports Exerc. 2011, 43, 1575–1581. [Google Scholar] [CrossRef]
- Liu, H.; Li, F.; Li, J.; Zhang, Y. The relationships between urban parks, residents’ physical activity, and mental health benefits: A case study from Beijing, China. J. Environ. Manag. 2017, 190, 223–230. [Google Scholar] [CrossRef] [PubMed]
- Shayestefar, M.; Pazhouhanfar, M.; van Oel, C.; Grahn, P. Exploring the Influence of the Visual Attributes of Kaplan’s Preference Matrix in the Assessment of Urban Parks: A Discrete Choice Analysis. Sustainability 2022, 14, 7357. [Google Scholar] [CrossRef]
- Hagerhall, C.M. Clustering predictors of landscape preference in the traditional Swedish cultural landscape: Prospect-refuge, mystery, age and management. J. Environ. Psychol. 2000, 20, 83–90. [Google Scholar] [CrossRef]
- Wang, B.; Zhen, F.; Zhang, H. The Dynamic Changes of Urban Space-time Activity and Activity Zoning Based on Check-in Data in Sina Web. Sci. Geogr. Sin. 2015, 2, 151–160. [Google Scholar] [CrossRef]
- He, H.; Lin, X.; Yang, Y.; Lu, Y. Association of street greenery and physical activity in older adults: A novel study using pedestrian-centered photographs. Urban For. Urban Green. 2020, 55, 126789. [Google Scholar] [CrossRef]
- Nasiri, M.; Pourmajidian, M.R. Effects of vegetation type and horizontal curve radius on the rate of tree pruning to provide line of sight on main access roads. J. For. Sci. 2014, 60, 208–211. [Google Scholar] [CrossRef]
- Badiora, A.I.; Dada, O.T.; Adebara, T.M. Correlates of crime and environmental design in a Nigerian international tourist attraction site. J. Outdoor Recreat. Tour. 2021, 35, 100392. [Google Scholar] [CrossRef]
- Mak, B.K.; Jim, C.Y. Examining fear-evoking factors in urban parks in Hong Kong. Landsc. Urban Plan. 2018, 171, 42–56. [Google Scholar] [CrossRef]
- Lyu, F.; Zhang, L. Using multi-source big data to understand the factors affecting urban park use in Wuhan. Urban For. Urban Green. 2019, 43, 126367. [Google Scholar] [CrossRef]
- Kim, S.; Choi, J.; Kim, Y. Determining the sidewalk pavement width by using pedestrian discomfort levels and movement characteristics. KSCE J. Civ. Eng. 2011, 15, 883–889. [Google Scholar] [CrossRef]
- Schuurman, N.; Rosenkrantz, L.; Lear, S.A. Environmental preferences and concerns of recreational road runners. Int. J. Environ. Res. Public Health 2021, 18, 6268. [Google Scholar] [CrossRef] [PubMed]
- Hou, Y. Research on Park Characteristics Identification and Optimization Pattern Based on Leisure Physical Activity. Ph.D. Thesis, Harbin Institute of Technology, Harbin, China, 2019. [Google Scholar] [CrossRef]
- Zhao, X.; Bian, Q.; Hou, Y.; Zhang, B. A Research on the Correlation between Physical Activity Performance and Thermal Comfortable of Urban Park in Cold Region. Chin. Landsc. Archit. 2019, 4, 80–85. [Google Scholar] [CrossRef]
- Huang, H.; Wei, L. Environment Factors to Park Thermal Comfort of the Elderly in Hot and Humid Areas. J. Chin. Urban For. 2023, 1, 13–19. [Google Scholar] [CrossRef]
- Taboga, P.; Kram, R. Modelling the effect of curves on distance running performance. PeerJ 2019, 7, e8222. [Google Scholar] [CrossRef]
- Petrunoff, N.A.; Edney, S.; Yi, N.X.; Dickens, B.L.; Joel, K.R.; Xin, W.N.; Sia, A.; Leong, D.; van Dam, R.M.; Cook, A.R.; et al. Associations of park features with park use and park-based physical activity in an urban environment in Asia: A cross-sectional study. Health Place 2022, 75, 102790. [Google Scholar] [CrossRef] [PubMed]
- Soma, Y.; Tsunoda, K.; Kitano, N.; Jindo, T.; Tsuji, T.; Saghazadeh, M.; Okura, T. Relationship between built environment attributes and physical function in Japanese community-dwelling older adults. Geriatr. Gerontol. Int. 2017, 17, 382–390. [Google Scholar] [CrossRef] [PubMed]
Figure 1.
Workflow for the research.

Figure 2.
Park locations and spatial distribution of plots. (a) Park locations. (b) Distribution of plots in Xu Jiahui Park. (c) Distribution of plots in Fu Xing Park. (d) Distribution of plots in Lujiazui Center Green.
Figure 2.
Park locations and spatial distribution of plots. (a) Park locations. (b) Distribution of plots in Xu Jiahui Park. (c) Distribution of plots in Fu Xing Park. (d) Distribution of plots in Lujiazui Center Green.

Figure 3.
Example of data collection for pathway features of plots: (a) Xu Jiahui Park No.5 Plot; (b) Fu Xing Park No.1 Plot; (c) Lujiazui Center Green No.2 Plot.
Figure 3.
Example of data collection for pathway features of plots: (a) Xu Jiahui Park No.5 Plot; (b) Fu Xing Park No.1 Plot; (c) Lujiazui Center Green No.2 Plot.

Figure 4.
Scatter plots for each pathway feature. (a) Scatter plots of spatial organization features. (b) Scatter plots of spatial place features. (c) Scatter plots of spatial perception features.
Figure 4.
Scatter plots for each pathway feature. (a) Scatter plots of spatial organization features. (b) Scatter plots of spatial place features. (c) Scatter plots of spatial perception features.

Figure 5.
Discussion Summary Flowchart.

Table 1.
Urban park pathway features’ definitions and description.
| Levels | Indicators | Specific Indicator Factors | Definition | Data Source | Calculation Method |
|---|---|---|---|---|---|
| Spatial Organization Features | Spatial topology | Integration value | The degree of spatial closeness to other spaces | OpenStreetMap | Average integration of each line segment in the plot |
| Choice value | The number of times the space appears on the shortest topological path | OpenStreetMap | Average choice value of each line segment in the plot | ||
| Control value | The reciprocal sum of the connection values to directly connected spaces | OpenStreetMap | Average control value of each line segment in the plot | ||
| Accessibility | Time required to reach the nearest entrance | Time required to reach the nearest entrance at a speed of 1.5 m/s | Field Survey | Using a timer to record the time required for movement at a speed of 1.5 m/s | |
| Spatial Place Features | Spatial form | Path width | / | OpenStreetMap | Extracted based on image maps from OpenStreetMap (m) |
| Path length-to-width ratio | / | OpenStreetMap | Extracted based on image maps from OpenStreetMap | ||
| Path type | / | Field Survey | Binary classification: Straight path = 0; Curved path = 1 | ||
| Natural elements | Vegetation structure | / | Field Survey | Ordered classification: Single-layer structure = 1; Double-layer structure = 2; Triple-layer structure = 3 | |
| Vegetation coverage ratio | / | OpenStreetMap | Extracted based on image maps from OpenStreetMap: (Greening area of the plot/Plot area) (%) | ||
| Water proximity | / | Field Survey | Binary classification: Waterside = 1; Non-waterside = 0 | ||
| Facilities | Pavement type | / | Field Survey | Ordered classification: Gravel paving = 1; Brick paving = 2; Block paving = 3; Concrete paving = 4; Asphalt paving = 5 | |
| Density of seating | / | Field Survey | Number of seats in the plot/Plot area (units/m2) | ||
| Spatial Perception Features | Aesthetic perception | Sky view ratio | Proportion of open sky in a person’s horizontal field of view | Site photos | Image semantic segmentation: Open sky area/Photo image area (%) |
| Green view ratio | Proportion of green plants in a person’s horizontal field of view | Site photos | Image semantic segmentation: Plant greening area/Photo image area (%) | ||
| Safety perception | Density of streetlights | / | Field Survey | Number of lamps in the plot/Plot area (units/m2) | |
| Density of security facilities | / | Field Survey | Number of traffic signal lights, warning signs and cameras in the plot/Plot area (units/m2) |
Table 2.
Energy expenditure of walking and running activities in urban parks.
| Activities | METs | Intensity |
|---|---|---|
| Slow walking | 3 | Moderate intensity (3 ≤ METs < 6) |
| Strolling | 3.5 | |
| Brisk walking | 4.3 | |
| Jogging | 7 | High intensity (≥6METs) |
| Running | 8 |
Table 3.
Pearson’s correlation analysis of urban park pathway features with daily W&RA density and daily per capita W&RA METs.
Table 3.
Pearson’s correlation analysis of urban park pathway features with daily W&RA density and daily per capita W&RA METs.
| Daily W&RA Density | Daily per Capita W&RA METs | |||
|---|---|---|---|---|
| Pearson’s Correlation | Sig. (Two-Tailed) | Pearson’s Correlation | Sig. (Two-Tailed) | |
| Integration value | 0.154 ** | 0.002 | 0.227 ** | 0 |
| Choice value | −0.371 ** | 0 | 0.08 | 0.116 |
| Control value | −0.019 | 0.714 | 0.518 ** | 0 |
| Time required to reach the nearest entrance | 0.017 | 0.735 | -0.410 ** | 0 |
| Path width | −0.347 ** | 0 | −0.09 | 0.077 |
| Path length-to-width ratio | 0.262 ** | 0 | 0.114 * | 0.026 |
| Vegetation coverage ratio | 0.362 ** | 0 | −0.04 | 0.437 |
| Density of seating | −0.138 ** | 0.007 | −0.151 ** | 0.003 |
| Sky view ratio | 0.254 ** | 0 | −0.249 ** | 0 |
| Green view ratio | −0.176 ** | 0.001 | 0.029 | 0.566 |
| Density of streetlights | 0.348 ** | 0 | −0.140 ** | 0.006 |
| Density of security facilities | 0.334 ** | 0 | 0.191 ** | 0 |
Note: * Significant at the 0.05 level (two-tailed); ** Significant at the 0.01 level (two-tailed).
Table 4.
Independent sample t-test and ANOVA of urban park pathway features with daily W&RA density and daily per capita W&RA METs.
Table 4.
Independent sample t-test and ANOVA of urban park pathway features with daily W&RA density and daily per capita W&RA METs.
| Testing Method | Testing Variables | Pathway Features | t | F | Df | Sig. |
|---|---|---|---|---|---|---|
| Independent samples t-test | Daily W&RA density | Path type (straight) | −5.659 | - | 203.496 | 0.000 |
| Path type (curved) | - | - | - | - | ||
| Water proximity (non-waterside) | −3.469 | - | 87.209 | 0.001 | ||
| Water proximity (waterside) | - | - | - | - | ||
| Daily per capita W&RA METs | Path type (straight) | 3.471 | - | 371.103 | 0.001 | |
| Path type (curved) | - | - | - | - | ||
| Water proximity (non-waterside) | 5.049 | - | 248.369 | 0.000 | ||
| Water proximity (waterside) | - | - | - | - | ||
| ANOVA | Daily W&RA density | Vegetation structure | - | 6.354 | 2 | 0.002 |
| Pavement type | - | 0.127 | 4 | 0.972 | ||
| Daily per capita W&RA METs | Vegetation structure | - | 27.849 | 2 | 0.000 | |
| Pavement type | - | 34.921 | 4 | 0.000 |
Table 5.
Results of the regression model for daily W&RA density.
| Levels | Indicators | Specific Indicator Factors | Unstandardized Coefficient | Standardized Coefficient | t | Significance | 95.0% Confidence Interval for B | Covariance Statistics | ||
|---|---|---|---|---|---|---|---|---|---|---|
| B | Standard Error | Beta | Lower Limit | Upper Limit | VIF | |||||
| (constant) | −0.594 | 0.210 | −2.826 | 0.005 | −1.007 | −0.181 | ||||
| Spatial Organization Features | Spatial topology | Integration value | 0.227 | 0.075 | 0.205 | 3.039 | 0.003 | 0.080 | 0.375 | 2.965 |
| Control value | 0.000 | 0.000 | 0.095 | 1.153 | 0.250 | 0.000 | 0.000 | 4.452 | ||
| Spatial Place Features | Spatial form | Path width | −0.049 | 0.030 | −0.148 | −1.628 | 0.104 | −0.109 | 0.010 | 5.371 |
| Path type | 0.153 | 0.047 | 0.232 | 3.278 | 0.001 | 0.061 | 0.244 | 3.263 | ||
| Natural elements | Vegetation structure | −0.059 | 0.025 | −0.136 | −2.411 | 0.016 | −0.108 | −0.011 | 2.075 | |
| Vegetation coverage ratio | 0.997 | 0.178 | 0.413 | 5.600 | 0.000 | 0.647 | 1.348 | 3.533 | ||
| Water proximity | −0.048 | 0.073 | −0.058 | −0.662 | 0.508 | −0.191 | 0.095 | 4.941 | ||
| Facilities | Density of seating | 3.161 | 1.913 | 0.136 | 1.652 | 0.099 | −0.602 | 6.923 | 4.388 | |
| Spatial Perception Features | Aesthetic perception | Sky view ratio | 2.283 | 0.738 | 0.154 | 3.093 | 0.002 | 0.832 | 3.735 | 1.618 |
| Green view ratio | −0.072 | 0.109 | −0.036 | −0.662 | 0.508 | −0.287 | 0.142 | 1.926 | ||
| Safety perception | Density of streetlights | 5.858 | 2.194 | 0.195 | 2.670 | 0.008 | 1.544 | 10.173 | 3.467 | |
| Density of security facilities | 14.745 | 3.511 | 0.210 | 4.199 | 0.000 | 7.841 | 21.650 | 1.631 | ||
Table 6.
Results of the regression model for daily per capita W&RA METs.
| Levels | Indicators | Specific Indicator Factors | Unstandardized Coefficient | Standardized Coefficient | t | Significance | 95.0% Confidence Interval for B | Covariance Statistics | ||
|---|---|---|---|---|---|---|---|---|---|---|
| B | Standard Error | Beta | Lower Limit | Upper Limit | VIF | |||||
| (constant) | 3.491 | 0.093 | 37.724 | 0.000 | 3.309 | 3.673 | ||||
| Spatial Organization Features | Spatial topology | Control value | 0.286 | 0.026 | 0.533 | 11.035 | 0.000 | 0.235 | 0.336 | 2.112 |
| Accessibility | Time required to reach the nearest entrance | −0.002 | 0.000 | −0.290 | −6.035 | 0.000 | −0.003 | −0.002 | 2.092 | |
| Spatial Place Features | Spatial form | Path length-to-width ratio | −0.007 | 0.002 | −0.196 | −4.600 | 0.000 | −0.010 | −0.004 | 1.646 |
| Path type | −0.081 | 0.040 | −0.107 | −2.022 | 0.044 | −0.159 | −0.002 | 2.547 | ||
| Natural elements | Vegetation structure | −0.028 | 0.023 | −0.055 | −1.226 | 0.221 | −0.072 | 0.017 | 1.847 | |
| Water proximity | 0.101 | 0.057 | 0.105 | 1.764 | 0.079 | −0.012 | 0.213 | 3.222 | ||
| Facilities | Density of seating | −4.649 | 1.217 | −0.174 | −3.819 | 0.000 | −7.042 | −2.255 | 1.886 | |
| Pavement type | 0.079 | 0.016 | 0.247 | 4.800 | 0.000 | 0.047 | 0.111 | 2.396 | ||
| Spatial Perception Features | Aesthetic perception | Sky view ratio | −2.844 | 0.739 | −0.168 | −3.851 | 0.000 | −4.296 | −1.392 | 1.721 |
| Safety perception | Density of security facilities | 19.207 | 3.656 | 0.239 | 5.254 | 0.000 | 12.018 | 26.397 | 1.879 | |
| Density of streetlights | −1.299 | 2.041 | −0.038 | −0.637 | 0.525 | −5.311 | 2.714 | 3.186 | ||
Table 7.
Results of the univariate OLS regression models for daily W&RA density and daily per capita W&RA METs.
Table 7.
Results of the univariate OLS regression models for daily W&RA density and daily per capita W&RA METs.
| Implicit Variable | Independent Variable | Models | Adjusted R2 | Constant | B | Sig. | ||
|---|---|---|---|---|---|---|---|---|
| B1 | B2 | B3 | ||||||
| Daily W&RA density | Integration value | 0.046 | 0.206 | 0.491 | / | / | 0.000 | |
| Vegetation coverage ratio | 0.175 | 0.073 | 2.059 | / | / | 0.000 | ||
| Density of streetlights | 0.192 | 0.546 | −47.841 | 3428.438 | −52,750.227 | 0.000 | ||
| Density of security facilities | 0.198 | 0.465 | −41.773 | 4324.538 | / | 0.000 | ||
| Sky view ratio | 0.141 | 0.485 | −13.522 | 369.067 | −1703.033 | 0.000 | ||
| Daily per capita W&RA METs | Control value | 0.417 | 2.942 | 1.581 | −1.016 | 0.195 | 0.000 | |
| Time required to reach the nearest entrance | 0.199 | 4.071 | −0.009 | 0.0000366 | / | 0.000 | ||
| Path length-to-width ratio | 0.057 | 3.847 | −0.046 | 0.003 | −0.0000405 | 0.000 | ||
| Density of seating | 0.067 | 3.685 | 35.959 | −2147.82 | 26,971.594 | 0.000 | ||
| Density of security facilities | 0.201 | 3.516 | 92.475 | −1990.5 | −207,502.07 | 0.000 | ||
| Sky view ratio | 0.080 | 3.827 | −13.472 | 173.261 | −662.562 | 0.000 | ||
Table 8.
Comparison of key indicators between Plot 4 and Plot 5 in Xujiahui Park.
| Plot to be optimized |  Plot 4 in Xujiahui Park (Length: 75 m. Width: 2 m. Area: 120 m2) | ||
| Reference plot |  Plot 5 in Xujiahui Park (Length: 75 m. Width: 3 m. Area: 120 m2) | ||
| Plot to Be Optimized | Reference Plot | ||
| Plot 4 | Plot 5 | ||
| Daily W&RA density (people/square meter) | 0.42 | 1.12 | |
| Comparison of Key Indicators | Vegetation coverage ratio | 0.9 | 0.9 |
| Path type | straight | curved | |
| Density of security facilities * | 0 | 0.017 | |
| Integration value | 1.38 | 1.39 | |
| Density of streetlights(units/square meter) * | 0.025 | 0.033 | |
| Sky view ratio * | 0.006 | 0.129 | |
| Vegetation structure * | triple-layer structure | double-layer structure | |
Note: * Indicates the main adjusted indicators.
Table 9.
Comparison of key indicators between Plot 2 and Plot 5 in Lujiazui Center Green.
| Plot to be optimized |  Lujiazui Central Green Plot 5 (Length: 60 m. Width: 4.5 m. Area: 300 m2) | ||
| Reference plot |  Lujiazui Central Green Plot 2 (Length: 70 m. Width: 2 m. Area: 180 m2) | ||
| Plot to Be Optimized | Reference Plot | ||
| Plot 5 | Plot 2 | ||
| Daily per capita W&RA METs (METs/people) | 3.53 | 4.52 | |
| Comparison of Key Indicators | Control value | 1.01 | 1.08 |
| Time required to reach the nearest entrance (s) | 55 | 5 | |
| Pavement type * | Brick paving | Asphalt paving | |
| Density of security facilities(units/square meter) * | 0.003 | 0.012 | |
| Path length-to-width ratio * | 13.3 | 35 | |
| Density of seating (units/square meter) * | 0.014 | 0.008 | |
| Sky view ratio * | 0.124 | 0.051 | |
| Path type | curved | curved | |
Note: * Indicates the main adjusted indicators.
Disclaimer/Publisher’s Note: The statements, opinions and data contained in all publications are solely those of the individual author(s) and contributor(s) and not of MDPI and/or the editor(s). MDPI and/or the editor(s) disclaim responsibility for any injury to people or property resulting from any ideas, methods, instructions or products referred to in the content. |
© 2024 by the authors. Licensee MDPI, Basel, Switzerland. This article is an open access article distributed under the terms and conditions of the Creative Commons Attribution (CC BY) license (https://creativecommons.org/licenses/by/4.0/).
Share and Cite
MDPI and ACS Style
Chen, J.; Tao, Z.; Wu, W.; Wang, L.; Chen, D. Influence of Urban Park Pathway Features on the Density and Intensity of Walking and Running Activities: A Case Study of Shanghai City. Land 2024, 13, 156. https://doi.org/10.3390/land13020156
AMA Style
Chen J, Tao Z, Wu W, Wang L, Chen D. Influence of Urban Park Pathway Features on the Density and Intensity of Walking and Running Activities: A Case Study of Shanghai City. Land. 2024; 13(2):156. https://doi.org/10.3390/land13020156
Chicago/Turabian StyleChen, Junqi, Zheng Tao, Wenrui Wu, Ling Wang, and Dan Chen. 2024. "Influence of Urban Park Pathway Features on the Density and Intensity of Walking and Running Activities: A Case Study of Shanghai City" Land 13, no. 2: 156. https://doi.org/10.3390/land13020156
Note that from the first issue of 2016, this journal uses article numbers instead of page numbers. See further details here.