Article

Driving Mechanisms of Spatial Differentiation in Ecosystem Service Value in Opencast Coal Mines in Arid Areas: A Case Study in the Zhundong Economic and Technological Development Zone

1
College of Geography and Remote Sensing Sciences, Xinjiang University, Urumqi 830046, China
2
Xinjiang Key Laboratory of Oasis Ecology, Xinjiang University, Urumqi 830046, China
3
MNR Technology Innovation Center for Central Asia Geo-Information Exploitation and Utilization, Urumqi 830046, China
*
Author to whom correspondence should be addressed.
Land 2024, 13(5), 623; https://doi.org/10.3390/land13050623
Submission received: 19 March 2024 / Revised: 27 April 2024 / Accepted: 3 May 2024 / Published: 6 May 2024

Abstract

:
The valuation of ecosystem services (ESs) is crucial for preserving ecosystems, assessing natural resources, and making decisions regarding compensation. In this study, we employed the InVEST model’s habitat quality (HQ) module to calculate the HQ and degradation levels in the study area using land use/land cover (LULC) data from 2000 to 2020. Our analysis utilized quantitative methods, including spatial correlation, hotspot analysis, and geo-probing, to determine the value of ESs and identify trends. Furthermore, we examined the spatial and temporal variation in the significance of ESs and their driving factors. The results show the following. (1) The primary LULC types in the Zhundong coalfield from 2000 to 2020 are grassland and barren areas. (2) The average value of the HQ index in the study area exhibited a generally decreasing trend. Between 2000 and 2010, HQ significantly declined, particularly in the region’s large barren industrial and mining zones. However, over time, the proportion of sites with minimal degradation improved steadily, resulting in better overall HQ in the study area by 2020. This pertains to the measures put in place by the local government to safeguard and rehabilitate the ecosystem. (3) The spatial distribution of the ecosystem service value (ESV) aligns with changes in HQ and LULC, with significant hotspots primarily observed in forest and grassland areas, nature reserves, and areas around water sources. (4) LULC, temperature, annual precipitation, and elevation are the main drivers of spatial variation in the ESV in the Zhundong area; the spatial variation in the ESV in the Zhundong coalfield is primarily influenced by the interaction between human factors and natural factors, in which LULC plays a dominant role. This study’s findings can guide the development of rational ecological planning, integrating resource conservation mining with effective zoning management.

1. Introduction

Today, the world’s ecosystems are confronted with serious problems related to anthropogenic disturbances and resulting environmental change. Mineral resources are an important component in promoting economic development and social progress [1,2,3], but addressing the relationship between resources, the environment, and human beings and achieving sustainable development remain global issues. Due to the ongoing refinement of the industrial infrastructure, the production capacity of coal has become more concentrated in the central and western regions of China due to their abundant resources, favorable mining conditions, and lower production costs. As a result, coal production has consistently been increasing [4]. From 2003 to 2012, the coal industry enjoyed a prosperous decade called the “golden” period [5]. In 2014, China’s coal production accounted for 49% of the global total, reaching 387 million tons (National Bureau of Statistics of the People’s Republic of China). Coal is still the cornerstone of China’s energy security, accounting for about 60–70% of the country’s primary energy production and consumption [6]. The dominant position of coal in the short term is primarily determined by China being rich in coal but poor in oil and gas. According to predictions, the size of the coal reserves in Xinjiang is estimated to be approximately 2.19 × 10¹² t, accounting for about 39.3% of the country’s total resources [7]. As China’s main energy source and a key raw material, coal plays a pivotal role in the process of social development and a key role in economic development. In the future, coal production will continue to play an important role in the energy transition, but it is also accompanied by environmental and safety challenges. Therefore, we need to look at the coal industry in a more objective manner, making full use of its resource value while focusing on environmental protection and safe production to promote sustainable development. The global expansion of the coal industry has led to significant challenges, including land subsidence, water and soil pollution, mining safety hazards, and other obstacles, jeopardizing sustainable development goals [8,9]. The extensive and intensive extraction of coal in China has led to unfavorable impacts on its land resources [10]. The detrimental effects of coal mining on the environment, particularly in mining areas, cannot be overlooked. The structural and functional changes it causes to the ecosystem pose a severe threat to the ecological environment of these areas. Furthermore, it hinders the sustainable socioeconomic development of cities that rely on coal.
The analysis of land use/land cover (LULC) is key to investigating the interplay between human activities and natural ecosystems. LULC accurately portrays the environment, demonstrating the tangible effects of human activity and the utilization of natural resources [11]. LULC changes directly affect ecosystems’ structure and function [12,13,14,15,16,17,18]. Habitat quality (HQ) often serves as an indicator of the status of biodiversity within a given territory, representing the ecosystem’s capacity to support the sustainable survival of organisms [19]. Human open-pit mining in mining areas can lead to habitat destruction, degradation, and disappearance. The importance of ecosystems as organized, functional units of nature to human well-being, health, livelihoods, and survival cannot be underestimated [20]. According to Daily et al., there is not a direct link between the benefits of nature to humans’ ES (ecosystem service) and human well-being. Instead, they arise through interactions with other forms of capital, such as human, built, and social capital [21,22]. In addition to the research conducted by Costanza et al. and Daily, the Millennium Ecosystem Assessment (MA) in 2003 defined ecosystem services (ESs) as the benefits that individuals obtain from ecosystems. This assessment recognized four primary categories of ESs: provisioning, regulating, supporting, and cultural services [21]. The International Geosphere–Biosphere Programme (IGBP) states that the availability of ESs is significantly impacted by changes to the state, traits, and operations of ecosystems. Such alterations result in varying levels of importance of ESs, making them more vulnerable to susceptibility [23,24,25,26]. Maintaining ESs and reducing ecosystem degradation are the basis for human well-being and sustainable development and need to be prioritized [27,28]. The overuse of natural resources and the demand for ESs often exceed their supply capacity and impact human well-being. In 1997, Costanza et al. established a global coefficient for computing changes in ESV due to LULC alterations, using a monetary unit perspective. These methodologies have been widely utilized and improved upon by numerous scholars at various levels, including at regional and global scales, to estimate ESV [29,30,31]. Scholars such as Xie Gaodi generated ESV coefficients at the national scale in China based on local ecological characteristics and divided mainland China into six ecosystems and nine service types based on the method by Costanza et al. [32]. Chinese scholars have widely utilized this correction factor to estimate ESV [33,34,35]. Recently, scholars have explored the importance of ecosystem services (ESs) in coal mining regions. Norgaard [36] demonstrated that restoring ecosystems in mining areas can contribute to functional sustainability in terms of ESV. Larondelle Haase [37] employed ESs to assess the impact of mining activities on the landscape pattern of mining regions in eastern Germany. Additionally, the InVEST model, jointly developed by Stanford University, the WWF, and The Nature Conservancy (TNC) in 2007, is an open-source tool for assessing ES functions based on ecological production processes. This model is widely utilized in ES function evaluation studies for its quantitative accuracy, visualization of results, and low cost of use [38,39]. The InVEST model was used to investigate and assess the value of four ESs, namely, carbon storage, sediment retention, nutrient retention, and water production, in Sonoma County (San Francisco, CA, USA) and to provide a comprehensive understanding of the ecosystem benefits derived from land conservation policies in the area, the results of which can help decision makers to develop better LULC measures [40]. Research on the value of ESs in mining regions has primarily centered on ES value fluctuations before and after mining, as well as pre- and post-reclamation, such as in Long et al. [41]. The magnitude of these changes serves as an indicator of the ecological impact of mining activities or land reclamation. Nevertheless, there is a dearth of research exploring ecosystem service value (ESV) changes, specifically during the mining process. Li Baojie et al. addressed this gap in [42] and Dun Yaolong et al. suggested that optimizing the land use structure through the evaluation of ESV changes can lead to the maximization of ecological and social benefits in mining areas. Xue Juanjuan et al. [43] studied the change in ESV in the open-pit mine area in Pingshuo, Shanxi Province based on a gray model. Song et al. highlighted that coal mining fragments LULC negatively impact the ESV of the Xuangang mine area located in the environmentally vulnerable Loess Plateau [44]. Some domestic scholars have also focused on using the modules of water supply, soil conservation, carbon fixation, water purification, and habitat quality (HQ) of the InVEST model to assess ES function in diverse regions, such as the Hengduan Mountains [45], Shaoguan City [46], Bailong, and the Yellow River Basin [47,48].
Xinjiang is a vast region of China that is rich in resources. The Zhundong coalfield is the largest coalfield in China and contains 3900 × 108 t of underground coal in a narrow strip 220 km long from east to west. The 14th Five-Year Plan of Xinjiang also mentions constructing a national large-scale coal power and chemical base. The focus is on promoting the development of major coal bases in Xinjiang, specifically in Zhundong, Tuha, Yili, and Kubai. The key goals of the current project are the transmission of electricity from Xinjiang to other areas, the outward transportation of coal from Xinjiang, and the promotion of the modern coal chemical industry (“Master Plan of Xinjiang Zhundong Economic and Technological Development Zone (2012–2030)”).
The exploitation of coal reserves can pose severe threats to the fragile arid ecosystem. Moreover, the resulting environmental degradation has the potential to impede the sustainable development of both Zhundong and Xinjiang’s economy and society. It is important to recognize that the negative impacts on the environment can have far-reaching consequences, affecting not only the natural habitat but also the livelihoods and well-being of local communities. This study employed a rigorous scientific methodology to assess the HQ and ESV of Zhundong. Its main goals were to analyze spatiotemporal patterns, identify influential factors, and investigate the impacts of coal mining on HQ and ESV. The findings highlight the crucial importance of achieving a harmonious coexistence between coal mining activities and the ecological environment in this region. Furthermore, this study provides a scientific basis for implementing resource conservation and ecological environment management practices in mining. It also offers valuable scientific support for the development of the green mining industry, facilitating the coordination between resource conservation mining and eco-environmental management in the area.

2. Materials and Methods

2.1. Study Area

The Zhundong coalfield is situated in Changji Hui Autonomous Prefecture at the southern edge of the Junggar Basin and the northern foot of the Tianshan Mountains. The Zhundong coalfield extends from Shaqiuhe in the west to Laojunmiao in Mulei in the east, encompassing approximately 20,000 square kilometers. Zhundong is bordered by an oasis at the northern foot of the Tianshan Mountains to the south and Fukang City to the west. According to the existing administrative boundaries of counties and cities, the study area straddles Jimsa County, Qitai County, and Mulei County. It includes five major mining areas: Wucaiwan, Dajing, Xiheishan, Jiangjunmiao, and Laojunmiao (refer to Figure 1). By the end of 2020, coal production in the Zhundong Coalfield had reached 108 million tons, accounting for 48% of the total coal production in the Xinjiang region and an increase of 16.6%.
The area of study is situated in an ecologically sensitive region, comprising mostly desert areas with hot and arid climatic conditions. The average diurnal temperature difference is 6.5 °C. The highest annual temperature occurs in July–August, often reaching above 40 °C, and the lowest temperature occurs in January, often reaching below −30 °C. The freezing period is from December to February, and the total annual hours of sunshine is 2800–3100 h [49]. Precipitation is concentrated in June and July, with an average annual rainfall of 106 mm. In the study area, there is no continuous surface runoff. Only during the snowmelt season or after heavy summer rainfall may temporary surface water flow occur in the gullies. The number of annual days of rainfall generally does not exceed 15 [50]. The degree of desertification is severe, and the area is classified as being moderately sensitive to land desertification and is a critical protection zone for soil erosion prevention in Xinjiang. Moreover, three established nature reserves—Kalamaili Mountain Ungulate Nature Reserve, Qitai Desert Grassland Nature Reserve, and Xinjiang Qitai Silicified Wood Dinosaur National Geological Park—are situated near Zhundong. Prior to mine construction, there were no permanent residents in the area; however, following the construction of mines, the majority of residents now consist of mine workers and their families. The economy of the study area is mainly based on animal husbandry, exhibiting the minimal presence of farming practices [50].

2.2. Data Resources and Pre-Processing

The data and sources required for this study are shown in the following Table 1.

2.3. InVEST Model HQ Analysis Module

Habitat quality (HQ) is an important indicator used to assess ecology. It refers to the presence of environmental conditions appropriate for the survival of diverse organisms. The structure of LULC types and the degree of land development will directly affect the HQ of the area. The following formula calculates HQ:
Q x y = H j 1 D x j z D x j z + K z
where Q x y represents HQ; H j indicates the habitat suitability of the LULC type; D xj indicates the degree of HQ degradation; the normalization index, denoted “z”, is typically assigned a value of 2.5; K is the half-saturation constant, usually taken as half of D xy (the max value of HQ degradation); and the system default is 0.5.
According to the InVEST model, there exists a direct relationship between the sensitivity of habitat types to threats and the extent of the impact on habitats. This means that the more sensitive a habitat type is to a particular threat factor, the greater the degradation of that habitat type. To calculate the degree of habitat degradation, the following equation is used:
D x j = r = 1 R y = 1 Y r W r r = 1 R W r r y i r x y β x s j r
where r is the threat factor; R is the total number of threat factors; Y r , and y are the total number of grating cells and the number of all grating cells with threat factor r, respectively; W r is the weight of the threat factor and takes a value from 0 to 1; x is the level of legal protection (this paper does not consider the level of legal protection and assigns the variable a value of (1)); s jr is the sensitivity of habitat type y to threat factor r; and i rxy is the degree of influence of threat factor r of raster cell y on raster cell x.
To utilize this module, the necessary inputs include the LULC map for the study area, various threat sources and their corresponding weights, the maximum impact distance (Table 2), and the sensitivity of LULC types to threat factors (Table 3). The parameters for the HQ module were established by referencing the relevant literature [51,52,53] and considering the specific conditions of the study region.

2.4. ES Valuation Model

Based on the ESV estimation system proposed by Costanza et al. [20] in 1997, the total value of ESs and the value of individual services in the study area were obtained.
E S V = ( A k × V C k )
E S V f = ( A f k × V C f k )
where A f k is the area of the kth LULC type of the fth ecosystem type in the study area in hm2 and V C f k is the coefficient of ESV of the kth LULC type of the fth ecosystem type, in CNY/(hm2/a).
The coefficients of ESV were adjusted using the crop yield and value per unit area in the administrative unit housing the Zhundong coalfield, adapting Xie et al.’s revised Costanza model to China’s context. Leveraging Xie Gaodi’s equivalence table for ESV per unit area, we determined an ESV of 1572.997/hm2 for a single equivalent factor in the study area using Equation (5). Consequently, we derived the ESV coefficients for each LULC type within the study area during the research period (Table 4).
E a = 1 7 i = 1 n m i p i q i M ( i = 1 , , n )
where i, m i , p i , q i , and M represent the crop variety, crop yield (kg/ha), price (CNY/kg), the sown area (ha), and total land area (ha) of the crop, respectively. The main food crops in the study area are wheat and maize, and 1/7 indicates that the ESV per unit area is 1/7 of the production value per unit area of the main food crops in the area in that year.
In this study, the fishnet tool in ArcGIS 10.2 software was used to divide the area into 2 km × 2 km grid cells for the spatial representation of ESV in the area. The ESV was calculated for each category in the grid, and kriging interpolation was performed to highlight the spatial variability of the value of ESs in the Zhundong coalfield.

2.5. Sensitivity Index Analysis

The sensitivity index reflects the dependence of ESV on the ESV coefficient (VC) at a specific time. When the coefficient of sensitivity (CS) > 1, it indicates that a 1% change in VC causes a change in ESV greater than 1%. When CS < 1, it means that the ESV does not respond strongly to VC, and a 1% change in VC causes a change in ESV lower than 1%, and the study results are reliable.
C S = ( E S V j E S V i ) / E S V i ( V C i k V C i k ) / V C i k
where the magnitude of ESV before and after adjustment is expressed by E S V j and E S V i , respectively, and the magnitude of the ESV coefficient before and after adjustment is expressed by V C j k and V C i k , respectively.

2.6. Spatial Correlation Analysis

In this study, we utilized the Geoda model’s exploratory spatial analysis tool to calculate the local Moran’s I, aiming to investigate clustering and anomalies in the ESV distribution pattern within the Zhundong area. Furthermore, hotspot analysis (using the Gi* index) enabled us to assess the spatial distribution pattern of ESV, identifying both hotspots and coldspots. This analysis also revealed spatial clusters of high- and low-value regions, thereby uncovering notable spatial disparities in ES provision capacity.
I i = ( x i x a ) j = 1 n W i j × ( x j x a ) j = 1 n ( x i x a ) 2 / n
where I i represents the local spatial autocorrelation Moran’s index; x i and x j represent the ESV observations of the i-th and j-th evaluation units, and x is the mean value of the observations; n is the total number of ESV evaluation units on the study scale; and W ij is the spatial weight matrix between evaluation units i and j.
G i * = j = 1 n w i j x j X ¯ j = 1 n w i j [ n j = 1 n w i j 2 ( j = 1 n w i j ) 2 ] / ( n 1 ) s
X ¯ = 1 n i = 1 n x i
S = 1 n i = 1 n x i 2 ( X ) 2

2.7. Geodetector Model

The factor detector in the geodetector quantifies how well the independent variable explains the spatial variations in the dependent variable. The higher the q value, the greater the explanatory power of the independent variable for the dependent variable. Additionally, the interaction detector assesses the combined explanatory strength of two independent variables on the dependent variable.
q = 1 h = 1 L N h σ h 2 N σ 2 = 1 R s s D s s
R s s = h = 1 L N h σ h 2 ,   D s s = N σ 2

3. Results

3.1. LULC Distribution Characteristics

Analyzing by period (Table 5, Figure 2), it can be observed that the primary land use types in the Zhundong area were grasslands and unused land throughout different timeframes. Minimal changes were observed in land use types in 2000 and 2005, with unused land dominating and a small area of cultivated land being present. In 2010, the grassland area decreased significantly from 2306.31 km2 to 1184.92 km2, while the forest area also shrunk from 8.94 km2 to 0.61 km2. On the other hand, the area of construction land increased from 5.39 km2 to 129.53 km2. This shift was attributed to the commencement of coal mining and initial development in the Wucaiwan mining area from 2006 onwards, leading to changes in the land use pattern. The increase in human activity intensity resulted in a decrease in vegetation coverage, including grasslands and forests, within the study area. Notably, no water bodies appeared in the study area in 2010.
In 2015, the area of construction land continued to increase, rising from 129.53 km2 in 2010 to 198.13 km2. Additionally, water bodies began to emerge in areas surrounding the construction land. The area of cultivated land also expanded, while the areas of grasslands and unused land decreased. By 2015, mining activities had commenced in all mining areas within the study region, leading to an increase in mining zones and dump sites. The completion of residential buildings for miners and their families also contributed to a significant increase in the construction area compared to previous periods. Artificial water bodies, such as reservoirs, also appeared around the construction areas.
In 2020, although the areas of water bodies and construction land continued to increase, these increases were relatively small. However, a significant decrease in grassland area occurred, leading to an increase in unused land from 14,096.87 km2 in 2015 to 14,245.44 km2. The area of cultivated land in the study area remained relatively stable, with a slight increase during the period from 2000 to 2020, primarily concentrated near the Jijihu area.

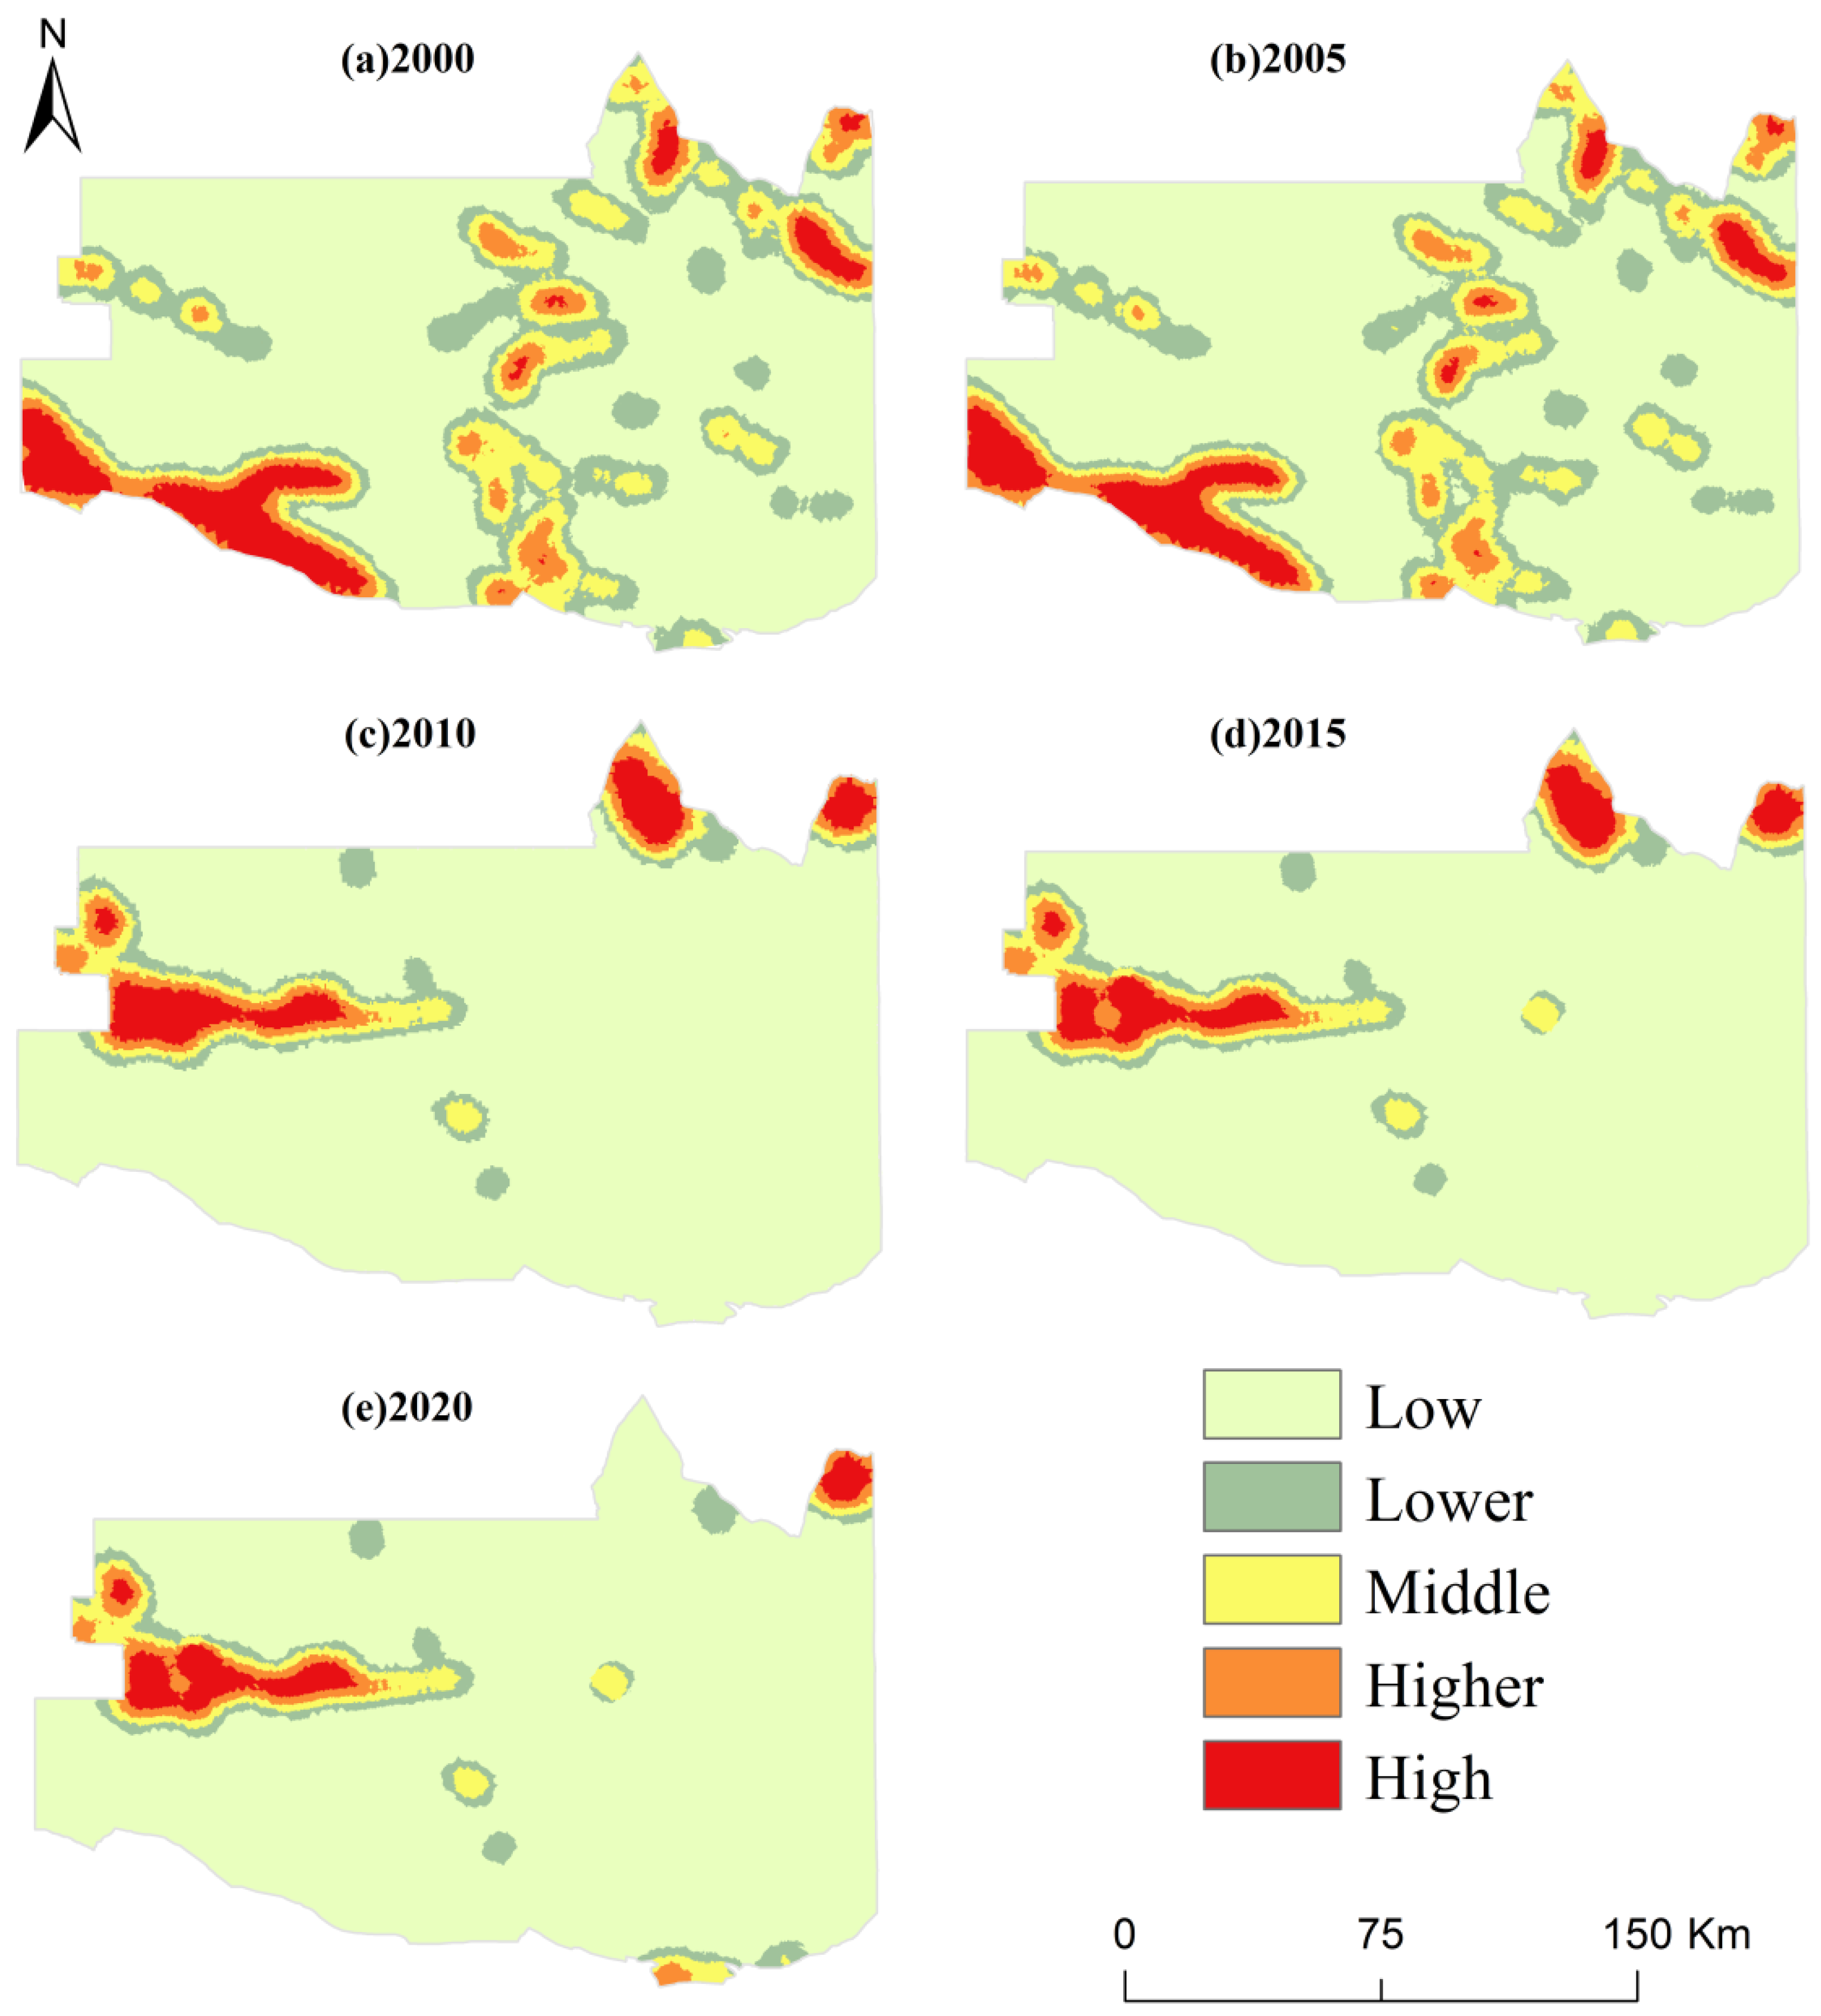
3.2. Spatial and Temporal Variation Characteristics of HQ in Zhundong

As shown in Figure 3 and Figure 4, this study calculated and analyzed the percentage stacked graph of habitat quality (HQ) in the Zhundong area and the spatiotemporal distribution pattern of HQ in the study area from 2000 to 2020. The HQ was classified into five levels: low, lower, medium, higher, and high, using the natural break method to indicate the strength levels. From 2000 to 2010, the HQ was relatively high, with the proportion of high-value areas accounting for 75.100%, 75.100%, and 70.925%, respectively, mainly represented by vast virgin forest and grassland areas within the region. However, from 2010 to 2020, the increase in mining activities in the Zhundong coalfield area led to a decline in HQ around the Wucaiwan mining area, Dajing mining area, and Jiangjunmiao mining area. The proportion of low-value habitat areas in the study area from 2000 to 2020 was 8.704%, 8.704%, 10.103%, 11.837%, and 12.099%, respectively. Overall, the proportion of high-value and higher-value habitat areas in the study area decreased over the two decades. The extensive mining and excavation activities in the Zhundong area have severely impacted the local ecosystem, disrupting the habitats and living environments of wildlife and gradually increasing the proportion of low-value and lower-value habitat areas in the study area.
In this study, the degradation degree of HQ in Zhundong was assessed using the HQ module of the InVEST model for the years 2000, 2005, 2010, 2015, and 2020 (refer to Figure 5). The mean values of its HQ degradation index were 0.219, 0.219, 0.160, 0.159, and 0.149, respectively, indicating a general decreasing trend. As shown in Figure 3, the spatial distribution of the HQ degradation degree in the study area did not change much from 2000 to 2005. A large area of unused land, along with virgin forest and grassland, had low degradation degree values. The southwestern and central parts of the study area gradually transformed into areas with a high degree of degradation of the original HQ. In 2015, scattered areas with low or lower levels of degradation were observed in the northwestern and central parts of the study area. By 2020, the areas with low levels of degradation of HQ had increased in the northern part of the study area, shifting it from having high HQ degradation to having relatively high or moderate HQ degradation. Meanwhile, the southern region shifted from having moderate to high degradation. Additionally, areas with a low or lower degradation degree of HQ appeared around Wucaiwan and Jiangjunmiao and the Xiheishan Mountain mining area.

3.3. Analysis of ESV Assessment in Zhundong

3.3.1. Changes in the ESV of Different LULC Types

Table 6 shows a consistent upward trend in the total ESV of cropland, water, and barren areas in Zhundong from 2000 to 2020. The total ESV of cropland increased from 0.281 to 0.420, that of water increased from 0 to 114.174, and that of barren areas increased from 1344.020 to 1456.522. The total ESV of forest areas decreased abruptly from 27.638 to 1.920 in 2010, while that of grassland also decreased from 4376.287 to 1839.717.
As illustrated in Figure 6, the high-value areas in the study area in 2000 and 2005 were found mainly in the central, northeastern, and southwestern forest and grassland areas, and the value of barren land’s ESs was also low. In 2010 and 2015, the area of primary forest and grassland in the central part of the study area was significantly reduced due to frequent coal mining activities. The LULC pattern of the study area changed, resulting in a shift from high-value areas to low-value areas. However, in the northern Beita Mountain and Huangju, this may be related to the surrounding protected areas and national parks. In 2020, as the intensity of human activities and mining in the study area increased, the area covered by forest and grassland decreased, and the value of ESs decreased. In 2020, the intensity of human activities in the Zhundong coalfield increased, mining increased, the area covered by forest and grassland decreased, and the ESV declined.

3.3.2. Sensitivity Index Analysis

In this study, we determined the sensitivity index by adjusting the value coefficients of each land use/land cover (LULC) type by 50% in both the upward and downward directions. This allowed us to evaluate the impact on the ESV in Zhundong from 2000 to 2020. If the coefficient of sensitivity (CS) > 1, the ESV of the region is responsive to the ESV coefficient (VC); if CS < 1, the ESV is not related to VC, and a larger ratio indicates that the accuracy of VC is poorer. According to Table 7, it can be seen that both grassland and barren land in the study area were at their highest level in 2000–2020, indicating that the ESV in the study area is most sensitive to the value coefficients of grassland and barren land. The sensitivity index of each land type is less than 0.5, so the value coefficients used in this paper are realistic, and the research results are credible.

3.3.3. Spatial Autocorrelation Analysis of ESV Changes

Utilizing the Geoda model’s exploratory spatial analysis function, we conducted a global spatial autocorrelation analysis. As depicted in Figure 7, Moran’s I value exceeded 0.7 in all years, signifying a pronounced positive spatial autocorrelation and a remarkable spatial clustering effect in the ES values within the Zhundong coalfield.
The hotspot detection results (Figure 8) show no coldspots in the Zhundong area, and the hotspot areas are mainly concentrated in the forest and grassland distribution areas, nature reserves, and the areas around water sources. Between 2000 and 2005, hotspot areas did not change significantly, and between 2010 and 2020, changes were consistent with the previous LULC distribution changes. The hotspot areas are areas with a high ESV. However, since most of the land in the Zhundong coalfield is unused, the hotspot areas are not significant.

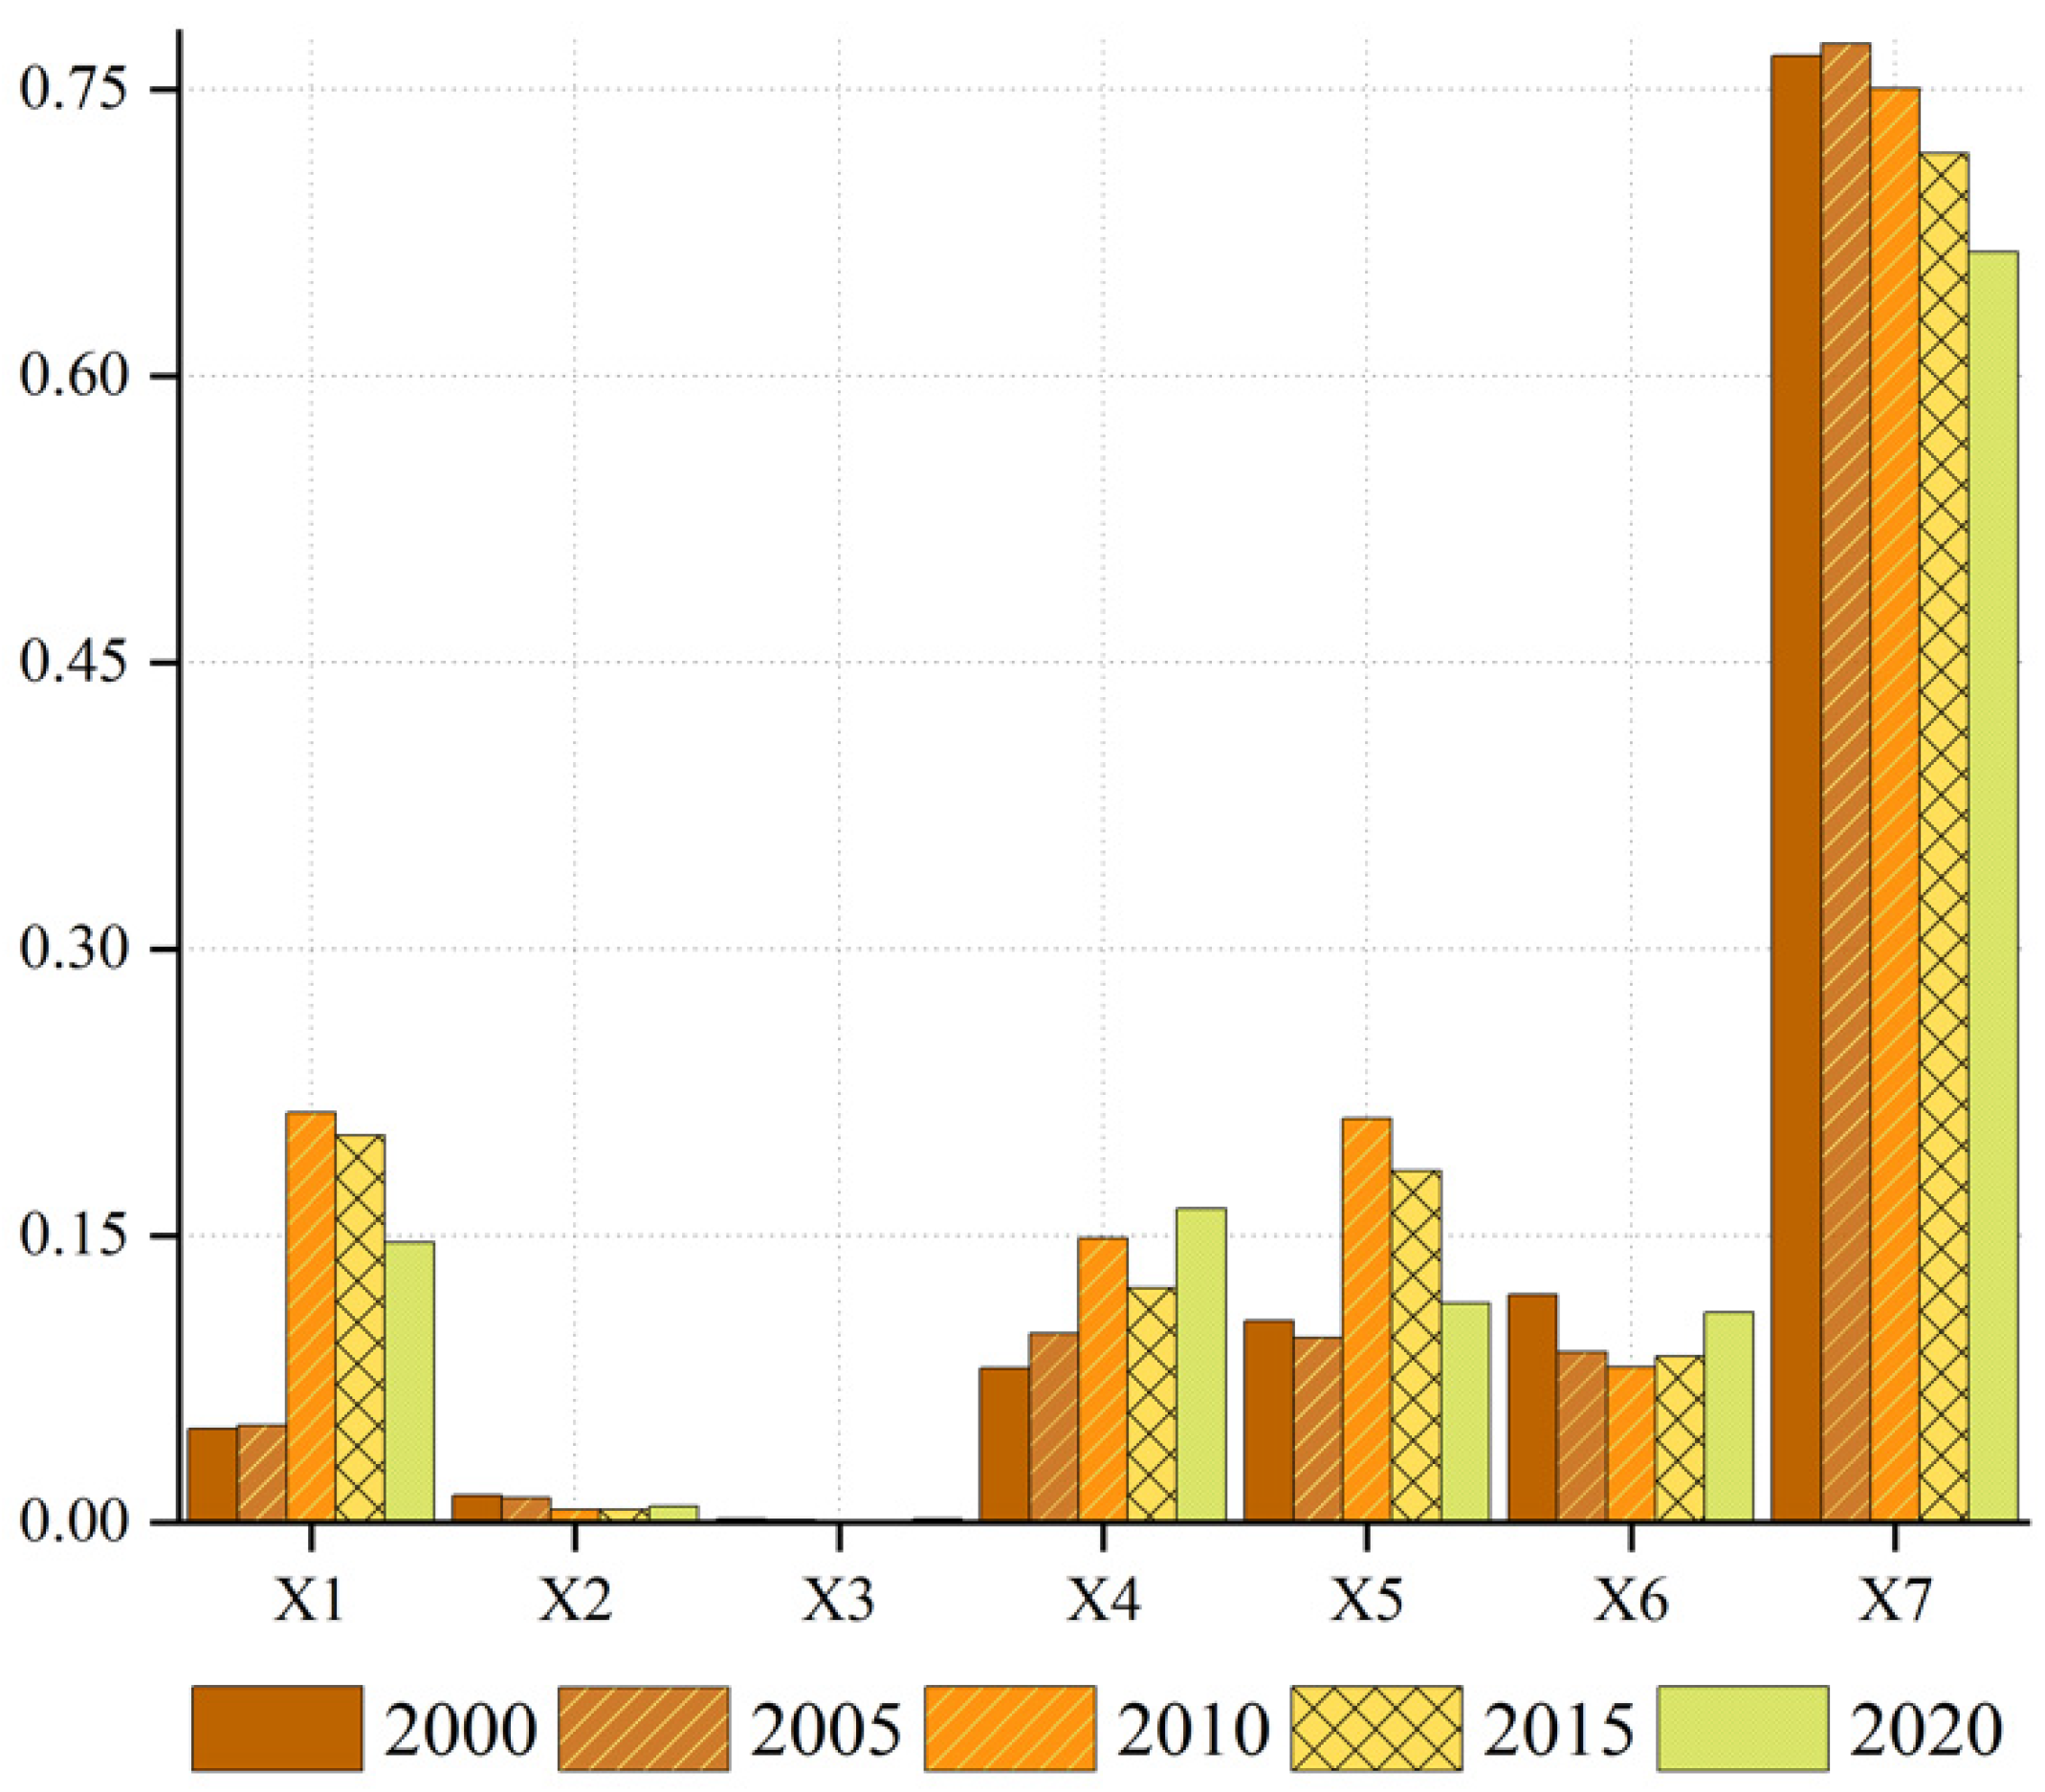
3.4. Analysis of the Drivers of Spatial Differentiation of ESV

To effectively detect the drivers of ESV in the Zhundong area, seven factors were selected, as illustrated in Figure 9. These factors consist of DEM (X1), slope (X2), slope direction (X3), air temperature (X4), precipitation (X5), NDVI (X6), and LULC (X7). The aim of this selection is to accurately identify the drivers of ESV in the study region. In 2000–2020, the average q-values for each variable, from largest to the smallest, were LULC (0.7348) > precipitation (0.1426) > DEM (0.1328) > temperature (0.1231) > NDVI (0.0974) > slope (0.0099) > slope direction (0.0014), in order. LULC serves as the primary determinant of the ES value in the study area. Furthermore, precipitation plays a pivotal role in influencing the ES value. Additionally, variations in DEM impact the distribution of vegetation and the scope and intensity of human activities and ultimately shape the ecosystem’s structure and function by creating a locally heterogeneous environment [54].
The interaction detection of the seven factors showed that the results were mainly bifactor enhanced and non-linearly enhanced in 2000–2020, which means that the explanatory power of the interaction of the seven factors was more potent than that of individual factors in different periods, indicating that the spatial and temporal variation of the ESV in the Zhundong coalfield was the result of the combined effect of multiple factors. As shown in Figure 10, the temperature ∩ LULC interaction produced the most significant effect in 2000, 2005, 2015, and 2020 (0.7821, 0.7962, 0.7456, and 0.7156, respectively), and the most significant interaction in 2010 was DEM ∩ LULC (0.7702).

4. Discussion

4.1. Analysis of Changes in HQ

Habitat quality (HQ) is essential for the proper functioning of the ecosystem and provision of services. It pertains to the ecosystem’s capacity to offer favorable conditions for the survival of living organisms [55], which can be seen as one of the critical indicators for judging ecosystem health [56]. The land is the carrier of habitats, and the primary way in which human activities affect the land surface is through changes in LULC, which involve alterations to the proportion, structure, and intensity of LULC [57]. The expansion of industrial and mining land and mining activities are the main causes of habitat loss and fragmentation, resulting in a series of ecological and environmental issues such as land degradation and destruction, land subsidence, water pollution and depletion, biodiversity loss, and more. In addition, mining activities may directly destroy or eliminate local flora and fauna, causing irreversible damage to the ecosystem [58]. According to the Environmental Impact Report for the Development Plan of the Coal Power and Coal Chemical Industry Belt in the Zhundong Region of Xinjiang (Draft for Comments), the plant community in the study area is relatively homogeneous, with sparse vegetation and coverage of only 5%-10%. According to the National Land Spatial Plan of Zhundong Economic and Technological Development Zone (2021–2035) and the Territorial Spatial Plan for the Zhundong Economic and Technological Development Zone (2021–2035), there are also ecological restrictions in place in the study area, including nature reserves, delineated ecological red lines, national public welfare forests, natural resources, parks, and reservoirs. In general, the environmental carrying capacity of the Zhundong Economic and Technological Development Zone could be better, and the background could be more stable. In 2006, the national government and that of the autonomous region decided to develop the Zhundong coalfield in Xinjiang on a large scale [50]. From 2010 to 2020, the expansion of industrial and mining construction land posed a significant threat to HQ. The disturbance of human activities caused significant changes to the LULC pattern of the Zhundong coalfield in 2010, especially the expansion of construction land around the Wucaiwan open-pit coal mine in the western part of the study area after the commencement of mining activities and the sudden reduction in primary forest and grassland area, which led to the increased degradation of the HQ of the Zhundong coalfield.
Regarding spatial distribution, the study area is located at the edge of the desert. The primary land type is barren and subject to climate and topography, resulting in a single type of ecosystem in the study area. The areas with high HQ are mainly in the primitive forest and grassland areas and the national public welfare forests. In addition to the Xinjiang Qitai Silicified Wood Dinosaur Geological Park, there are several other nature reserves and geological parks in the area that remain largely untouched by human activity. These locales include the Kalamaili Mountain Hoofed Wildlife Nature Reserve, the Qitai Desert and Grassland Nature Reserve, the Xinjiang Jimsar National Desert Nature Park, and the Xinjiang Mulei Mingsha Mountain National Desert Nature Park. These areas are renowned for their rich biodiversity, emphasizing ecological protection and minimal habitat degradation, thereby holding significant value.

4.2. Analysis of Changes in ESV

The change in ESV from 2000 to 2020 was consistent with the change in LULC. In terms of timescale, the total ESV of grassland was the highest during the study period, followed by barren areas (Figure 11); the findings by Liu Fang align with ours regarding ESs in the Zhundong area [50]. Grassland reached its highest value in 2000 and 2005 and its lowest value in 2020. As the intensity of human activities increased in 2006, the area of land for construction in the study area began to expand, the size of the water areas began to grow, and the cropland area around Jijihu maintained a stable and small increasing trend. However, the primary forest and grassland areas decreased significantly relative to 2000 and 2005. The rate of increase in the area of other land types was much lower than the rate of decrease in grassland, resulting in an increased area of barren land in the study area and total ESV in 2020. The highest ES value was observed in 2020.
Regarding spatial distribution, high-value areas of ESV in 2000 and 2005 were distributed in the study area’s southwestern, central, and northeastern parts, which had higher proportions of forest and grassland areas. In general, cropland’s ESV coefficient was smaller than that of forest and grassland, and the ESV was also smaller [59]. From 2010 to 2020, regions of high ecological value were predominantly concentrated in the central, western, and northern areas. This distribution can be attributed to environmental conservation initiatives implemented by the government, such as the establishment of nature reserves, parks, and ecological red-line areas. According to the results of Moran’s index and hotspot analysis, it can be seen that the value of ESs in the study area shows a significant positive autocorrelation, indicating that the value of regional ESs is not randomly distributed but has a more apparent spatial clustering effect, with high values converging and low values adjacent to each other. Generally, the more clustered the spatial distribution, the lower the degree of ecological spatial fragmentation, and the higher level of positive clustering contributes to ecological spatial delineation [59] and the realization of ecological environmental zoning control in the Zhundong area.
The results of the single-factor detection show that LULC was the dominant factor driving change in ecosystem service value, followed by precipitation. According to the two-factor interaction detection results, the interaction between temperature and LULC and DEM and LULC is significantly more robust than the others—the change in LULC results from human activities. At the same time, slight topographic relief, suitable temperature, and sufficient precipitation can provide a better living space for the growth and development of plants and animals, which can quickly form an area with rich biodiversity and good HQ. The results of the two-factor interaction detection indicate that the spatial differentiation of ESV in the Zhundong coalfield results from the combined effect of physical geographic and human factors.
The results of this study can provide a theoretical basis for the development of ecological management strategies in the prospective eastern region. Quantifying the contribution of the ecological environment in the study area into an economic value and improving HQ will increase the ESV of the study area and will help the stakeholders to fully understand the importance of the ecological environment to socioeconomic development. This quantitative assessment provides a basis for the development of scientifically based ecological management strategies and ensures that decision makers take into full consideration the balance between environmental protection and economic development when formulating policies.

4.3. Optimization Strategies for Ecological Governance in the Zhundong Region

This study took the fragile ecological background of the Zhundong coalfield as the research object. It explored the dynamic evolution, spatial variation, and drivers of the regional HQ change characteristics and ESV from 2000 to 2020 with the help of spatial analysis software ArcGIS and Geoda, the InVEST model, and the geographic probe model.
Based on the Land Spatial Plan of the Zhundong Economic and Technological Development Zone (2012–2030), and in conjunction with in-depth analyses of the region’s current development and natural geographic features, the results of the HQ and ESV analyses were fully utilized to formulate an ecological management strategy for the Zhundong area.
For areas with a low HQ and low ecosystem service value, decision makers need to take effective management measures to improve the HQ and ESV in order to lay the foundation for sustainable development. Areas with a poor HQ and a low value of the ecosystem services around coal field mining areas in the Zhundong region can be used to repair damaged ecosystems and promote biodiversity restoration through measures, such as vegetation planting and afforestation. This can improve ecosystem services, such as soil retention capacity, water purification capacity, and climate regulation. Water sources around mining areas should be protected or rehabilitated, and water resource development and utilization planning should be strengthened to improve the quality and sustainability of water sources. Water source protection zones should be set up around mining areas, and the scope, protection objectives, and restrictive measures of these zones should be delineated and activities, such as development and mining, should be strictly controlled so as to avoid pollution and destruction, while soil and water conservation measures can be taken to reduce soil erosion and water pollution. Decision makers should also strengthen scientific research and technical support, promote advanced water resource management steps and techniques, and improve the science and effectiveness of water resource development and management. When considering the scale of coal utilization and its related industries, more water resources should be developed, and production should be based on water. In the southern regions where land desertification is a serious threat, the government is actively promoting measures such as greening vegetation, returning farmland to forests and grasslands, and planting well-adapted economic forests in order to restore vegetation cover and improve, repair, and rebuild the ecological environment. It is also restoring soil quality and fertility around mining areas, improving soil structure, and enhancing the adaptability of crops and the ecological environment through methods such as soil pollution control and soil improvement.
The government and relevant departments have been implementing the regional development strategy of the state and the autonomous region and the strategy of the main functional area and have actively taken a series of practical and effective measures to commit to ecological restoration and protection and build the core guiding principles of the overall spatial pattern of “one belt, two centers” (refer to Figure 12). This pattern closely relies on the natural geographical pattern, which not only highlights the regional characteristics but also embodies the concept of the deep integration of green development and ecological priority. Through careful planning and layout, the “one belt”, i.e., the Jundong Linkage Development Belt, will give full play to the advantages of the transport corridor, linking the two major comprehensive life service bases of Wucaiwan and Splendid Lake, as well as the major industrial development areas in the whole region, facilitating the harmonious coexistence of industry and ecology. As the core engine of industrial development and the important support of ecological protection, the “two centers” will further improve the quality of regional habitats through scientific and reasonable spatial layout, infrastructure construction, and resource recycling and create a more livable and workable living environment for people. The Zhundong region should adhere to green, low-carbon, and sustainable development, promote industrial optimization and adjustment, rationally utilize resources, and strengthen environmental protection. The government should implement eco-efficiency assessment, incorporate it into enterprise performance evaluation, and encourage green technology innovation and clean energy use. They should also limit the scale of production in mining areas, adopt energy-saving and environmentally friendly technologies, establish an ecological compensation mechanism, and try out economic compensation schemes. In addition, decision makers should improve the system of the paid use of resources, promote the capitalization and marketization of environmental resources, establish a deposit system for ecological environment restoration and management, strengthen the responsibility for ecological protection and restoration, and realize the rational allocation and efficient use of environmental resources. Through this series of efforts, the government will facilitate a win–win development of economic, social, and ecological benefits, lay a solid foundation for sustainable development in the region, contribute to the rational allocation and efficient use of environmental resources, provide a stable source of funding for ecological protection, and promote ecological environment protection and restoration.

4.4. Limitations and Future Work of this Study

This study takes the Zhundong region with a fragile ecological background as the research object. With the help of spatial analysis software ArcGIS, Geoda and the InVEST model, it performs geodetic detector model computational processing and explores the dynamic evolution, spatial differentiation, and driving factors of the regional HQ change characteristics and ESV from 2000 to 2020. The results of this study can encourage the relevant departments to formulate more reasonable and scientific ecological planning so that the economic and ecological benefits can be coordinated and positively developed; they can provide a scientific basis for green mining practices and the ecologically sustainable development of the Zhundong Mining Area; they can provide a reference and a strategy for the management of the land resources and the planning of the ecosystem sustainable development of this arid open-pit mining area; and they can have a certain reference value for the ecological environmental protection and governance of the study area and the control of the sub-area. However, there are still some shortcomings in this study due to the special characteristics of the study area, which does not belong to a separate administrative unit and is rich in resources, meaning that the problem of confidentiality regarding the relevant data restricts the mastery of the regional economic development data. Therefore, in the current study, less is known about the economic development data of the region. In future research, by working closely with the regional management unit and seeking relevant data, it will be possible to address the problem of insufficient knowledge of regional economic development data and further study the relationship between economic development and ESV in the Zhundong region in greater depth.

5. Conclusions

By analyzing the dynamic evolution of HQ changes and ESV in the Zhundong coalfield from 2000 to 2020, as well as the spatial differentiation and its driving factors, the following conclusions were formed:
(1)
The main LULC types in the Zhundong coalfield from 2000 to 2020 were grassland and barren areas. The LULC pattern changed significantly in 2010 after the national government and the autonomous region started to exploit the Zhundong coalfield in 2006. The impervious area in the study area is mainly distributed near the mines, mainly for industrial and mining purposes or for residential purposes for mine workers and their families; the cropland in the study area occupies a minimal area, mainly around the Jijihu area.
(2)
The HQ of the Zhundong coalfield shows a general trend of degradation. This is related to the fragile ecological environment of Zhundong itself, changes in LULC patterns, and a series of mining activities conducted in the study area. However, the local government has also implemented ecological protection measures, such as the establishment of nature reserves, geological parks, national public welfare forests, and the creation of ecological red lines, which have gradually increased the proportion of areas with low values of HQ degradation in the study area.
(3)
From 2000 to 2020, the total ESV of cropland, water, and barren regions in the Zhundong coalfield witnessed an increase, whereas the ESV of grassland decreased. Notably, the sensitivity indices of the ESV in the Zhundong coalfield remained below 1, confirming the reliability of our analysis. Spatial autocorrelation analysis revealed a significant clustering pattern in the spatial distribution of the ESV, with high values clustering together and low values being adjacent. Notably, no coldspot areas were observed within the study area.
(4)
Single-factor detection analysis indicated that LULC is the primary determinant of ESV in the Zhundong area. Two-factor interaction detection primarily revealed enhancement and non-linear enhancement, suggesting that the spatiotemporal variations in ESV in the Zhundong coalfield arise from the combined influence of both natural and anthropogenic factors.
In conclusion, opencast coal mining has the potential to negatively impact the ESV and HQ. The mining activities have not only contributed to land degradation and habitat fragmentation in the Zhundong area but have also resulted in changes in land use, thereby negatively affecting the health of the ecosystem. It is, therefore, essential to develop and implement targeted environmental protection policies and measures during the mining process to minimize the detrimental effects on the ecosystem and achieve a win–win situation for both the economy and the environment.

Author Contributions

Investigation, T.Y.; supervision, R.E.; writing—original draft, A.A. (Adila Akbar); writing—review and editing, A.A. (Adila Akbar) and A.A. (Abudukeyimu Abulizi). All authors have read and agreed to the published version of the manuscript.

Funding

This research was funded by the Key Project of Joint Funds of the National Natural Science Foundation of China, “The coal resources of protective exploitation and environmental effects in Xinjiang” (Grant No. U1903209).

Data Availability Statement

Data are contained within this article.

Acknowledgments

This work was supported by the National Natural Science Foundation of China (Grant No. U1903209), to which we are grateful.

Conflicts of Interest

The authors declare that there are no conflicts of interest.

References

  1. Liang, W.; Zhao, G.; Wu, H.; Chen, Y. Assessing the risk degree of goafs by employing hybrid TODIM method under uncertainty. Bull. Eng. Geol. Environ. 2019, 78, 3767–3782. [Google Scholar] [CrossRef]
  2. Asr, E.T.; Kakaie, R.; Ataei, M.; Mohammadi, M.R.T. A review of studies on sustainable development in mining life cycle. J. Clean. Prod. 2019, 229, 213–231. [Google Scholar] [CrossRef]
  3. Saedpanah, S.; Amanollahi, J. Environmental pollution and geo-ecological risk assessment of the Qhorveh mining area in western Iran. Environ. Pollut. 2019, 253, 811–820. [Google Scholar] [CrossRef]
  4. Yunfei, G.; Yi, W.; Guoqing, W.; Yishu, W.; Haiping, L.; Jing, C.; Dingcheng, L.; Fengxiao, W. Exploring on the construction paths to green mine in coal enterprises towards the goal of carbon peak and carbon neutrality. China Coal 2022, 48, 16–20. [Google Scholar] [CrossRef]
  5. Xiao, W.; Fu, Y.; Wang, T.; Lv, X. Effects of land use transitions due to underground coal mining on ecosystem services in high groundwater table areas: A case study in the Yanzhou coalfield. Land Use Policy 2018, 71, 213–221. [Google Scholar] [CrossRef]
  6. Fu, C.; Haochen, Y.; Zhengfu, B.; Dengyu, Y. How to handle the crisis of coal industry in China under the vision of carbon neutrality. J. China Coal Soc. 2021, 46, 1808–1820. [Google Scholar] [CrossRef]
  7. Suping, P.; Yinli, B. Strategic Consideration and core technology about environmental ecological restoration in coal mine areas in the Yellow River basin of China. J. China Coal Soc. 2020, 45, 1211–1221. [Google Scholar] [CrossRef]
  8. Hilson, G. Sustainable development policies in Canada’s mining sector: An overview of government and industry efforts. Environ. Sci. Policy 2000, 3, 201–211. [Google Scholar] [CrossRef]
  9. Li, F.; Liu, X.; Zhao, D.; Wang, B.; Jin, J.; Hu, D. Evaluating and modeling ecosystem service loss of coal mining: A case study of Mentougou district of Beijing, China. Ecol. Complex. 2011, 8, 139–143. [Google Scholar] [CrossRef]
  10. Shuzhi, L.; Xueliang, L.; Dawei, Y. Several basic issues of ecological restoration of coal mines under background of carbon neutrality. Coal Sci. Technol. 2022, 50, 286–292. [Google Scholar] [CrossRef]
  11. Crecente, R.; Alvarez, C.; Fra, U. Economic, social and environmental impact of land consolidation in Galicia. Land Use Policy 2002, 19, 135–147. [Google Scholar] [CrossRef]
  12. Kareiva, P.; Wennergren, U. Connecting landscape patterns to ecosystem and population processes. Nature 1995, 373, 299–302. [Google Scholar] [CrossRef]
  13. Lindenmayer, D.B.; Franklin, J.F. Managing Stand Structure as Part of Ecologically Sustainable Forest Management in Australian Mountain Ash Forests. Conserv. Biol. 1997, 11, 1053–1068. [Google Scholar] [CrossRef]
  14. Liu, Y.; Li, J.; Zhang, H. An ecosystem service valuation of land use change in Taiyuan City, China. Ecol. Model. 2011, 225, 127–132. [Google Scholar] [CrossRef]
  15. Rukundo, E.; Liu, S.; Dong, Y.; Rutebuka, E.; Asamoah, E.F.; Xu, J.; Wu, X. Spatio-temporal dynamics of critical ecosystem services in response to agricultural expansion in Rwanda, East Africa. Ecol. Indic. 2018, 89, 696–705. [Google Scholar] [CrossRef]
  16. Schleuning, M.; Ngereza, C.; Sierra-Cornejo, N.; Huwe, B.; Dulle, H.I.; Tschapka, M.; Detsch, F.; Böhning-Gaese, K.; Frederiksen, S.B.; Kiese, R.; et al. Climate–land-use interactions shape tropical mountain biodiversity and ecosystem functions. Nature 2019, 568, 88–92. [Google Scholar] [CrossRef] [PubMed]
  17. Wu, C.; Chen, B.; Huang, X.; Wei, Y.H.D. Effect of land-use change and optimization on the ecosystem service values of Jiangsu province, China. Ecol. Indic. 2020, 117, 106507. [Google Scholar] [CrossRef]
  18. Zhang, F.; Tiyip, T.; Feng, Z.D.; Kung, H.-T.; Johnson, V.C.; Ding, J.L.; Tashpolat, N.; Sawut, M.; Gui, D.W. Spatio-Temporal Patterns of Land Use/Cover Changes Over the Past 20 Years in the Middle Reaches of the Tarim River, Xinjiang, China. Land Degrad. Dev. 2015, 26, 284–299. [Google Scholar] [CrossRef]
  19. Hillard, E.M.; Nielsen, C.K.; Groninger, J.W. Swamp rabbits as indicators of wildlife habitat quality in bottomland hardwood forest ecosystems. Ecol. Indic. 2017, 79, 47–53. [Google Scholar] [CrossRef]
  20. Costanza, R.; d’Arge, R.; Groot, R.D.; Farber, S.; Grasso, M.; Hannon, B.; Limburg, K.; Naeem, S.; O’Neill, R.V.; Paruelo, J.; et al. The value of the world’s ecosystem services and natural capital. Ecol. Econ. 1998, 25, 3–15. [Google Scholar] [CrossRef]
  21. Robert, C.; Rudolf, D.G.; Paul, S.; Sander, V.D.P.; Anderson, S.J.; Ida, K.; Stephen, F.; Kerry, T.R. Changes in the global value of ecosystem services. Glob. Environ. Chang. 2014, 26, 152–158. [Google Scholar] [CrossRef]
  22. Daily, G.C. Nature’s Services: Societal Dependence on Natural Ecosystems (1997). In The Future of Nature; Libby, R., Sverker, S., Paul, W., Eds.; Yale University Press: New Haven, CT, USA, 2013; pp. 454–464. [Google Scholar]
  23. Hao, R.; Yu, D.; Liu, Y.; Liu, Y.; Qiao, J.; Wang, X.; Du, J. Impacts of changes in climate and landscape pattern on ecosystem services. Sci. Total Environ. 2017, 579, 718–728. [Google Scholar] [CrossRef] [PubMed]
  24. Polasky, S.; Nelson, E.; Pennington, D.; Johnson, K.A. The Impact of Land-Use Change on Ecosystem Services, Biodiversity and Returns to Landowners: A Case Study in the State of Minnesota. Environ. Resour. Econ. 2011, 48, 219–242. [Google Scholar] [CrossRef]
  25. Song, W.; Deng, X. Land-use/land-cover change and ecosystem service provision in China. Sci. Total Environ. 2017, 576, 705–719. [Google Scholar] [CrossRef] [PubMed]
  26. Zhang, Z.; Xia, F.; Yang, D.; Huo, J.; Chen, H.J.E.I. Spatiotemporal characteristics in ecosystem service value and its interaction with human activities in Xinjiang, China. Ecol. Indic. 2020, 110, 105826. [Google Scholar] [CrossRef]
  27. Hu, S.; Yang, Y.; Li, A.; Liu, K.; Mi, C.; Shi, R. Integrating Ecosystem Services Into Assessments of Sustainable Development Goals: A Case Study of the Beijing-Tianjin-Hebei Region, China. Front. Environ. Sci. 2022, 10, 897792. [Google Scholar] [CrossRef]
  28. Ry, A.; Fu, R.; Wx, C.; Xm, A.; Hz, D.; Wh, A. China’s ecosystem service value in 1992–2018: Pattern and anthropogenic driving factors detection using Bayesian spatiotemporal hierarchy model—ScienceDirect. J. Environ. Manag. 2022, 302, 114089. [Google Scholar] [CrossRef] [PubMed]
  29. Farley, J.; Costanza, R. Payments for ecosystem services: From local to global. Ecol. Econ. 2010, 69, 2060–2068. [Google Scholar] [CrossRef]
  30. Groot, R.D.; Brander, L.; Ploeg, S.V.D.; Costanza, R.; Bernard, F.; Braat, L.; Christie, M.; Crossman, N.; Ghermandi, A.; Hein, L.; et al. Global estimates of the value of ecosystems and their services in monetary units. Ecosyst. Serv. 2012, 1, 50–61. [Google Scholar] [CrossRef]
  31. Tolessa, T.; Senbeta, F.; Abebe, T. Land use/land cover analysis and ecosystem services valuation in the central highlands of Ethiopia. For. Trees Livelihoods 2017, 26, 47–54. [Google Scholar] [CrossRef]
  32. Gao-Di, X.; Lin, Z.; Chun-Xia, L.; Yu, X.; Cao, C. Expert Knowledge Based Valuation Method of Ecosystem Services in China. J. Nat. Resour. 2008, 23, 911–919. [Google Scholar]
  33. Chen, Y.; Li, Z.; Li, P.; Zhang, Y.; Liu, H.; Pan, J. Impacts and Projections of Land Use and Demographic Changes on Ecosystem Services: A Case Study in the Guanzhong Region, China. Sustainability 2022, 14, 3003. [Google Scholar] [CrossRef]
  34. Fa, Z.; Rusuli, Y.; Tuersun, A. Spatio-temporal change of ecosystem service value in Bosten Lake Watershed based on land use. Acta Ecol. Sin. 2021, 41, 5254–5265. [Google Scholar]
  35. Ge, Q.; Xu, W.; Fu, M.; Han, Y.; An, G.; Xu, Y. Ecosystem service values of gardens in the Yellow River Basin, China. J. Arid Land 2022, 14, 284–296. [Google Scholar] [CrossRef]
  36. Norgaard, R.B. Ecosystem services: From eye-opening metaphor to complexity blinder. Ecol. Econ. 2009, 69, 1219–1227. [Google Scholar] [CrossRef]
  37. Larondelle, N.; Haase, D. Valuing post-mining landscapes using an ecosystem services approach—An example from Germany. Ecol. Indic. 2012, 18, 567–574. [Google Scholar] [CrossRef]
  38. Ting, L. The Research on InVEST Soil Conservation Model Based on LUCC in Danjiang Basin of Qinling Mountain. Master’s Thesis, Northwestern University, Evanston, IL, USA, 2015. [Google Scholar]
  39. Li, Y.; Duo, L.; Zhang, M.; Yang, J.; Guo, X. Habitat quality assessment of mining cities based on InVEST model—A case study of Yanshan County, Jiangxi Province. Int. J. Coal Sci. Technol. 2022, 9, 28. [Google Scholar] [CrossRef]
  40. Butsic, V.; Shapero, M.; Moanga, D.; Larson, S. Using InVEST to assess ecosystem services on conserved properties in Sonoma County, CA. Calif. Agric. 2017, 71, 81–89. [Google Scholar] [CrossRef]
  41. Jinghua, L.; Wei, Z.; Yanhua, F.; Zhenqi, H. The value of ecosystem services in Hegang coal minig area. Acta Ecol. Sin. 2021, 41, 1728–1737. [Google Scholar]
  42. Baojie, L.; Aixue, Q.; Hehe, G.; Yazhou, J. Effects of land use change on values of ecosystem services of Jiawang minig area. Ecol. Sci. 2015, 34, 147–153. [Google Scholar] [CrossRef]
  43. Yaolong, D.; Jun, W.; Zhongke, B.; Xiaohui, C.; Yiqiang, G. Changes in Pingshuo opencast minig area ecosystem service values based on grey prediction modeling. Resour. Sci. 2015, 37, 494–502. [Google Scholar]
  44. Yuan, S.; Fucun, F.; Ninghu, S.; Liya, T.; Qingjun, M.; Wang, H. Evaluation of ecosystem service value in Xinglongzhuang Coal mine. China Coal 2020, 46, 81–86. [Google Scholar] [CrossRef]
  45. Erfu, D.; Yahui, W. Spatial heterogeneity and driving mechanisms of water yield service in the Hengduan Mountain region. Acta Geogr. Sin. 2020, 75, 607–619. [Google Scholar]
  46. Xiuming, W.; Xucheng, L.; Yingxian, L.; Yinbo, Z.; Wei, L.; Man, H.; Xiaodong, Y. Spatial-Temporal Changes and Influencing Factors of Ecosystem Services in Shaoguan City Based on Improved InVEST. Res. Soil Water Conserv. 2020, 27, 381–388. [Google Scholar] [CrossRef]
  47. Jie, Y.; Bao-Peng, X.; De-Gang, Z. Spatio-temporal variation of water yield and its response to precipation and land use change in the Yellow River Basin based on InVEST model. Chin. J. Appl. Ecol. 2020, 31, 2731–2739. [Google Scholar] [CrossRef]
  48. Dashang, W.; Yifeng, L.; Hua, Z.; Zhiyun, O. Ecosystem services’ spatial characteristics and their relationships residents’ well-being in Miyun Reservoir watershed. Acta Ecol. Sin. 2014, 34, 70–81. [Google Scholar]
  49. Nan, X. Study on Remote Sensing Monitoring of Eco-Environment and Assessment Model of Ecological Quality in Zhundong Minig Region. Ph.D. Thesis, Xinjiang University, Ürümqi, China, 2018. [Google Scholar]
  50. Fang, L.; Kai, Y.; Jinling, Z.; Wenya, G.; Suqin, Y. Temporal and sapatial Variations of Land uses and Their Influences on Ecosystem Service Values around the opencast Coal minig Area of East Junggar Basin in Xinjiang. Ecol. Econ. 2021, 37, 169–175. [Google Scholar]
  51. Zeng-Yun, Z.; Kasimu, A. Spatial-temporal evolution of habitat quality in Yili Valley based on geographical detector and its influencing factors. Chin. J. Ecol. 2020, 39, 3408–3420. [Google Scholar] [CrossRef]
  52. Ying, F.; Hongwei, W.; Shengtian, Y.; Qin, L.; Jiayao, H.; Yibo, G. Identification of ecological protection crucial areas in Altay Prefecture based on habitat quality and ecological security pattern. Acta Ecol. Sin. 2021, 41, 7614–7626. [Google Scholar]
  53. Ziyao, W.; Chuli, H.; Liang, L.; Qing, L. Ecological zoning plannig and dynamic evaluation couple with Invest-HFI-Plus model: A case study in Bortala Mongolian Autonomous Prefecture. Acta Ecol. Sin. 2022, 42, 5789–5798. [Google Scholar]
  54. Bo, W.; Taibao, Y. Value evalution and driving force analysis of ecosystem services in Yinchuan City from 1980 to 2018. Arid Land Geogr. 2021, 42, 552–564. [Google Scholar]
  55. Mallegowda, P.; Rengaian, G.; Krishnan, J.; Niphadkar, M. Assessing Habitat Quality of Forest-Corridors through NDVI Analysis in Dry Tropical Forests of South India: Implications for Conservation. Remote Sens. 2015, 7, 1619–1639. [Google Scholar] [CrossRef]
  56. Chunfang, L.; Chuan, W. Spatio-temporal evolution characteristics of habitat quality in the Loess Hilly Region based on land use change: A case study in Yuzhong County. Acta Ecol. Sin. 2018, 38, 7300–7311. [Google Scholar]
  57. Bo, X.; Mingming, Z. Spatio-temporal evolution and driving forces of habitat quality in Guizhou Province. Sci. Rep. 2023, 13, 6908. [Google Scholar] [CrossRef] [PubMed]
  58. Zhao, Y.; Zheng, W.; Xiao, W.; Zhang, S.; Lv, X.; Zhang, J. Rapid monitoring of reclaimed farmland effects in coal mining subsidence area using a multi-spectral UAV platform. Environ. Monit. Assess. 2020, 192, 1–19. [Google Scholar] [CrossRef]
  59. Lin, F.; Jun, C.; Yan-Xiao, L.; Hong-Wei, Y.; Can-Feng, L. Dynamic Evolution of Ecosystem Service Value in Yangtze River Delta and Analysis on the Driving Factors. J. Ecol. Rural Environ. 2022, 38, 556–565. [Google Scholar] [CrossRef]
Figure 1. Schematic diagram of the study area.
Land 13 00623 g001
Figure 2. Distribution of land use types in the Zhundong region, 2000–2020.
Land 13 00623 g002
Figure 3. HQ in the Zhundong region, 2000–2020.
Land 13 00623 g003
Figure 4. Percentage stacked graph of HQ, 2000–2020.
Land 13 00623 g004
Figure 5. Degree of habitat degradation in the Zhundong coalfield between 2000 and 2020.
Land 13 00623 g005
Figure 6. Spatial distribution of ESV in Zhundong region, 2000–2020.
Land 13 00623 g006
Figure 7. Scatterplot of Moran’s I index for Zhundong coalfield between 2000 and 2020.
Land 13 00623 g007
Figure 8. Distribution of cold- and hotspots of ESV in Zhundong, 2000–2020.
Land 13 00623 g008
Figure 9. Ranking of q-values in the Zhundong area, 2000–2020.
Land 13 00623 g009
Figure 10. Heat map of ESV interaction detection, 2000–2020.
Land 13 00623 g010
Figure 11. Folding graph of the change in total ESV in the Zhundong coalfield, 2000–2020.
Land 13 00623 g011
Figure 12. Spatial structure plan for the Zhundong region.
Land 13 00623 g012
Table 1. Data source.
Data NameData ResourcesSpatial ResolutionUtilization
LULC dataResource and Environment Science and Data Center of the Chinese Academy of Sciences (https://resdc.cn/, accessed on 20 Mar 2023)30 m (2000, 2005, 2010, 2015, 2020)Analysis of LULC changes; InVEST model; calculation of ESV; geodetector model drivers (human factor)
DEMGeospatial data cloud platform of the Computer Network Information Center of the Chinese Academy of Sciences (http://www.gscloud.cn, accessed on 21 Mar 2023)30 mGeodetector model drivers (natural factor)
Temperature and precipitation dataNational Scientific Data Center of Qinghai–Tibet Plateau (https://data.tpdc.ac.cn/, accessed on 12 May 2023)1 kmGeodetector model drivers (natural factor)
NDVINational Scientific Data Center (https://escience.org.cn/, accessed on 21 May 2023)30 mGeodetector model drivers (natural factor)
Socioeconomic dataXinjiang Statistical Yearbook, China Agricultural Statistical Yearbook 1990–2020 and the National Agricultural Cost-Effectiveness Information Overview (accessed on 4 May 2023)/Assessment of the ESV
Table 2. Threat source weights and maximum impact distance.
ThreatMax_DistWeightDecay
Cropland20.2Liner
Impervious81Exponential
Barren30.4Liner
Table 3. Sensitivity of LULC types to threat factors.
LulcHabitatCroplandImperviousBarren
Cropland0.40.20.90.5
Forest10.50.80.2
Grassland0.90.20.50.3
Water10.40.60.5
Impervious0000
Barren0.10.10.30.2
Table 4. Table of ESV coefficients for each land use type.
ESCroplandForestGrasslandWaterImperviousBarren
FP1337.05397.18367.031258.4007.86
RMs629.20912.34540.06361.79023.59
WS31.46471.90298.8713,040.15015.73
GR1053.913000.491898.081211.210102.24
CR566.288977.885017.863602.16078.65
PE157.302630.841656.898730.130322.46
HR424.715875.143675.57160,823.240188.76
SC1620.193653.292312.311462.890117.97
NCM188.76279.21178.27110.1107.86
BM204.493326.892102.574011.140110.11
ALP94.381458.95928.072972.96047.19
Total6307.7230,984.1118,975.59197,584.1901022.45
Note: FP: food production; RMs: raw materials; WS: water supply; GR: gas regulation; CR: climate regulation; PE: purify the environment; HR: hydrology regulation; WT: waste treatment; SC: soil conservation; NCM: nutrient circulation maintenance; BM: biodiversity maintenance; ALP: aesthetic landscape provision.
Table 5. Land use area, 2000–2020 (unit: km2).
20002005201020152020
Cropland0.450.580.560.670.67
Forest8.928.940.610.620.62
Grassland2306.272306.311184.921164.66969.52
Water0.000.000.005.245.78
Impervious5.395.39129.53198.13244.10
Barren13,145.1213,144.9214,150.5614,096.8714,245.44
Table 6. Total ESV by category in the Zhundong coalfield, 2000–2020 (unit: 10,000 CNY/km2).
CroplandForestGrasslandWaterImperviousBarren
20000.28127.6384376.287001344.020
20050.36627.7124376.354001344.000
20100.3531.9032248.456001446.821
20150.4251.9132210.007103.60101441.332
20200.4201.9201839.717114.17401456.522
Table 7. Sensitivity index of the ESV of different LULC types in Zhundong from 2000 to 2020.
LULC20002005201020152020
Cropland0.0000160.0000210.0000320.0000380.000041
Forest0.0016030.0016070.0001720.0001700.000170
Grassland0.2537760.2537710.2026990.1960650.179690
Water0000.0091910.011152
Barren0.0779380.0779340.1304310.1278700.142263
Impervious00000
Disclaimer/Publisher’s Note: The statements, opinions and data contained in all publications are solely those of the individual author(s) and contributor(s) and not of MDPI and/or the editor(s). MDPI and/or the editor(s) disclaim responsibility for any injury to people or property resulting from any ideas, methods, instructions or products referred to in the content.

