Article

A Two-Layer SD-ANN-CA Model Framework for Multi-Typed Land Use and Land Cover Change Prediction under Constraints: Case Study of Ya’an City Area, Western China

1
School of Transportation, Southeast University, Nanjing 211189, China
2
College of Civil Aviation, Nanjing University of Aeronautics and Astronautics, Nanjing 211106, China
*
Author to whom correspondence should be addressed.
Land 2024, 13(5), 714; https://doi.org/10.3390/land13050714
Submission received: 4 March 2024 / Revised: 6 May 2024 / Accepted: 17 May 2024 / Published: 19 May 2024
(This article belongs to the Topic Urban Land Use and Spatial Analysis)

Abstract

:
Land use and land cover change (LUCC) prediction of cities in Western China requires higher accuracy in quantitative demand and spatial layout because of complex challenges in balancing relationships between urban constructions and ecological developments. Considering city-level areas and various types of land use and land cover, existing LUCC models without constraint or with only loose demand constraints were impractical in providing evidence of high accuracy and high-resolution predictions in areas facing fierce land competition. In this study, we proposed a two-layer SD-ANN-CA model to simulate and explore the LUCC trend and layout predictions for 2018, 2028, and 2038 in Ya’an City, Western China. The two-layer structure with an upper layer of the SD model and a lower layer of the ANN-CA model, as well as the advantages of all three methods of system dynamics (SD), artificial neural network (ANN), and cellular automata (CA), have allowed us to consider the macro-level demand constraints, meso-level driving factors constraints, and the micro-level spatial constraints into a unified model framework. The simulation results of the year 2018 have shown significant improvement in the accuracy of the ANN-CA model constructed in our earlier work, especially in types of forest land (error-accuracy: 0.08%), grassland (error-accuracy: 0.23%), and construction land (error-accuracy: 0.18%). The layout predictions of all six types of land use in 2028 and 2038 are then carried out to provide visual evidence support, which may improve the efficiency of planning and policy-making processes. Our work may also provide insights into new ways to combine quantitative methods into spatial methods in constructing city-level or even regional-level LUCC models with high resolution.

1. Introduction

Land use and land cover change (LUCC) are considered important indicators reflecting the essential link between human activity process and natural environmental evolution. Understanding the driving mechanism and the simulation of LUCC spatiotemporal dynamics are crucial for designing strategies to address sustainability challenges, including climate change, food security, energy transition, and biodiversity loss [1,2]. The LUCC modeling is used to analyze both the causes and consequences of alternative future landscapes related to diverse socioeconomic and natural environmental driving forces, which is of great importance in enhancing its simulation effectiveness and accuracy [3,4]. However, the data-intensive task, which requires both historical and current land maps as well as data describing multiple drivers, the LUCC modeling has not been extensively tested in empirical studies at different scale contexts until the advancing of remote sensing technology, which increased the LUCC monitoring capacity [5]. Considerable effects are made in existing works of the literature all over the world to witness the LUCC simulation model frameworks being significantly improved from the earliest quantitative methods, which simply predict land use demand and general LUCC trends, to current spatial methods that simulate and rebuild the spatial layout of land use [6,7,8,9,10]. Typical quantitative methods generally include system dynamics (SD), gray models (gms), Markov models (Markov), artificial neural networks (ANN), and the computable general equilibrium of land use change (CGELUC). Common spatial methods generally include the change in land use and effect (CLUE) model, dynamics of land system (DLS) model, cellular automata (CA) model, and multi-agent (MAS) model. Among these, the CA model is known for its dynamic evolvement mechanism and high-resolution microscale analysis capability, which has been widely used in recent decades [11,12,13]. However, the CA model must follow a set of rules of neighboring cells or dynamical transition rules, which are difficult to determine scientifically; therefore, the high-resolution advantage of the CA model can only be presented at small spatiotemporal scales [3]. The overview of the research also pointed out major limitations of most traditional CA model applications in that they only simulated the dynamics of one individual land use/land cover type or have often been applied to small areas like counties or districts. Also, the identified driving factors vary widely across models and are heavily determined by local sites, which may not be considered proper representatives in the perspective of multi-typed land interaction in a broader context [14].
In fact, the LUCC patterns are found to be determined by multiple land types processing simultaneously and affecting each other in larger areas, especially in regions with increasing populations and rapid urbanization where land competitions and changes occur more fiercely [15,16]. Different LUCC trends of diverse land types are obtained in macro-level research, which helps provide essential evidence of driving mechanisms. Causing tremendous decrease in vegetation of natural landscape, urban sprawl and expansion of unplanned built-up areas are considered the biggest threat to other land types, especially in mountain valleys and basins or other ecologically fragile regions [17,18,19]. In regions where the urbanization level is already high, interactions and changes between natural land types are much more obvious. For example, cross-national research in Eastern Europe discovered that agricultural change was captured as generally complementary to forest change during the past 250 years, where forests increased, agriculture decreased, and vice versa [20]. Tokyo Metropolitan Area was also experiencing changes from cropland to other land use/cover types while construction land area was almost stable [21]. Different key factors behind such changes are also discussed in the existing literature. Natural/spatial drivers were described as more influential on land abandonment than on other change processes. Socioeconomic factors like population density and property value were found to be closely related to where new urban development would occur [14]. Political and institutional underlying drivers like protection policy were found to play a dominant role in shaping forestation expansion patterns, and economic factors were most typically related to agricultural expansion/intensification [22]. With such diversities in change patterns and driving mechanisms, it is difficult and challenging to conduct multiple LUCC simulations within one CA model, which can capture complicated interactions and competitions among different land use and land cover types in defining transition rules [3]. Especially in areas particularly sensitive to disturbance in terms of ecosystem services, high accuracy should be considered in both amount and location prediction of land change [23].
To provide a better understanding of both multiple-land macro-level trends and micro-level dynamics, CA-based hybrid or integrated LUCC models for better accuracy have become the hottest topic in geoscience and the RS community [24,25]. With efficiency and convenience being proven to be integrated with other methods, the most widely used CA-based hybrid algorithms are CA-Markov and the ANN-CA [26,27,28,29]. In the CA-Markov algorithm, the Markov matrix determines the number of pixels that transition from each category to every other category during time intervals, while the CA influences the spatial allocation of extrapolated change, which has been applied in studies globally. However, with kappa coefficients ranging from 0.73 to 0.90, there are also arguments about the unstable performance of the CA-Markov algorithm when dealing with large-scale and more complex land use and land cover types [30,31,32,33,34]. With the advent of machine-learning techniques, Artificial Neural Networks (ANN) have proven to be a powerful tool to tackle unprecedented, large-scale, influential challenges [35,36] and are known for the perceptron and recognition logic for establishing essential knowledge about driving factors that could make target patterns happen, which can provide the necessary basis to set evolvement process rules for CA models [12,37]. The application of the ANN-CA algorithm became quite popular in the literature, especially in China and other developing countries with more rapid LUCC change and more competition between different land use/land cover types [38,39,40,41,42]. Significantly higher kappa coefficients are obtained in this research, ranging from 0.81 to 0.94, indicating better performance of ANN-CA when formulating future LUCC scenarios. Based on such an algorithm, some research has considered employing a two-layer simulation framework by introducing macro-demand constraint into the CA-based model, such as the CLUE-S model [43,44] and the FLUS model [3,45,46]. Both frameworks added a demand calculation module for different land types to determine whether the spatial layout simulation process was to be finished, which is processed under logistical regression in the CLUE-S model and under the system dynamics method in the FLUS model. Despite the great progress having been achieved, two limitations exist in the current LUCC simulation models. Firstly, the driving mechanism is still lacking between the demand layer and spatial layout simulation layer in existing model frameworks. Even though the demand layer has considered multiple driving factors to formulate and predict future demand, those identified factors are not considered and tested in the spatial simulation layer to understand their effects in influencing land use and land cover layout, which may bring less coupled results between the macro demand change and the local change allocation. Those links are essential in ecologically fragile areas like Western China, where forest and water conservation, as well as environment protection, play essential roles in national ecological security and understanding of interaction links or feedback between various factors concerning population, socioeconomic features, as well as spatial and environmental heterogeneity, is necessary before the dynamic processes of land-use change can be simulated, which is considered to be the most apparent advantage of systemic dynamics (SD) model [47]. Secondly, considering land use competition under the Chinese rapid urbanization context with limited land resources and high population pressure, micro-level spatial constraints are also needed to improve accuracy in spatial layout. The results have been presented in the existing literature with better space pattern shapes, which are more similar to reality [48,49]; however, their effects have not been tested in a unified LUCC simulation model framework as essential steps.
Therefore, this research proposes an SD-ANN-CA model framework considering macro-level demand constraints, meso-level driving factors, feedback constraints, and micro-spatial heterogeneity constraints for simulating dynamic land-use change processes and predictions. The model framework also contains two layers. In the upper layer, the system dynamics (SD) model is used to determine related driving factors and their interaction links, as well as the total demand of different types of land use as meso-level and macro-level constraints from the perspective of the system. In the lower layer, the ANN-CA model under constraints is built to simplify the transformation rules and facilitate dynamic evolution to explore the land-use trend and layout predictions of 2028 and 2038 in the study area. During this time, spatial gravity center transfer analysis is also considered a micro-level spatial constraint for the final output results. It should be mentioned that this work is also further developed from our earlier preprint version, which can be found at the Research Gate [50]. The preprint can be considered as an attempt to introduce only macro-level demand constraint into the ANN-CA layer. Based on the results, we have then largely improved the whole model framework considering the macro-level demand constraints, meso-level driving factors constraints, and micro-level spatial constraints, which are specifically presented in the following sections.

2. Materials and Methods

2.1. Study Area

Ya’an City is a prefecture-level city located in the transition zone from the Sichuan Basin to the Qinghai–Tibet Plateau, which is widely known as “the City of Rain”, “the throat of Western Sichuan”, “the gate of Tibet”, “the corridor of nationality” and “the lung of heaven”. With the highest vegetation coverage in Sichuan province, ecological and biodiversity environment conservation in Ya’an City is vital for the whole province and even the nation. We can see that the National Nature Reservation area covers most part of Northwestern Ya’an, which is presented in Figure 1. Meanwhile, the urbanization process in Ya’an City is also rapid, yet it suffers the great challenge of limited land resources. Ya’an City has two municipal districts (Yucheng District and Mingshan District) and six counties (Yingjing County, Hanyuan County, Shimian County, Tianquan County, Lushan County, and Baoxing County) with a total area of 15,046 km2 and population of 1.43 million. However, we can see extreme differences from the Digital Elevation Model (DEM) image shown in Figure 1, with large areas of mountains in the western part of the city and relatively small areas of plains, considered residential and productive areas, concentrated in the eastern part. Under the future objective of becoming a national green development demonstration city outlined in Ya’an’s economic and social development agenda, Ya’an faces a significant challenge in balancing relationships of multiple types of land resources concerning urban construction, agricultural production, and eco-environmental protection.

2.2. Data Preparation

This study requires two types of data: numerical data; and geospatial information data (Table 1). To guarantee the operability of this model, spatial data were used as the standard for uniform environmental settings, and the vector data were transformed into raster data using the face transformation raster tool. The coordinate system was unified as WGS_1984_UTM_Zone_48N (EPSG:32648) using the projection raster tool; the pixel size of all spatial data was set as 90 m using the resampling tool. The numbers of rows and columns of the raster data were unified using the clipping tool. To ensure ArcGIS and MATLAB data compatibility, making it convenient for the loose coupling development of the model, the raster format was further transformed into ASCII-GRID format.
Land use status data processing includes image mosaicking and clipping, radiation calibration, and monitoring classification. The land in Ya’an City was divided into six land use types: cultivated land; forest land; grassland; water surface; construction land; and other land. The chart of ultimate land use status in Ya’an City in three phases is shown in Figure 2. Spatial data maps used in the following Ya’an City model were acquired and yielded through the ArcGIS spatial analytical method. The slope and aspect processing of DEM data was performed using a 3D analysis tool. The Euclidean distances in the distribution maps of roads, rivers, and administrative centers were calculated using the spatial analysis tool.
Historical data show that forest land dominated all three time phases, revealing the great ecosystem service value of Ya’an City. A great loss for cultivated land and a great increase in forest land during the period of 1998–2008 was obtained, while the percentage of those two land types remained stable during the period of 2008–2018. Grassland saw a slight decrease while water surface, construction land, and other land maintained growth trends during both time periods of 1998–2008 and 2008–2018. Transitions from cultivated land to forest land, grassland, and construction land were also significantly obtained, which is consistent with the national policy of “Returning farmland to grassland and forest” for Western China’s development. The construction land area in 2018 increased three times compared to 1998, indicating a fast urbanization process in Ya’an City.

2.3. A Two-Layer SD-ANN-CA Model Framework Construction

To better understand land-use change in six land types, including cultivated land, forest land, grassland, water surface, construction land, and other land in Ya’an City, we have established a two-layer simulation model combining the SD model and the ANN-CA model into a uniformed framework. The function of the upper layer was to formulate suitable constraints, including driving factors and critical feedback loops concerning land-use change (labeled as meso-level constraint) and the total demand of six types of land-use, respectively (labeled as macro-level constraint), using the SD method from a more systematic perspective. The function of the lower layer was to predict and output the layout results of all six types of land use, considering all constraints. Specifically, the ANN simulation process in the ANN-CA model was trained under certain relationships of driving factors and feedbacks identified in the SD model layer to determine transformation rules for the CA simulation process. The CA parameters were then set following such rules and simulated under the micro-level land-use spatial center constraint using the gravity transfer analysis method. Moreover, the prediction results of the ANN-CA model were also considered under the macro-level of demand constraint that the result would be output only when the errors between the quantitative prediction area based on the SD model and the simulation areas based on the ANN-CA model of four land use types (cultivated land, construction land, forest land, and grassland) were lower than ±5%. The overall model framework is presented in Figure 3.

2.4. Estimation of Simulation Accuracy

To compare the prediction results with the actual land use and land cover conditions, the following equations for simulation accuracy calculation were adopted:
-
Overall Error-accuracy (OA)
O A = N i n c o r r e c t / N t o t a l
-
The kappa coefficient
K a p p a   c o e f f i c i e n t = ( P a P e ) / ( P i P e )
Equation (1) calculates the proportion of pixels incorrectly predicted among all pixels in the samples, where N i n c o r r e c t is the number of pixels incorrectly predicted by the model; N t o t a l is the total number of pixels. Equation (2) is commonly used in CA simulation assessment, in which K means kappa index; P a represents the actual accuracy; P e is the expected prediction accuracy; and P i is the ideal accuracy (100%).

2.5. Selection of Key Driving Factors

LUCC is the result of the interaction between human activity and land-related biophysical constraints. The existing literature shows that drivers of landscape change can be extremely diverse and that underlying factors consist of combinations of political/institutional, economic, cultural, technical, and natural/spatial drivers, among which the socioeconomic and geographic condition factors are two major categories addressed in various LUCC models [14,22]. Different driving mechanisms concerning driving factors in those two categories have been obtained. Human-environment interactions are mainly reflected by anthropogenic exploitation of land cover and land use under rapid urban expansion and socioeconomic development, and spatial drivers are found to be highly related to land value and are described as fundamental standards to select the potential area for future development [22]. Therefore, it is essential to consider both socioeconomic and spatial factors comprehensively.
Spatial factors considered in related works were relatively fixed, involving elevation, slope, aspect, distance to the main road, distance to rivers, and distance to the administrative center [14], which were also selected in our case. However, the socioeconomic factors used were more diversified. Some researchers highlighted the impact of population density and growth rate on attracting or repelling urban growth [39]. While others argued that the numerical value of total population and industry was also important, the LUCC model would benefit from more detailed population and economic indicators [59]. More comprehensive socioeconomic driving factors, including density, growth rate, and the numerical value of population and industry, may be needed for the two-layer LUCC model for better constraints. In our model framework, the advantage of the SD model layer has enabled us to consider the socioeconomic driving factors based on collected historical data. Together with spatial driving factors, the constraint links between the SD layer and ANN-CA layer allow us to introduce the most significant socioeconomic factors driven by the SD model into the ANN-CA training process for a better understanding of transformation rules. Sixty-nine socioeconomic driving factors were selected, including values, density, and growth rate variables, reflecting subdivided population and economic systems, which are listed in Table 2. The six most commonly used spatial driving factors have also been selected, involving elevation, slope, aspect, distance to the main road, distance to rivers, and distance to the administrative center. However, the spatial factors usually include multiple dimensions and a wide range of values. Normalization processing is commonly used in machine-learning areas to deal with such data to eliminate the impact of dimensions and enhance model convergence speed [4]. Considering the natural topography and larger research areas of Ya’an City have led to a more widely ranged value of spatial factors, such as elevation factor ranging from 500 to above 4500 m, slope factor ranging from 0° to above 45°, distance to main road ranging from 0 to 5000 m; normalization process with such data to range between 0 and 1 is important for better network training speed while still retaining the original probability gradient. Six spatial factors under the normalization process are shown in Figure 4. Apart from these, we also considered the National Nature Reservation area in Ya’an City as a limitation condition as the land use and land cover types in the nature reserve area remain unchanged during any time period.

3. Results

Compared to numerical data, spatial data are considered relatively stable and more difficult to obtain. Therefore, the SD model, which is normally based on numerical data, can simulate year-to-year dynamics of LUCC trend, while the ANN-CA model is more suitable with a decadal time step. In this research, the SD simulation layer generates demand for six types of land use and land cover in the prediction time of 2019–2038 based on historical data of 1998–2018. The ANN-CA simulation layer generated results based on ten-year intervals, meaning that it simulates the LUCC situation in 2018 based on historical data of 1998–2008, validates against actual conditions of 2018, and then projects future scenarios for 2028 based on historical data of 2008–2018, and finally, the long-term future scenario is generated for 2038 based on historical data of 2018 and prediction data of 2028.
The SD simulation model is conducted on Vensim PLE software ver. 5.8.3.1 and the ANN-CA simulation model is conducted based on ArcGIS with GeoSOS extension packages; the simulation process and results of 2018, 2028, and 2038 are discussed in detail in the following sections. It should be mentioned that this model is simulated under the assumption that no major unforeseen events would happen. However, the historical data from 1998 to 2008 and 2008 to 2018 capture events like SARS in 2003 and the Wenchuan earthquake in 2012. The impacts of those events are also learned by the simulation model. Therefore, even though the COVID-19 pandemic occurred during the prediction time of 2018–2028, our model framework is still considered reliable for the 2028 simulation result based on 2008–2018 data.

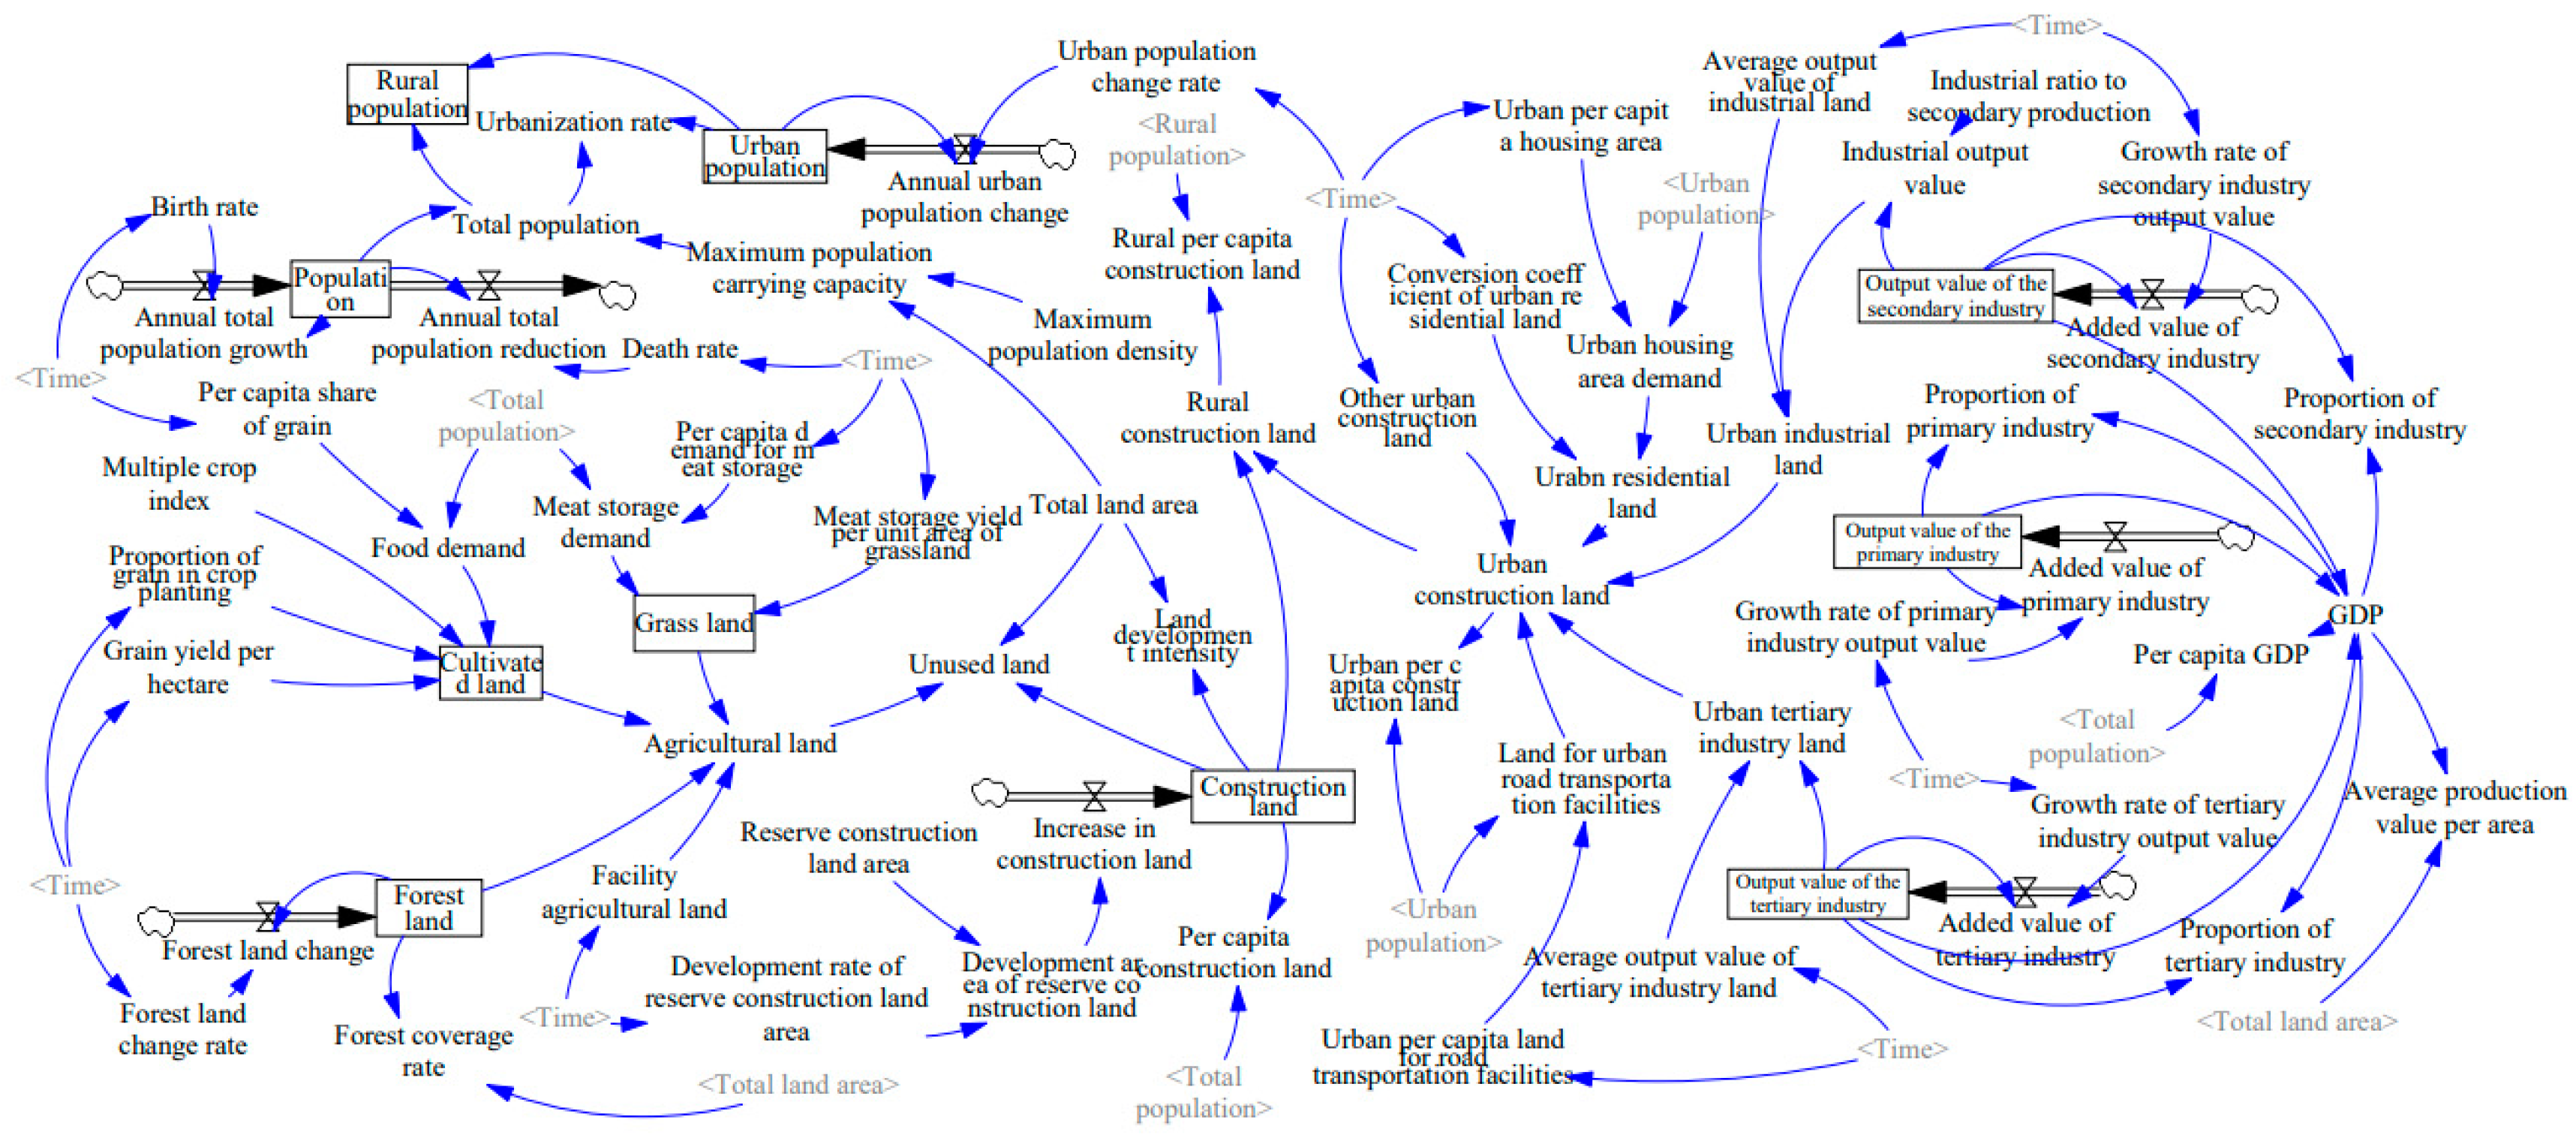
3.1. Simulation and Results of the SD Model Layer

In this layer, the feedback relationships and driving factors among massive variables related to society, economy, and land use were first analyzed from the perspective of the SD model. Then, the future land use demand prediction in Ya’an City was estimated. The data used in the SD model contain two kinds of boundaries. The time boundary for model simulation is from 1998 to 2038. Specifically, years from 1998 to 2018 were historical data years, while years from 2019 to 2038 were prediction years. To decrease the error caused by period changes during prediction, the time step length was set to 1 year. The spatial boundary for model simulation was the administrative regions in Ya’an City, Sichuan Province. The construction and simulation processes of land use prediction by the SD model include drawing the feedback loop chart, establishing system equations, verifying model validity, and model prediction, which were mainly based on Vensim PLE software ver. 5.8.3.1. Additionally, most equations in the SD model were derived through curve fitting in MATLAB software ver. 9.0, while a small portion of them employed specialized functions such as lookup tables and logical functions from the Vensim PLE function library.

3.1.1. Identification of Meso-Level Feedback Constraints

Considering 69 variables concerning the evolutionary process of population, economic, and land resources systems, we identified 13 typical feedback loops using the SD model. Those feedback loops were then calculated and presented in the stock-flow chart, as shown in Figure 5, and 10 variables were labeled as crucial driving factors, including total population, rural population, urban population, cultivated land, forest land, grassland, construction land, the value of the primary industry, the value of the secondary industry, and the value of the tertiary industry. Among these, the population and land-use resource systems interacted through important feedbacks like food demand and cultivated land connected by the total population, meat storage demand, grassland connected by the total population, and construction land and maximum population carrying capacity connected by the total population. Furthermore, the economic system interacted with land resources and population systems through feedback like the value of secondary or tertiary industry and urban industrial land demand connected by construction land and total population. Therefore, the urban population, rural population, and values of primary, secondary, or tertiary industries were considered key socioeconomic factors that needed to be introduced for the following ANN input and training process as meso-level constraints according to those feedbacks.

3.1.2. Identification of Macro-Level Demand Constraint

Based on historical data from 1998 to 2018, the system equations were constructed according to logic relations among variables and statistical data laws for land-use demand estimation for 2018 and the prediction for 2028 and 2038, respectively, which were used as the quantitative constraints in the follow-up simulation process of the constructed ANN-CA model. Table 3 presents the estimation and prediction results of the three specific years. It should be mentioned that the continuous historical data of water surface and other land in the period of 1998–2018 were off record in data collection; we considered the rest of the four types of land as macro-level demand constraints inputted into the lower ANN-CA layer.

3.2. Simulation of the ANN-CA Model Layer under Constraints

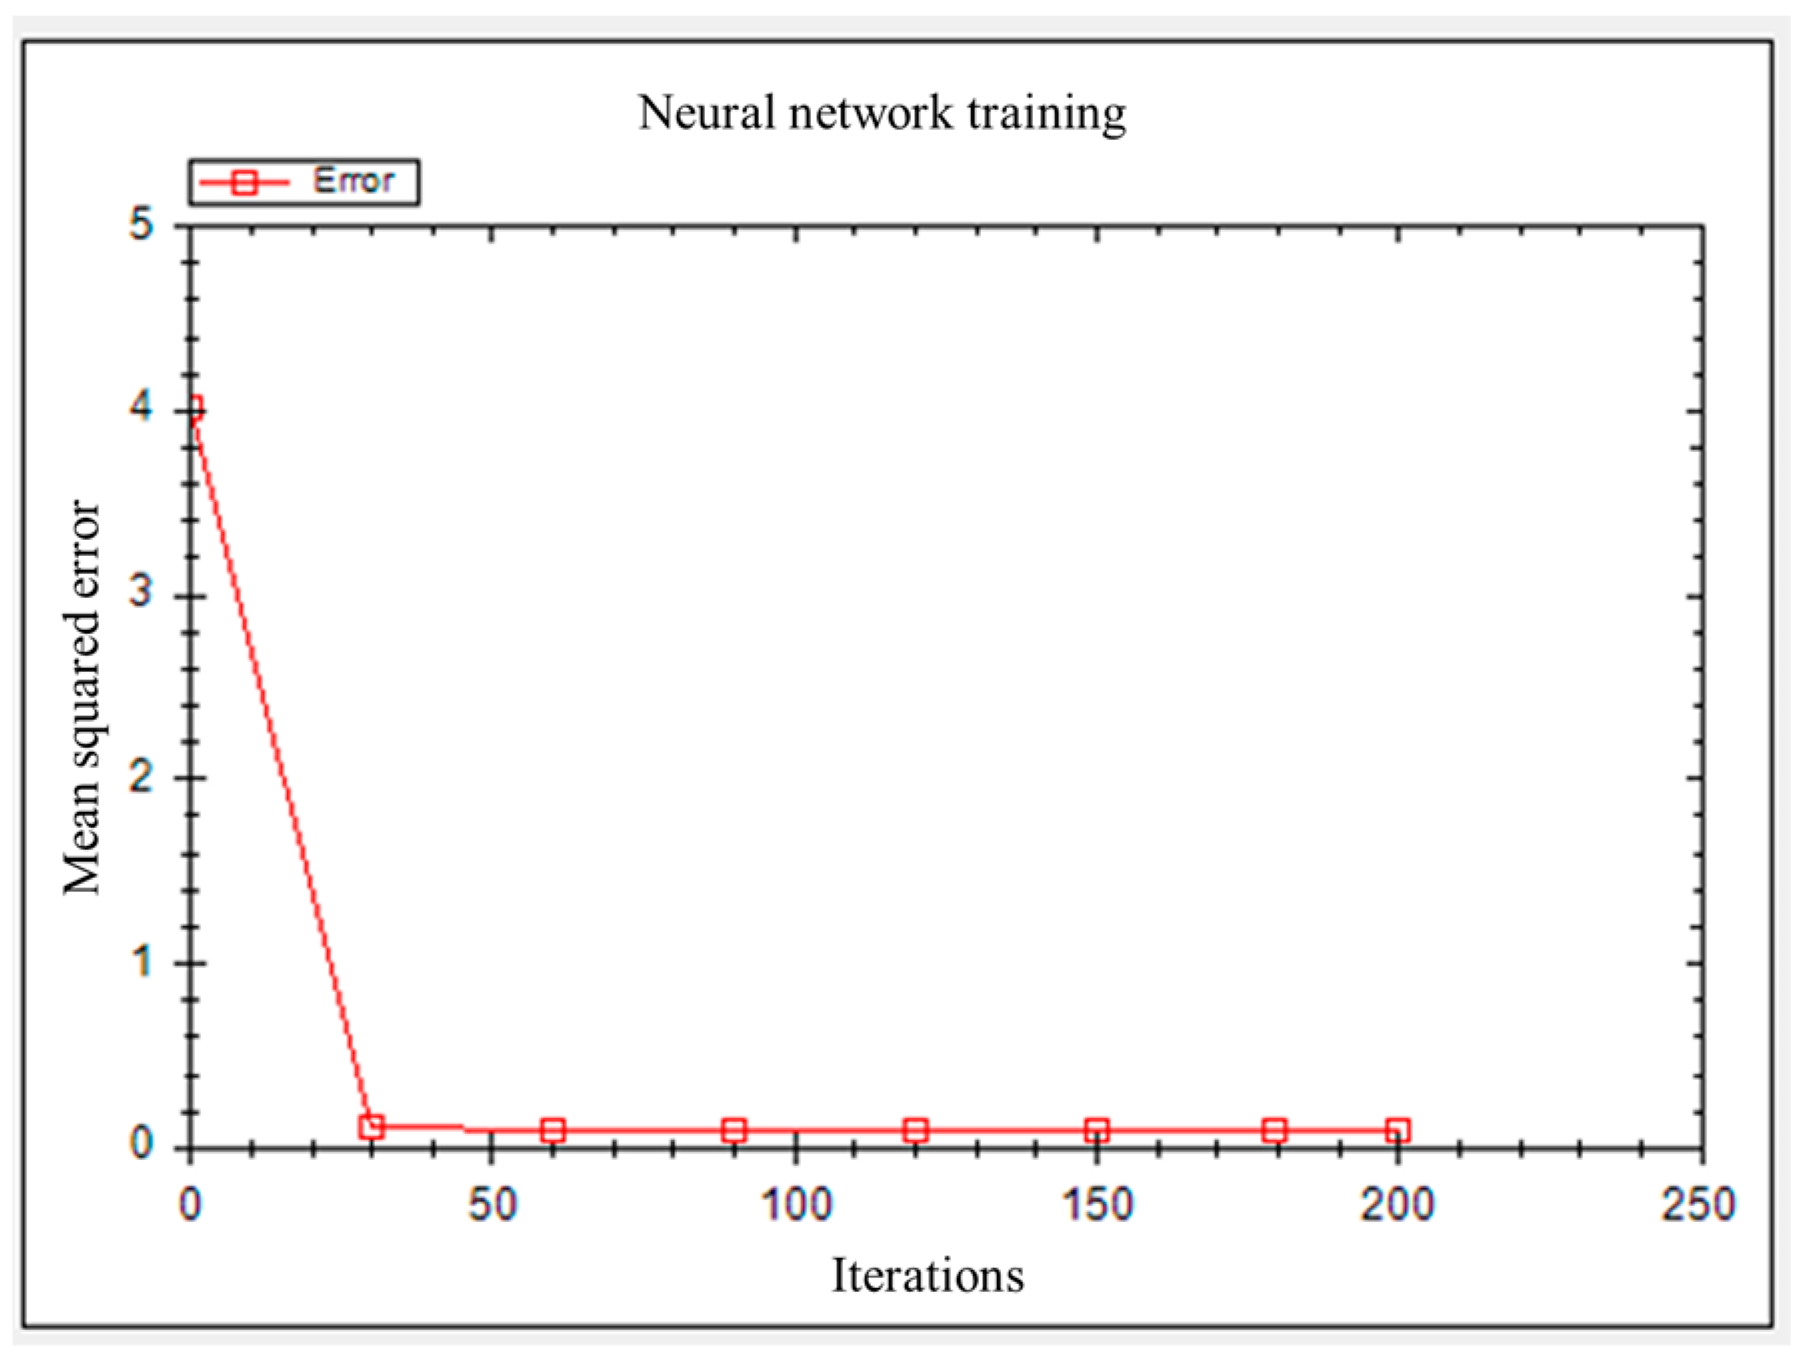
3.2.1. Artificial Neural Network Training under Meso-Level Constraints

In this layer, a three-level back propagation neural network with a structure of 19–10–6 that contains a single hidden layer was built. Specifically, 19 neurons are present in the input level, which correspond to six spatial factors processed before (DEM, slope, aspect, road, river, and administrative center), 12 standardized statistical variables, including ten driving factors captured in the SD model concerning land use types, population and value of the industry in neighbor regions (cultivated land percentage, forest land percentage, grassland percentage, construction land percentage, water surface percentage, other-land percentage, total population, urban population, rural population, value of primary, secondary or tertiary industry), as well as the land use types of the current cells; 10 is the number of neurons in the hidden layer; 6 is the number of neurons in the output layer, which corresponds to the transformation probability of six land use types. Here, the neighbor region for land percentage neurons used the expanded Moore-type neighbor type of r = 3, and cells used the raster grids with a resolution of 90 m × 90 m, while the neighbor region for land percentage for population and industry value neurons was used according to the community panel data we collected. Additionally, we have also considered the external neighbor buffer regions around city administrative boundaries. However, those boundaries are mostly covered by the National Nature Reservation areas, as shown in Figure 1, where those cells remain in the original land use and land cover type as set. The rest of the boundary buffers are covered by cultivated land, which is hard to change and affects the inside cells because of the non-continuous urbanization between cities. Therefore, the matrix of transformation listed in Table 4 is mainly applied inside city boundaries during the simulation process.
The land use, population, industry status in Ya’an City in 1998 and 2008, and spatial influence factor map binary data were input into the model. The simulation process was conducted through the ArcGIS platform for inputting, outputting, and spatial visualization of data while executing ANN and CA-related operations through the GeoSOS extension package for ArcGIS.
Based on land use classification data of 1998, 5% of cells (raster) were randomly selected. The corresponding data of the input and output layers, a total of 92,924 sample data points, were input into the neural network model. The data of the output layer corresponded to cell/raster land use types in 2008. Among these sample data, 80% and 20% were chosen as the training and verification sets of the neural network, respectively. Also, several parameters had to be set before the training progress began. According to earlier training results of the traditional ANN-CA model we applied to one district of Ya’an City, the ANN training network performed well at an e-learning rate of 0.05 and iterations of 100 [49]. Considering the expansion of the simulation area in this study, the e-learning rate was set to 0.05, and the max iteration was set to 200 to test both training accuracy and efficiency. A neural network model was then constructed, and sample data were input. Figure 6 shows the training accuracy of the neural network. The model began to converge at iteration of 30, and there were no significant differences in mean squared error between iterations times of 50 and 200, which meant that the network might perform well with more than 50 iterations. The final training error (MSE) was 0.07898 when the iterations reached 200. The accuracy of the training dataset reaches as high as 93.991%, and the accuracy of the verification set reaches as high as 93.855%. It reflects that the ANN training network under meso-constraint has a faster processing speed and a relatively high degree of fitting that can be coupled with CA for the subsequent land use and land cover simulation.

3.2.2. Setting of CA Parameters Following ANN Rules and Spatial Constraints

Based on the trained neural network model, relevant CA parameters were set to simulate the land use scenario in Ya’an City in 2018. In the specific simulation process, the land use status in Ya’an City in 2008 must be input first and used as the land use data in the first year of the simulation. Moreover, the chart of the land use status in 2018 has to be input as the actual land use data of the terminal year. The data for the final year serve two purposes: one is to set the total transformation quantity of the model simulation. The quantity difference in urban land use raster in the land use data in the terminal year and the first year was used as the total transformation quantity for model simulation, which was calculated to be 6885. The other purpose was to analyze simulation results. The simulation results and actual data were compared to analyze whether the setting of the model parameters was reasonable.
Secondly, model parameters related to the transformation rules of cells must be set. The transformation rules of CA involve comparing the transformation probability of cells ( θ ) and the transformation threshold ( η ). Transformation was performed when θ η ; no transformation was performed when θ < η . The threshold of transformation ranges between 0 and 1. Therefore, the cell state (land use types of raster) is more rigid to transform when the threshold of transformation is set higher. The calculation formula for θ is
Θ = ƒ Γ β a n n ρ Φ
where ƒ Γ is the random disturbance function, where the diffusion coefficient ( γ ) is used as the independent variable and ranges between 1 and 10. β a n n is the transformation probability calculated by the artificial neural network. Ρ is the urban land use density in the cell neighbor window. Φ is the suitability of transformation.
Based on an analysis of the practical situation of land use transformation in Ya’an City, the setting of the suitability matrix for land use transformation in Ya’an City is shown in Table 4. The numerical values in the transformation suitability matrix are set to 0 or 1, where 0 shows that the land use type cannot be transformed into another land use type. In contrast, 1 shows that the given land use type can be transformed into another one.
The simulation of land use scenarios of 2018 showed that the values of η and γ in this model significantly influence the ultimate operation results. The ranges of η and γ with relatively high fitting accuracy were chosen through the research process. Four different parameter combinations were set (① η = 0.8, γ = 1; ② η = 0.8, γ = 2; ③ η = 0.9, γ = 1; ④ η = 0.9, γ = 1) to simulate land use scenarios in Ya’an City in 2018. The overall accuracy of the simulation results under four parameter combination values were 95.93%, 94.91%, 93.56%, and 92.90%, respectively. The simulation accuracy under the first parameter combination was the highest. Hence, the threshold of transformation was set to 0.8, and the diffusion coefficient was set to 1 for subsequent analysis.
To adequately understand the land use evolutionary trend of different land use types in Ya’an City and prevent abnormal offsets of the spatial centers of different land use types during simulation, this model was calibrated using the spatial center migration analytical method. The actual land use data in Ya’an City and spatial centers of different land use types (cultivated land, forest land, grassland, water surface, construction land, and other land) in 2018 were calculated using the average center tool in the spatial statistical toolkit. When a significant error occurred between the calculated and simulated results for the actual center of a land use type, the processes of ANN-CA simulation were repeated until the error was within a permissible offset range.

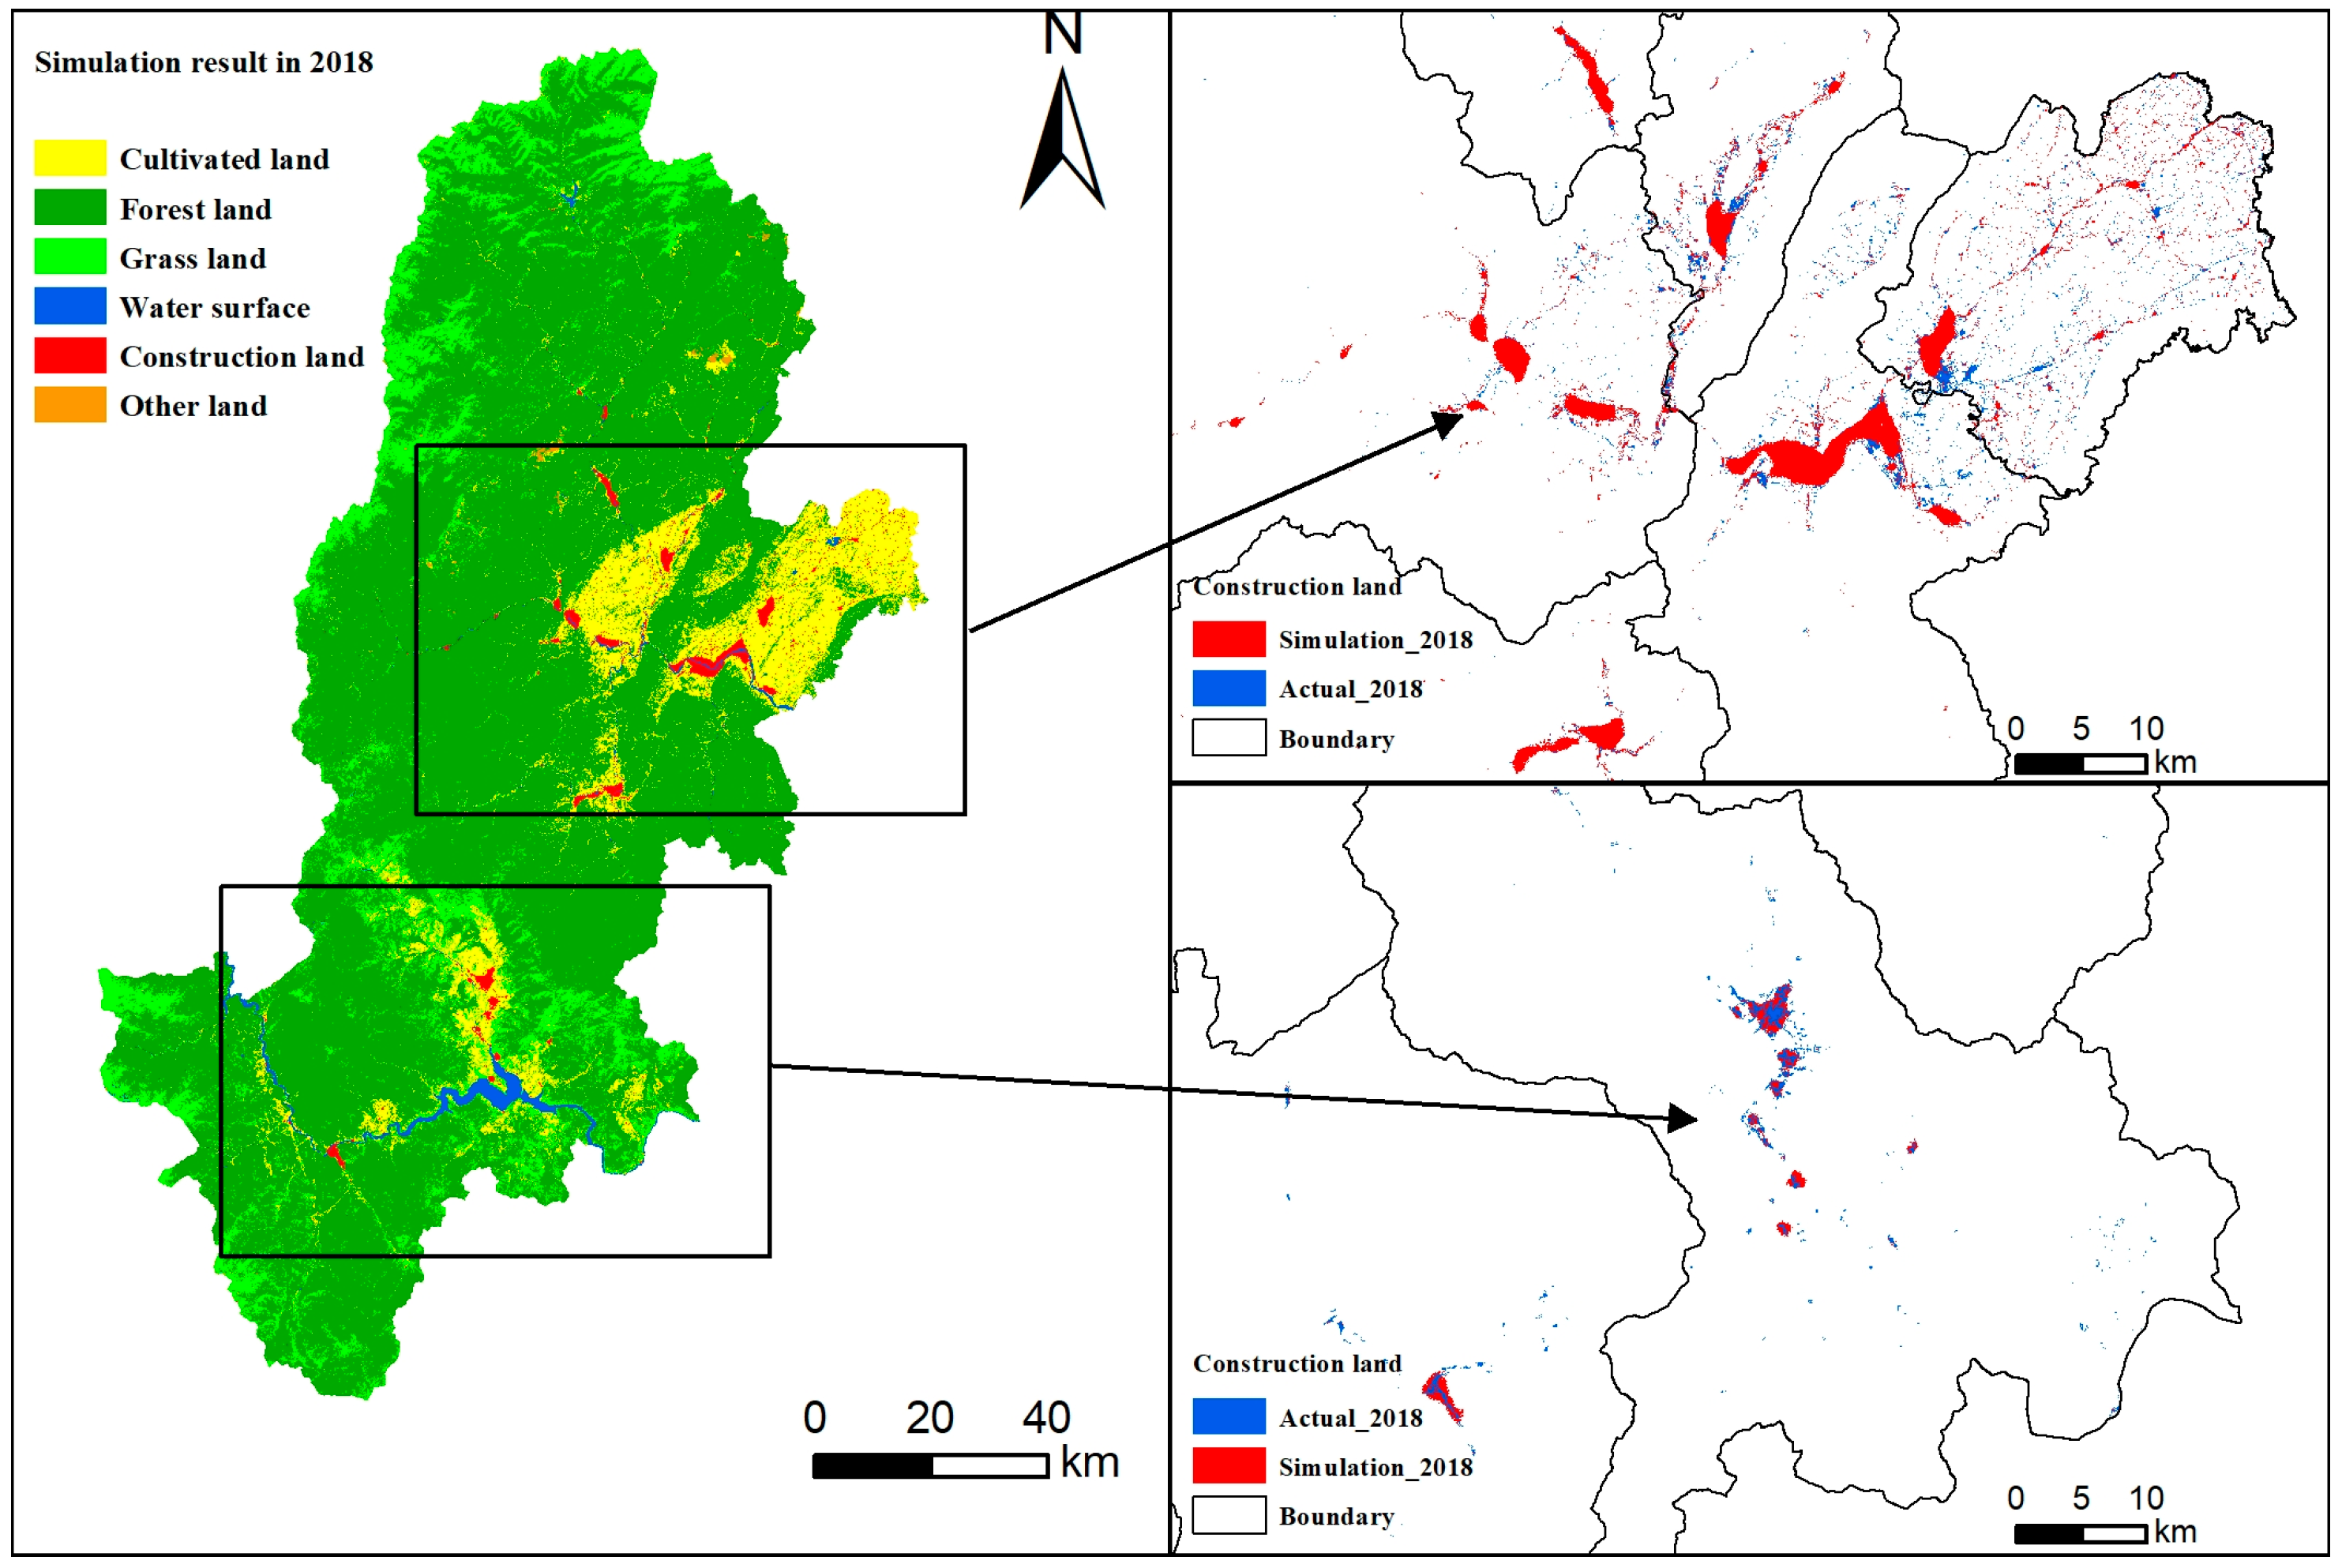
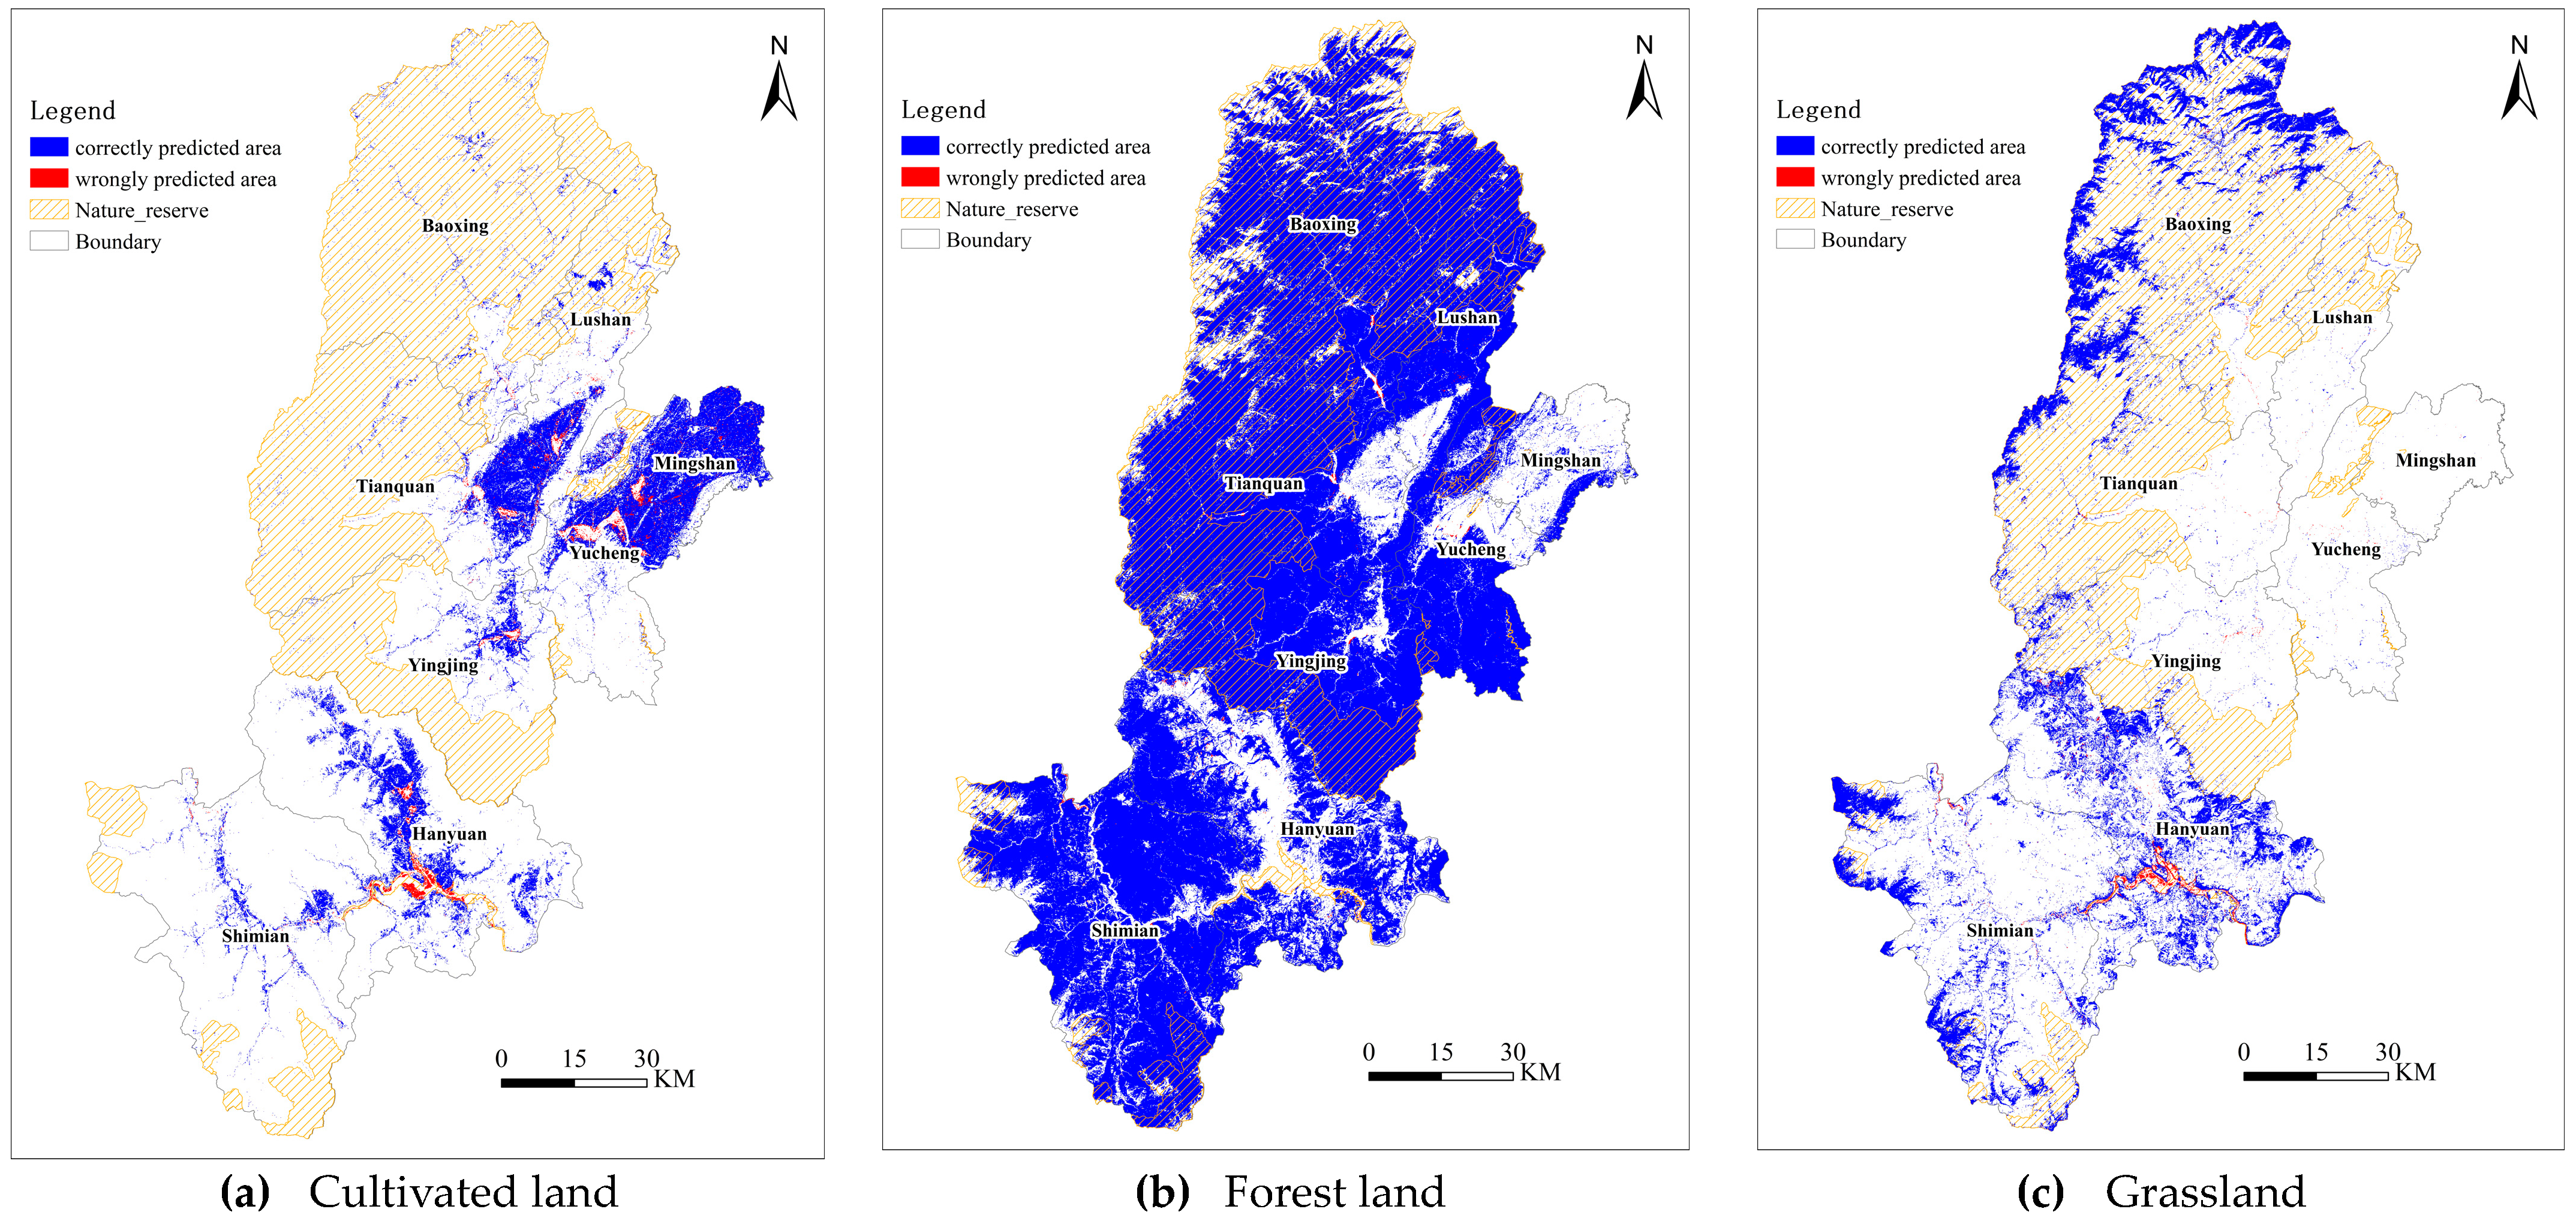
3.3. Output Simulation Results under Macro-Level Demand Constraints

The SD-ANN-CA model in this study requires the SD model estimation for constraints, the artificial neural network training for transformation rules, the optimization of CA parameters, and model calibration of spatial constraints. The simulation process ended for the year 2018 estimation when the results of forest land area, grassland area, cultivated land, and construction land between the SD model and ANN-CA model were similar, with errors lower than ±5%. The final simulation output of Ya’an City in 2018 is presented in Figure 7.
The calculation results of error accuracy and kappa coefficient for the land use simulation in 2018 are shown in Table 5. It can be said that the simulation errors of all land use types in Ya’an City in 2018 were lower than 5%, except for the water surface. The kappa coefficient of the simulation result of 2018 was 0.973, indicating that the model exhibited high predictive performance. We also tested the constructed ANN-CA model in our earlier work [49] for comparison, which is designed for four land-use types in the Yucheng district, Ya’an City. The results showed that when considering the whole city area and all six types of land use, there was an accuracy drop-down for the ANN-CA model and a remarkably higher accuracy for the SD-ANN-CA model, especially with forest land, grassland, and construction land. Hence, it can be preliminarily determined from the quantitative accuracy verification that the SD-ANN-CA model can predict land use better.
A layout comparison of six land types between simulation results and reality in 2018 is shown in Figure 8. With the best simulation accuracy among all six land types, there are no significant differences obtained for forest land between simulation layout and reality, except for some spots alongside the National Reserve area. Construction land also shows great accuracy, especially in continuous development areas. We have also illustrated specific urban construction land differences (Figure 7), according to which the prediction error of construction land is mainly located in small counties or villages northeast and southwest of Ya’an City. The prediction distribution of urban construction land in Hanyuan County is larger than the actual layout, indicating that cultivation land cells are wrongly transformed into urban construction land cells during the simulation process. The prediction error for grassland, cultivated land, and water surface is mainly located in areas alongside rivers in Southern Ya’an City, indicating that cells may be transformed among those three land types. With a total amount of 11,520 (ha), such mistakes cause much lower overall accuracy of water surface (error-accuracy: 5.08%; kappa coefficient: 0.873) compared to cultivated land and grassland.

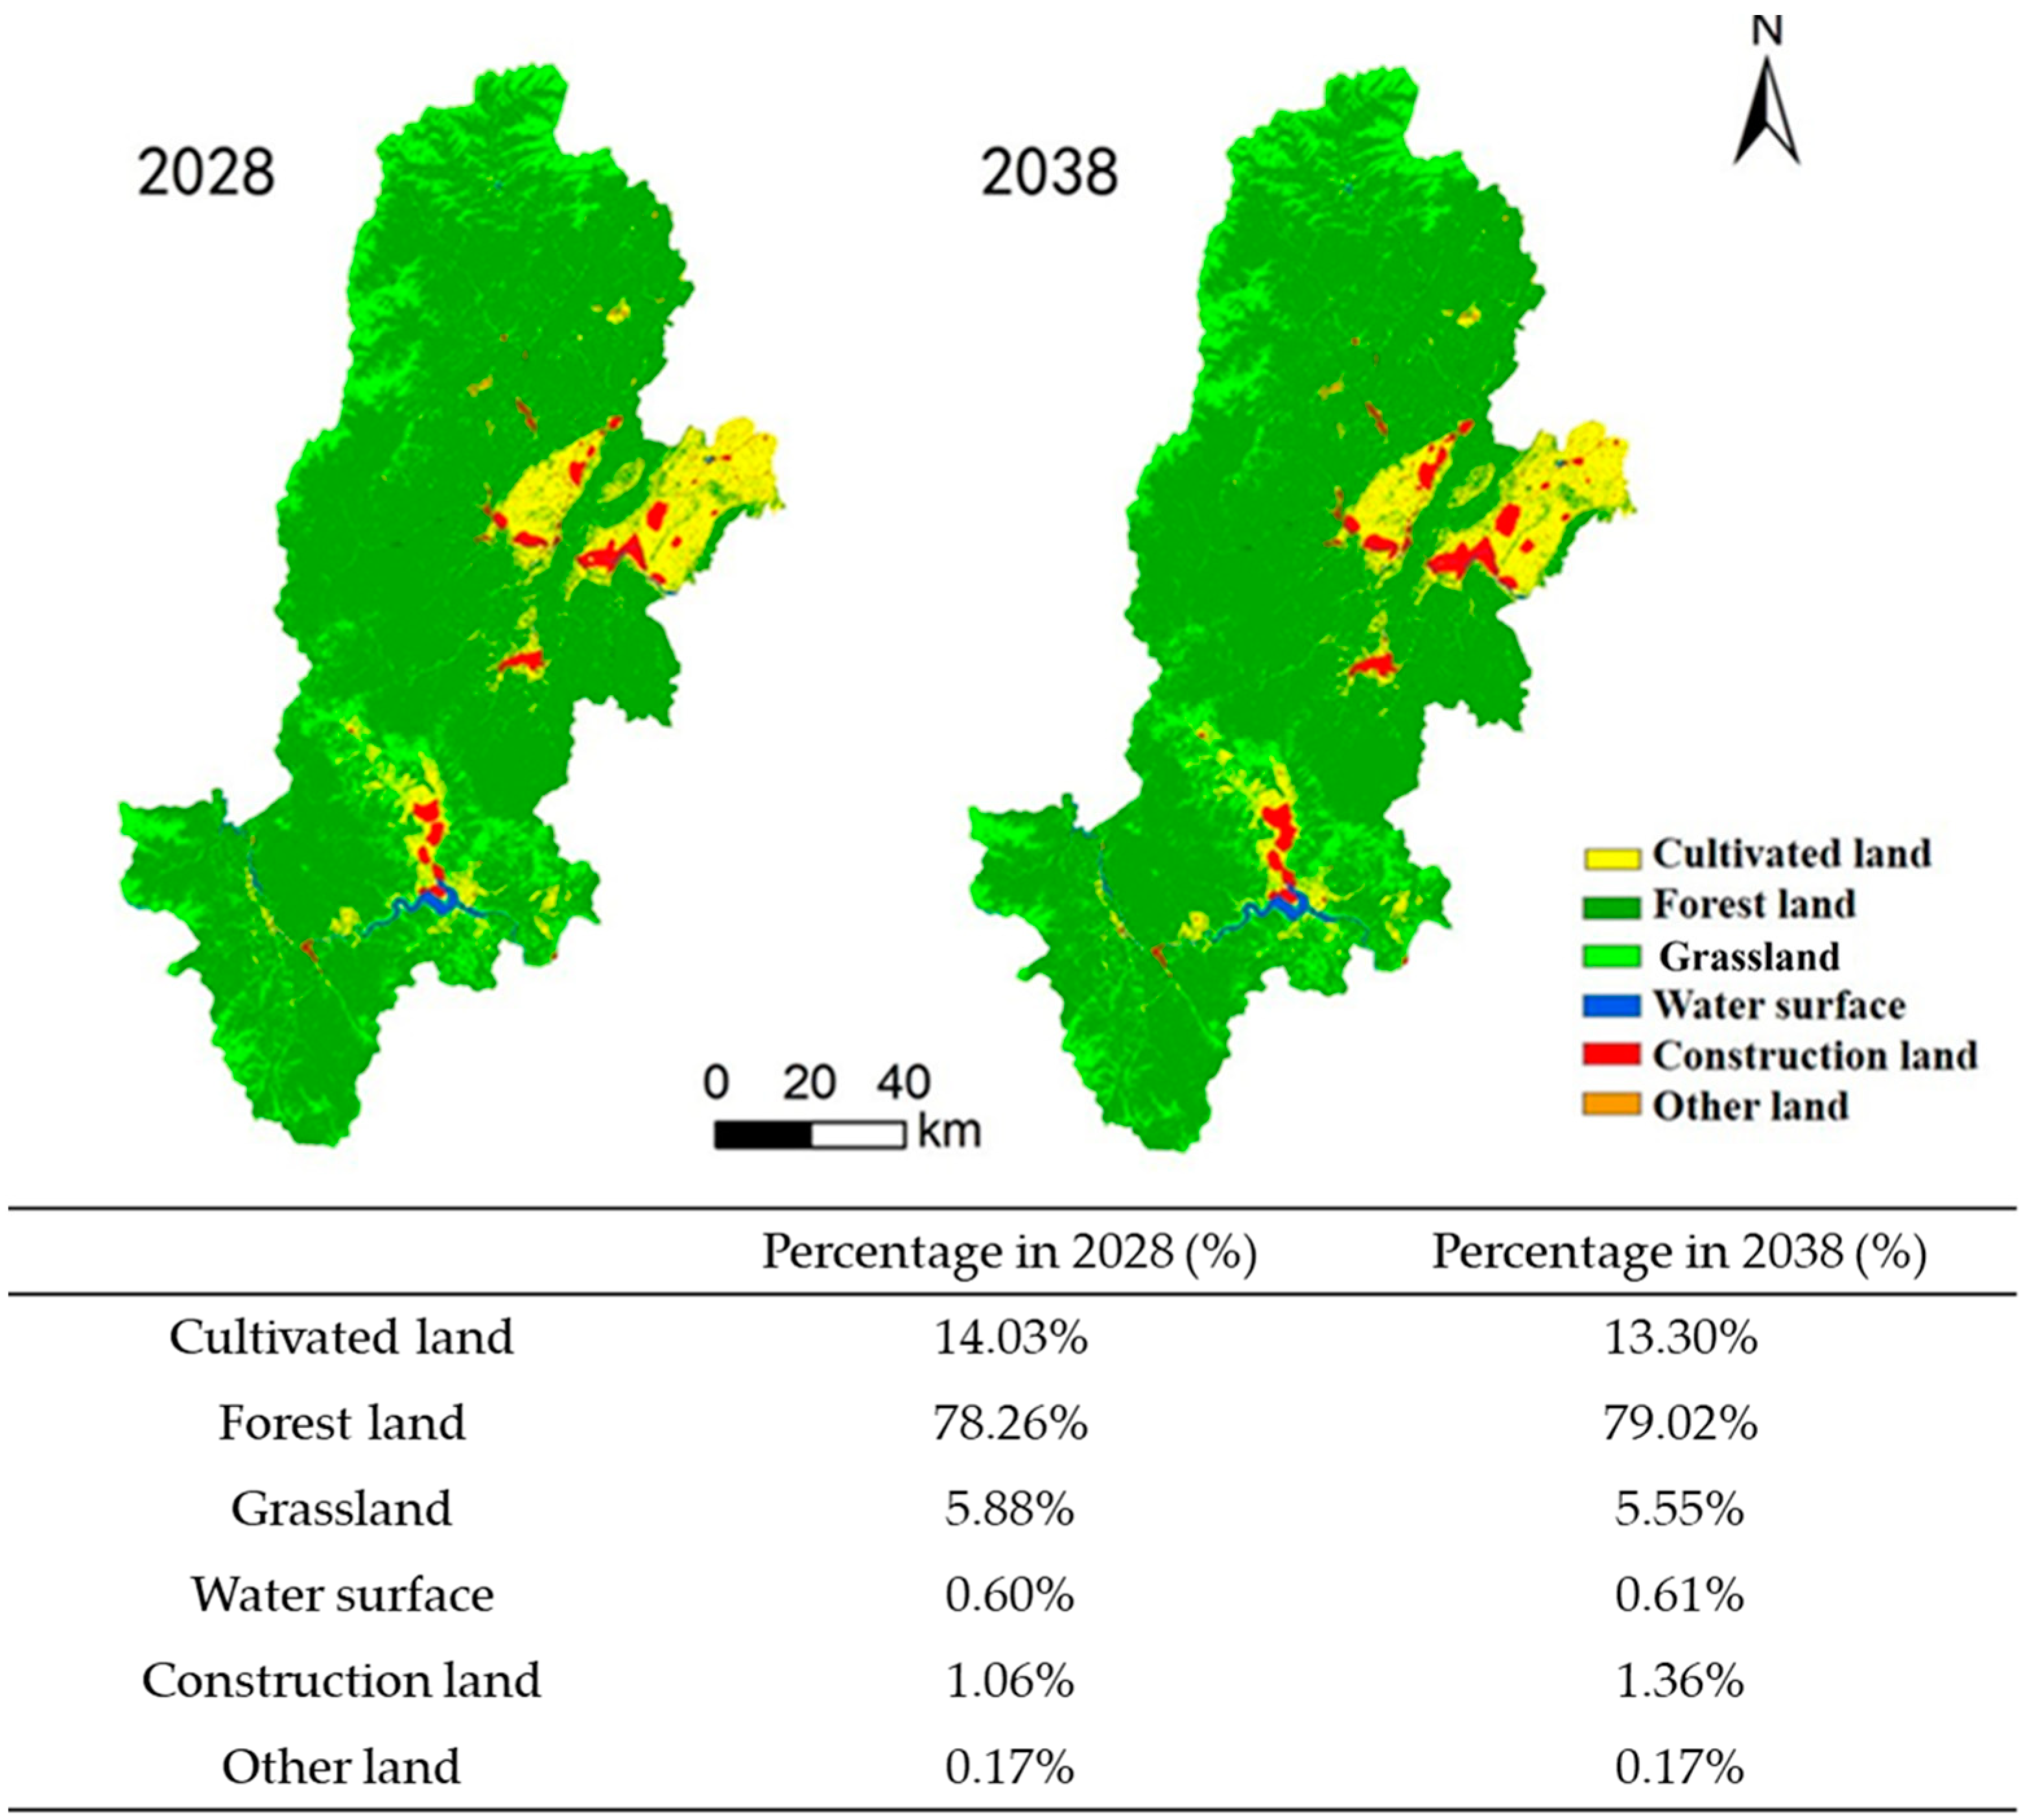
3.4. Land Use Prediction for the Years 2028 and 2038 in the Study Area

In this section, the SD-ANN-CA model that passed the accuracy verification was used to simulate and predict the land use scenario in Ya’an City in 2028 and 2038, facilitating the analysis of the future land use of evolutionary trends in the study area. Following the model framework, the land use prediction results in 2028 and 2038 are shown in Figure 9. A decreasing trend of cultivated land is obtained in both time periods of 2018–2028 and 2028–2038, indicating that cultivated land is still the main body of LUCC in Ya’an City. The proportion of grassland reaches the top in 2028 and then decreases during 2028–2038, while the proportion of forest land remains increases. Construction land embraces the most significant increase. For better observation of the construction land expansion trend in Ya’an City, the construction land was extracted from the land use simulation results in 2028 and 2038 based on the chart of the land use status in 2018. The construction lands in 2018, 2028, and 2038 were stacked from top to bottom; the results are shown in Figure 10.
In Figure 10, the yellow region represents the construction land area in Ya’an City in 2018, the blue region represents the construction land expansion area from 2018 to 2028, and the red region represents the construction land expansion area from 2028 to 2038. The construction land in the central and eastern regions (Tianquan County, Lushan County, Yucheng County, and Mingshan District) and southern regions (Hanyuan County) expanded noticeably. Those regions with markedly construction land expansion are mainly distributed along rivers and roads, fully reflecting the driving and radiation effect of roads and rivers on urban construction in Ya’an City. Generally, the construction land in Ya’an City presented a law of expansion from the center to surrounding areas, consistent with the open development pattern of “Four-way expansion” proposed by Ya’an City during the 13th Five-Year Plan. This confirms that the simulated evolutionary results of the SD-ANN-CA model under constraints are relatively accurate and reasonable for providing planning departments with reliable references to formulate related policies.

4. Discussion

With limited land resources, higher pressure of rapid urbanization, and ecological environment conservation, cities in Western China are struggling to balance relationships among multiple types of land use. Simulation tools with better accuracy and more visual prediction results of land-use change are urgently needed for more sustainable land-use development objectives. In this study, we proposed a two-layer SD-ANN-CA model combining the advantages of all three commonly used methods: the quantitative prediction accuracy and interaction feedback analysis capability of the SD method; the recognition logic of the ANN method; the dynamic and high-resolution microscale analysis capability of the CA method. In the model framework, the two layers of the SD model and the ANN-CA model were connected through the macro-level of demand constraints, as well as the meso-level of driving factors and feedbacks, which were output in the upper layer of the SD model and then used in the lower layer of ANN-CA model for training and output processes. The model framework also considered the micro-level spatial constraints for different types of land-use space centers to provide more precise output layouts of land-use predictions.
With a kappa coefficient of 0.973, our model framework with multiple levels of constraints had shown excellent simulation accuracy for future LUCC predictions in the case of Ya’an City. Compared to other multilayer LUCC models with only macro-level demand constraint applied in Western China areas, such as the WLC-CA-Markov model applied in three gorges reservoir area of Chongqing (kappa coefficient: 0.929, study area: 2182.911 km2) [60], our model has exceeded the other models largely in overall accuracy in larger study areas. It indicates that macro-level, meso-level, and micro-level constraints play essential roles during the simulation process. Particularly considering all six types of land use/land cover, our model presented more balanced accuracy than related works in mountainous cities [17], with our kappa coefficient of individual type exceeding 0.9 except for water surface. Due to the lack of continuous historical data in 1998–2018, the macro-level demand and meso-level feedback for water surface land were much less constrained compared to cultivated land, forest land, grassland, and urban construction land; the largest error accuracy was obtained for water surface. However, the simulation accuracy of the water surface can still be considered significantly improved compared to the traditional ANN-CA model conducted in our earlier work. The much higher accuracy of forest land and construction land has confirmed that those two types of land benefit most from introducing socioeconomic driving factors into simulation model frameworks than simply considering spatial factors like DEM in mountainous areas.
More detailed policy implications can also be discussed according to the results. Even though the cultivated land proportion decreases at the city level, it increases in some county-level areas, such as Minshan district and Hanyuan County, where agriculture is considered a pillar of industry. It indicates that the industrial value factors driven from the SD model layer have played well as meso-constraints in the ANN-CA simulation process. Even though the area of construction land is increasing significantly, the Yucheng district, where the main city center is located, is seeing a slight drop in construction land proportion in both periods of 2028–2018 and 2038–2028.
At the stage of incremental development, Yucheng district will first step into the stage of stock development; policies concerning supply-side reform, such as land use mix, may be needed for the government to promote high-quality development in Yucheng district. With the highest grassland and forest land proportion and the lowest proportion of construction land, Baoxin County may benefit the most from the national and provincial policy of “Turning ecological advantages into economic growth”, in which new energy, new materials, and big data industry are largely promoted.

5. Conclusions

The main contributions and conclusions are summarized as follows.
Firstly, considering all six types of forest land, grassland, cultivated land, construction land, water surface, and other land in whole city-level areas of Ya’an, the two-layer SD-ANN-CA model we proposed has shown great accuracy in predicting the land-use evolutionary trend of both quantitative demand and spatial layout. An error-accuracy results comparison between the SD-ANN-CA model in this study and the ANN-CA model constructed in our earlier work has confirmed that with larger prediction areas and more various types of land use, the demand constraints and driver factor constraints from SD model layer estimation results would benefit the training process of ANN-CA layer with a significant improvement in simulation accuracy, especially in types of forest land, grassland, and construction land area predictions. The results have provided insights into possible ways to combine quantitative methods into spatial methods in constructing city-level or even regional-level land-use change models with high resolution.
Secondly, under the SD-ANN-CA model framework, the land-use layout of 2028 and 2038 and the evolutionary trend in the study area were predicted. The results indicate an expansion tendency from the center to surrounding areas of construction lands, which is consistent with the development agenda proposed by the local government of “Four-way expansion” in Ya’an City. Therefore, the visual results of the prediction layout for six types of land use in any prediction year between 2019 and 2038 may also provide reliable information for supporting related land-use planning or policy-making decisions.
Limitations are also found in this study. We excluded some variables related to climate change, policy making, and political regulations, which may also influence land-use change because of data collection barriers. Those variables may be considered in the model framework in our future work. Even though the two-layer SD-ANN-CA model has shown significant accuracy in Ya’an City, the model validity still has to be tested in more cities with different land-use patterns or in larger areas at the metropolitan and regional levels. Considering the fierce land competition in the research area, especially in the city center areas where urban construction land proportion will decrease, sub-cytoplasmic cells instead of the pure cytoplasmic cells may need to be introduced in our future model framework for generating detailed land use mix patterns. Also, the demand and driving factors constraints set in the SD model layer were fixed in this study for ANN-CA training, which can be explored under different constraints scenarios for more information in future works.

Author Contributions

All authors listed contributed significantly to this research with the following work. Conceptualization, J.Z. and L.G.; data preparation, X.Z. and F.Z; model framework and simulation, J.Z. and X.Z.; result analysis, J.Z., X.Z. and F.Z.; paper writing, J.Z.; funding Acquisition, L.G. All authors have read and agreed to the published version of this manuscript.

Funding

This research was supported by the National Natural Science Foundation of China (52072066) and Jiangsu Province Science Fund for Distinguished Young Scholars (BK20200014).

Data Availability Statement

The data presented in this study are available upon request from the corresponding author. The data are not publicly available due to confidentiality reasons.

Acknowledgments

We sincerely appreciate the constructive effort and advice of the Academic Editors and reviewers, who significantly polished the quality of our manuscript.

Conflicts of Interest

The authors declare no conflict of interest.

References

  1. Olofsson, P.; Foody, G.M.; Stehman, S.V.; Woodcock, C.E. Making Better Use of Accuracy Data in Land Change Studies: Estimating Accuracy and Area and Quantifying Uncertainty Using Stratified Estimation. Remote Sens. Environ. 2013, 129, 122–131. [Google Scholar] [CrossRef]
  2. Meyfroidt, P.; Roy Chowdhury, R.; de Bremond, A.; Ellis, E.C.; Erb, K.-H.; Filatova, T.; Garrett, R.D.; Grove, J.M.; Heinimann, A.; Kuemmerle, T.; et al. Middle-Range Theories of Land System Change. Glob. Environ. Chang. 2018, 53, 52–67. [Google Scholar] [CrossRef]
  3. Liu, X.; Liang, X.; Li, X.; Xu, X.; Ou, J.; Chen, Y.; Li, S.; Wang, S.; Pei, F. A Future Land Use Simulation Model (FLUS) for Simulating Multiple Land Use Scenarios by Coupling Human and Natural Effects. Landsc. Urban Plan. 2017, 168, 94–116. [Google Scholar] [CrossRef]
  4. Wang, J.; Bretz, M.; Dewan, M.A.A.; Delavar, M.A. Machine Learning in Modelling Land-Use and Land Cover-Change (LULCC): Current Status, Challenges and Prospects. Sci. Total Environ. 2022, 822, 153559. [Google Scholar] [CrossRef]
  5. Verburg, P.H.; van de Steeg, J.; Veldkamp, A.; Willemen, L. From Land Cover Change to Land Function Dynamics: A Major Challenge to Improve Land Characterization. J. Environ. Manag. 2009, 90, 1327–1335. [Google Scholar] [CrossRef] [PubMed]
  6. Park, J.-Y.; Park, M.-J.; Joh, H.-K.; Shin, H.-J.; Kwon, H.-J.; Srinivasan, R.; Kim, S.-J. Assessment of MIROC3.2 hires Climate and CLUE-s Land Use Change Impacts on Watershed Hydrology Using SWAT. Trans. ASABE 2011, 54, 1713–1724. [Google Scholar] [CrossRef]
  7. Letourneau, A.; Verburg, P.H.; Stehfest, E. A Land-Use Systems Approach to Represent Land-Use Dynamics at Continental and Global Scales. Environ. Model. Softw. 2012, 33, 61–79. [Google Scholar] [CrossRef]
  8. Deng, X. Modeling the Dynamics and Consequences of Land System Change; Springer: Berlin/Heidelberg, Germany, 2011. [Google Scholar]
  9. Zhao, J.S.; Yuan, L.; Zhang, M. A Study of the System Dynamics Coupling Model of the Driving Factors for Multi-Scale Land Use Change. Environ. Earth Sci. 2016, 75, 529. [Google Scholar] [CrossRef]
  10. Qian, Y.; Xing, W.; Guan, X.; Yang, T.; Wu, H. Coupling Cellular Automata with Area Partitioning and Spatiotemporal Convolution for Dynamic Land Use Change Simulation. Sci. Total Environ. 2020, 722, 137738. [Google Scholar] [CrossRef]
  11. White, R.; Engelen, G. Urban Systems Dynamics and Cellular Automata: Fractal Structures between Order and Chaos. Chaos Solitons Fractals 1994, 4, 563–583. [Google Scholar] [CrossRef]
  12. Lee, S.-T.; Wu, C.-W.; Lei, T.-C. CA-GIS Model for Dynamic Simulation of Commercial Activity Development by the Combination of ANN and Bayesian Probability. Procedia Comput. Sci. 2013, 18, 651–660. [Google Scholar] [CrossRef]
  13. Liu, X.; Hu, G.; Ai, B.; Li, X.; Tian, G.; Chen, Y.; Li, S. Simulating Urban Dynamics in China Using a Gradient Cellular Automata Model Based on S-Shaped Curve Evolution Characteristics. Int. J. Geogr. Inf. Sci. 2017, 32, 73–101. [Google Scholar] [CrossRef]
  14. Kim, Y.; Newman, G.; Güneralp, B. A Review of Driving Factors, Scenarios, and Topics in Urban Land Change Models. Land 2020, 9, 246. [Google Scholar] [CrossRef] [PubMed]
  15. Li, K.; Feng, M.; Biswas, A.; Su, H.; Niu, Y.; Cao, J. Driving Factors and Future Prediction of Land Use and Cover Change Based on Satellite Remote Sensing Data by the LCM Model: A Case Study from Gansu Province, China. Sensors 2020, 20, 2757. [Google Scholar] [CrossRef] [PubMed]
  16. Dewan, A.M.; Yamaguchi, Y. Land Use and Land Cover Change in Greater Dhaka, Bangladesh: Using Remote Sensing to Promote Sustainable Urbanization. Appl. Geogr. 2009, 29, 390–401. [Google Scholar] [CrossRef]
  17. Mansour, S.; Al-Belushi, M.; Al-Awadhi, T. Monitoring Land Use and Land Cover Changes in the Mountainous Cities of Oman Using GIS and CA-Markov Modelling Techniques. Land Use Policy 2020, 91, 104414. [Google Scholar] [CrossRef]
  18. Fang, Z.; Ding, T.; Chen, J.; Xue, S.; Zhou, Q.; Wang, Y.; Wang, Y.; Huang, Z.; Yang, S. Impacts of Land Use/Land Cover Changes on Ecosystem Services in Ecologically Fragile Regions. Sci. Total Environ. 2022, 831, 154967. [Google Scholar] [CrossRef] [PubMed]
  19. Ning, C.; Subedi, R.; Hao, L. Land Use/Cover Change, Fragmentation, and Driving Factors in Nepal in the Last 25 Years. Sustainability 2023, 15, 6957. [Google Scholar] [CrossRef]
  20. Munteanu, C.; Kuemmerle, T.; Boltiziar, M.; Butsic, V.; Gimmi, U.; Halada, L.; Kaim, D.; Király, G.; Konkoly-Gyuró, É.; Kozak, J.; et al. Forest and Agricultural Land Change in the Carpathian Region—A Meta-Analysis of Long-Term Patterns and Drivers of Change. Land Use Policy 2014, 38, 685–697. [Google Scholar] [CrossRef]
  21. Wang, R.; Derdouri, A.; Murayama, Y. Spatiotemporal Simulation of Future Land Use/Cover Change Scenarios in the Tokyo Metropolitan Area. Sustainability 2018, 10, 2056. [Google Scholar] [CrossRef]
  22. Plieninger, T.; Draux, H.; Fagerholm, N.; Bieling, C.; Bürgi, M.; Kizos, T.; Kuemmerle, T.; Primdahl, J.; Verburg, P.H. The Driving Forces of Landscape Change in Europe: A Systematic Review of the Evidence. Land Use Policy 2016, 57, 204–214. [Google Scholar] [CrossRef]
  23. Güneralp, B.; Reilly, M.K.; Seto, K.C. Capturing Multiscalar Feedbacks in Urban Land Change: A Coupled System Dynamics Spatial Logistic Approach. Environ. Plan. B Plan. Des. 2012, 39, 858–879. [Google Scholar] [CrossRef]
  24. Yi, W.; Gao, Z.; Chen, M. Dynamic Modelling of Future Land-Use Change: A Comparison between CLUE-S and Dinamica EGO Models. In Proceedings of the SPIE Proceedings, San Diego, CA, USA, 24 October 2012. [Google Scholar]
  25. Ulloa-Espíndola, R.; Martín-Fernández, S. Simulation and Analysis of Land Use Changes Applying Cellular Automata in the South of Quito and the Machachi Valley, Province of Pichincha, Ecuador. Sustainability 2021, 13, 9525. [Google Scholar] [CrossRef]
  26. Li, X.; Yeh, A.G.-O. Neural-Network-Based Cellular Automata for Simulating Multiple Land Use Changes Using GIS. Int. J. Geogr. Inf. Sci. 2002, 16, 323–343. [Google Scholar] [CrossRef]
  27. Liu, X.; Li, X.; Liu, L.; He, J.; Ai, B. A Bottom-up Approach to Discover Transition Rules of Cellular Automata Using Ant Intelligence. Int. J. Geogr. Inf. Sci. 2008, 22, 1247–1269. [Google Scholar] [CrossRef]
  28. Liu, X.; Ou, J.; Li, X.; Ai, B. Combining System Dynamics and Hybrid Particle Swarm Optimization for Land Use Allocation. Ecol. Model. 2013, 257, 11–24. [Google Scholar] [CrossRef]
  29. Zhang, Y.; Li, X.; Liu, X.; Qiao, J. Self-Modifying CA Model Using Dual Ensemble Kalman Filter for Simulating Urban Land-Use Changes. Int. J. Geogr. Inf. Sci. 2015, 29, 1612–1631. [Google Scholar] [CrossRef]
  30. Alqurashi, A.; Kumar, L.; Sinha, P. Urban Land Cover Change Modelling Using Time-Series Satellite Images: A Case Study of Urban Growth in Five Cities of Saudi Arabia. Remote Sens. 2016, 8, 838. [Google Scholar] [CrossRef]
  31. Varga, O.G.; Pontius Jr, R.G.; Szabó, Z.; Szabó, S. Effects of Category Aggregation on Land Change Simulation Based on Corine Land Cover Data. Remote Sens. 2020, 12, 1314. [Google Scholar] [CrossRef]
  32. da Cunha, E.R.; Santos, C.A.G.; da Silva, R.M.; Bacani, V.M.; Pott, A. Future Scenarios Based on a CA-Markov Land Use and Land Cover Simulation Model for a Tropical Humid Basin in the Cerrado/Atlantic Forest Ecotone of Brazil. Land Use Policy 2021, 101, 105141. [Google Scholar] [CrossRef]
  33. Nath, N.; Sahariah, D.; Meraj, G.; Debnath, J.; Kumar, P.; Lahon, D.; Chand, K.; Farooq, M.; Chandan, P.; Singh, S.K.; et al. Land Use and Land Cover Change Monitoring and Prediction of a UNESCO World Heritage Site: Kaziranga Eco-Sensitive Zone Using Cellular Automata-Markov Model. Land 2023, 12, 151. [Google Scholar] [CrossRef]
  34. Beroho, M.; Briak, H.; Cherif, E.K.; Boulahfa, I.; Ouallali, A.; Mrabet, R.; Kebede, F.; Bernardino, A.; Aboumaria, K. Future Scenarios of Land Use/Land Cover (LULC) Based on a CA-Markov Simulation Model: Case of a Mediterranean Watershed in Morocco. Remote Sens. 2023, 15, 1162. [Google Scholar] [CrossRef]
  35. Zhu, X.X.; Tuia, D.; Mou, L.; Xia, G.-S.; Zhang, L.; Xu, F.; Fraundorfer, F. Deep Learning in Remote Sensing: A Comprehensive Review and List of Resources. IEEE Geosci. Remote Sens. Mag. 2017, 5, 8–36. [Google Scholar] [CrossRef]
  36. Talukdar, S.; Singha, P.; Mahato, S.; Shahfahad; Pal, S.; Liou, Y.-A.; Rahman, A. Land-Use Land-Cover Classification by Machine Learning Classifiers for Satellite Observations—A Review. Remote Sens. 2020, 12, 1135. [Google Scholar] [CrossRef]
  37. Zhan, X.; Yu, S. Reconstructing the Historical Patterns of Forest Stand Based on CA-adaboost-ANN Model. For. Ecol. Manag. 2020, 478, 118518. [Google Scholar] [CrossRef]
  38. Šetka, J.; Radeljak Kaufmann, P.; Valožić, L. Modelling Land Use and Land Cover Changes in the Lower Neretva Region. Hrvat. Geogr. Glas. /Croat. Geogr. Bull. 2023, 85, 41–63. [Google Scholar] [CrossRef]
  39. Gharaibeh, A.; Shaamala, A.; Obeidat, R.; Al-Kofahi, S. Improving Land-Use Change Modeling by Integrating ANN with Cellular Automata-Markov Chain Model. Heliyon 2020, 6, e05092. [Google Scholar] [CrossRef] [PubMed]
  40. Lukas, P.; Melesse, A.M.; Kenea, T.T. Prediction of Future Land Use/Land Cover Changes Using a Coupled CA-ANN Model in the Upper Omo–Gibe River Basin, Ethiopia. Remote Sens. 2023, 15, 1148. [Google Scholar] [CrossRef]
  41. Available online: https://dl.acm.org/doi/abs/10.5555/2331751.2331752 (accessed on 23 September 2023).
  42. Liu, J.; Hu, C.; Kang, X.; Chen, F. A Loosely Coupled Model for Simulating and Predicting Land Use Changes. Land 2023, 12, 189. [Google Scholar] [CrossRef]
  43. Verburg, P.H.; Soepboer, W.; Veldkamp, A.; Limpiada, R.; Espaldon, V.; Mastura, S.S.A. Modeling the Spatial Dynamics of Regional Land Use: The CLUE-S Model. Environ. Manag. 2002, 30, 391–405. [Google Scholar] [CrossRef]
  44. Kucsicsa, G.; Popovici, E.-A.; Bălteanu, D.; Grigorescu, I.; Dumitraşcu, M.; Mitrică, B. Future Land Use/Cover Changes in Romania: Regional Simulations Based on CLUE-S Model and CORINE Land Cover Database. Landsc. Ecol. Eng. 2018, 15, 75–90. [Google Scholar] [CrossRef]
  45. Li, Y.; Liu, X.; Wang, Y.; He, Z. Simulating Multiple Scenarios of Land Use/Cover Change Using a Coupled Model to Capture Ecological and Economic Effects. Land Degrad. Dev. 2023, 34, 2862–2879. [Google Scholar] [CrossRef]
  46. Çağlıyan, A.; Dağlı, D. Monitoring Land Use Land Cover Changes and Modelling of Urban Growth Using a Future Land Use Simulation Model (FLUS) in Diyarbakır, Turkey. Sustainability 2022, 14, 9180. [Google Scholar] [CrossRef]
  47. Huang, K.; Liu, X.; Li, X.; Liang, J.; He, S. An Improved Artificial Immune System for Seeking the Pareto Front of Land-Use Allocation Problem in Large Areas. Int. J. Geogr. Inf. Sci. 2013, 27, 922–946. [Google Scholar] [CrossRef]
  48. Xu, Q.; Wang, Q.; Liu, J.; Liang, H. Simulation of Land-Use Changes Using the Partitioned ANN-CA Model and Considering the Influence of Land-Use Change Frequency. ISPRS Int. J. Geo-Inf. 2021, 10, 346. [Google Scholar] [CrossRef]
  49. Zhao, J.; Zhu, X.; Zhou, Y.; Guo, K.; Huang, Y. Examining Land-Use Change Trends in Yucheng District, Ya’an City, China, Using ANN-CA Modeling. J. Urban Plan. Dev. 2023, 149, 1–9. [Google Scholar] [CrossRef]
  50. Zhao, J.; Zhou, Y.; Zhu, X.; Zhang, F.; Gao, L. ANN-CA Model Construction under SD Constraint: A Case Study on the Land-Use Change Trend in Ya’an City. Available online: https://www.researchsquare.com/article/rs-3634077/v1 (accessed on 23 September 2023).
  51. Geospatial Data Cloud. Available online: http://www.gscloud.cn/search (accessed on 23 September 2023).
  52. OpenStreetMap. Available online: https://www.openstreetmap.org/ (accessed on 23 September 2023).
  53. The World Database on Protected Areas. Available online: https://www.protectedplanet.net/en (accessed on 23 September 2023).
  54. Bigemap. Available online: http://www.bigemap.com/ (accessed on 23 September 2023).
  55. Ya’an Municipal People’s Government. (2008–2018). Statistical Yearbook of Ya’an City. Available online: https://www.yaan.gov.cn/gongkai/kuozhan/10393.html (accessed on 23 September 2023). (In Chinese)
  56. The People’s Government of Sichuan Province. (2000–2018). Statistical Yearbook of Sichuan Province. Available online: https://tjj.sc.gov.cn/scstjj/c105855/nj.shtml (accessed on 23 September 2023). (In Chinese)
  57. Ministry of Natural Resources of the People ‘s Republic of China. (2001–2016). China National Land and Resources Statistical Yearbook. Available online: https://www.mnr.gov.cn/sj/tjgb/ (accessed on 23 September 2023). (In Chinese)
  58. Ministry of Housing and Urban-Rural Development of the People’s Republic of China. (2000–2016). China Urban Construction Statistical Yearbook. Available online: https://www.mohurd.gov.cn/gongkai/fdzdgknr/sjfb/tjxx/tjgb/index.html (accessed on 23 September 2023). (In Chinese)
  59. Li, X.; Wang, Y.; Li, J.; Lei, B. Physical and Socioeconomic Driving Forces of Land-Use and Land-Cover Changes: A Case Study of Wuhan City, China. Discret. Dyn. Nat. Soc. 2016, 2016, 8061069. [Google Scholar] [CrossRef]
  60. Guan, D.; Zhao, Z.; Tan, J. Dynamic Simulation of Land Use Change Based on Logistic-CA-Markov and WLC-CA-Markov Models: A Case Study in Three Gorges Reservoir Area of Chongqing, China. Environ. Sci. Pollut. Res. 2019, 26, 20669–20688. [Google Scholar] [CrossRef]
Figure 1. Location and DEM image of Ya’an City.
Land 13 00714 g001
Figure 2. Chart of land use status in Ya’an City in three phases.
Land 13 00714 g002
Figure 3. The model framework of the two-layer SD-ANN-CA model.
Land 13 00714 g003
Figure 4. Spatial driving factors for model simulation.
Land 13 00714 g004
Figure 5. Feedback loops and driving factors of land use systems.
Land 13 00714 g005
Figure 6. Accuracy of neural network training.
Land 13 00714 g006
Figure 7. Land use simulation result in 2018.
Land 13 00714 g007
Figure 8. Layout discrepancies between simulation result and actual situation for 2018.
Land 13 00714 g008aLand 13 00714 g008b
Figure 9. Land use simulation results in Ya’an City in 2028 and 2038.
Land 13 00714 g009
Figure 10. Construction land expansion trend in Ya’an City.
Land 13 00714 g010
Table 1. Abstraction of the dataset.
TypeDataTimeDescriptionSourceFormat/Resolution
Geospatial information dataRemote sensing images1998
2008
2018
Three phases of graphic data regarding land use status through interpretation of remote sensing images.Geospatial data cloud (http://www.gscloud.cn/search) [51]Raster, 30 m
DEM2018Slope and aspect were acquired through the 3D analysis of DEM, which are used as the model’s constraints.Geospatial data cloud
(http://www.gscloud.cn/search) [51]
Raster, 30 m
Road map2020The arterial road map was acquired as a constraint of the model.Open Street Map
(https://www.openstreetmap.org/) [52]
Shapefile (line)
River chart2020The major river chart was acquired as a constraint of the model.Open Street Map
(https://www.openstreetmap.org/) [52]
Shapefile (line)
Residential areas2020Major cities and towns were acquired as rated constraints of the model.Open Street Map
(https://www.openstreetmap.org/) [52]
Shapefile (point)
Natural reserve2020Used as the constraint of the model.The World Database on Protected Areas (WDPA) [53]Shapefile (polygon)
Administrative map2020Running boundary of the model.BIGEMAP software ver. 30.0.9.14 [54]Shapefile (polygon)
Numerical dataPopulation data1998–2018Input data of the SD model. Include information on urban and rural population numbers, change rates, and carrying capacities.Statistical Yearbook of Ya’an City [55]
Statistical Yearbook of Sichuan Province [56]
PDF
Industrial output value1998–2018Input data of the SD model. Encompass the value-added of primary, secondary, and tertiary industries along with their growth rates, as well as land value-added informationStatistical Yearbook of Ya’an City [55]
Statistical Yearbook of Sichuan Province [56]
PDF
Agricultural and grain data1998–2018Input data of the SD model. Comprise production quantities, per capita consumption levels, and demand figures for grains and livestock meat products.Statistical Yearbook of Ya’an City [55]
Statistical Yearbook of Sichuan Province [56]
PDF
Housing and construction information1998–2018Input data of the SD model. Contain urbanization rates, housing areas, housing demands, land usage areas, etc.China National Land and Resources Statistical Yearbook [57]
China Urban Construction Statistical Yearbook [58]
PDF
Table 2. Key driving factors included in the model framework.
Classification of Driving FactorsNumber of Variables ConsideredVariable Names
Socioeconomic factors69
  • Population system factors: total population, annual total population growth, annual total population reduction, birth rate, death rate, rural population, urban population, annual urban population change, urban population change rate, urbanization rate, and maximum population carrying capacity;
  • Land resources system factors: per capita share of grain, food demand, multiple crop index, grain yield per hectare, proportion of grain in crop planting, cultivated land, per capita demand for meat storage, meat storage demand, meat storage yield per unit area of grassland, grassland, forest land change rate, forest land change, forest land, forest coverage rate, facility agricultural land, agricultural land, reserve construction land area, development rate of reserve construction land area, development area of reserve construction land, increase in construction land, construction land, per capita construction land, total land area, land development intensity, unused land, rural per capita construction land, rural construction land, urban industrial land, urban tertiary industry land, urban per capita housing area, urban housing area demand, conversion coefficient of urban residential land, urban residential land, urban per capita land for road transportation facilities, land for urban road transportation facilities, other urban construction land, urban construction land, and urban per capita construction land;
  • Economic systems factors: GDP, per capita GDP, average production value per area, proportion of primary industry, proportion of secondary industry, proportion of tertiary industry, growth rate of primary industry output value, added value of primary industry, output value of the primary industry, growth rate of secondary industry output value, added value of secondary industry, output value of the secondary industry, industrial ratio to secondary production, industrial output value, average output value of industrial land, growth rate of tertiary industry output value, added value of tertiary industry, output value of the tertiary industry, and average output value of tertiary industry land;
Spatial factors6Elevation, slope, aspect, distance to main roads, distance to rivers, and distance to administrative centers
Table 3. Estimation and prediction results of land-use demand.
Output VariablesThe Year 2018The Year 2028The Year 2038
Area of forest land (ha)537,953570,353603,948
Area of grassland (ha)40,27939,38239,699
Area of cultivated land (ha)55,09050,66151,809
Area of construction land (ha)11,44716,48822,806
Table 4. Matrix of transformation suitability.
Cultivated LandForest LandGrasslandWater SurfaceConstruction LandOther Land
Cultivated land111110
Forest land111111
Grassland111111
Water surface000110
Construction land000010
Other land000001
Table 5. Simulation accuracy of land use types in Ya’an City in 2018.
Cultivated LandForest LandGrasslandWater SurfaceConstruction LandOther Land
Actual number of cells185,8681,403,516233,99211,52018,9863159
Simulation number of cells SD-ANN-CA model (ha)190,9871,404,623234,52210,93418,9513145
Error-accuracy of SD-ANN-CA model2.75%0.08%0.23%5.08%0.18%0.44%
Kappa coefficient of SD-ANN-CA model0.9310.9980.9940.8730.9960.989
Error-accuracy of ANN-CA model [49]3.25%3.57%4.35%7.34%3.78%5.56%
Disclaimer/Publisher’s Note: The statements, opinions and data contained in all publications are solely those of the individual author(s) and contributor(s) and not of MDPI and/or the editor(s). MDPI and/or the editor(s) disclaim responsibility for any injury to people or property resulting from any ideas, methods, instructions or products referred to in the content.

