Article

Comparing Bio-Ester and Mineral-Oil Emulsions on Tool Wear and Surface Integrity in Finish Turning a Ni-Based Superalloy

1
Institute for Innovation in Sustainable Engineering (IISE), College of Science and Engineering, University of Derby, Kedleston Road, Derby DE22 1GB, UK
2
Rolls-Royce Plc, P.O. Box 31, Moor Lane, Derby DE24 8BJ, UK
3
Department of Mechanical Engineering, University Carlos III of Madrid, 28911 Leganés, Spain
*
Authors to whom correspondence should be addressed.
Lubricants 2024, 12(5), 164; https://doi.org/10.3390/lubricants12050164
Submission received: 27 March 2024 / Revised: 2 May 2024 / Accepted: 4 May 2024 / Published: 8 May 2024
(This article belongs to the Special Issue Friction and Wear of Alloys)

Abstract

:
The paper compares the performance of two bio-ester and two mineral-oil emulsion metalworking fluids (MWFs) in finish turning an Inconel 718 alloy bar with a high hardness (HB 397 – 418). In this study, a coolant with a lean concentrate diluted at 6.5% to create an emulsion with stabilised water hardness was used to prepare each MWF. The finish-turning method used a small tool nose radius (0.4 mm) and small depth of cut (0.25 mm) to turn down 52.2 mm diameter bars in multiple passes to reach a maximum tool flank wear of 200 µm. In each MWF turning test, the tool flank wear, cutting forces, and surface roughness were measured against cut time. Chips from each MWF turning test were also collected at the same cut time instances. The surface and subsurface integrity on a workpiece obtained from each MWF turning test were compared by using a new unworn tool. Overall, for the machining parameters studied, the findings suggest the bio-esters were capable of equivalent machining performance as the mineral-oil emulsions, apart from one bio-ester that displayed improved surface roughness. Common to all MWF turning tests was a change in the chip form at low flank wear, which is discussed. Further findings discussed include the sensitivity of the concentration of the MWF diluted in the emulsion and the effect of the workpiece hardness within the batch used, with useful recommendations to improve the finish-turning method for the assessment of MWFs.

1. Introduction

Metalworking fluids are used to lubricate manufacturing processes to reduce friction [1,2,3]. In machining, the function of the cutting fluid (CF) is to provide both lubrication and cooling to the tool and workpiece, reduce friction and tool wear, enhance productivity, maintain the surface integrity of the part produced, wash the chips away, and extend the life of the machine asset [4,5,6]. The finish machining of components used in aircraft engines is a critical final-stage manufacturing process, and CFs are essential to maintaining process capability [7,8]. Precision-turned parts in aircraft engines account for a high proportion of machined engine components, and up to 50% are still made from nickel-based (Ni-based) superalloys [9]. Over several decades, Inconel 718 has accounted for a sizable volume of the total annual production of all Ni-based superalloys [10], and it is still a popular choice among high-temperature and corrosion-resistant alloys due to its weldability and availability.
According to GlobalNewswire.com [11], worldwide consumption of metalworking fluids is expected to increase to 3.66 megatons by 2025. Putting this in perspective, this is equivalent to 9.7% (37.8 million tonnes [12]) of the fuel for road vehicles in the U.K. (2018). In recent decades, it has been estimated that 80% of the metal products produced require a machined finish [13]. Approximately 16% of the total machining cost of a product is attributed to the CF life cycle [14,15,16]. Still today, coolants used in industry for machining use formulations that are derived from fossil fuels and disposal generate a high waste stream that is incinerated [17]. According to Debnath et al. [18], the cost of disposal can be up to four times the purchase cost because CFs are not biodegradable. Some large international original equipment manufacturers, OEMs, have committed to achieve net zero greenhouse gas emissions by 2030 [19], and this will drive the same commitment into the product life cycle within supply chain tiers. Whilst there is a desire to switch to using coolants that have a much lower impact on the environment, such as bio-based formulations, the machining performance and product life cycle of these new products must be proven. This necessitates independent evidence of their capability in real machining studies that can simulate industrial processes.
A modern MWF formulated with a vegetable-ester-oil was shown to display enhanced lubricity in machining a hard Titanium alloy at low cutting speed, together with a significant reduction in its life-cycle carbon footprint, compared to fossil-derived CFs [17]. Saleem and Mehmood [6] demonstrated improved surface integrity in turning Inconel 718 using coolants formulated from sunflower and castor oil which were applied using minimum quantity lubrication (MQL). Gong et al. [20] found that the small graphene platelets in the CF, which were applied by MQL, delivered the best overall surface integrity regardless of the cutting speed in machining Inconel 718. Teo et al. [21] found palm oil, mixed with Al203 nanoparticles, was the best-performing vegetable oil in machining Inconel 718 over the coconut and olive oil formulations. Sen et al. [22] found silica-doped palm oil to be an effective lubricant in improving the machinability of Ni-based alloys. A full review of vegetable oil-based CFs for sustainable machining was undertaken by Kazeem et al. [23], and the most widely used were coconut, sunflower, and palm oils. But due to their high relative cost, the use of MQL was essential to their commercial viability. More recently, Wood et al. [24] showed that the stabilisation of the water hardness in an aged bio-ester emulsion coolant could maintain as-new service performance over a very long sump life. Overall, it was concluded that whilst there is a growing number of published articles that studied clean coolants to machine Ni-based superalloys that were derived from either vegetable oils, bio-based esters, or nanoparticle doped formulations, there were no published works that directly compared their performance with modern commercially available mineral-oil-based coolants that comply with the latest health and safety requirements [25].
Whilst Inconel 718 alloy is machinable, it is often described as a difficult-to-machine alloy because of its high tensile strength, ~1200 Mpa [26], that is retained up to 650 °C. Accelerated tool wear occurs due to the high cutting forces and high temperature in the chip deformation zone, which can soften the tool. Hard submicron size particles from the second phase, such as gamma primes (γ′ + γ″) in the alloy microstructure [27], also cause rapid tool wear. Machining of Inconel 718 results in the formation of a serrated chip from local thermal softening and shear banding [28,29,30] that causes residual tensile stress on the cut workpiece surface.
Numerous published works on turning Inconel 718 [31,32,33] have focused on improving production efficiencies whilst maintaining the surface integrity of the machined part by studying a wide range of process parameters, tool geometries and materials, tools with and without coatings, coolant types, and their application methods. Most of the published works on turning Inconel 718 used a tool nose radius (rn) of 0.8 [33,34,35] or 1.2 mm [4,35] or larger [5]. Fewer articles [36,37,38] have studied the finish turning of Inconel 718, using a smaller rn of 0.4 mm, and only one article [24] used a bio-ester emulsion. Whilst some key performance measures in these published articles were studied, such as tool wear or surface integrity, none considered the broader range of performance measures covering, for example, tool wear rate, cutting forces, chip forms, surface and subsurface integrity in the performance evaluation of the CF to finish turn this alloy. This paper complements the recent work [24] that studied the effect of a long sump life of a bio-ester emulsion on tool wear in finish turning a Ni-based superalloy. Furthermore, the number of performance measures was increased to compare the bio-ester and mineral-oil-based emulsions with the aim of increasing confidence in the findings.

1.1. Tool Flank Wear Acceptance Criteria in Finish Turning Ni-Based Superalloys

In finish-turning Ni-based superalloys, Axinte et al. [39] identified a tool flank wear limit of 300 μm and arithmetic mean surface roughness (Ra) of 0.8 µm as preliminary acceptance criteria for the cutting parameters. More recently, the work of Hood et al. [40] based tool life on a maximum flank wear criterion of 200 μm in turning studies on the Ni-based superalloy RR1000. Soo et al. [41] also studied tool life in milling RR1000 and used a maximum flank wear criterion of 200 μm. ISO 3685 1993E [42] specifies a flank wear limit for tool-life testing of 300 μm, but this is applicable to the turning of steel and cast-iron workpieces. The lower flank wear limit for turning Ni-based superalloys reflects the high surface integrity requirements of the product in its end use in aircraft engines.

1.2. Tool Wear Failure Modes in Turning Inconel 718

Abrasive wear was identified as the main tool wear mechanism [4,33], and deterioration of the tool coating was the cause of catastrophic tool failure. In dry turning Inconel 718, Rakesh et al. [32] found the depth of cut (ap) affected the chip form, and the dominant tool wear mechanisms were adhesion, abrasion, chipping, and notching that caused tool failure. In finish turning Inconel 718, with rn = 0.4 mm over a wide range of cutting speeds from 50 to 400 m/min, Díaz-Álvarez et al. [43] found chipping, notching, and flank wear were the dominant tool wear modes. The cause of notch wear was attributed to high surface work hardening of the workpiece in the chip-forming region that developed a high adiabatic temperature. Wood et al. [24] identified significant notching when flank wear exceeded 0.3 mm in finish turning Inconel 718. Darshan et al. [44] found different CFs, and their application methods influenced the chip forms that were attributed to the prevailing friction conditions. According to Yilmaz et al. [45], in turning Inconel 601 using MQL, continuous chips that can accelerate tool wear were caused by reduced friction. Sivalingam et al. [31] found that when CF was applied as an atomised spray, the abrasive wear and notch wear in turning Inconel 718 was reduced. Under dry conditions at the lower cutting speed (Vc) of 50 m/min, Cantero et al. [36] observed that flank wear was dominant, and at the higher Vc of 70 m/min, chipping was the main tool failure mode. Using an emulsion of 8% concentration under flood cooling, Ostrowicki et al. [46] found a longer cut length was achieved using a cubic boron nitride tip over a cemented carbide tip. In turning engineering alloys, Kramer and Suh [47] found a sharp increase in crater wear occurred above a certain temperature, which was due to the diffusion rate of atoms that migrate from the tool to the chip and vice versa. As the crater wear approaches the cutting edge, it weakens the tip and causes a chipping fracture at the tip edge [48]. When the tool temperature is lowered, the rate of crater wear reduces so that flank wear dominates, and the Vc is a determining factor in the resulting wear regime [13].

1.3. Tool Wear Effects on the Workpiece Surface Integrity

In turning Inconel 718, Pusavec et al. [49] found the work-hardened sub-surface layer can extend to 40 μm. Due to the higher concentration of heat with tool wear in turning a Ni-based alloy [39], a thin white layer a few microns in thickness can readily develop on the free surface of the workpiece. Other anomalies [39] that affect the surface integrity include surface drag, laps, plucking, and cracking. Laps (material folded onto itself) and plucking (small particles of material removed from the surface) were the criteria used to select the optimum cutting conditions. The machining-induced residual stress in Ni-based alloys, as determined using X-ray diffraction [49], was shown to develop a tensile hoop stress at the surface up to ~800 MPa. This stress quickly decreased below the surface to become compressive at 12 μm and was influenced by the lubricant methods used, such as MQL and Cryogenics. According to Yazid [50], tool wear can lead to a reduction in Ra in finish-turning Inconel 718, which affects the surface integrity of the workpiece. In fine turning, many metals, including Inconel 718 and Mital [51], showed Ra deteriorated with increasing Vc, whilst the effect of the feed and tool nose radius were not significant. Derani [52] found a decrease in Ra was caused by the tool nose wear changing from a circular to an elliptical profile, which reduced peak-to-valley height. Although no clear relationship between the flank wear and Ra was found, it mentions for a small ap, the location of the flank wear measurement on the tool nose is important. According to Li [53], the degree of rubbing and shearing depends on tool wear and BUE, so that surface roughness cannot, in general, be equated to tool wear.

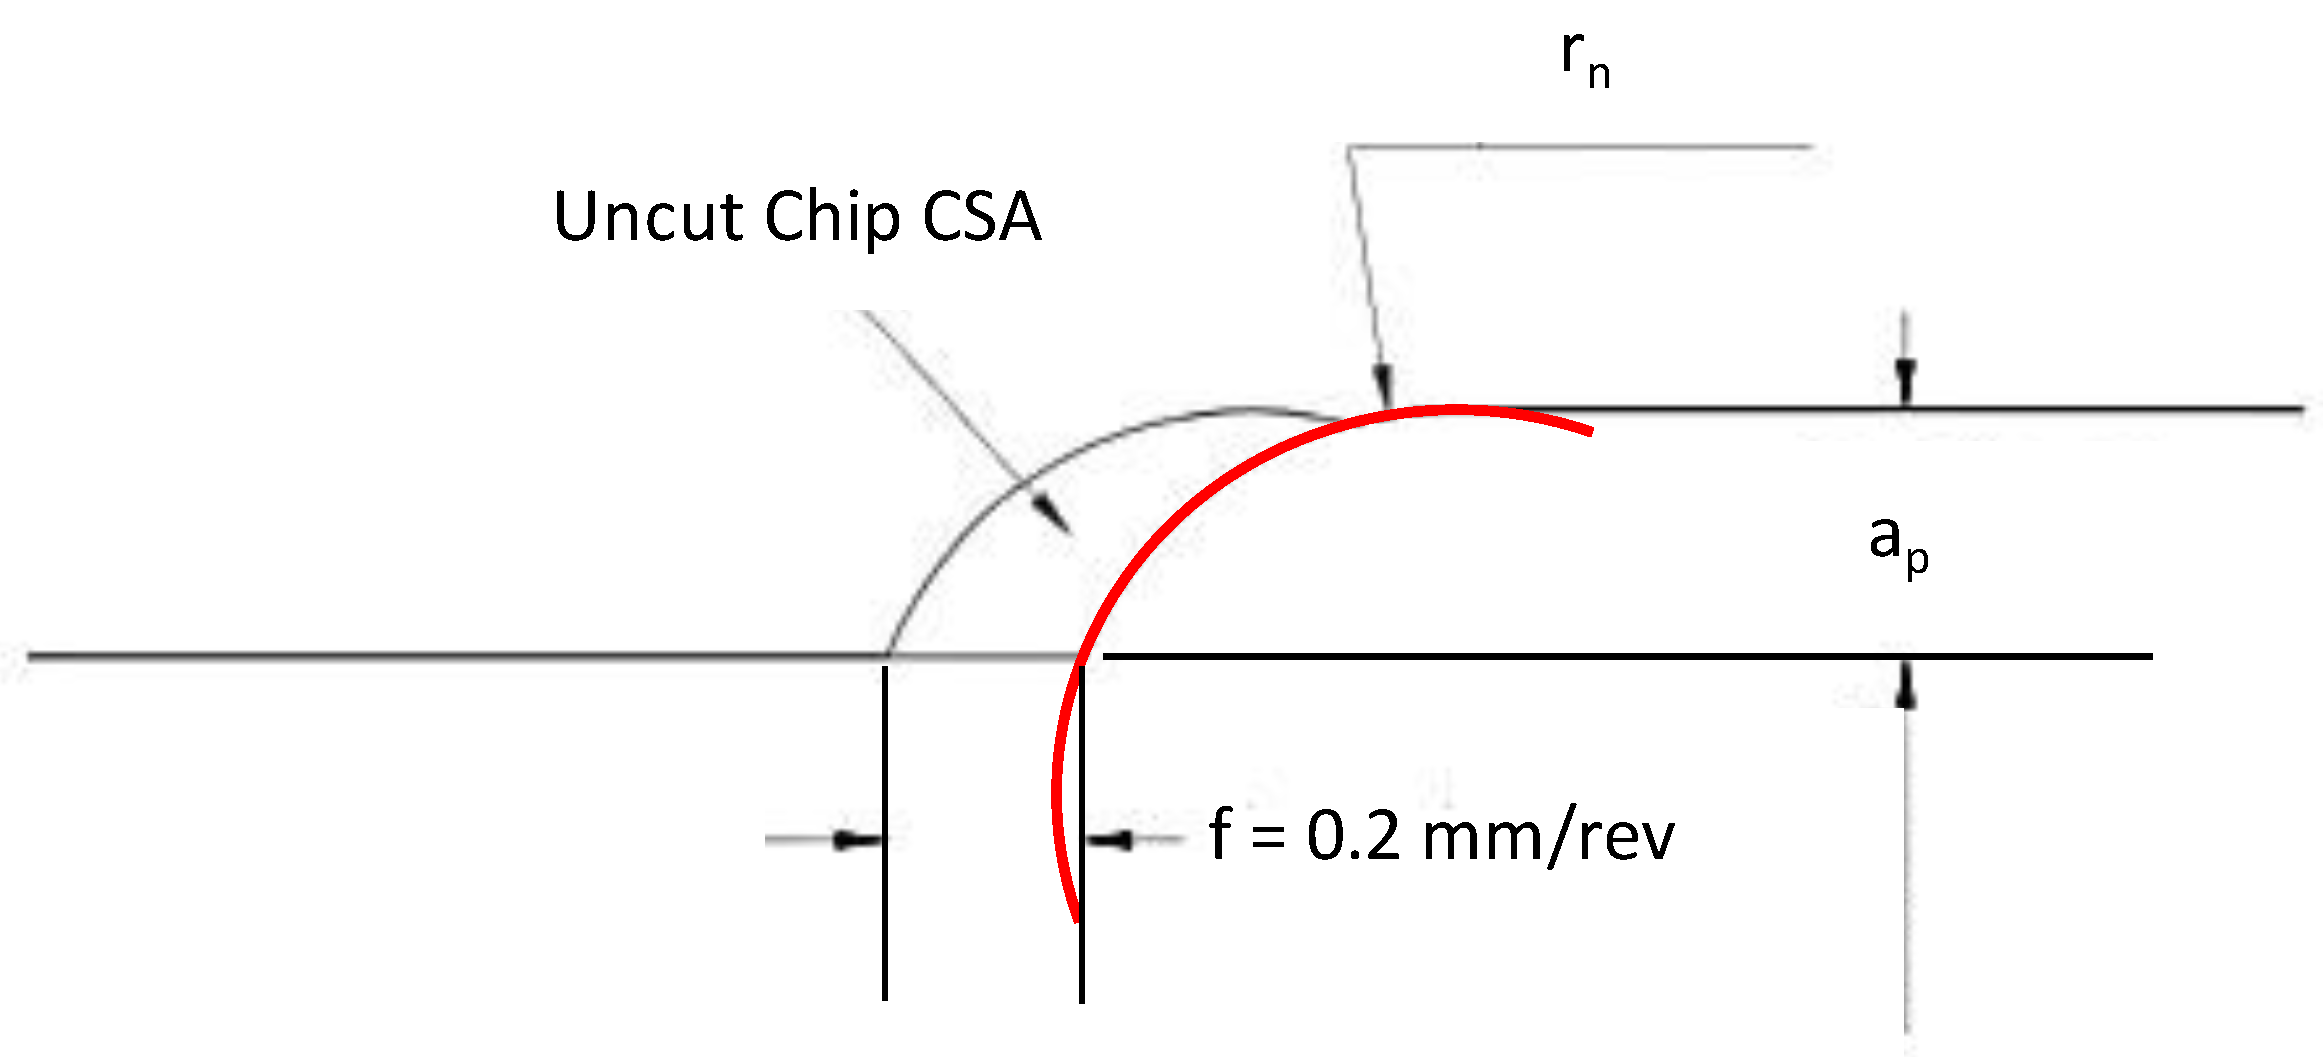
1.4. Effect of Tool Nose Radius in Finish Turning

If the rn is greater than the depth of the cut (ap), the tool nose is not fully engaged in the depth of the cut. To compare the theoretical uncut chip geometry for rn = 1.2 and 0.4 mm, a constant metal removal rate was assumed with ap = 0.25 mm and feed (f) = 0.2 mm/rev. Figure 1 presents a 2D CAD model of the uncut chip thickness for the finish-turning operation. The rn is shown in red, and the uncut chip cross-section area (CSA) is determined by the feed motion in one revolution of the turned bar.
The distance between the outer and inner arc of the uncut chip is the thickness, which varies from a minimum, at ap = 0.25 mm, to a maximum at the free surface where ap = 0. The mean uncut chip thickness (CT) was determined for rn = 1.2 and 0.4 mm by dividing the uncut chip CSA by the arc length of contact (AL). The AL and CSA were accurately determined from the 2D digital CAD model, and the results are shown in Table 1. With rn = 0.4 mm, the mean uncut CT at 0.868 mm was 1.6 times greater than rn = 1.2 mm at 0.559 mm.
According to Boothroyd [54], the specific cutting energy in machining, which is determined by dividing the main cutting force by the uncut chip CSA, was shown to be inversely proportional to the mean uncut CT. Parida and Maity [55] used finite element analysis to simulate the orthogonal machining of Inconel 718 and showed that increasing the rn from 0.4 to 1.2 mm, reduced the mean uncut CT and increased the main cutting force. Since the adiabatic increase in the temperature of the chip is proportional to the specific cutting energy, a higher temperature caused by a thinner chip [56] could accelerate crater wear over flank wear.
With consideration to the Ra, and on the assumption of no wear for the turning parameters used in Figure 1 and Table 1, the theoretical cusp height will be lower for rn = 1.2 mm than rn = 0.4, which is expected to reduce the Ra. So, for this reason, and to encourage flank wear over crater wear as the main tool wear failure mode, the preference was to conduct the experiments with rn = 0.4 mm. By increasing f, the Ra for rn = 0.4 and 1.2 mm would also increase.

1.5. Overview of Approach Taken

The four CFs were modern, commercially available products that complied with the latest H&S requirements. To compare their performance in finish turning an Inconel 718 alloy bar, the approach used an adaptation of the setup described in [24]. In this study, the approach used a coolant with a lean concentrate diluted at 6.5% in water with stabilised hardness, to turn down a bar of 52.5 mm diameter in multiple passes to reach a maximum tool flank wear limit of 200 µm. This flank wear limit is in accord with the criterion suggested for machining Ni-based superalloys discussed in [40,41]. During each turning test, the machining was suspended at several stages at the same cut time intervals to measure the maximum flank wear and surface roughness and to collect chips. The cutting forces were measured throughout each test. To compare the surface and subsurface integrity of a workpiece obtained from the different CF turning tests, a final finish turn was performed using a new unworn tip and terminated partway along the bar. This was undertaken after completing a CF turning test to enable a direct comparison of workpiece surfaces on the same bar using the unworn and worn tips.

2. Materials and Methods

2.1. Workpieces

The bar workpieces were Inconel 718 supplied with a nominal 54 mm diameter and 255 mm length obtained from the supplier (BÖHLER, Vienna, Austria). The bars supplied had been solution annealed at 1886 °F (1030 °C) for 1.5 h and then age-hardened at 1436 °F (780 °C) for 6.3 h. The mechanical properties of the Inconel 718 bars given in the mill certificate are shown in Table 2, and the composition elements are in Table 3.
In Table 2, the hardness of the Inconel 718 bar supplied reduced from HB 360 near the surface to HB 341 at the bar centre. The Brinell Hardness (HB) was determined according to EN ISO 6506-1:2005 [59] at three positions along the length of each bar shown in Figure 2 so that an average hardness was determined for each bar. The average hardness of each bar was in the range from HB 397 to 418, which was higher than given in Table 2. This may be because the hardness measurements were performed with the skin layer still present on each bar. Nevertheless, in a previous study [24], CF trials were conducted on a different batch of Inconel 718 bars obtained from the same supplier but with a slightly smaller nominal diameter (50.8 mm). The average hardness range near the surface was found to be lower at HB 339 to 345 and was in accord with the specification of the alloy hardness in Table 2.
According to the mill certificate, the microstructure of the bar supplied was mainly free of the acicular delta phase and continuous networks of secondary phases along grain boundaries. The laves phase was not present in the microstructure. The grain structure near the surface was uniform, with an average grain size of 130 µm. At the centre of the bar and at ½ the radius, the grain structure was Duplex, which may explain the reduced hardness from the near-surface to the centre of the bar.

2.2. Machine Tool

A CNC lathe model SLX1630 (XYZ Machine Tools, Tiverton, UK) with a programmable spindle speed range from 150 to 2500 rpm was used. Further details of the machine tool are given in [24].

2.3. Cutting Fluid

Table 4 presents the four water-miscible emulsion CFs investigated in this paper. SS1 and SS2 were classified as semi-synthetic under ASTM E2523-13:2018 [60] and formulated for machining hard alloys, such as Inconel 718. BIO1 and BIO2 were synthetic and formulated for machining hard alloys. The four CFs were commercially available products and comply with the health and safety regulation (EC) REACH No. 1907/2006 [25].

2.4. Preparation of CF in the Machine Tool Sump

To achieve a consistent water hardness of 125 ppm for each CF test, the water used to dilute the CF and produce the emulsion was a mixture of mains tap water supplied by the local water authority and deionised water in a ratio 2:1, respectively. Before starting an experiment with each CF, the sump of the machine tool was flushed, cleaned, and thoroughly rinsed. The neat CF was diluted to 6.5% using the mixture of mains tap water and deionised water, then allowed to settle in the sump for 48 h. The concentration of the neat CF was measured using a refractometer type RHB-32 with a range of 0 to 32% Brix, in accordance with ASTM D3321 [61], and the refractometer reading was multiplied by the appropriate CF factor to determine the concentration. Immediately before starting a CF test, adjustment to the CF concentration was made to ensure it was within ±0.1 of the target 6.5% concentration, and this was completed for every test. The testing of each CF was completed within 7 working days from the time it was introduced into the sump of the machine.

2.5. Tool Holder and Tip Insert

The tool holder was supplied by ISCAR (Birmingham, UK) with the designation PWLNR 2525M-06X-JHP Jetcut. The CF was delivered through the tool using a nozzle diameter of 2.1 mm. The tip insert (ISCAR, Birmingham, UK) was a double-sided 80° trigon with a nominal rn = 0.4 mm. The tip was made from cemented carbide (WNMG 060404-F3S IC806) and TiALN + AlTiN PVD coated for finish-machining hard heat-resistant alloys. The tool nose was only partially engaged with ap set to 0.25 mm so that rn > ap. The tool angle with respect to the round workpiece was −6° negative rake in both feed and radial directions. Likewise, there was a 6° clearance in feed and radial directions. The small chip-breaking feature at the tool edge presented a 14° positive rake over approximately 0.5 mm when mounted in the tool holder. The approach angle used was 95°. Five tip inserts were randomly selected from the batch, and each was measured, giving rn = 0.39 mm with a deviation of <0.01 mm. The cutting-edge radius on the flat face of the nose was estimated to be between 0.02 and 0.03 mm.

2.6. Setup and Method for Experiments

The tool life for precision finish turning was determined by the flank wear land (VBz), according to the general definition in ISO 3685 1993E [42]. The subscript (z) denotes the direction of wear, using the coordinate system in Figure 3. To measure the evolution of VBz on the tool, the machining was suspended at 6 stages for approximately 30 min, during which the insert was removed, flank wear measured, and the insert returned to the tool holder. There was a final 7th-measurement stage after completing the turning test. The measurement of VBz over 7 stages was a practical upper limit to contain a single full test on one end of a bar to half a day’s work. For each test, the bar workpiece was secured in the 3-jaw chuck with a stick-out length of 105 mm. Initially, the bar was lightly skimmed to 52.5 mm in diameter in one pass, using a different tip insert to remove the skin and true the bar on the machine.

2.7. Finish Turning Parameters Used in the Study

To compare the four CFs, the finish-turning method used the parameters Vc = 90 m/min, ap = 0.25 mm, f = 0.2 mm/rev, and a CF flow rate through the tool of 1.0 L/min. Table 5 identifies the seven stages and associated cut times in which turning was suspended to measure flank wear and collect chips. Table 5 also shows the reduction in the bar diameter at the end of each stage, the number of tool passes on the feed (X) axis per stage, the total cut length on the X-axis per stage, and the total cut length on the main cutting Z-axis per stage. The latter was determined using the equation Vc × tc. Between stages 6 and 7, the number of tool passes increased from 3 to 6, and the corresponding cut length on the X-axis increased nearly 2-fold. The tapered shoulder shown in Figure 2 was an intended feature to prevent the tool’s leading edge from colliding into the shoulder with each cut pass, and it reduced the turned diameter on the shoulder from 52.5 to 41 mm.

2.8. Cutting Force Dynamometer

A Kistler type 9119AA2 three-component dynamometer (Kistler, Winterthur, Switzerland) was used to measure the cutting forces. The tool post on the machine was removed and replaced with the dynamometer, and the tool holder was clamped to the dynamometer. The data acquisition rate on the instrument was 1 kHz. The main cutting force (Fc) was on the Z-axis, the feed force (Ff) was on the X-axis, and the radial force (Fr) was on the Y-axis. Figure 3 shows the coordinate system with respect to the workpiece. The cutting forces were recorded in all CF turning tests.

2.9. Surface and Subsurface Integrity

To examine the surface and subsurface integrity in a similar way as was used in [40], a final finish turn used a new unworn tooltip on one workpiece for each CF. The final finish turn was terminated at 11 mm along the workpiece from the front end of the bar on the X-axis and is shown in Figure 4. The X-axis identifies the tool feed direction. Using EDM, a small piece was wire-cut from the workpiece in the direction of bar rotation shown in Figure 4, mounted in resin, polished, and etched using the method as in Section 2.10. The red arrow identifies the surface of interest for microstructure examination. For each CF group, one sample was obtained this way.

2.10. Sample Preparation for Imaging

Each small wire-cut piece from one of the bar workpieces in each of the CF groups tested was mounted in a conductive resin. The resin-mounted samples were ground using P180 g, 220 g, 400 g, and 1200 g SiC grit, then further ground using a surface abrasive cloth from 9 um to 3 µm, and then polished using 0.06 um silico. A Nimonic acid solution of 50% HCI, 40% H2O, 10% HNO3, 2.5% FeCl3, and 2.5% CuCl2 was used to etch the resin-mounted samples using a 5 s swab time and then immediately rinsed in tap water.

2.11. Imaging

A ShuttlePix P400-R digital microscope (Nikon, Amsterdam, The Netherlands) at 150× magnification was used to measure the VBz at the leading and trailing edges of the tool. The maximum flank wear (VBzmax) was measured with an estimated precision of 20 μm. The measurement precision decreased as the wear developed on the rake face because the datum from which the flank wear was measured must be reconstructed on the image taken of the tool wear. This method of measurement is shown in [24]. An Olympus BX53M microscope was used to examine the subsurface deformation of etched samples.

3. Results and Discussion

Using the finish turning parameters given in Section 2.7, the VBzmax obtained for all four CF turning test groups is shown in Figure 5. The abscissa is the cut time, and the numbers 1 to 7 identify the end of each stage in which VBzmax was measured. Allowing VBzmax to substantially exceed VBz0.2 mm runs the risk of encountering vibration and chatter modes, which is an unstable machining mode that could result in damage to the dynamometer instrument. However, in some CF turning tests, the VBzmax exceeded VBz0.2 before the full six cut passes in stage 7 were completed, so they were terminated. In just one CF turning test, stage 7 was extended to reach VBz0.2. At stage 3, the results displayed considerable variability. For the SS1 group with five repeat trials, the upper and lower values for VBzmax are identified in Figure 5 at 0.136 and 0.052 mm. This variability will be discussed. Only three repeat trials were conducted for the other three CF groups.

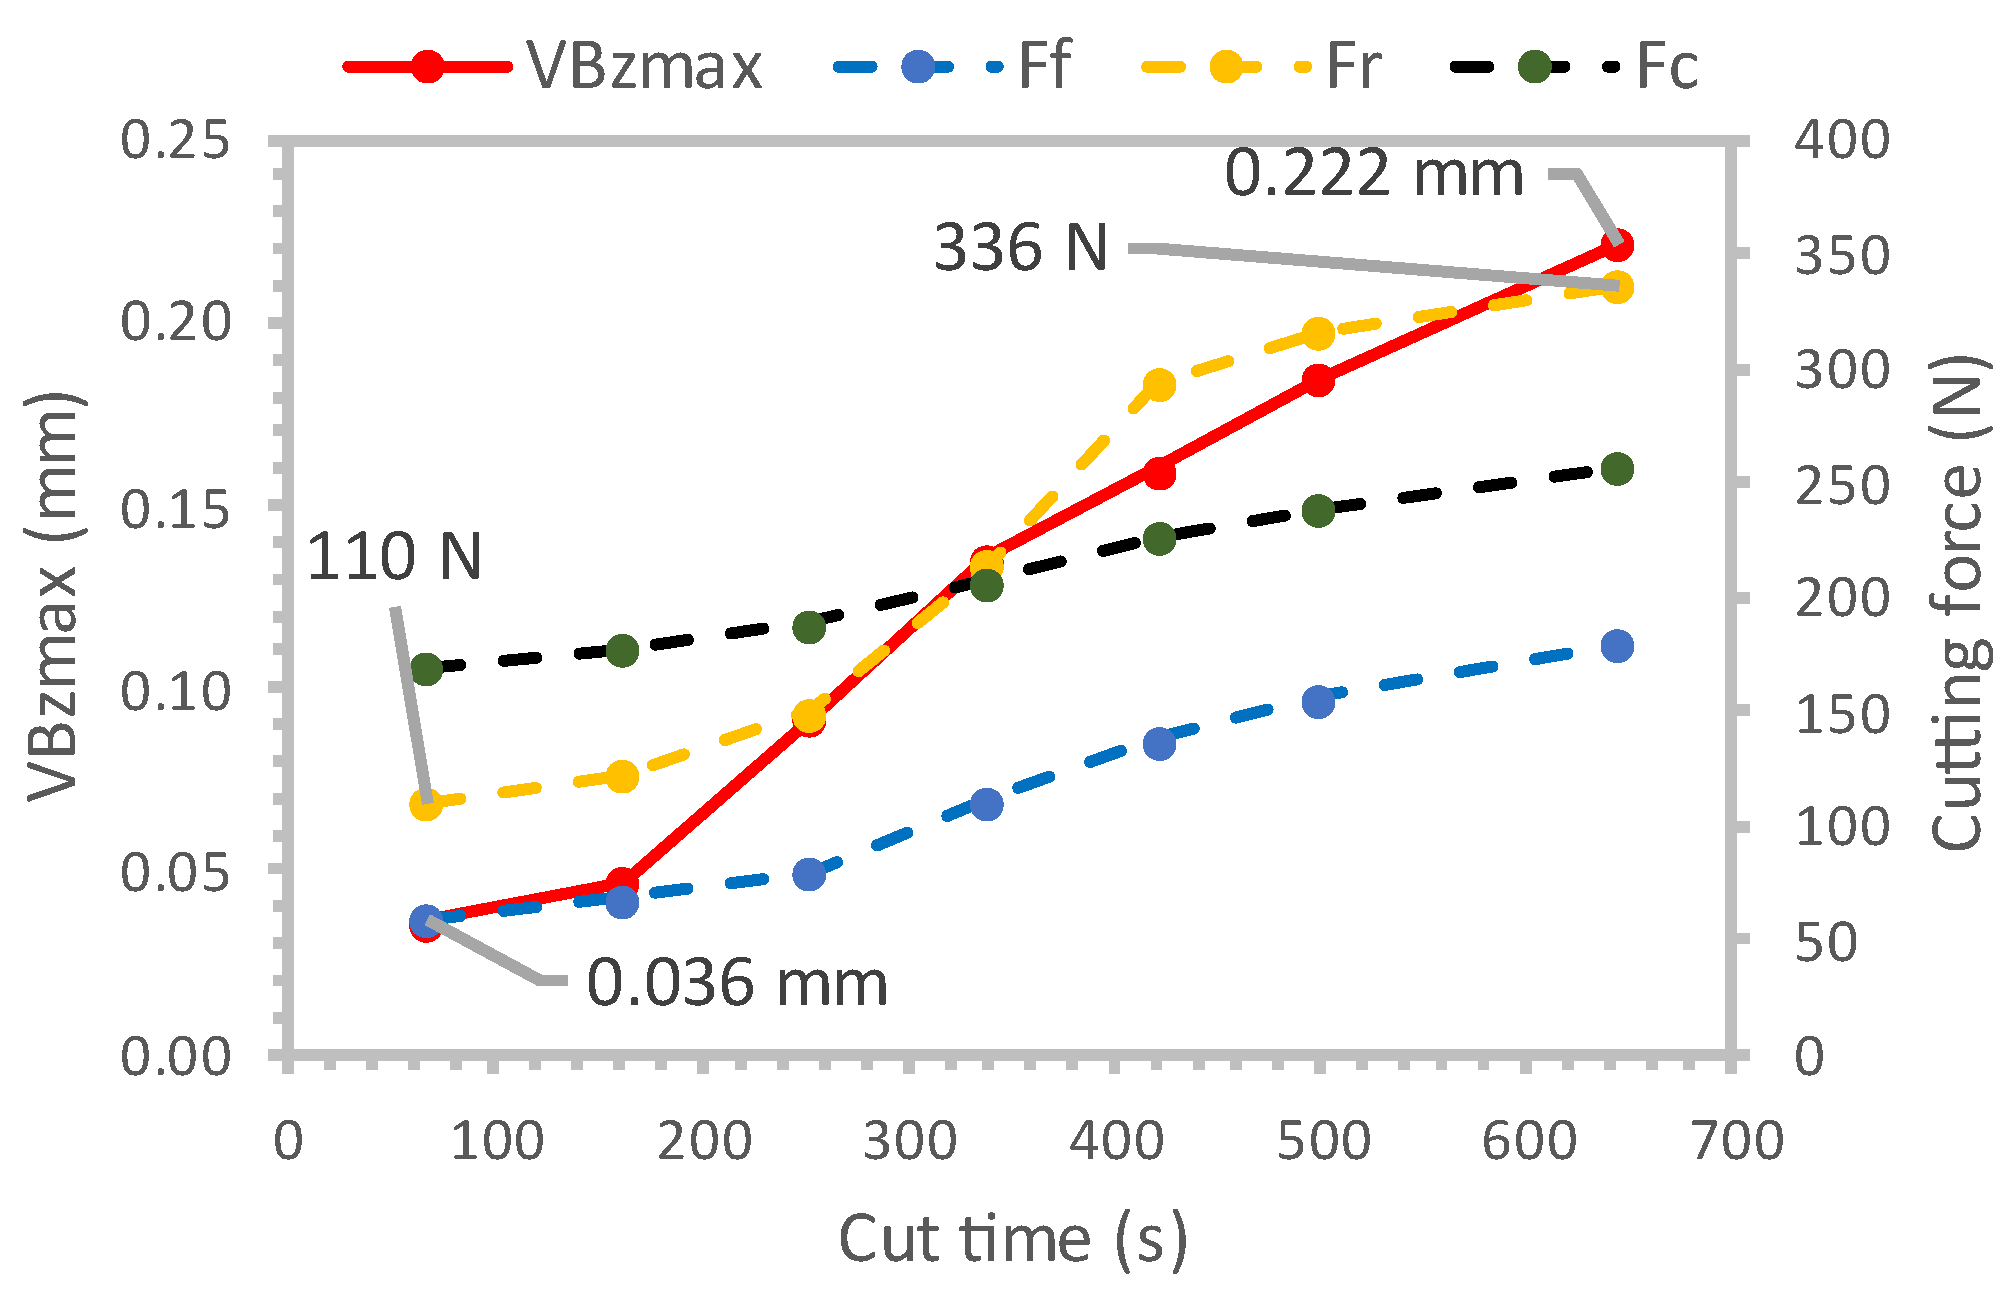
3.1. Cutting Forces and Flank Wear

The tangential (Fc), radial (Fr), and feed (Ff) forces versus cut time for test 1 of the 5-repeat tests in the SS1 group are shown in Figure 6. The Fc, Fr, and Ff were averaged over the same cut time intervals that the flank wear VBzmax was measured. In Figure 6, Fr increased at a much faster rate than Ff and Fc, increasing from 110 to reach 336 N, to confirm a higher sensitivity to VBzmax, which was observed in all CF turning tests. Of the three cutting forces, Fr displayed the highest sensitivity to the flank wear, followed by the Ff, whilst the Fc displayed the lowest sensitivity. The Fr will be used alongside other measures to compare the performance of the four CFs.

3.2. Performance Measures to Compare CF Turning Test Results

The results of VBzmax and surface roughness (Ra) for the first test of each of the four CF groups are displayed in Figure 7a. A 3rd order polynomial was fitted to these results from which trends can be discerned. Each fitted curve for VBzmax versus cut time displays two turning points. At lower flank wear, the positive upward turning point indicates accelerated wear, after which the trend leveled off at the higher wear turning point. The trend observed for Ra with cut time was the inverse of VBzmax.
The measures to compare the results obtained from all the CF turning tests were cut time tc0.1 and tc0.2 to reach the flank wear limits VBz0.1 and VBz0.2. Other measures used to compare the CFs at the same flank wear limits included surface roughness Ra0.1 and Ra0.2 and the radial cutting force Fr0.1 and Fr0.2. By characterising the performance measures at the two flank wear limits in this way, the effect of the workpiece hardness may be quantified. Figure 7b shows the method used to determine the cut time and Ra on the ordinate and VBzmax on the abscissa, intersecting the fitted curves at VBz0.1 and VBz0.2. The same approach was used to determine Fr at the two flank wear limits of VBz0.1 and VBz0.2.

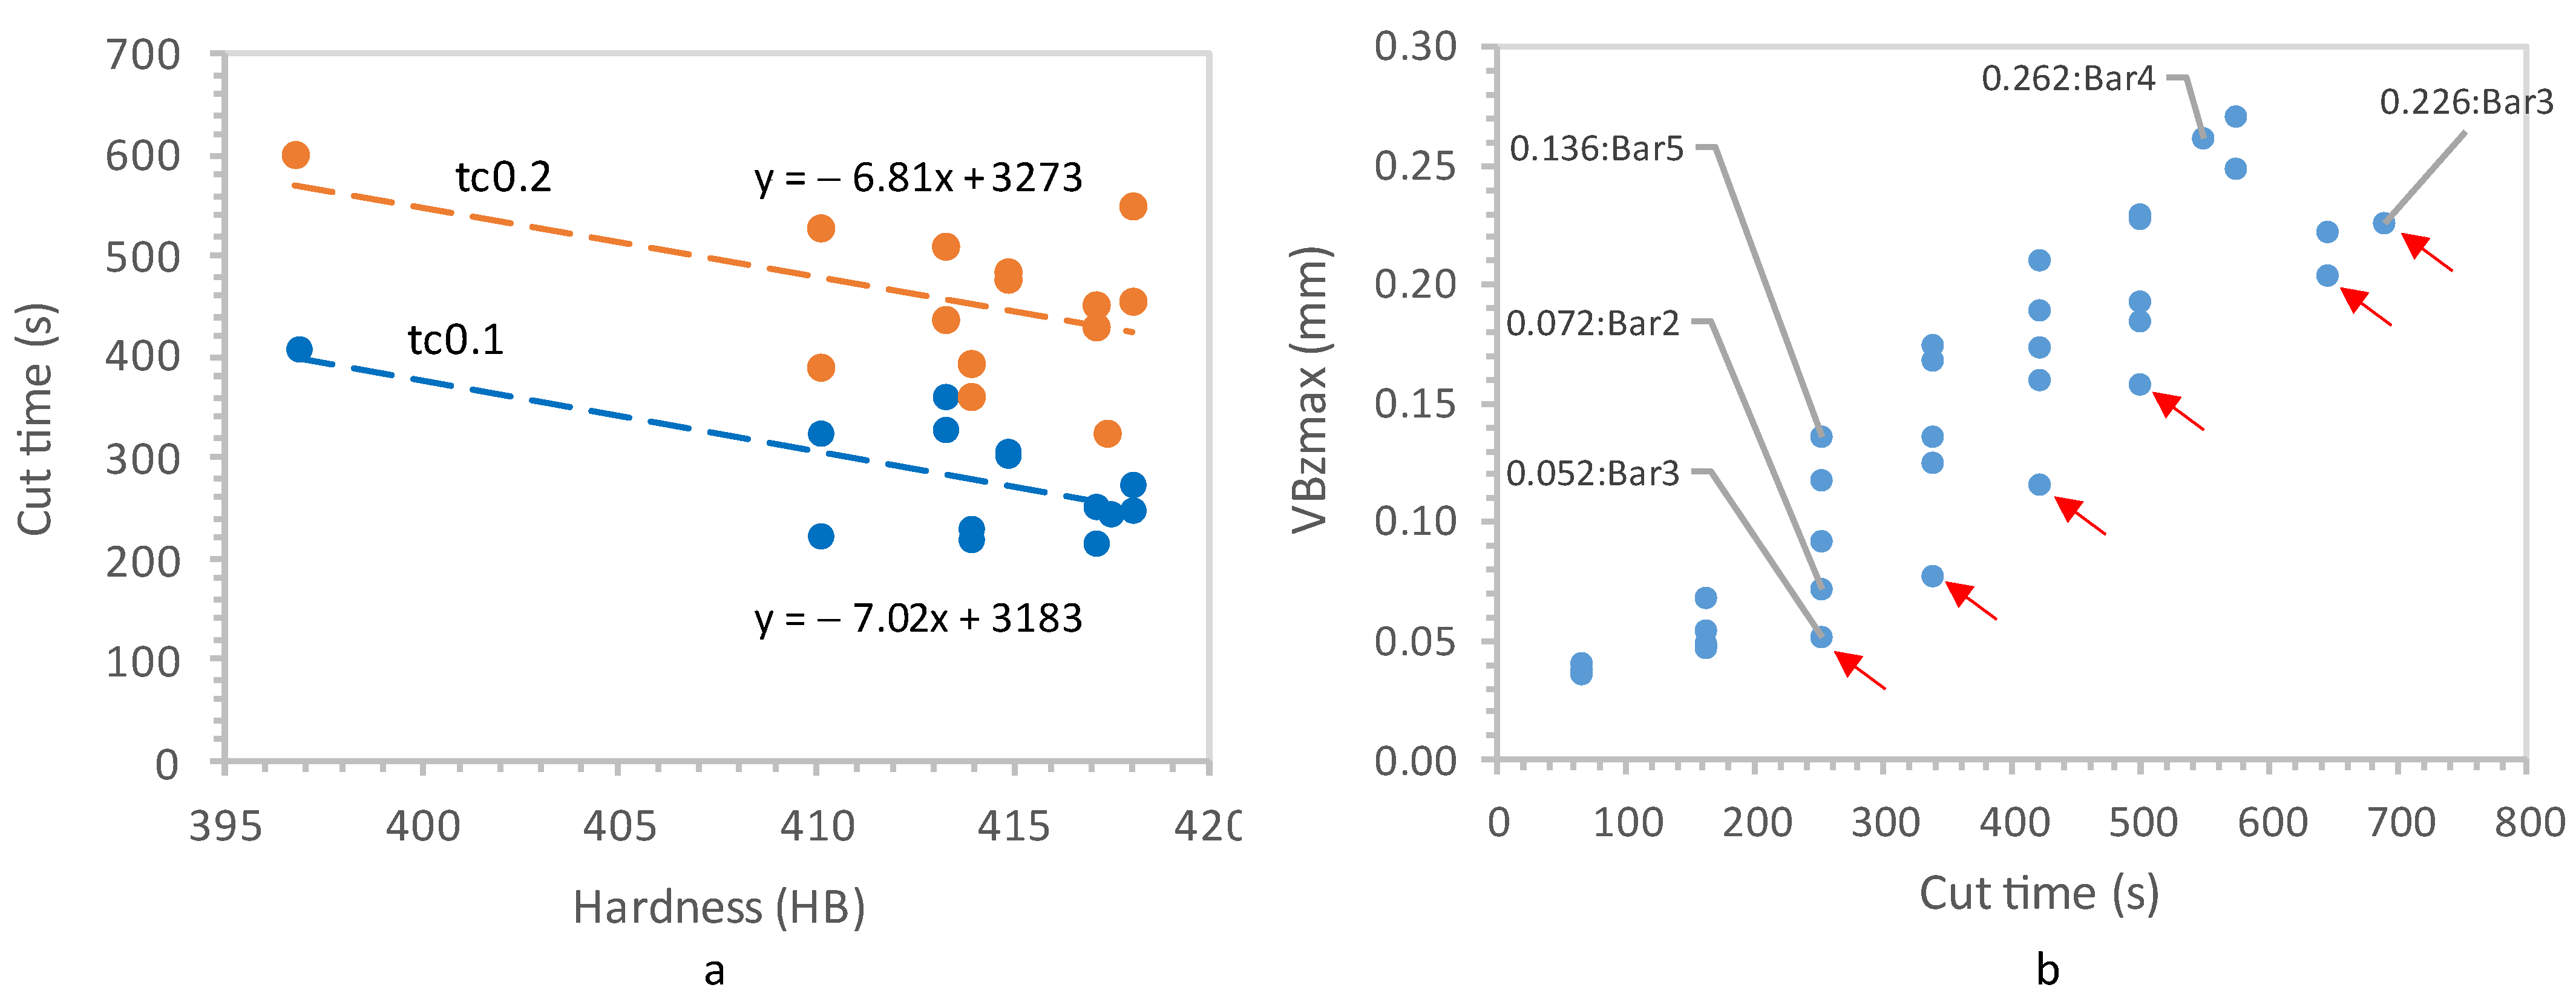
3.3. Effect of Workpiece Hardness

The results of the CFs characterised using the method in Section 3.2 are shown in Table 6. One additional measure included in Table 6 was the radial cutting force 67 s (Fr67) from the start of machining to reach the end of stage 1. In Figure 8a, the effect of workpiece hardness on cut time (tc0.1) and (tc0.2) for all four CF turning test results showed that cut time increased as bar hardness reduced, which reduced the tool flank wear rate. The gradient of the fitted trend lines for tc0.1 and tc0.2, respectively, −7.02 and −6.81, suggests both measures displayed similar sensitivity to workpiece hardness over the range from HB 418 to 397. For the other performance measures in Table 6, the effect of the workpiece hardness suggested only a weak influence. The effect of the lower bar hardness on VBzmax for the SS1 group is visualised in Figure 8b. The red arrows identify bar3 with the lowest hardness, HB397, which showed the lowest wear rate from stages 3 to 7. It was, therefore, decided to discount the bar3 results when comparing the performance of the four CF groups to avoid biasing in the analysis that follows. Because five repeat tests were conducted for the SS1 group, relinquishing one test result still leaves four results to perform the statistical analysis.
It should be mentioned the reduction in the hardness of the bar from the near-surface to the centre was of the same order as the difference in hardness measured across all the bar stock. But since the same bar start diameter was used in the method in this paper to test each CF by turning the bar down in multiple passes, the effect should be mitigated. On the other hand, if the end of one bar was going to service different CF tests, then the effect must be considered.

3.4. Comparing Selected Performance Measures

Discounting the result of bar 3, Figure 9 compares the results of the four CF groups using some of the performance measures in Table 6. The red dots identify the average result for each CF group, and the maxima and minima values are also shown. Ignoring the variability initially, in Figure 9a, the average cut time to tc0.1 suggests both the BIO1 (295 s) and BIO2 (278 s) showed slightly improved tool life than SS1 (256 s) and SS2 (265 s). Similarly, in Figure 9b, the radial cutting force Fr67 displayed the lowest average for BIO2 (104 N), whilst SS1 (109 N) and BIO1 (109 N) showed the same average, and SS2 (112 N), the highest average.
Although counterintuitive, a low Ra can be a relative indicator of poor machinability due to higher tool wear and cause reduced surface integrity. The average for Ra0.1 was the highest for BIO1 (2.2 µm), whilst in Figure 9d, the average for Ra0.2 was the highest for BIO2 (1.1 µm).
When considering the variability and applying statistics in Figure 9a–d, and using a significance level (α) = 0.05 and one-way ANOVA to test the hypothesis, it was confirmed there was no significant statistical difference in the performance averages across the four CF groups because the probability (p) was greater than 0.05. The exception was Ra0.2, with BIO2 displaying a significant difference with p = 0.038, and when hypothesis testing was applied across the other three CF groups, then p = 0.364. A larger sample size would increase the sensitivity to detect differences between the CFs, but the difference in most cases was too small to justify the higher cost of testing.
It should be noted that a softer Inconel 718 bar stock was used in [24], and the maximum flank wear was found to be insensitive to workpiece hardness in the narrow range from HB 339 to 345. Similarly, in this study, with the softer bar3 (HB397) excluded, the flank wear did not show sensitivity on bar hardness in the reduced hardness range from HB 410 to 418. Using the softer Inconel 718 bar in [24], the average cut time to tc0.1 for the bio-ester CF diluted in the emulsion at a higher concentration (13%) was 482 s, compared to 295 and 278 s for the BIO1 and BIO2 CFs in this paper that used a leaner concentration (6.5%) and harder bar. In general, when comparing the performance of CFs, the hardness range of the workpieces should be contained to HB 8 for the workpieces in the batch to avoid biasing.

3.5. Chip Analysis

Chip samples were collected from each of the CF turning tests at stages 1, 3, and 6. Appendix A shows one chip sample collected at stages 1, 3, and 6, which was typical of each CF turning test. It can be observed all the chips produced were continuous and showed a similar form at each stage, but their characteristics changed over the three stages. Figure 10 shows the chip forms at stages 1, 3, and 6 superimposed on the flank wear results for all the CF turning test results. At stage 1, they were helical chips according to ISO 3685-1993 (E) [42], whilst at stage 3, they had developed a more snarled-like form, and finally, chip entanglement at stage 6. Although short chip forms are more desirable to reduce the tool wear rate, stage 1 presented the more ideal continuous chip formed over the seven stages. At stage 1, the flank wear range from minimum to maximum was 33 to 47 µm. At stage 3, the flank wear range was from 52 to 136 μm, which extends below and above the flank wear limit of VBz0.1. The loss of the helical chip form occurred before stage 3 and can be attributed to a particular tool wear mode that will be discussed. At stage 6, the snarled and entangled chip forms were present at the lower end of the flank wear range of 158 um, which is below the flank wear limit VBz0.2.
When comparing the chip forms from each CF turning test in this paper, the results suggest there was no beneficial effect of one CF over another.

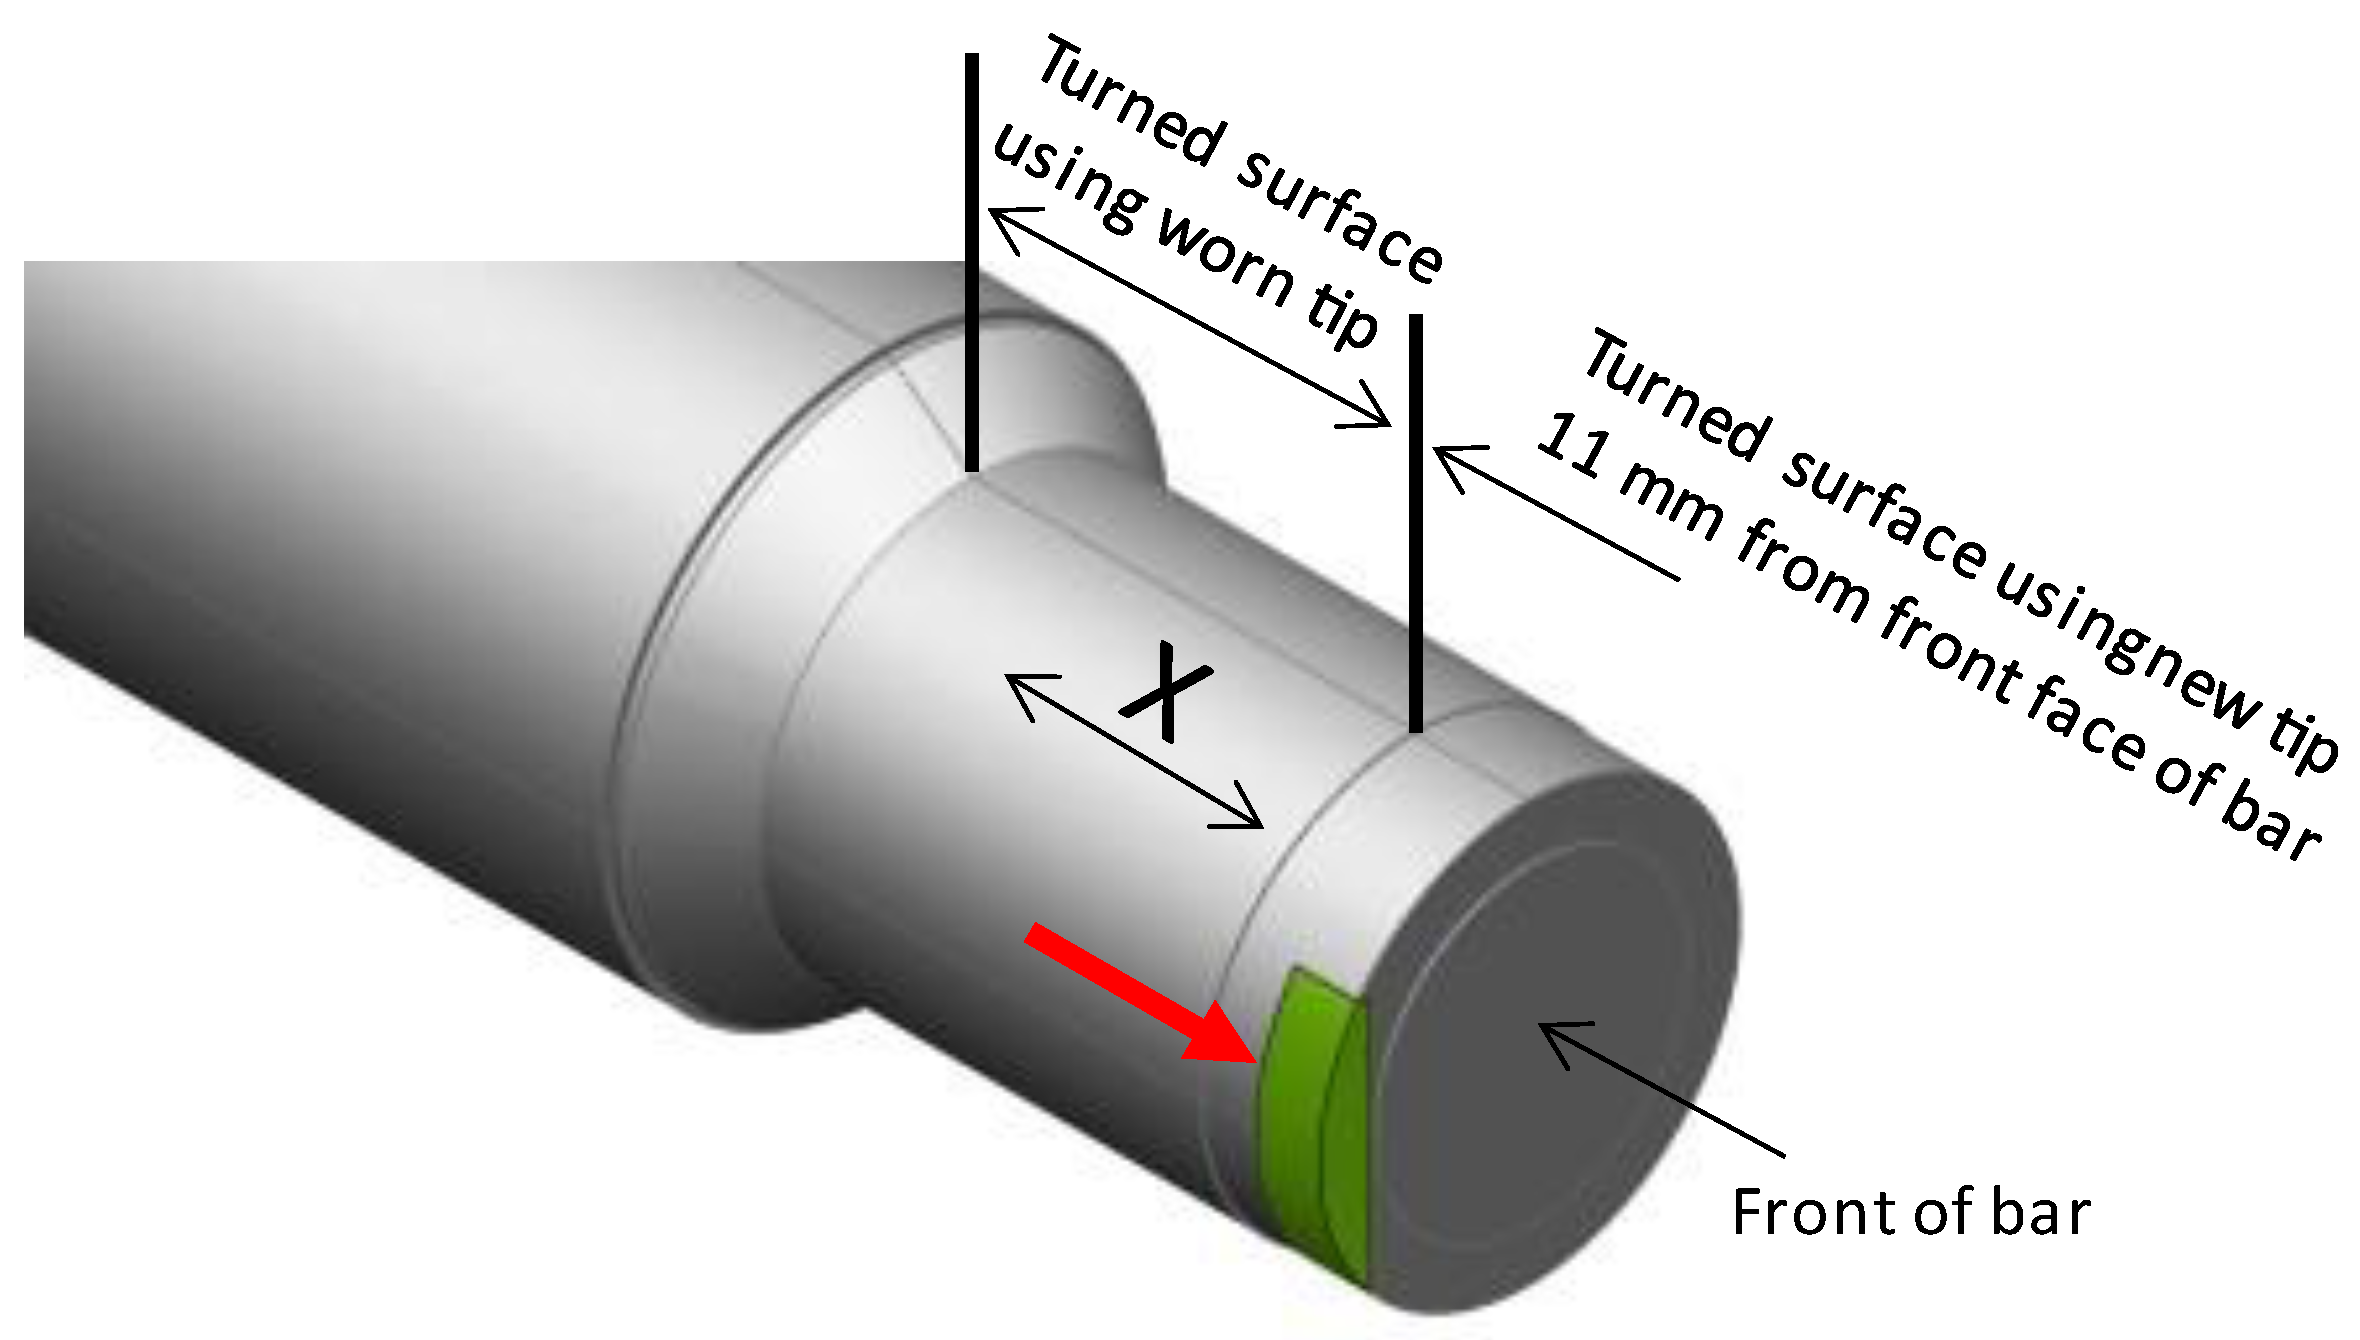
3.6. Comparing CF Turning Test Results Conducted on the Same Bar Workpiece

CF turning tests were conducted using SS1 at one end of bar1 and using SS2 at the other end of the same bar, and in the same way, SS1 and SS2 were both tested at either end of the same bar2. The tc0.1 results for SS1 and SS2 tested on bar1 and bar2 are presented in Figure 11. First, it is to be noted the difference in hardness between bar1 and bar2 was very low with respective values of HB418 and HB415.
For bar1, the difference in tc0.1 for SS1 and SS2 was 28 s, with SS1 exhibiting the greater value. It is interesting that for bar2, the difference in tc0.1 between SS1 and SS2 was much lower at 5 s in comparison to bar1. Because the hardness of bar2 was fractionally lower than bar1, it might explain the slightly higher tc0.1 results for both SS1 and SS2. Furthermore, it was noted the neat CF concentration of SS2 used on bar2 was slightly higher at 6.6% compared to 6.4% for SS1. This small difference might explain the convergence of SS1 and SS2 wear results on bar2. Based on these two sets of results, SS1 enabled the increase in cut time to reach VBz0.1 over SS2. Although these findings are limited to just two CF turning tests on two bars it may suggest there is sensitivity to small changes in workpiece hardness and the neat CF concentration in the diluted emulsion. It should be noted that the practical limit of precision of the refractometer instrument used to measure the CF concentration with the Brix scale was ±0.1 of the target 6.5% concentration, which was achieved in the preparation of every CF turning test.

3.7. Surface and Subsurface Integrity

In the case of the worn tool that preceded the final finish turn, the variance in VBzmax over all the CF turning tests was between 225 to 271 µm, which was significantly beyond the limit of 200 µm. For this reason, a comparative assessment of the surface and subsurface integrity of the workpieces using the worn tool was abandoned. Instead, only the workpiece surfaces using the new unworn tool as a final finish turn for each CF were examined. The decision to abandon the comparative assessment of the workpiece surfaces using the worn tool was also taken in view of other tool wear modes that developed with a severity not anticipated, and this is discussed in the next section.
Figure 12 presents the machined surfaces of the workpiece using the new unworn tool at 6 mm from the end of the bar in which the feed marks are clearly visible. An image was taken at three different positions on each workpiece, equally spaced at 120 degrees. All four workpiece surfaces for the four different CFs showed well-defined uniform grooves without smearing. Other surface anomalies, such as laps, and pick-up from redeposited material, were not observed for all four CFs at the magnification level used.
Images of the workpiece subsurface for the final finish turn using the unworn tool with the arrow A side (in Figure 4) presented for examination are shown in Figure 13b–d. One sample was obtained this way for each CF group. The images suggest the workpiece surfaces of the four CFs were all evenly cut, showing no waviness in the main cutting (Z) direction. Neither were the surface and subsurface anomalies such as drag, white layer, and plucking observed at the magnification level used, which were identified in [39] as features of interest. The subsurface plastic deformation in the images at the positions shown by the white arrows was between 27 μm for SS2 and 33 μm for BIO2. Overall, it was concluded the subsurface plastic distortion was similar for all CFs at the magnification level used to produce the images. To be more precise, a higher magnification would be needed, and an etchant used that could reveal the plastic flow lines.
Although it has been suggested that the machining process be terminated so that VBzmax is closer to the limit of 200 µm, there are a few options that may be considered. One way would be to increase the number of stages between 5 and 7 to suspend the machining to measure VBzmax. Another possibility is to use the preceding flank wear results from stages 1 to 5 that were below 200 µm to determine a trend by suitable curve fit. Then, use the fitted curve to predict the cut time to reach the 200-µm maximum flank wear limit and terminate the turning test when the cut pass on the current diameter is completed. It is suggested a vision system in the CNC machine to measure VBzmax could improve efficiency, rather than having to remove the tip, take it to the microscope, and then return it to the tool holder. This way, the number of stages to suspend the machining to measure flank wear can be increased.

3.8. Tool Wear

The top view of the tool nose that had not been used is shown in Figure 14a. The leading edge (LE), trailing edge (TE), and feed direction (X) are identified. Figure 14b–d shows the top and front view of used tools for SS1, tested on bar3 and bar4. These results were typical of all the CFs tested. Figure 14b was after a 4.7 s cut time on bar4, whilst Figure 14c,d were on completion of stage 7, respectively, on bar3 and bar4. Comparing Figure 14a,b, significant BUE occurred after a 4.7 s cut time, but the chip form remained helical at the end of the 67 s cut time to complete stage 1, as shown in Figure 10. The front of the tool nose did not show any visible flank wear at the 4.7 s cut time. The initial trend for VBzmax in Figure 7a showed a steady increase from stages 1 to 2. Before completing stage 3, the chip forms for all the CFs tested had changed from helical to snarled-like in Figure 10, and correspondingly, the growth of VBzmax in Figure 7a was seen to accelerate at stage 3. Figure 14c,d show significant wear on the flank edge, with VBzmax reaching 0.23 mm for bar3 and 0.26 mm for bar4. The corresponding depth of rake face wear between the LE and TE at the centre of the nose was 60 µm in Figure 14c and was higher at 100 µm in Figure 14d. Bar4 was harder than bar3, with respective values of HB417 and HB397, which explains the higher wear rate of the tool in Figure 14d. Both rake face wear and flank wear were measured from the same reference, which was the top edge of the tool, despite the loss of the flank wear landing in contact with the bar workpiece with increasing rake face wear. The rate of rake face wear in Figure 14c,d was significant, and the results in Figure 7a suggested the rake face wear accelerated at a faster rate than the flank wear beyond stage 5 because the growth of VBzmax began to stabilise. The BUE, which developed early in stage 1, diminished the cooling and lubricating effectiveness of the CF between the rake face and chip. Thus, as temperature increased at the tool and chip contact zone, the diffusion rate of atoms increased, causing a reduction in the tool hardness that accelerated wear on the rake face.
Because of the deep wear on the rake face at stage 7 observed in Figure 14c,d, the change in the chip from helical to snarled-like before completing stage 3 could be due to the rapid loss of the tip edge shown in Figure 14a. The premature loss of the tip edge would explain the change in chip form that occurred at low flank wear (52 μm), falling well short of the lower flank wear limit, VBz0.1. For the bar4 workpiece with the higher hardness, a fracture was observed in Figure 14d at A with the complete loss of the tip edge radius along the TE of the tool, which was not in direct contact with either the workpiece or chip. It is speculated that this damage could be attributed to either microcracks that formed along the tip edge or the rapid growth of crater wear, which, on approaching the cutting edge, weakened the tip and caused the fracture [48].
In Figure 1, the uncut chip thickness was practically zero on approaching the TE and was a maximum on approaching the LE. As the uncut chip thickness reduces from the LE to the TE, it will lead to more rubbing and ploughing, which causes higher flank wear. Figure 14c,d suggests this to be the case because VBzmax was closer to the TE. On the other hand, at the LE, where the uncut chip thickness was a maximum at the workpiece surface, the high plastic work undertaken in shearing the chip, combined with friction between the chip and rake face, increased the temperature and caused crater wear. Figure 14c,d suggests this to be the case because the depth of rake face wear was slightly higher at the LE than at the TE. A deep notch wear groove that can develop on the flank edge at the LE was not observed in any of the CF tests.
The effect of suspending the machining at each stage to measure flank wear may accelerate tool wear because the tooltip with BUE cools to room temperature before resuming the machining process and this event was repeated six times. Because the same process was used for each CF test on similar workpiece materials, the effect is thought to be mitigated.

4. Conclusions

In finish turning hard Inconel 718 bars, using the machining parameters (Vc = 90 m/min, f = 0.2 mm/rev, ap = 0.25 mm), and a small tool nose radius (0.4 mm), this study has shown statistically, there was no significant difference in the performance among the two mineral-oil- and two bio-ester-based CFs for the measures used. The exception was the measure Ra for one of the bio-ester CFs. However, it is possible that a real difference may have been masked by the premature onset of wear on the tool rake face before the flank wear limit of 0.1 mm was reached, causing a change in the chip form and becoming the dominant wear mode. For the bar workpiece with the higher hardness, a fracture was observed with the complete loss of the tip edge along the trailing edge of the tool, which was not in direct contact with either the workpiece or chip. Notch wear was not observed because all tests were terminated before reaching the higher flank wear limit of 0.3 mm.
The cut time to reach the flank wear limits 0.1 and 0.2 mm was shown to be sensitive to the bar hardness when the batch variation was HB 21. The sensitivity of the performance measures to bar hardness was practically eliminated when the batch variation was reduced to HB 8. The reduction in the hardness of the bar from the near-surface to the centre was of the same order as the difference in the batch hardness variation (HB 21). But in this method, the same start diameter to test each CF by turning the bar down in multiple passes was used, so the effect of the change in bar hardness from the near-surface to the centre was mitigated. On the other hand, if the end of one bar was going to service different CF turning tests, then the effect must be considered.
The findings in this paper suggested there may be sensitivity to the neat CF concentration in the emulsion diluted at 6.5%, although it is emphasised that the maximum variation was only within the precision limit of the refractometer measuring instrument. In a previous study [24] that used a softer Inconel 718 bar and a bio-ester CF diluted with a much higher concentration in the emulsion at 13%, the average cut time to reach the lower flank wear limit of 0.1 mm was nearly twice that achieved in this paper.
Because the rake face wear started to accelerate at a faster rate than the flank wear, the flank land that was in contact with the bar workpiece started to reduce, resulting in the apparent stabilisation of Fr, Ra, and VBzmax with cut time. If the desire is to lessen the rake face wear, then the temperature must be reduced, and this means reducing the cutting speed. Other ways to reduce the rate of rake face wear could be to use a slightly softer Inconel 718 workpiece as in [24] or to apply the CF through the tool at a much higher flow rate to reduce tool temperature.

Author Contributions

Conceptualization, P.W., A.M. and F.B.; methodology, P.W., A.M. and W.C.; validation, A.M., M.H.M., U.G. and J.D.-Á.; formal analysis, A.M., P.W. and F.B.; investigation, W.C., P.W. and M.P.; resources, M.P., U.G. and Y.L.; data curation, S.H., M.P. and U.G.; writing—original draft preparation, P.W. and F.B.; writing—review and editing, A.M., M.H.M., J.D.-Á., U.G. and Y.L.; visualization, J.D.-Á. and Y.L.; supervision, A.M.; project administration, P.W. All authors have read and agreed to the published version of the manuscript.

Funding

The project was funded by Rolls-Royce Plc and supported by suppliers of MWF products. The project was undertaken within the IISE at the University of Derby under the project code 19289.

Data Availability Statement

The datasets presented in this article are not readily available because the data are part of an ongoing study. Requests to access the datasets should be directed to the corresponding author.

Conflicts of Interest

The authors declare that this study received funding from Rolls-Royce Plc. The funder had the following involvement with the study: statement of requirements for the project, and technical management of its delivery to the schedule agreed.

Abbreviations

ALUncut chip arclength of contact (mm)
BUEBuilt-up edge
CEChip entanglement
CFCutting fluid
CSAUncut chip cross-section area (mm2)
CTMean uncut chip thickness (mm)
apDepth of cut (mm)
fFeed rate per rev (mm/rev)
FfFeed force on X-axis (N)
FcMain cutting force on Z-axis (N)
FrRadial force on Y-axis (N)
MQLMinimum quantity lubricant
MWFMetalworking fluid
(n)Stage number to measure flank wear
RaArithmetic mean surface roughness
rnTool nose radius (mm)
tcCut time (s)
VcCutting speed (m/min)
VBzTool flank wear
VBz0.1Flank wear limit 0.1 mm
VBz0.2Flank wear limit 0.2 mm
VBzmaxMaximum flank wear measured on tool nose
X, Y, ZAxes of coordinate system

Appendix A

Lubricants 12 00164 i001

References

  1. Brinksmeier, E.; Meyer, D.; Huesmann-Cordes, A.G.; Herrmann, C. Metalworking fluids-Mechanisms and performance. CIRP Ann. Manuf. Technol. 2015, 64, 605–628. [Google Scholar] [CrossRef]
  2. Seidel, B.; Meyer, D. Investigation of the influence of aging on the lubricity of metalworking fluids by means of design of experiment. Lubricants 2019, 7, 94. [Google Scholar] [CrossRef]
  3. Seidel, B.; Meyer, D. Influence of artificial aging on the lubricating ability of water miscible metalworking fluids. Prod. Eng. 2019, 13, 425–435. [Google Scholar] [CrossRef]
  4. Grzesik, W.; Niesłony, P.; Habrat, W.; Sieniawski, J.; Laskowski, P. Investigation of tool wear in the turning of Inconel 718 superalloy in terms of process performance and productivity enhancement. Tribol. Int. 2018, 118, 337–346. [Google Scholar] [CrossRef]
  5. Alagan, N.T.; Zeman, P.; Mara, V.; Beno, T.; Wretland, A. High-pressure flank cooling and chip morphology in turning Alloy 718. CIRP J. Manuf. Sci. Technol. 2021, 35, 659–674. [Google Scholar] [CrossRef]
  6. Saleem, M.Q.; Mehmood, A. Eco-friendly precision turning of superalloy Inconel 718 using MQL based vegetable oils: Tool wear and surface integrity evaluation. J. Manuf. Process 2022, 73, 112–127. [Google Scholar] [CrossRef]
  7. Szablewski, P. Evaluation of the topography and load capacity of cylindrical surfaces shaped in the process of finish turning of the Inconel 718 alloy. Measurement 2023, 223, 113749. [Google Scholar] [CrossRef]
  8. Kaynak, Y.; Tascioglu, E. Finish machining-induced surface roughness, microhardness and XRD analysis of selective laser melted Inconel 718 alloy. Procedia CIRP 2018, 71, 500–504. [Google Scholar] [CrossRef]
  9. Mouritz, A.P. Introduction to Aerospace Materials; Illustrated; Woodhead Publishing Limited: Shaston, UK, 2012. [Google Scholar]
  10. Liu, C.; Wan, M.; Zhang, W.; Yang, Y. Chip Formation Mechanism of Inconel 718: A Review of Models and Approaches. Chin. J. Mech. Eng. 2021, 34, 34. [Google Scholar] [CrossRef]
  11. Metalworking Fluids-Worldwide Market Outlook to 2025: Anticipated to Reach 3655 Kilotons in Terms of Volume, 25 April 2019. Available online: https://www.globenewswire.com/news-release/2019/04/25/1809472/0/en/Metalworking-Fluids-Worldwide-Market-Outlook-to-2025-Anticipated-to-Reach-3-655-Kilotons-in-Terms-of-Volume.html (accessed on 18 September 2023).
  12. Road Fuel Consumption and the UK Motor Vehicle Fleet (BEIS). Available online: https://assets.publishing.service.gov.uk/media/5d149e0ae5274a0662da52b2/Road_fuel_consumption_and_the_UK_motor_vehicle_fleet.pdf (accessed on 18 September 2023).
  13. Dieter, G.E., Jr. Mechanical Metallurgy, 3rd ed.; McGraw-Hill: New York, NY, USA, 1986. [Google Scholar]
  14. Belluco, W.; De Chiffre, L. Surface Integrity and Part Accuracy in Reaming and Tapping Stainless Steel with New Vegetable Based Cutting Oils. Tribol. Int. 2002, 35, 865–870. [Google Scholar] [CrossRef]
  15. Abdalla, H.S.; Baines, W.; McIntyre, G.; Slade, C. Development of novel sustainable neat-oil metal working fluids for stainless steel and titanium alloy machining. Part 1. Formulation development. Int. J. Adv. Manuf. Technol. 2007, 34, 21–33. [Google Scholar] [CrossRef]
  16. Lawal, S.A.; Choudhury, I.A.; Nukman, Y. Application of vegetable oil-based metalworking fluids in machining ferrous metals—A review. Int. J. Mach. Tools Manuf. 2012, 52, 1–12. [Google Scholar] [CrossRef]
  17. Wood, P.; Boud, F.; Carter, W.; Varasteh, H.; Gunputh, U.; Pawlik, M.; Clementson, J.; Lu, Y.; Hossain, S.; Broderick, M.; et al. On the Lubricity and Comparative Life Cycle of Biobased Synthetic and Mineral Oil Emulsions in Machining Titanium Ti-6Al-4V at Low Cutting Speed. J. Manuf. Mater. Process. 2022, 6, 154. [Google Scholar] [CrossRef]
  18. Debnath, S.; Reddy, M.M.; Yi, Q.S. Environmental friendly cutting fluids and cooling techniques in machining: A review. J. Clean. Prod. 2014, 83, 33–47. [Google Scholar] [CrossRef]
  19. Our Approach to Decarbonisation|Rolls-Royce. Available online: https://www.rolls-royce.com/sustainability/our-approach-to-decarbonisation.aspx (accessed on 31 December 2023).
  20. Gong, L.; Bertolini, R.; Ghiotti, A.; He, N.; Bruschi, S. Sustainable Turning of Inconel 718 Nickel Alloy Using MQL Strategy Based on Graphene Nanofluids. Int. J. Adv. Manuf. Technol. 2020, 108, 3159–3174. [Google Scholar] [CrossRef]
  21. Teo, J.J.; Olugu, E.U.; Yeap, S.P.; Abdelrhman, A.M.; Aja, O.C. Turning of Inconel 718 using Nano-Particle based vegetable oils. Mater. Today Proc. 2020, 48, 866–870. [Google Scholar] [CrossRef]
  22. Sen, B.; Mia, M.; Mandal, U.K.; Mondal, S.P. Synergistic effect of silica and pure palm oil on the machining performances of Inconel 690: A study for promoting minimum quantity nano doped-green lubricants. J. Clean. Prod. 2020, 258, 120755. [Google Scholar] [CrossRef]
  23. Kazeem, R.A.; Fadare, D.A.; Ikumapayi, O.M.; Adediran, A.A.; Aliyu, S.J.; Akinlabi, S.A.; Jen, T.C.; Akinlabi, E.T. Advances in the Application of Vegetable-Oil-Based Cutting Fluids to Sustainable Machining Operations—A Review. Lubricants 2022, 10, 69. [Google Scholar] [CrossRef]
  24. Wood, P.; Mantle, A.; Boud, F.; Carter, W.; Gunputh, U.; Pawlik, M.; Lu, Y.; Díaz-Álvarez, J.; Miguélez Garrido, M.H. Long Sump Life Effects of a Naturally Aged Bio-Ester Oil Emulsion on Tool Wear in Finish Turning a Ni-Based Superalloy. Metals 2023, 13, 1610. [Google Scholar] [CrossRef]
  25. REACH and Safety Data Sheets UK REACH Competent Authority Information Leaflet Number 13-Safety Data Sheets. 2016. Available online: http://echa.europa.eu/web/guest/alternative-chemical-name-in-mixtures (accessed on 17 September 2023).
  26. Roy, S.; Kumar, R.; Panda, A.; Das, R.K. A Brief Review on Machining of Inconel 718. Mater. Today Proc. 2018, 5, 18664–18673. [Google Scholar]
  27. Kaya, E.; Akyüz, B. Effects of cutting parameters on machinability characteristics of Ni-based superalloys: A review. Open Eng. 2017, 7, 330–342. [Google Scholar] [CrossRef]
  28. Pawade, R.S.; Joshi, S.S. Mechanism of chip formation in high-speed turning of inconel 718. Mach. Sci. Technol. 2011, 15, 132–152. [Google Scholar] [CrossRef]
  29. Zheng, G.; Zhao, J.; Song, X.; Cao, Q.; Li, Y. Ultra high speed turning of inconel 718 with sialon ceramic tools. Adv. Mater. Res. 2010, 126, 653–657. [Google Scholar] [CrossRef]
  30. Wood, P.; Díaz-Álvarez, J.; Rusinek, A.; Gunputh, U.; Bahi, S.; Díaz-Álvarez, A.; Miguélez, M.H.; Lu, Y.; Platek, P.; Sienkiewicz, J. Microstructure Effects on the Machinability of AM-Produced Superalloys. Crystals 2023, 13, 1190. [Google Scholar] [CrossRef]
  31. Sivalingam, V.; Zhao, Y.; Thulasiram, R.; Sun, J.; Nagamalai, T. Machining Behaviour, surface integrity and tool wear analysis in environment friendly turning of Inconel 718 alloy. Measurement 2021, 174, 109028. [Google Scholar] [CrossRef]
  32. Rakesh, M.; Datta, S.; Mahapatra, S.S. Effects of Depth of Cut during Machining of Inconel 718 using Uncoated WC Tool. Mater. Today Proc. 2019, 18, 3667–3675. [Google Scholar] [CrossRef]
  33. Thrinadh, J.; Mohapatra, A.; Datta, S.; Masanta, M. Machining behavior of Inconel 718 superalloy: Effects of cutting speed and depth of cut. Mater. Today Proc. 2019, 26, 200–208. [Google Scholar] [CrossRef]
  34. Kaynak, Y. Evaluation of machining performance in cryogenic machining of Inconel 718 and comparison with dry and MQL machining. Int. J. Adv. Manuf. Technol. 2014, 72, 919–933. [Google Scholar] [CrossRef]
  35. Criado, V.; Díaz-Álvarez, J.; Cantero, J.L.; Miguélez, M.H. Study of the performance of PCBN and carbide tools in finishing machining of Inconel 718 with cutting fluid at conventional pressures. Procedia CIRP 2018, 77, 634–637. [Google Scholar] [CrossRef]
  36. Cantero, J.L.; Díaz-Álvarez, J.; Miguélez, M.H.; Marín, N.C. Analysis of tool wear patterns in finishing turning of Inconel 718. Wear 2013, 297, 885–894. [Google Scholar] [CrossRef]
  37. Sharman, A.R.C.; Hughes, J.I.; Ridgway, K. An analysis of the residual stresses generated in Inconel 718TM when turning. J. Mater. Process. Technol. 2006, 173, 359–367. [Google Scholar] [CrossRef]
  38. Madariaga, A.; Kortabarria, A.; Hormaetxe, E.; Garay, A.; Arrazola, P.J. Influence of Tool Wear on Residual Stresses When Turning Inconel 718. Procedia CIRP 2016, 45, 267–270. [Google Scholar] [CrossRef]
  39. Axinte, D.A.; Andrews, P.; Li, W.; Gindy, N.; Withers, P.J. Turning of advanced Ni based alloys obtained via powder metallurgy route. CIRP Ann. Manuf. Technol. 2006, 55, 117–120. [Google Scholar] [CrossRef]
  40. Hood, R.; Soo, S.L.; Aspinwall, D.K.; Mantle, A.L. Tool life and workpiece surface integrity when turning an RR1000 nickel-based superalloy. Int. J. Adv. Manuf. Technol. 2018, 98, 2461–2468. [Google Scholar] [CrossRef]
  41. Soo, S.L.; Hood, R.; Aspinwall, D.K.; Voice, W.E.; Sage, C. Machinability and surface integrity of RR1000 nickel based superalloy. CIRP Ann. Manuf. Technol. 2011, 60, 89–92. [Google Scholar] [CrossRef]
  42. ISO 3685:1993; Tool-Life Testing with Single-Point Turning Tools. ISO: Geneva, Switzerland, 1993. Available online: https://standards.iteh.ai/catalog/standards/sist/0383ad8d-9a6e-4772-ba62- (accessed on 1 November 2023).
  43. Díaz-Álvarez, J.; Cantero, J.L.; Miguélez, H.; Soldani, X. Numerical analysis of thermomechanical phenomena influencing tool wear in finishing turning of Inconel 718. Int. J. Mech. Sci. 2014, 82, 161–169. [Google Scholar] [CrossRef]
  44. Darshan, C.; Jain, S.; Dogra, M.; Gupta, M.K.; Mia, M.; Haque, R. Influence of dry and solid lubricant-assisted MQL cooling conditions on the machinability of Inconel 718 alloy with textured tool. Int. J. Adv. Manuf. Technol. 2019, 105, 1835–1849. [Google Scholar] [CrossRef]
  45. Yılmaz, B.; Karabulut, Ş.; Güllü, A. A review of the chip breaking methods for continuous chips in turning. J. Manuf. Process. 2020, 49, 50–69. [Google Scholar] [CrossRef]
  46. Ostrowicki, N.; Kaim, A.; Gross, D.; Hanenkamp, N. Effect of various cooling lubricant strategies on turning Inconel 718 with different cutting materials. Procedia CIRP 2020, 101, 350–353. [Google Scholar] [CrossRef]
  47. Kramer, B.M.; Suh, N.P. Tool Wear by Solution: A Quantitative Unerstanding. Trans. ASME J. Eng. Ind. 1980, 102, 303–309. [Google Scholar] [CrossRef]
  48. Yusuf, A. Manufacturing Automation, 2nd ed.; Cambridge University Press: Cambridge, UK, 2012; Available online: https://www.cambridge.org/ (accessed on 6 June 2023).
  49. Pusavec, F.; Hamdi, H.; Kopac, J.; Jawahir, I.S. Surface integrity in cryogenic machining of nickel based alloy-Inconel 718. J. Mater. Process. Technol. 2011, 211, 773–783. [Google Scholar] [CrossRef]
  50. Yazid, M.Z.A.; Ibrahim, G.A.; Said, A.Y.M.; CheHaron, C.H.; Ghani, J.A. Surface integrity of Inconel 718 when finish turning with PVD coated carbide tool under MQL. Procedia Eng. 2011, 19, 396–401. [Google Scholar] [CrossRef]
  51. Mital, A.; Mehta, M. Surface finish prediction models for fine turning. Int. J. Prod. Res. 1988, 26, 1861–1876. [Google Scholar] [CrossRef]
  52. Derani, M.N.; Mani; Ratnam, M. The use of tool flank wear and average roughness in assessing effectiveness of vegetable oils as cutting fluids during turning-a critical review. Int. J. Adv. Manuf. Technol. 2021, 112, 1841–1871. [Google Scholar] [CrossRef]
  53. Li, H.; Lai, X.; Li, C.; Feng, J.; Ni, J. Modelling and experimental analysis of the effects of tool wear, minimum chip thickness and micro tool geometry on the surface roughness in micro-end-milling. J. Micromech. Microeng. 2008, 18, 025006. [Google Scholar] [CrossRef]
  54. Boothroyd, G. Fundamentals of Machining and Machine Tools; McGraw-Hill Book Co.: New York, NY, USA, 1975. [Google Scholar]
  55. Parida, A.K.; Maity, K. Effect of nose radius on forces, and process parameters in hot machining of Inconel 718 using finite element analysis. Eng. Sci. Technol. Int. J. 2017, 20, 687–693. [Google Scholar] [CrossRef]
  56. Cook, N.H. Manufacturing Analysis; Addison-Wesley: London, UK, 1966. [Google Scholar]
  57. ASTM E23-18; Standard Test Methods for Notched Bar Impact Testing of Metallic Materials. ASTM: Pennsylvania, PA, USA, 2018.
  58. ASTM E18-19; Standard Test Methods for Rockwell Hardness of Metallic Materials. ASTM: Pennsylvania, PA, USA, 2019.
  59. EN ISO 6506-1:2005; Metallic materials—Brinell hardness test—Part 1: Test method. ISO: Geneva, Switzerland, 2005.
  60. ASTM E2523-13; Standard Terminology for Metalworking Fluids and Operations. ASTM: Pennsylvania, PA, USA, 2018.
  61. ASTM D3321-19; Standard Test Method for Use of the Refractometer for Field Test Determination of the Freezing Point of Aqueous Engine Coolants. ASTM: Pennsylvania, PA, USA, 2023.
Figure 1. Theoretical uncut chip geometry.
Lubricants 12 00164 g001
Figure 2. Location of hardness measurements on each bar identified by an amber-colour circle.
Lubricants 12 00164 g002
Figure 3. Bar after completing one turning test with the coordinate system used throughout this paper.
Lubricants 12 00164 g003
Figure 4. Location of the small piece removed from one bar from each group of CFs.
Lubricants 12 00164 g004
Figure 5. Evolution of flank wear with cut time for all CF turning tests.
Lubricants 12 00164 g005
Figure 6. Time-averaged cutting forces at each stage in the tangential (Fc), feed (Ff), and radial (Fr) directions and flank wear with cut time.
Lubricants 12 00164 g006
Figure 7. VBzmax and Ra from the first trial of each CF group with fitted curve (a) and method to calculate cut time and Ra at flank wear limits VBz0.1 and VBz0.2 mm using the first turning trial of the SS1 group (b).
Lubricants 12 00164 g007
Figure 8. Effect of workpiece hardness on cut time tc0.1 and tc0.2 for all CFs tested (a) and VBzmax for the SS1 group (b).
Lubricants 12 00164 g008
Figure 9. Comparing CF groups using the performance measures tc0.1 (a), Fr67 (b), Ra0.1 (c), and Ra0.2 (d).
Lubricants 12 00164 g009
Figure 10. Typical chip forms obtained at stages 1, 3, and 6.
Lubricants 12 00164 g010
Figure 11. Effect of bar hardness and neat CF concentrate (%) diluted with water on cut time to reach VBz0.1.
Lubricants 12 00164 g011
Figure 12. Machined surfaces of each CF at 50× magnification SS1 (a), SS2 (b), BIO1 (c), and BIO2 (d).
Lubricants 12 00164 g012
Figure 13. Microstructure images of SS1 (a), SS2 (b), BIO1 (c), and BIO2 (d).
Lubricants 12 00164 g013
Figure 14. Top view of tool nose in unused condition (a), top and front views of tool nose after 4.7 s cut time for the SS1 CF (b), at 689 s cut time (stage 7) on bar3 for the SS1 CF (c), at 549 s cut time (stage 7) on bar4 for the SS1 CF (d).
Lubricants 12 00164 g014
Table 1. Theoretical uncut chip geometry for two different tool nose radii.
rn
mm
Arclength of Contact
(AL)
mm
Uncut Chip Cross Section Area (CSA)
mm2
Mean Uncut Chip Thickness (CT)
mm
1.20.8890.04970.559
0.40.5670.04920.868
Table 2. Mechanical properties of the workpiece (Inconel 718) at room temperature from the mill certificate supplied with the bar workpieces.
StandardsYield Strength
(Mpa)
Tensile Strength
(Mpa)
Elongation
(%)
Reduction in Area
(%)
Brinell Hardness
862–1000≥1034≥20≥35314–360
ASTM E23-18 (2018) [57]88912203147
ASTM E18-19 (2019) [58] near surface 360
ASTM E18-19 (2019) [58] centre 341
Table 3. Chemical composition of the Inconel 718 workpiece from the mill certificate supplied with the bar workpieces.
ElementCSiMnCrMoFeAlCoCuTiAlNiNb
Wt %0.0140.080.0917.672.9518.10.530.210.060.970.4954.44.92
Table 4. Abbreviations used for each CF and number of repeat tests.
Abbreviation of
CF Group
Number of
Tests
Oil Type in Neat ConcentrateComments
SS15Mineral-oil > 30%Free from boron
SS23Mineral-oil < 25%Free from boron, formaldehyde, chlorine, secondary amine, and phenol
BIO13Vegetable ester-based,
Mineral-oil-free
Formulated from renewables and certified by the USDA BioPreferred Programme
BIO23Vegetable ester-based,
Mineral-oil-free
Formulated from renewables and free of chlorine, boron, formaldehyde, and zinc
Table 5. Details of seven stages to measure flank wear in turning down each workpiece from a 52.5 to 41 mm diameter.
Stage Number for Measurement1234567
Accumulated cut time (s)66.6161253339421499645
Number of tool passes on feed X-axis per stage2333336
Cut length on feed X-axis per stage (mm)125179170163155147273
Cut length on main cutting Z-axis per stage (m)99.9242380509632749968
Nominal bar diameter at start (mm)52.551.55048.54745.544
Nominal bar diameter at finish (mm)51.55048.54745.54441
Table 6. Results using CF performance measures at the two flank wear limits of interest.
Bar Numbertc0.1
(s)
tc0.2
(s)
Ra0.1
(um)
Ra0.2
(um)
Fr67
(N)
Fr0.1
(N)
Fr0.2
(N)
Concentration
(%)
Hardness
(HB)
SS112755472.440.431101603326.4418
23074752.370.641101843296.4415
34075992.110.6299.91673146.5397
42164302.180.771061643356.4417
52243891.410.591111883186.5410
SS212474541.590.821191773416.5418
23034832.110.651111923326.6415
62443221.790.871061622806.5417
BIO153245271.780.471001993186.6410
72303592.180.971151733326.6414
83305102.671.011111723086.6413
BIO242544511.760.981041642996.6417
72193922.251.181061903166.6414
83614352.311.141031793126.6413
Disclaimer/Publisher’s Note: The statements, opinions and data contained in all publications are solely those of the individual author(s) and contributor(s) and not of MDPI and/or the editor(s). MDPI and/or the editor(s) disclaim responsibility for any injury to people or property resulting from any ideas, methods, instructions or products referred to in the content.

