Article

Numerical Study on the Dynamic Response and Damage Cumulative of Bolt-Supported Cavern under Adjacent Cyclic Explosion

1
School of Civil Engineering, Henan Polytechnic University, Jiaozuo 454000, China
2
Department of Geotechnical Engineering, College of Civil Engineering, Tongji University, Shanghai 200092, China
*
Author to whom correspondence should be addressed.
Buildings 2024, 14(5), 1307; https://doi.org/10.3390/buildings14051307
Submission received: 19 March 2024 / Revised: 29 April 2024 / Accepted: 1 May 2024 / Published: 6 May 2024
(This article belongs to the Section Building Structures)

Abstract

:
Adjacent cyclic explosions significantly impact the stability of underground anchored caverns. Based on the similar model test of the vault explosion of the anchored cavern, the dynamic analysis finite element software ANSYS/LSDYNA(18.0) was used to establish a model of the straight wall side explosion of the underground anchored cavern and conduct a numerical simulation. When the total amount of explosion load is the same, we compared the stress time history curve, displacement time history curve, tunnel wall displacement, and circumferential strain curve of the surrounding rock in the underground anchored cavern (under both a high-level single-side blast and a low-level cyclic side blast). We obtained the dynamic response rules of the surrounding rock. By comparing the damage evolution process of the surrounding rock in the two situations, the damage accumulation law of the surrounding rock was analyzed. At the same time, the axial stress distribution characteristics of underground anchor cavern anchors under the action of cyclic explosion were studied. The findings demonstrate that when the total level of blast load adjacent to the cavern is the same, the displacement and circumferential peak strain of surrounding rock and the axial stress of rock bolt in the high-level single explosion are greater than those in the low-level cyclic explosion. However, compared to a single explosion, the rock mass suffers more damage in the cyclic explosion. This study will provide engineers with information that will assist them with a better understanding of the cumulative damage mechanisms of surrounding rock, as well as the stress characteristics of rock bolts under dynamic loads near the explosion site, which will be used to design underground caves with anti-blast features.

1. Introduction

In many large cities, ground space no longer suffices to support urban development. Since underground projects have the advantages of large space and low resource consumption, more and more shopping malls, rail transit, and warehouses are built underground. These underground projects are commonly used places for people’s activities in peacetime and become important protection projects in wartime. Therefore, underground construction protection is crucial for civil and military fields.
Blasting excavation is often used in underground engineering construction. When the blasting method is used to excavate adjacent engineering, blasting vibration will cause serious damage to underground engineering [1,2]. Researchers have studied underground engineering under nearby explosions extensively in recent decades, according to the monitoring data of ground vibration under blast loading in the field. Nan et al. [3] established a PPV prediction model under blast loading, which was used to study the dynamic response characteristics of gas pipelines and their surrounding soil during tunnel blasting excavation by numerical calculation. At the same time, considering the accumulation of vibration damage, Cao et al. [4] used ultrasonic tests to study the cumulative ultrasonic vibration damage of ordinary rock mass under the action of adjacent explosions. The later excavated tunnel is affected by the cyclic blasting load, and the shared rock damage range is larger than that of the first excavated tunnel. In order to ensure the safety of buried pipelines under blasting from adjacent tunnel excavation, Shi et al. [5] proposed a method for determining the critical vibration velocity of pipelines under adjacent explosion loads. Considering the complexity of the construction environment, Xia et al. [6] researched the impact of blasting load on the destruction and failure of surrounding rock and the lining of nearby existing tunnels. Based on the mechanical calculation software ADINA, Fiamingo, A. et al. [7] comprehensively considered the linear elastic behavior and nonlinear behavior of the building as well as the viscoelastic behavior of the soil and studied the seismic performance of the building and the impact of soil behavior on the response of the earthquake system. Taking Wuhan Metro Line 8 as an example, according to the monitoring data of the blasting and excavation site of the adjacent foundation pit in the field, Jiang et al. [8] developed a mathematical model to predict peak vibration velocity decay. The numerical analysis method was used to evaluate the dynamic response characteristics of blasting and excavation on buried gas pipelines adjacent to foundation pits under different internal pressures. Zhang et al. [9] found that vibration produced by blasting excavation of a subway tunnel is detrimental to the civil air defense project vault, which is prone to failure. However, the majority of the currently conducted research on this topic focuses on a single explosion source, with cyclic explosions being infrequently used. Cyclic explosions are more common in practice. Repeated cyclic explosion disturbances to the same position can easily lead to the extension and expansion of microcracks, degrading their mechanical properties and continuously weakening the material strength [10,11]. Therefore, research on the impact of cyclic explosions on engineering is crucial. Much research [12,13,14] has been conducted on the effects of confining pressure, loading frequency, and lower stress limit on the dynamic response of rock mass under cyclic loading. By studying the damage of jointed basalt rock mass caused by repeated blasting loads in tunnel engineering, Ramulu et al. [15] discovered the damage law of waves of different frequencies under the action of multiple explosions. In addition, Wang, J.T. et al. [16] performed an analysis of circular high-strength, thin-walled steel tube concrete under cyclic loading. Chu et al. [17] studied the cumulative effect of damage on concrete compressive strength and durability, and a blasting vibration safety standard was derived. Considering the impact of blasting on the connection of steel plates, Yim et al. [18] studied the behavior of steel plate shear connections under monotonic and cyclic explosive load through a mechanical model. However, such studies rarely involve the cumulative damage of the surrounding rock.
As an economical and simple active support form, bolt support has been widely used in tunnel, slope, and mine engineering fields. However, due to the serious damage of the bolt under explosive dynamic load [18], The impact of dynamic load on the mechanical characteristics of the bolt has been the subject of substantial study by scholars. Through similarity model tests, Sun et al. [19] found that the peak strain of the bolt at the arch foot of the anchored cavern is significantly higher than that at other parts under blasting load. In addition, Wang, G.Y. et al. [20] conducted a numerical analysis to determine the dynamic response of the bolt under the explosive loads of the concentrated charge. Under blasting loads, Wang, W.J. et al. [21] studied the characteristics of axial stress and shear stress on bolts. In the case of multiple explosion sources in different parts of the cavern, Wang, G. et al. [22] studied the anti-blast performance of the anchored cavern. Meanwhile, Ansell, A. et al. [23] concluded that yield bolts can absorb most of the energy without damage in the process of large deformation tunnel anchoring under dynamic and static loads. Considering that different areas of the anchor are subjected to different forces, Han et al. [24] divided the failure of the anchorage segment into parallel shear failure and shear dilatancy slip failure by analyzing the failure modes of the anchorage segment. Chong et al. [25] investigated the beginning and growth of cracks in resin-coated rock bolt systems; they came to the conclusion that lengthening the bolts would enhance the system’s binding and prevent the bolts and cement mortar from completely degumming. Although the response and failure mechanism of bolts under a single load has been thoroughly explored by scholars, the mechanical behavior of bolts under cyclic load is still less studied.
To date, research on the impact of nearby explosions on subsurface engineering has provided fruitful results. Unfortunately, this type of research puts too much emphasis on the single explosive source, and the surrounding rock’s cumulative damage law, dynamic response under cyclic explosion, and the mechanical properties of the bolt are still less understood. In this paper, the similarity model is used to test the stress propagation law of the vault to verify the rationality of the numerical analysis, and the study examined both the dynamic response and damage accumulation law of the anchor cavern as a result of adjacent cyclic explosions and the dynamic response law of the anchor rod. This paper provides a reference for similar engineering designs under cyclic explosions.

2. Numerical Calculation Model

In the existing similarity model test, a vault explosion is simulated in a cavern with a buried depth of 15 m and a span of 4 m [26]. Based on the similarity model test, the numerical calculation model is 2.3 m tall, 1.5 m wide, and 2.4 m long. An explosion occurred 83 cm above the vault of the cavern. TNT explosive weighs 100 g, as depicted in Figure 1. The caven model was held on all sides by rigid confining devices. On the front surface of each device, a 50% porosity aluminum wave absorbing plate was used to eliminate stress wave reflection on the sides. A single row of full-length adhesive bolts spaced 4 cm apart and 24 cm long held the cavern together. The bolt had a yield strength of 282 MPa. This cavern was surrounded by a rock material composed of sand, cement, water, and an accelerating agent in the following proportions: 15:1:1.6:0.0166. The physical and mechanical properties of the surrounding rock are listed in Table 1.

2.1. Model Geometry and Boundary Conditions

The numerical model will be used to simulate how adjacent cyclic explosions may affect the cavern supported by bolts. The numerical model placed the explosion source 83 cm away from the right straight wall based on the distance between the explosion source and the vault in the test, and applying explosion loads to a cavity with a 20 cm diameter simulates the TNT explosion. The length of the model was increased to 400 cm in order to place the blast cavity and observe the damage to the surrounding rock, while the height remained at 230 cm. The numerical model was simplified as a plane strain problem with a width of 4 cm in order to increase calculation efficiency while keeping in mind the symmetry of the test model (bolt row spacing). To prevent the stress wave from reflecting, the model’s left, right, and lower bounds are configured as non-reflective boundary conditions, and the mesh size of the surrounding rock was 1 cm, as shown in Figure 2.
To compare the influence of high-level single explosion and low-level cyclic explosion on the anchored cavern, it is necessary to ensure that the total load level of high-level single explosion and low-level cyclic explosion on the explosion cavity is the same. The designed low-level cyclic explosion load strength was 1/5 of the high-level single explosion test strength, keeping the duration of each explosion unchanged and cyclical 5 times on the inner surface of the explosion cavity. Figure 3a shows the load time history curve of the inner surface of the explosion cavity during the 100 g TNT explosion in the test. The load time is 100 μs. This curve is used for the high-level single explosion load time history curve in the numerical model. Figure 3b is the load time history curve of the low-level cyclic explosion test, td is the single load time of 100 μs, and t0 is the load-interval time of 4000 μs. After the previous explosion, t0 can ensure that the dynamics of the surrounding rock are stable.

2.2. Material Properties and Parameters

The rock mass was set as the Solid164 element in the numerical calculation, and the bolt was set as the Beam161 element.

2.2.1. Surrounding Rock

To simulate the rock mass, the concrete constitutive model with material number 272 and the definition method MAT RHT was used [27]. The RHT constitutive model can well reflect the dynamic response of surrounding rock under low impact velocity. By using the RHT model, scholars [28,29] have achieved ideal simulation effects by depicting the cumulative damage characteristics of the surrounding rock. It is worth noting that the RHT model has limitations in expressing the dynamic response of concrete at high impact velocities due to underestimation of the yield surface and fracture behavior (depending on the strain rate) [30].
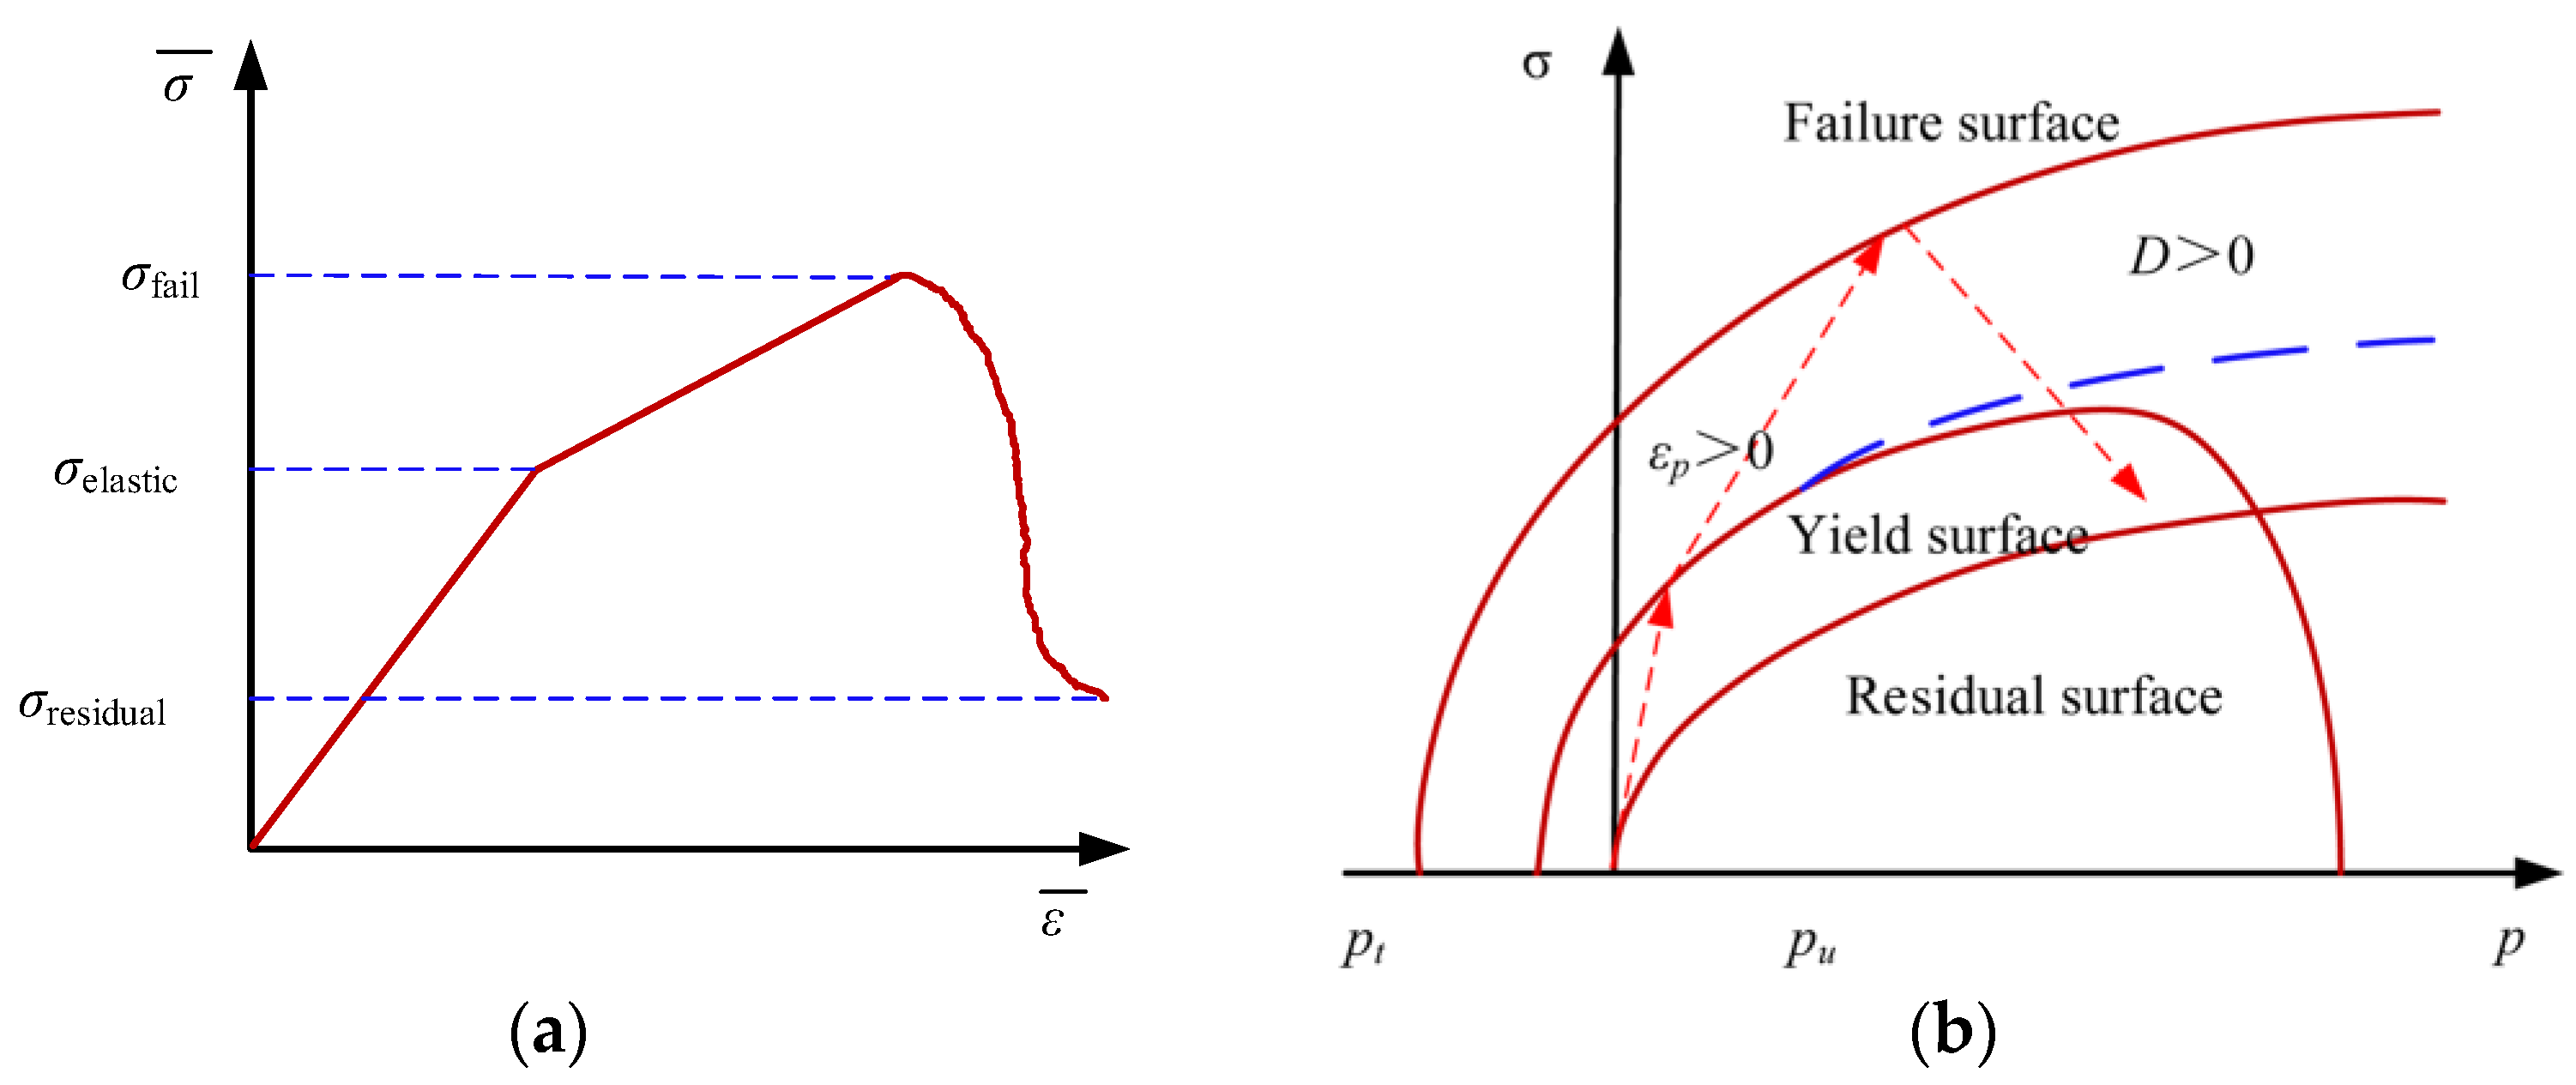
As shown in Figure 4a, the equivalent stress σ ¯ increases from zero, the concrete first goes through the elastic stage until the equivalent stress σ ¯ reaches the elastic limit surface strength σ e l a s t i c , the concrete begins to undergo plastic deformation, and at this time, the concrete begins to enter the linear strengthening stage. As the equivalent stress σ ¯ continues to increase when the equivalent stress intensity σ f a i l of the failure surface is reached, the concrete linear strengthening stage ends and begins to enter the damage softening stage. After entering the damage-softening stage, the equivalent stress σ ¯ gradually decreases, and with the accumulation of damage, it decreases to the residual stress σ residual .
In the RHT constitutive model, the equivalent stress intensity σ f a i l of the failure surface is an equation related to the normalized pressure p = p / f c , Rhodes angle θ and strain rate ε ˙ [31].
σ f a i l ( p , θ , ε ˙ ) = f c · σ T X C * ( p s ) · R 3 ( θ ) · F r a t e ( ε ˙ )
where σ T X C * ( p s ) is the quasi-static failure surface compression meridian equivalent stress intensity; R 3 ( θ ) is the Rhodes angle factor; F r a t e ( ε ˙ ) is the strain rate dynamic enhancement factor; p s = p / F r a t e ( ε ˙ ) is the quasi-static pressure.
The yield surface equation of the material is derived from the equivalent stress intensity equation of the failure surface [31].
σ y i e l d ( p , θ , ε ˙ ) = f c · σ T X C * ( p s , e l ) · R 3 ( θ ) · F r a t e ( ε ˙ ) · F e l a s i c · F c a p
where p s , e l = p s / F e l a s i c is the quasi-static elastic limit pressure; F c a p is the cap function; F e l a s i c is the elastic scaling function.
To limit the yield stress of the material at high pressure and reduce the contribution of the elastic stage to material damage, the RHT constitutive introduces a cap function. F c a p [31].
F c a p = 1 p p u = f c / 3 1 ( p p u p o p u ) 2 p u < p < p o 0 p p o = p c r u s h
where p o = p c r u s h is the pressure at which the pores of the material begin to compress.
When the force on the material exceeds the failure stress (that is, after the material is completely destroyed), and although the material is subjected to negative pressure at this time, resulting in the existence of unbiased stress due to the confining pressure, there is friction between the broken parts of the material, so that the material can continue to withstand shearing. Therefore, the RHT constitutive model introduces a residual stress surface, and the equivalent stress intensity is [31]:
σ residual = B × ( p ) M
where B is the residual stress intensity parameter, and M is the residual stress intensity index.
Figure 4b shows the relationship between the elastic limit surface, failure surface, residual strength surface equations, and pressure. The blue dotted line in Figure 4b represents the yield surface equation expressed by Equation (2) when no cap function is introduced. In order to limit the yield stress of the material at high pressure and reduce the contribution of the elastic stage to material damage, the RHT constitutive model quotes the cap function Equation (3). Therefore, the final expression of the yield surface stress is shown as the solid line in Figure 4b [31,32].
The damage accumulates when the concrete enters a softening phase. The damage index, or D, represents the relationship between escalating equivalent plastic strains and ultimate failure. The damage index D ranges from 0 to 1. The closer D is to 1, the higher the damage level will be.
0 D = Δ ε P / ε P failure 1
ε P failure = D 1 P * P spall * D 2 ε p m
where Δ ε P represents the equivalent plastic strain increment, D 1 and D 2 represent the parameters of the material and ε p m represent the minimum equivalent plastic strain when the material fails.
Some parameters in the RHT model in this paper are derived from the similarity model test [26]. The damage parameters D 1 and D 2 are obtained based on impact tests [33,34], and the rest of the parameters are based on literature [31].

2.2.2. Rock Bolts

The bolt was described by MAT PLASTIC KINEMATIC [27]. The isotropic elastic-plastic model can explain the bolt’s isotropic hardening and dynamic hardening plasticity.
The yield strength without strain rate is equal to the initial yield strength plus the hardening component, and the stress and strain are as follows:
σ y = σ 0 + β E p ε eff p
Among them: σ 0 represents the initial yield strength, β represents the hardening coefficient, E p represents the plastic hardening modulus and ε eff p represents the effective plastic strain.
The strain-stress relationship is as follows when the strain rate is considered:
σ y = 1 + ε ˙ c 1 p σ 0 + β E p ε eff p
where c and p represent Cowper-Symonds strain rate parameters; ε ˙ represents strain rate.
Based on the test [26], Table 2 shows the input parameters for the bolt material model.

3. Numerical Results and Discussion

3.1. Comparative Analysis of Numerical Simulation and Test Results

The similarity model test was only conducted with the vault explosion, so to verify the accuracy of the numerical results, Figure 2a. shows the stress time history curves of the measuring points at the same scaled distance from the cavern in the high-level single explosion in the simulation and test. According to Figure 5, the stress time course curves of the measured points at the same position were compared and analyzed to determine whether the numerical calculation results were reasonable. As a result of the figure analysis, the stress time course curves in both the test and simulation consist of two stages of rise and fall and finally tend to a steady state. Comparing the peak stresses at the same location in the test and simulation, the peak stresses at the three measurement points σ1, σ2, and σ3 in the numerical simulation are 8.7%, 11.7%, and 12.9% larger than those in the test, respectively. The reason for this result is that similar test models are obtained by manually pouring concrete, which inevitably leads to the presence of joint surfaces in the test model. The appearance of joint surfaces makes the internal structure of the concrete discontinuous. Reflection and transmission phenomena will occur when the stress wave encounters these joint surfaces during propagation. Part of the energy will be reflected back to the original medium, resulting in energy loss of the stress wave, manifested as amplitude attenuation on the stress time history curve. At the same time, the stress wave speed is reduced. The model in the numerical simulation idealizes the surrounding rock material to make it isotropic and continuous, which allows the stress wave to propagate in an ideal situation. Therefore, compared with the experimental situation, the stress time history curve obtained through numerical simulation has increased in amplitude and advanced in time [35]. It is possible to conclude that the numerical calculation model is highly credible.

3.2. Dynamic Response of Bolt-Supported Cavern

3.2.1. Stress Wave Propagation Law

The stress time history of the measuring points σ1, σ2, and σ3 in the low-level cyclic explosion is shown in Figure 6. Tensile stress is symbolized by the negative value in the figure, while compression stress is symbolized by the positive number. The figure shows that following each explosion, the measuring point’s stress curve first climbs quickly to achieve the maximum compressive stress, then rapidly decreases to the maximum tensile stress, and then gradually rises and reaches stability near 0. In the cyclic explosion, the peak stress of each measuring point gradually declines as the explosion times increase. By contrasting the stress time histories of the measurement sites at the same locations in the high-level single explosion in Figure 5 and the low-level cyclic explosion in Figure 6, it can be observed that the stress time history curve for a single explosion has a single wave peak, while a cyclic explosion has five wave peaks, and each measurement point in the low-level cyclic explosion’s peak compressive stress is far lower than that in the high-level single explosion.
The attenuation trend of the stress wave exhibits the propagation law of the stress wave [35]. At the measuring locations σ1, σ2, and σ3 in the five explosions, the peak stress σmax and the distance from the explosion source R are fitted with a power function.
σ max = c R n
where c is a typical value based on the characteristics of the rock in the area, and n is the attenuation index.
The fitting curve of each explosion is shown in Figure 7. Increasing distance from the explosion source results in a gradual decrease in the attenuation speed of the stress wave. The attenuation rate of the stress wave can be indicated by the attenuation index. As shown in the figure, although the attenuation index of the stress wave in the second explosion is lower than that of the first, it increases in the following explosions. It shows that with increasing explosion times, the attenuation speed of the stress wave initially reduces and then increases. The reason is that during the first explosion, the original voids in the surrounding rock are reduced and narrowed, the surrounding rock is densified, and the surrounding rock is strengthened. Therefore, in the first explosion, the stress wave attenuates faster than in the second. The latest three explosions have caused more damage to the surrounding rock, including more cracks in it, causing a progressive rise in the energy required for stress wave propagation, which in turn causes an increase in the attenuation index and speed of the stress wave.

3.2.2. Displacement of the Cavern Wall

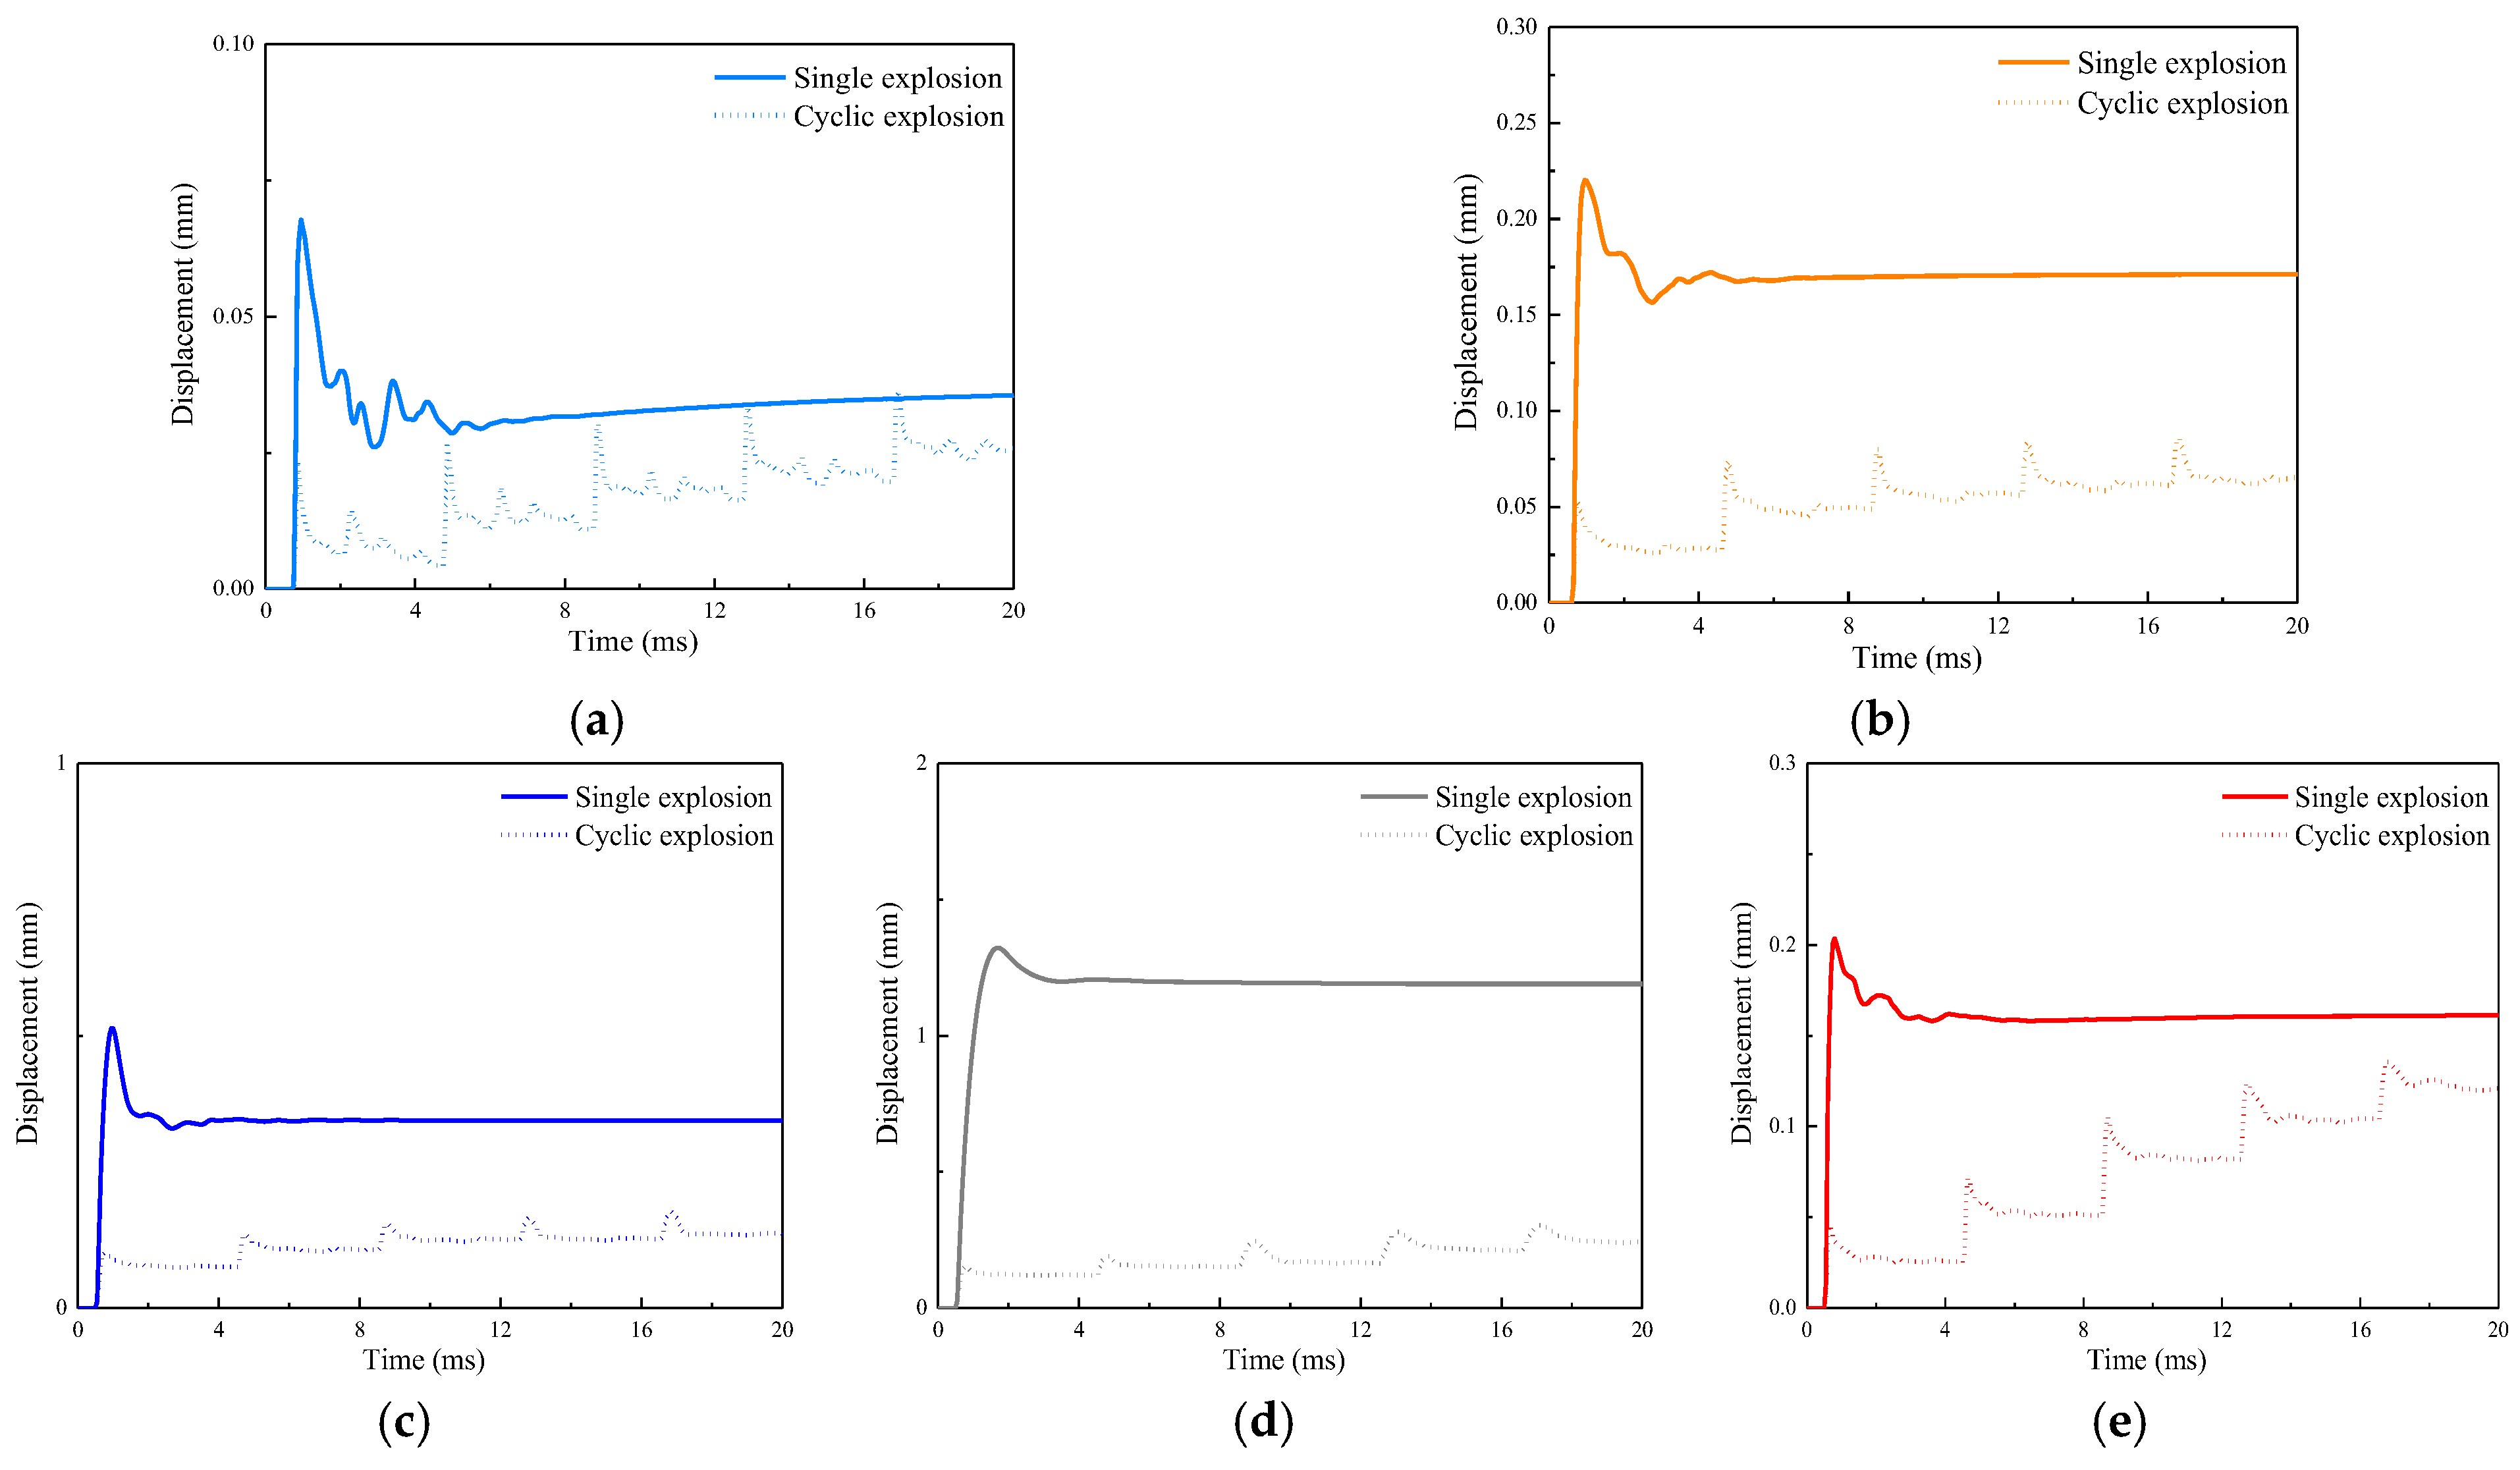
Measure displacement of the surrounding rock, as shown in Figure 2a, using measuring points U1 to U5 on the vault, arch side, spandrel, straight wall, and corner of the cavern wall. Each displacement measuring point in the single explosion and cyclic explosion is shown by a displacement time history curve in Figure 8. It is evident that the displacement time history curve of a single explosion rises rapidly to its peak value, then steadily decreases until it reaches stability but is not zero. After each explosion, the displacement time history curve of the measuring point rises rapidly and then falls to a stable level. The displacement time history curve rises again after the second explosion, and the peak displacement is higher than it was after the first explosion. Contrasting the low-level cyclic explosion with the high-level single explosion, it can be seen that the peak displacement and residual displacement in the single explosion are larger than those in the cycle explosion. The reason for this result is that the explosion level is higher in the single explosion, and the recoverable elastic deformation in the displacement accounts for a relatively small proportion, while the displacement of surrounding rock caused by each explosion in the low-level cycle explosion is relatively small, and the elastic deformation accounts for a relatively large proportion, The latter explosion occurs after the elastic deformation of displacement is restored in the previous explosion, so the peak displacement and residual displacement in the cyclic explosion are even minimum. Comparing the displacement of each measuring point, it can be found that as the distance between the measuring point and the explosion source grows, the displacement of the measurement point gradually decreases. The displacement of U4 on the straight wall facing the explosion source is the largest, and that of U1 on the vault far away from the explosion source is the smallest.

3.2.3. Circumferential Peak Strain of Cavern Wall

By contrasting the circumferential peak strain of the cavern during the low-level cyclic explosion with the single high-level explosion, the distribution characteristics of the circumferential strain in the two cases can be analyzed. The cavern wall’s corner, spandrel, straight wall, vault, and arch side are the locations for the circumferential strain measuring points, and the strain measuring points are also placed in the middle of these positions, a total of 14 strain measuring points (ε1 to ε14), as shown in Figure 9.
Figure 10 and Figure 11 illustrate the circumferential peak strain of the surrounding rock during high-level single explosions and low-level cyclic explosions, respectively. Tensile strains are positive in the figure, whereas compressive strains are negative. It can be seen from Figure 10 and Figure 11 that when an explosion occurs near the cavern, the circumferential peak strain of the surrounding rock of the cave wall changes from tensile strain to compressive strain from the vault to the arch foot, and then changes from compressive strain to tensile strain from the base of the arch to the base of the straight wall [36,37]. In each case, the circumferential peak strain at ε6 and ε7 near the arch side is the largest, which is due to a lack of support and proximity to the explosion source. Therefore, the circumferential peak strain of the surrounding rock here is greater than it is for other surrounding rocks. In comparison to the low-level cyclic explosion, the circumferential peak strain of the surrounding rock is larger in the high-level single explosion. The reason is that the intensity of the explosion is greater in high-level single explosions, and the amount of recoverable strain from the strain of the surrounding rock is comparatively low [38]. However, in the low-level cyclic explosion, the explosion power is smaller, the residual strain of surrounding rock after each explosion is smaller, and the strain level caused by the subsequent explosion is also lower. In the low-level cyclic explosion, the circumferential peak strain of the surrounding rock is relatively close and does not show a regular increase or decrease with the increasing explosion times, indicating that cyclic explosion has little effect on the circumferential peak strain.

3.3. Damage of Bolt-Supported Cavern

3.3.1. Damage Evolution Process of the Surrounding Rock

Figure 12 illustrates the process of damage evolution during the high-level explosion. As depicted in Figure 12a, following the explosion, damage is generated in the nearby of the explosion source. At 0.6 ms, the stress wave generated by the reflection on the straight wall damages the surrounding rock. The damage range of the straight wall gradually increases as the tensile stress wave travels, as shown in Figure 12c. The upward propagating stress wave reaches the surface at 1.2 ms, which also causes tensile damage to the surrounding rocks near the surface. This phenomenon occurs because the stress wave generated by the explosion initially propagates around in a spherical shape. After a period of time, the stress wave will propagate to the free surface above the model far away from the explosion source and will be reflected to form a reflected stretching wave that propagates back in the opposite direction. This tensile wave and the tensile wave formed by reflection from the cave wall are superimposed near the upper free surface of the model, causing the surrounding rock to be subjected to bidirectional tension, exceeding its tensile strength and thus causing damage. After 2.0 ms, the damage to the nearby rock usually stabilizes.
The distribution of low-level cyclic explosion damage is shown in Figure 13. Only obvious damage occurs on the straight wall following the first explosion, but damage around the explosion source is not observable. The underlying reason is that the rock surrounding the fault has a much higher compressive strength than its tensile strength. Compressive stress waves in the first explosion were weaker than those in the surrounding rock. However, in comparison with the surrounding rock, the straight wall has greater tensile strength. Figure 13b shows the effects of the second explosion on the surrounding rock. The rock close to the explosion source, around the ground, and next to the straight wall has sustained little damage. As shown in Figure 13c–e, in the last three explosions, the scope and degree of damage around the explosion source, the straight wall, and the ground all increase significantly. When Figure 12f and Figure 13e are compared, it has been found that the damage radius of a low-level cyclic explosion is greater than that of a high-level single explosion for surrounding rock, but the range of damage index above 0.9 in a cyclic explosion is not as large as a single explosion.

3.3.2. Damage Cumulative of the Surrounding Rock

During the process of damage evolution, the analysis of damage is conducted solely at a macro level. To comprehensively grasp the damage of the surrounding rock, a more detailed analysis is needed. Therefore, four measuring points, D1 to D4, are selected to measure the rock damage in the vicinity of the explosion source facing the cavern, as depicted in Figure 2a. The damage to the measuring points in the single explosion and cycle explosion is depicted in Figure 14. It can be seen from the figure that from D1 to D3 measuring points, the final rock damage is steadily reducing as the distance from the explosion source rises because measurement point D4 is close to the cavern and has a high tensile tension, so its damage is larger than that of other locations. Figure 14 shows that the surrounding rock has sustained abrupt and irreversible damage. According to Figure 14b, the damage caused by the cyclic explosion to nearby rock increases gradually. In the second explosion, damage is added up based on the first explosion, and as the cumulative damage rises, the damage increment gradually declines.
In Figure 15, cumulative damage is correlated with the number of bursts at monitoring stations D1 through D4 during the cyclic explosion. At each measurement point, a power function curve can be used to fit the relationship between damage index and explosion times, and the variances of the four curves are greater than 0.99, indicating a clear nonlinear relationship between surrounding rock explosion times and cumulative damage.

3.4. Dynamic Response of Bolts

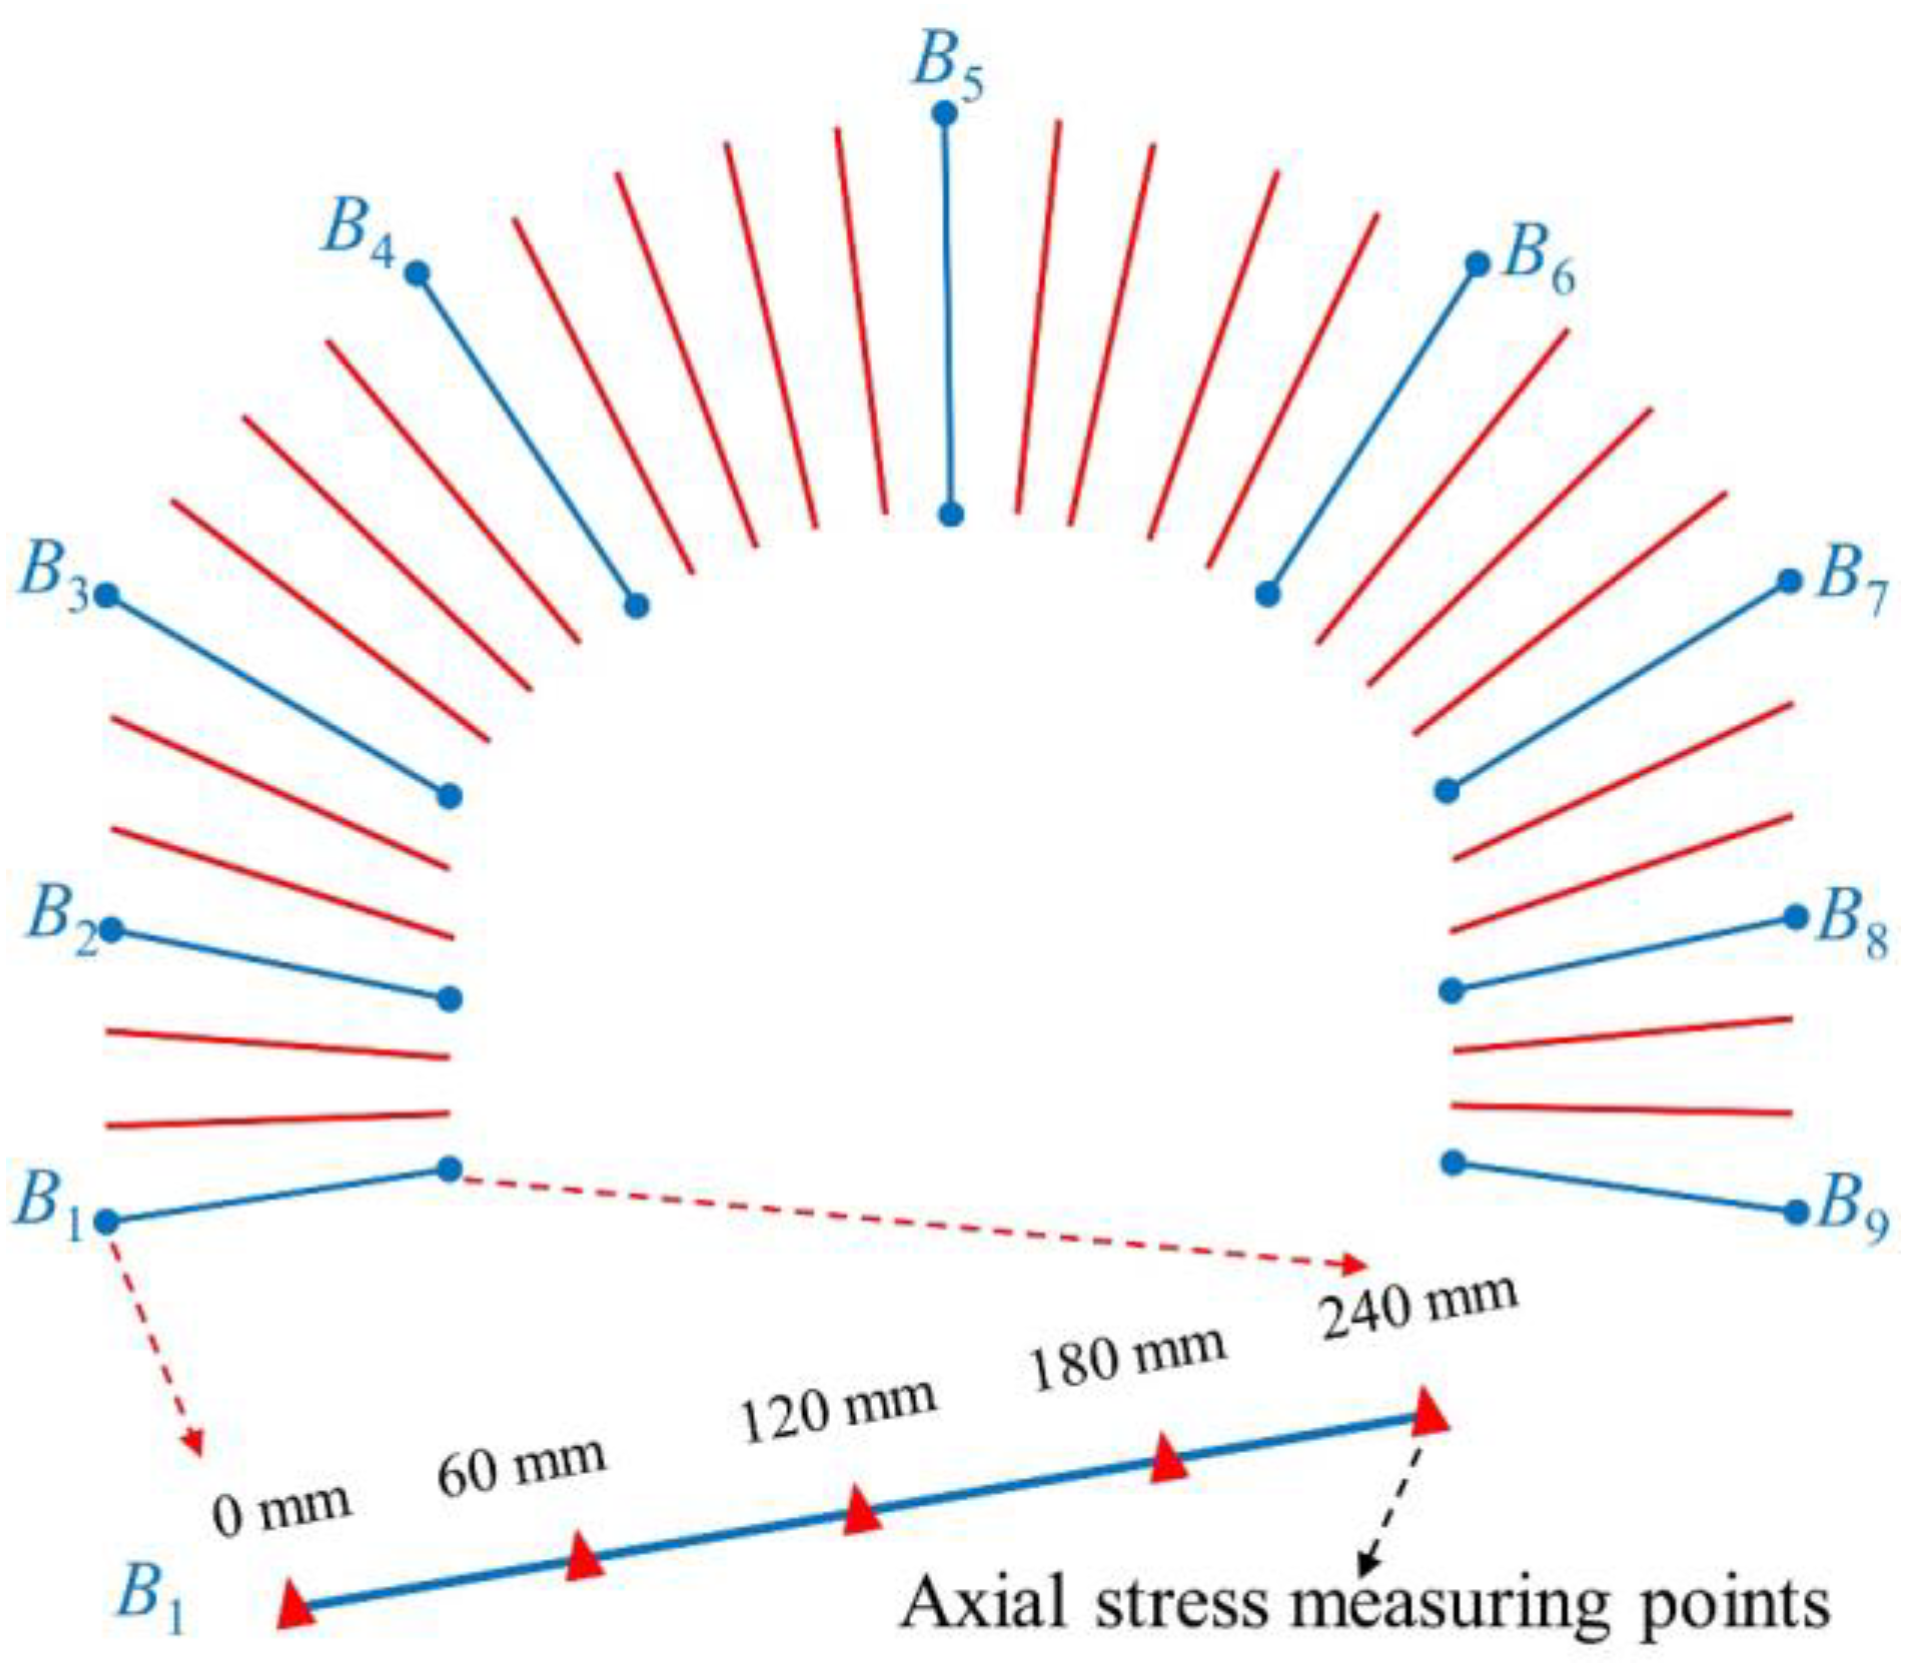
There is a significant effect of explosion load on the axial stress of the bolt [18]. To analyze the axial stress distribution law of the bolt, nine bolts B1B9 at the vault, arch side, spandrel, straight wall, and corner are selected, and measuring points are arranged at 0 mm, 60 mm, 120 mm, 180 mm, and 240 mm away from the anchor head to measure the axial stress of the bolts, as shown in Figure 16.
The axial stress time history curves of the B1 to B9 bolts intermediate element in the high-level single explosion and low-level cyclic explosion are shown in Figure 17, in which positive is tensile stress and negative is compressive stress. As can be observed from Figure 17a, the axial stress of the bolt in the single explosion is first compressive, then changes into tensile, and then decreases rapidly and tends to be stable. Figure 17b shows that the axial stress of the bolt changes from tension to compression after each explosion in the cyclic detonation. During a high-level single explosion, the axial stress on the intermediate element of the bolt is substantially greater compared to a cyclic explosion, as shown by the comparison of Figure 17a,b.
Figure 18 shows the axial peak tensile and compressive stress along the length direction of the B1 to B9 bolt in two explosion situations. It is clear that the bolt’s axial peak tensile and compressive stress increase first and then decrease from the anchor head to the anchor end in both high-level single explosion and low-level cyclic explosion, and the maximum value appears 60 mm away from the anchor head. The bolt’s anti-explosion performance can be improved by appropriately thickening the bolt diameter near the middle of the bolt.

4. Conclusions

With the same total adjacent explosion load, this paper compares and contrasts the effects of the low-level cyclic explosion with the high-level single explosion. Based on the existing similarity model test, the following conclusions are obtained by using the numerical simulation method.
(1)
When the total level of adjacent explosion load is the same, the displacement and peak circumferential strain of the cavern wall in the high-level single explosion is larger than those in the low-level cyclic explosion. However, low-level cyclic explosions damage surrounding rock more than high-level single explosions.
(2)
With increasing explosion times, the attenuation speed of the stress wave in cyclic explosions initially rises and then falls. The cumulative damage of surrounding rock presents an irreversible step-by-step increase with explosion times, and the relationship between them is a power function.
(3)
When the adjacent explosion source explodes, the bolt’s axial peak tensile and compressive stress increase first and then decrease from the anchor head to the anchor end, and the maximum value appears 60 mm away from the anchor head.
The research in this article can provide a reference for the anti-explosion design of underground caverns when they are subject to adjacent explosion loads. It is worth noting that the research in this article has limitations. One major problem is that it lacks experimental support. Therefore, more extensive indoor and field experiments will be conducted in future work to improve this situation.

Author Contributions

Writing, reviewing, and editing, G.W.; reviewing, editing, and supervision, A.C.; writing, reviewing, and editing, K.C. All authors have read and agreed to the published version of the manuscript.

Funding

The authors gratefully acknowledge the financial support by the State Key Project of the National Natural Science Foundation of China (grant number U1810203).

Data Availability Statement

Data available on request due to privacy or ethical.

Conflicts of Interest

The authors declare no conflict of interest.

References

  1. Guan, X.; Xu, H.; Fu, H.; Zhang, W.; Li, P.; Ding, H.; Yu, K.; Zhang, S. Vibration characteristics, attenuation law, and prediction method in the near field of tunnel blasting. Case Stud. Constr. Mater. 2023, 19, e02662. [Google Scholar] [CrossRef]
  2. Yang, J.; Cai, J.; Yao, C.; Li, P.; Jiang, Q.; Zhou, C. Comparative study of tunnel blast-induced vibration on tunnel surfaces and inside surrounding rock. Rock Mech. Rock Eng. 2019, 52, 4747–4761. [Google Scholar] [CrossRef]
  3. Jiang, N.; Gao, T.; Zhou, C.; Luo, X. Effect of excavation blasting vibration on adjacent buried gas pipeline in a metro tunnel. Tunn. Undergr. Space Technol. 2018, 81, 590–601. [Google Scholar] [CrossRef]
  4. Cao, F.; Zhang, S.; Ling, T. Analysis of Cumulative Damage for Shared Rock in a Neighborhood Tunnel under Cyclic Blasting Loading Using the Ultrasonic Test. Shock Vib. 2020, 2020, 8810089. [Google Scholar] [CrossRef]
  5. Shi, C.; Zhao, Q.; Lei, M.; Peng, M. Vibration velocity control standard of buried pipeline under blast loading of adjacent tunnel. Soils Found. 2019, 59, 2195–2205. [Google Scholar] [CrossRef]
  6. Xia, X.; Li, H.; Li, J.; Liu, B.; Yu, C. A case study on rock damage prediction and control method for underground tunnels subjected to adjacent excavation blasting. Tunn. Undergr. Space Technol. 2013, 35, 1–7. [Google Scholar] [CrossRef]
  7. Fiamingo, A.; Bosco, M.; Massimino, M.R. The role of soil in structure response of a building damaged by the 26 December 2018 earthquake in Italy. J. Rock Mech. Geotech. Eng. 2023, 15, 937–953. [Google Scholar] [CrossRef]
  8. Wei, J.; Yanhai, W.; Qiang, F. Study of the influence of blasting load on fresh concrete at adjacent chambers based on DDA. Procedia Eng. 2012, 29, 563–567. [Google Scholar] [CrossRef]
  9. Zhang, Z.; Zhou, C.; Remennikov, A.; Wu, T.; Lu, S.; Xia, Y. Dynamic response and safety control of civil air defense tunnel under excavation blasting of subway tunnel. Tunn. Undergr. Space Technol. 2021, 112, 103879. [Google Scholar] [CrossRef]
  10. Liu, Y.; Dai, F. A review of experimental and theoretical research on the deformation and failure behavior of rocks subjected to cyclic loading. J. Rock Mech. Geotech. Eng. 2021, 13, 1203–1230. [Google Scholar] [CrossRef]
  11. Zang, C.; Chen, M.; Zhang, G.; Wang, K.; Gu, D. Research on the failure process and stability control technology in a deep roadway: Numerical simulation and field test. Energy Sci. Eng. 2020, 8, 2297–2310. [Google Scholar] [CrossRef]
  12. Li, Z.; Hu, Y.; Wang, G.; Zhou, M.; Hu, W.; Zhang, X.; Gao, W. Study on cyclic blasting failure characteristics and cumulative damage evolution law of tunnel rock mass under initial in-situ stress. Eng. Fail. Anal. 2023, 150, 107310. [Google Scholar] [CrossRef]
  13. Peng, K.; Zhou, J.; Zou, Q.; Song, X. Effect of loading frequency on the deformation behaviours of sandstones subjected to cyclic loads and its underlying mechanism. Int. J. Fatigue 2020, 131, 105349. [Google Scholar] [CrossRef]
  14. Peng, K.; Zhou, J.; Zou, Q.; Yan, F. Deformation characteristics of sandstones during cyclic loading and unloading with varying lower limits of stress under different confining pressures. Int. J. Fatigue 2019, 127, 82–100. [Google Scholar] [CrossRef]
  15. Ramulu, M.; Chakraborty, A.; Sitharam, T. Damage assessment of basaltic rock mass due to repeated blasting in a railway tunnelling project—A case study. Tunn. Undergr. Space Technol. 2009, 24, 208–221. [Google Scholar] [CrossRef]
  16. Wang, J.-T.; Wu, X.-H.; Yang, B.; Sun, Q. Bearing capacity and damage behavior of HCFTST columns under cyclic loading. Structures 2021, 32, 1492–1506. [Google Scholar] [CrossRef]
  17. Chu, H.; Yang, X.; Li, S.; Liang, W. Experimental study on the blasting-vibration safety standard for young concrete based on the damage accumulation effect. Constr. Build. Mater. 2019, 217, 20–27. [Google Scholar] [CrossRef]
  18. Yim, H.C.; Krauthammer, T. Mechanical properties of single-plate shear connections under monotonic, cyclic, and blast loads. Eng. Struct. 2012, 37, 24–35. [Google Scholar] [CrossRef]
  19. Sun, B.; Yuan, D.; Zeng, S. Experimental Study on the Mechanical Characteristics of Rock Bolts under Blast Loading. J. Disaster Prev. Mitig. Eng. 2017, 37, 302–307. [Google Scholar] [CrossRef]
  20. Wang, G.Y.; Zhang, S.H.; Xie, W.Q.; Wang, X.D. Numerical analysis of dynamic response and axial stress distribution of rock bolts under explosive loads. J. Min. Saf. Eng. 2009, 26, 114–117. [Google Scholar]
  21. Wang, W.J.; Wang, Z.G.; Zheng, J.J.; Shi, Z.J. The response behaviour of fully grouted GFRP rock bolts under blast dynamic load. J. Min. Saf. Eng. 2020, 37, 898–907. [Google Scholar] [CrossRef]
  22. Wang, G.; Cao, A.; Wang, X.; Yu, R.; Huang, X.; Yu, R.; Huang, X.; Lin, J. Numerical simulation of the dynamic responses and damage of underground cavern under multiple explosion sources. Eng. Fail. Anal. 2021, 120, 105085. [Google Scholar] [CrossRef]
  23. Ansell, A. Dynamic testing of steel for a new type of energy absorbing rock bolt. J. Constr. Steel Res. 2006, 62, 501–512. [Google Scholar] [CrossRef]
  24. Han, J.; Ma, S.W.; Zhang, M.; Bi, Z.Q.; Cao, C.; Ren, T. Design and engineering practice of rebar bolt for large deformation roadway. J. Chin. Coal Soc. 2021, 46, 3745. [Google Scholar] [CrossRef]
  25. Chong, Z.; Yue, T.; Yao, Q.; Li, X.; Zheng, C.; Xia, Z.; Li, H. Experimental and numerical investigation of crack propagation in bolting systems strengthened with resin-encapsulated rock bolts. Eng. Fail. Anal. 2021, 122, 105259. [Google Scholar] [CrossRef]
  26. Wang, G.Y.; Gu, J.C.; Chen, A.M.; Xu, J.M.; Zhang, X.Y. Model tests on anti-explosion anchoring effect of tunnels reinforced by dense bolts at arch top. Chin. J. Geotech. Eng. 2009, 31, 378–383. [Google Scholar] [CrossRef]
  27. Hallquist, J.O. LS-DYNA Keyword User’s Manual; Livermore Software Technology Corporation: Livermore, CA, USA, 2007; pp. 299–800. [Google Scholar]
  28. Tu, Z.; Lu, Y. Modifications of RHT material model for improved numerical simulation of dynamic response of concrete. Int. J. Impact Eng. 2010, 37, 1072–1082. [Google Scholar] [CrossRef]
  29. Wang, Z.; Wang, H.; Wang, J.; Tian, N. Finite element analyses of constitutive models performance in the simulation of blast-induced rock cracks. Comput. Geotech. 2021, 135, 104172. [Google Scholar] [CrossRef]
  30. Shin, W.; Park, H.; Han, J. Improvement of the dynamic failure behavior of concrete subjected to projectile impact using user-defined material model. Constr. Build. Mater. 2022, 332, 127343. [Google Scholar] [CrossRef]
  31. Borrvall, T.; Riedel, W. The RHT concrete model in LS-DYNA. In Proceedings of the 8th European LS-DYNA User Conference, Strasbourg, France, 23–24 May 2011; pp. 23–24. [Google Scholar]
  32. Li, S.; Ling, T.; Liu, D.; Liang, S.; Zhang, R.; Huang, B.; Liu, K. Determination of Rock Mass Parameters for the RHT Model Based on the Hoek–Brown Criterion. Rock Mech. Rock Eng. 2023, 56, 2861–2877. [Google Scholar] [CrossRef]
  33. Riedel, W. Beton Unter Dynamischen Lasten: Meso-und Makromechanische Modelle und Ihre Parameter; EMI: London, UK, 2000. [Google Scholar]
  34. Li, H. The Study of the Rock RHT Model and to Determine the Values of Main Parameters; China University of Mining and Technology: Beijing, China, 2016. [Google Scholar]
  35. Chen, S.G.; Cai, J.G.; Zhao, J.; Zhou, Y.X. Discrete element modelling of an underground explosion in a jointed rock mass. Geotech. Geol. Eng. 2000, 18, 59–78. [Google Scholar] [CrossRef]
  36. Wang, Q.R.; Xie, L.X.; Song, E.X.; Kong, F.L.; Fan, J.Q.; Yu, L.Y.; Xu, J.M.; Shi, X.Y. Model tests on dynamic responses of surrounding rock and support structure on underground tunnel under combined dynamic and static loading. Int. J. Rock Mech. Min. Sci. 2023, 171, 105572. [Google Scholar] [CrossRef]
  37. Qiu, J.; Li, X.; Li, D.; Zhao, Y.; Hu, C.; Liang, L. Physical model test on the deformation behavior of an underground tunnel under blasting disturbance. Rock Mech. Rock Eng. 2021, 54, 91–108. [Google Scholar] [CrossRef]
  38. US Army Engineers Waterways Experimental Station. TM 5-855-1, Fundamental of Protective Design for Conventional Weapons; US Army Engineers Waterways Experimental Station: Vicksburg, MS, USA, 1986. [Google Scholar]
Figure 1. 1/2 symmetric geometrical test model (unit: cm).
Buildings 14 01307 g001
Figure 2. Model of numerical analysis. (a) Geometry of model (unit: cm). (b) Mesh of model.
Buildings 14 01307 g002
Figure 3. Load time history curve (a) Single explosion. (b) Cyclic explosion.
Buildings 14 01307 g003
Figure 4. The RHT model. (a) The three phases of RHT are constitutive. (b) Stress limit surfaces and loading scenarios.
Buildings 14 01307 g004
Figure 5. Comparison of stress time history curves of measuring points with the same scaled distance in test and simulation model.
Buildings 14 01307 g005
Figure 6. Stress time history curve of σ1, σ2, and σ3 in the cyclic explosion.
Buildings 14 01307 g006
Figure 7. Fitting curves of the peak stress σmax and the distance from the explosion source R.
Buildings 14 01307 g007
Figure 8. Displacement time curves of U1 to U5: (a) U1 on the vault; (b) U2 on the side arch; (c) U3 on the spandrel; (d) U4 on the sidewall; (e) U5 on the corner.
Buildings 14 01307 g008
Figure 9. Arrangement of circumferential strain measuring points.
Buildings 14 01307 g009
Figure 10. The circumferential peak strain of the cavern wall under the single explosion (unit: 10−6).
Buildings 14 01307 g010
Figure 11. The circumferential peak strain the cavern wall under the cyclic explosion (unit: 10−6): (a) First explosion; (b) Second explosion; (c) Third explosion; (d) Fourth explosion; (e) Fifth explosion.
Buildings 14 01307 g011
Figure 12. The damage evolution process of the underground cavern under a single explosion: (a) t = 0.2 ms; (b) t = 0.6 ms; (c) t = 1.0 ms; (d) t = 1.2 ms; (e) t = 1.5 ms; (f) t = 2.0 ms.
Buildings 14 01307 g012
Figure 13. Damage distribution of underground cavern under cyclic explosion: (a) First explosion; (b) Second explosion; (c) Third explosion; (d) Fourth explosion; (e) Fifth explosion.
Buildings 14 01307 g013
Figure 14. Damage time curves of the measuring points: (a) Single explosion; (b) Cyclic explosion.
Buildings 14 01307 g014
Figure 15. Fitting curves of the cumulative damage D and explosion times N.
Buildings 14 01307 g015
Figure 16. Bolt number and measuring point layout.
Buildings 14 01307 g016
Figure 17. Axial stress time history curve of the intermediate element of the bolt. (a) Single explosion. (b) cyclic explosion.
Buildings 14 01307 g017
Figure 18. Axial peak tension and compression stress of bolt. (a) Single explosion. (b) cyclic explosion.
Buildings 14 01307 g018
Table 1. Material parameters of the surrounding rock.
Density (Kg/m3)Cohesion (MPa)Young’s Modulus (GPa)Poisson’s RatioInternal Friction Angle (°)Tensile Strength (MPa)Compressive Strength (MPa)
17000.121.60.19390.112.0
Table 2. Physical and mechanical parameters of rock bolt.
Density (g/cm3)Elastic Modulus (GPa)Passion RatioYield Strength (GPa)Tangent Modulus (GPa)
2.727.60.341.450.025
Disclaimer/Publisher’s Note: The statements, opinions and data contained in all publications are solely those of the individual author(s) and contributor(s) and not of MDPI and/or the editor(s). MDPI and/or the editor(s) disclaim responsibility for any injury to people or property resulting from any ideas, methods, instructions or products referred to in the content.