Article

Health Risk Prediction of Operational Subsea Tunnel Structure Based on Bayesian Network

1
School of Civil and Transportation Engineering, Henan University of Urban Construction, Pingdingshan 467036, China
2
Yunlong Lake Laboratory of Deep Underground Science and Engineering, Xuzhou 221116, China
3
National Engineering Laboratory for Green & Safe Construction Technology in Urban Rail Transit, Beijing 100037, China
4
School of Civil and Resources Engineering, University of Science and Technology Beijing, Beijing 100083, China
*
Author to whom correspondence should be addressed.
Buildings 2024, 14(5), 1475; https://doi.org/10.3390/buildings14051475
Submission received: 14 April 2024 / Revised: 7 May 2024 / Accepted: 15 May 2024 / Published: 18 May 2024
(This article belongs to the Special Issue Seismic Response Analysis of Underground Structure)

Abstract

:
Recently, subsea tunnel construction has developed rapidly in China. The traffic volume of subsea metro tunnels is large. Once a safety accident occurs, economic losses and social impacts will be extremely serious. To eliminate accidents in operational subsea metro tunnel structures, a health risk prediction method is proposed based on a discrete Bayesian network. Detecting and monitoring data of the tunnel structures in operation were used to evaluate the health risk by employing the proposed method. This method establishes a Bayesian network model for the health risk prediction of the shield tunnel structure through the dependency relationship between the health risk of the operational tunnel structure and 13 risk factors in five aspects: the mechanical condition, material performance, integrity state, environmental state, and deformation state. By utilizing actual detection and monitoring data of various risk factors for the health risk of the operational subsea metro shield tunnel structure, this method reflects the actual state of the tunnel structure and improves the accuracy of health risk predictions. The validity of the proposed method is verified through expert knowledge and the subsea shield tunnel structure of the Dalian Subway Line 5. The results demonstrate that the health risk prediction outcomes effectively reflect the actual service state of the shield tunnel structure, thus providing decision support for the control of health risks in the subsea metro shield tunnel.

1. Introduction

Subsea tunnels offer significant advantages such as minimal impact on the marine environment, all-weather accessibility, and no disruption to sea traffic, becoming the main means to cross straits, bays, and river mouths [1,2]. In recent years, Chinese subsea tunnel construction has entered a rapid development phase, with several world-class subsea tunnels completed, including the Xiamen Xiang’an Tunnel [3] and the Qingdao Jiaozhou Bay Tunnel [4]. China is also constructing and actively promoting the construction of multiple subsea tunnel projects, such as the Qingdao Jiaozhou Bay Second Tunnel, the Bohai Sea Tunnel, and the Qiongzhou Strait Cross-Sea Passage.
With the gradual increase in the tunnel service life, structural issues such as leakage and deterioration are inevitable, seriously affecting the health of the tunnel structure. Numerous operational accidents caused by the poor health status of tunnel structures have occurred both domestically and internationally in recent years, resulting in severe social losses [5]. Thus, the health risks prediction of tunnel structure is of great importance. Subsea tunnels operate under a high hydraulic pressure and strong infiltration pressures, facing greater risks of leakage. The stray electric currents arising from seawater and the long-term operation of subway trains’ electric traction are likely to cause electrochemical corrosion in the steel-reinforced concrete structure of subsea tunnels, reducing their load-bearing capacity. Therefore, risk factors such as high water pressure and strong corrosion affecting the long-term healthy operation of subsea metro tunnels are more complex, posing direct threats to the operational safety of the structures. Currently, operational tunnel risk prediction is primarily focused on multifaceted risk prediction during tunnel operations. Hou Jingyu et al. [6] utilized the Fuzzy Analytical Hierarchy Process (FAHP) method to predict operational tunnel risks, considering various elements such as civil engineering structures, mechanical and electrical facilities, accident prevention and management capabilities, and the traffic environment. Luo Yong et al. [7] employed the FAHP method to evaluate operational tunnels, taking into account road network factors, tunnel-related factors, driver factors, vehicle factors, and environmental aspects. Pan Zhengzhong et al. [8] utilized the Analytic Hierarchy Process (AHP) method for risk assessment of operational tunnels, considering factors such as tunnel characteristics, environmental factors, and management considerations. Wang Zhijie et al. [9] applied the AHP method for risk evaluation of operational tunnels, focusing on elements like tunnel alignment, tunnel features, traffic conditions, and tunnel lighting. However, there is limited prediction and evaluation of structural health risks in subsea tunnels. Thus, it is essential to establish a predictive model for the health risks of subsea metro tunnel structure.
Traditional risk assessment and prediction methods like the Analytic Hierarchy Process (AHP) [10,11,12,13], Fuzzy Analytical Hierarchy Process (FAHP) [14,15,16,17,18], Risk Matrix [19], Fault Tree Analysis (FTA) [20], Fuzzy Comprehensive Evaluation [21], Event Tree Analysis [22], and Monte Carlo simulations [23,24] have been widely applied and validated in engineering practice. They have played a crucial role in engineering risk assessments. However, with technological advancements, there has been a shift towards seeking more accurate and intelligent methods for risk prediction. Techniques like Neural Networks and Bayesian networks, brought forth by developments in computer technology, have been introduced into engineering risk analysis. For instance, Bayesian networks have been used for predicting the probability of existing pipeline failure [25], assessing underground construction risks [26] and evaluating tunnel operational risks [6]. Neural Networks improve prediction accuracy through data learning. These approaches leverage vast datasets and algorithms to assess or predict risks, showing high flexibility and adaptability, and holding significant potential for tunnel structural health risk prediction.
Currently, threshold warning methods, which directly utilize monitoring data, are commonly used for the operational monitoring of tunnel structures [27,28]. While capable of reflecting the true state of tunnel structures, this method struggles with the fluctuations in monitoring data caused by random factors during tunnel operation, often leading to high false alarm rates. There is an urgent need for more advanced methods to enhance the accuracy and effectiveness of early warnings. Therefore, it is crucial to explore health risk prediction methods for subsea metro shield tunnel structure that can fully utilize operational detection and monitoring data patterns and integrate monitoring indicators into the prediction.
Because of this, this article focuses on the prediction of health risks in operational subsea metro shield tunnel structures. Bayesian networks are applied to predict the health risks of operational subsea shield tunnels. The Noisy-OR gate and Noisy-MAX models [29,30] are used to calculate the conditional probabilities of variables. With Bayesian inference, a Bayesian network model for the prediction of health risks associated with the operational subsea metro shield tunnel structure is established, proposing a method for health risk prediction. This approach integrates statistical regularity from engineering site detection and monitoring data to forecast health risks in the operation of subsea metro shield tunnels. The rationality of the method proposed in this paper is verified by expert experience. Furthermore, using the subsea tunnel structure of the Dalian Metro Line 5 as a basis, the model conducts a health risk probability forecast to verify the effectiveness of the health risk prediction model proposed in this paper and provide decision support for health risk management during the operation.

2. Risk Prediction Method

2.1. Discrete Bayesian Network Model

A Bayesian network, also known as a belief network or causal network, combines probability theory with graph theory to represent a graphical structure that describes the dependency relationships between variables. At present, Bayesian networks are considered ideal tools for knowledge reasoning and prediction under uncertain environments [31,32]. A discrete Bayesian network is specific to handling discrete variables.
Establishing a network involves constructing the graphical structure of the discrete Bayesian network and determining the conditional probability tables. Figure 1 shows a discrete Bayesian network model where Figure 1a is a Directed Acyclic Graph (DAG) consisting of nodes A1, A2, …, An, B, and directed edges from nodes A1, A2, …, An to node B. In the graph, the originating nodes of directed edges A1, A2, …, and An are deemed parent node variables, and the destination node B is the child node variable. Directed edges from A1, A2, …, An to B represent the dependency relationships whereby the parent node variables A1, A2, …, An each influence the occurrence of the child node variable B. The strength of each dependency relationship expressed by a directed edge is quantified by the conditional probability of the child node variable occurring given that only the corresponding parent node variable occurs. If there is no direct connection between two nodes, these node variables are conditionally independent. In the discrete Bayesian network structure shown in Figure 1a, the parent node variable A1 has q possible states, the parent node variable An has r states, and the child node variable B has m states. The conditional probability table corresponding to the discrete Bayesian network structure shown in Figure 1a is exhibited in Figure 1b.
In the discrete Bayesian network model shown in Figure 1, the joint distribution of the discrete variables A1, A2, …, An, and B is decomposed into a product of conditional probabilities using the chain rule. Then, the product of conditional probabilities is reduced by exploiting the conditional independence of discrete variables A1, A2, …, An given discrete variable B. Consequently, the marginal probability distribution of discrete variable B is determined, as shown in Equation (1), which can predict the likelihood of occurrence of variable B. This article applies this formula to predict the likelihood of risk events during the operation of engineering projects.
P ( B ) = i = 1 n P ( A 1 , A 2 , , A n , B ) = i = 1 n i = 1 n P ( B | A i )

2.2. Conditional Probability

Due to the limited data on operational subsea shield tunnel structures of poor health status, expert experience is used to calculate conditional probabilities. However, calculating the conditional probability tables using expert experience can become excessively laborious. When building a Bayesian network for a complex project, the number of items in the conditional probability table increases exponentially with the number of parents. If the nodes are all in two states and node C has d parents, the conditional probability table of node C has 2d entries. When the conditional probability table is determined by experts, every expert needs to deal with the questionnaire 2d times. The workload is huge and it is not easy to operate. Calculating the conditional probability tables using expert experience can become excessively laborious and the workload will increase exponentially with the increase in the number of parent nodes. To address this, the article employs a Noisy-OR gate model based on expert experience [29] to calculate the conditional probabilities of binary states’ discrete variables within the Bayesian network, as shown in Equations (2) and (3). In Equation (2), p i represents the probability solely due to the occurrence of A i ; A T denotes the event A happening; and A i denotes the event A i not happening.
For multistate variables in the discrete Bayesian network, a Noisy-MAX model based on expert experience [30] is used for calculation, as demonstrated in Equations (4) and (5). The Noisy-MAX model also assumes the node variables to be ordinal, with the various states of a node variable arranged in a certain sequence, such as from low to high.
P ( B | A 1 , A 2 , , A n ) = 1 i : A i A T ( 1 p i )
p i = P ( B | A _ _ 1 , A _ _ 2 , , A i , , A _ _ n )
P ( B b | A ) = i B b P ( B = b | A = a i )
P ( B | A ) = P ( B b | A ) P ( B b 1 | A ) b b min P ( B b | A ) b = b min
The parameters in the Noisy-OR gate model and the Noisy-MAX model are determined through expert elicitation, as shown in Equation (6). Here, p i δ represents the probability of the i th risk factor being in the δ th state given B’s occurrence; ω δ i k denotes the weight coefficient by the k th expert for the δ th state of the i th risk factor occurring; ζ indicates the number of states for the i th risk factor; and μ represents the number of experts involved in the scoring process.
p i δ = k = 1 μ ω δ i k / δ = 1 ζ k = 1 μ ω δ i k
This method of calculating conditional probabilities ensures that the workload of experts increases linearly with the number of parent nodes, rather than exponentially. And the workload of experts is significantly reduced.

3. Health Risk Prediction Process of Operational Subsea Tunnel Structure

3.1. Health Risk Prediction Steps

The modeling process for predicting operational health risks typically includes the following steps:
(1)
Identifying the risk factors that affect the health of subsea metro shield tunnel structure in operation, and determining the state space of each risk factor. Establishing a risk indicator system for the health risks of the operational shield tunnel structure based on the relationships of these risk factors.
(2)
Using the probability of risk occurrence to establish the likelihood rating standards for the operational health risks of the subsea metro shield tunnel structure.
(3)
Learning the Bayesian network structure for the operational health risks of subsea metro shield tunnel structure.
(4)
Learning the parameters of the Bayesian network for the health risks of operational subsea metro shield tunnel structure by computing the conditional probabilities of the child nodes.
(5)
Inferring the probability of health risks for the operational subsea metro shield tunnel structure.
The construction process of the Bayesian network model is shown in Figure 2.

3.2. Risk Factors Identification

This article employs a combination of national standards, an understanding of the stress mechanism of subsea shield tunnel structure, expert knowledge, and practical research on tunnel structure detection and monitoring to identify the primary factors that contribute to the health risk of subsea tunnel structures during their operation. Practical research primarily involves determining the monitoring section, types and numbers of sensors, sensor arrangement, data collection frequency, and data transmission and storage methods, all of which are based on the geological and environmental conditions of the tunnel structure and its structural features. These factors encompass both internal and external influences that are encountered in the operation of subsea metro tunnel structure.
To establish a framework for analyzing these factors, they are classified into three levels: the target level, criteria level, and index level. This classification is based on their interdependencies and independent relationships, which are evaluated through the application of the Analytic Hierarchy Process (AHP).
Figure 3 presents an illustrative representation of the factors that influence the health risks associated with the operational subsea metro tunnel structure. In the structural health risk factors shown in Figure 3, the target level represents the health risk associated with the operational subsea metro tunnel structure. The criteria level consists of five risk factors that include mechanical condition (X1), material performance (X2), integrity state (X3), environmental state (X4), and deformation state (X5). Furthermore, the index level comprises 13 risk factors that have been identified as internal force in steel bars (X11), concrete strain (X12), corrosion of steel bars (X21), concrete strength (X22), concrete spalling (X31), concrete delamination (X32), concrete cracking (X33), structural water leakage (X34), surrounding rock pressure (X41), surrounding rock pore water pressure (X42), segment misalignment (X51), tunnel headroom convergence (X52), and tunnel vertical displacement (X53).
The health risk prediction model for operational subsea metro tunnel structure utilizes a probabilistic representation for risk probability levels. These levels are categorized into five distinct levels referring to the prevailing Chinese national standard [33]. From low to high, the five probability levels are impossibility of occurrence (level 1), rarity of occurrence (level 2), occasional occurrence (level 3), potential occurrence (level 4), and frequent occurrence (level 5) and the tunnel structure status and disposal measures corresponding to various levels of health risk are shown in Table 1.

3.3. Risk Prediction Based on Bayesian Networks

The method for constructing Bayesian network structures can be bifurcated into those predicated on direct causal relationships and those reliant on data-driven learning processes [34]. To directly formulate the architecture of discrete Bayesian networks founded on causal relationships, it becomes imperative to delineate the causal interconnections among the discrete variables, followed by the generation of a concomitant directed acyclic graph to delineate these relationships. In scenarios where an explicit delineation of causal relationships among discrete variables is absent or such relationships are exceedingly intricate for unambiguous identification, the architecture of discrete Bayesian networks may be synthesized through the identification of data patterns. The health risks associated with subsea metro shield tunnel structure in operation exhibit a direct correlation to influencing factors and the mutual dependencies among these factors. Thus, this paper delineates the construction of a Bayesian network predicated upon the causal relationships amongst risk factors; this involves the transmutation of the schematic derived from the Analytical Hierarchy Process (illustrated in Figure 3) into the framework of a discrete Bayesian network, as evidenced in Figure 4.
In a discrete Bayesian network structure, health risk associated with the operational subsea metro tunnel structures (R) is represented as a variable with five states, corresponding to five different levels of likelihood of risk occurrences. The variables for tunnel headroom convergence (X52) and vertical displacement (X53) are also included in the network and have multiple states. Other risk factors such as internal force in steel bars (X11) and strain in concrete (X12) are represented as variables with two states. The current Chinese national standard [35] divides variables with multiple states into four different states. Table 2 provides the specific limits for each state of the variables with multiple states.
The Noisy-OR gate model and the Noisy-MAX model are utilized to compute the conditional probabilities of binary and multistate variables in the child nodes, respectively. A survey questionnaire was employed to enlist experts from various stakeholders involved in the development, design, construction, oversight, and operation of subsea metro shield tunnel structure. In assessing the weights, considerations encompassed factors such as the experts’ tenure, background, and competence in the pertinent domain. The participating experts are categorized into four classes (with survey weights for experts of categories one through four being 1, 0.9, 0.8, and 0.7, correspondingly). The first category of experts (four individuals) incorporates distinguished professionals, the lead engineers of the design entity, and the heads of the construction entity’s civil engineering division; experts belonging to the second category (four individuals) are specifically chosen from design or construction organizations and typically comprise senior engineers who possess specialized knowledge in underground structural systems. Special emphasis is placed on their expertise in this domain. The third category of experts (six individuals) is derived from design or construction entities and encompasses senior engineers well-versed in underground structures, structure construction supervisors, quality inspectors from construction units, as well as technical managers from oversight units. The fourth category of experts (six individuals) originates from design or construction establishments and consists of engineers who specialize in underground structures, technical staff from construction units, and technicians from supervision units. To elucidate the method of computing conditional probabilities associated with child nodes, two demonstrative instances, respectively, highlighting the binary variable “Mechanical condition X1” and the multistate variable “Health risk associated with the operational subsea metro tunnel structure R” are employed.
The probability of the “Mechanical condition X1” being compromised due to the adverse effects in the “Internal force in steel bars X11” is determined by experts specialized in underground structure. A survey was conducted among 20 experts, including 3 experts from the first category, 3 experts from the second category, 6 experts from the third category, and 6 experts from the fourth category. These experts unanimously agreed that only when there is excessive internal force in steel bars during operation, the mechanical condition of the tunnel structure can become unfavorable. According to Formula (6), the probability p 11 is calculated to be 0.886.
p11 = (1 × 3 + 0.9 × 3 + 0.8 × 6 + 0.7 × 6)/(1 × 4 + 0.9 × 4 + 0.8 × 6 + 0.7 × 6) = 0.886.
Similarly, the probability p 12 is calculated to be 0.145 using the same approach. Based on Formulas (2) and (3), the conditional probabilities of the “Mechanical condition X1” node are determined as shown in Table 3. In the table, X11 = Y represents an excessive internal force in steel bars, X11 = N represents a non-excessive internal force in steel bars, X12 = Y represents excessive concrete strain, X12 = N represents non-excessive concrete strain X1 = Y represents an unfavorable mechanical condition, and X1 = N represents a favorable mechanical condition.
The probabilities of adverse occurrence of “Mechanical condition X1” causing the “Health risk associated with the operational subsea metro tunnel structure R” to be at levels 1 to 5 are determined by experts. The probabilities of levels 1 to 5 are denoted by p r 1 1 to p r 5 1 respectively.
Taking the calculation of p r 5 1 as an example to illustrate the calculation process, out of the 20 experts, 2 experts from each category (the first category to the fourth category) believed that only when the “Mechanical condition X1” is adverse, the “Health risk associated with the operational subsea metro tunnel structure R” will be at level 5. According to Formula (6), the probability p r 5 1 is calculated to be 0.410. Using the same approach, p r 4 1 = 0.253, p r 3 1 = 0.205, p r 2 1 = 0.090, and p r 1 1 = 0.042.
From Figure 4, it can be observed that the discrete variable R has parent nodes X1 to X5. Similarly, the probabilities of the adverse occurrence of R at levels 1 to 5 are determined when only a single parent node occurs. Then, using Formulas (4) and (5), the conditional probabilities of the node R are obtained as shown in Table 4. Due to space limitations, only the status combinations of the parent nodes X1 = Y are listed. Here, the variables X1, X2, X3, X4, and X5 represent different aspects of the tunnel’s condition. X1 = Y represents an unfavorable mechanical condition, X2 = Y represents poor material performance, X3 = Y represents a compromised integrity state, X4 = Y represents adverse environmental conditions, and X5 = Y represents a problematic deformation state. Conversely, X1 = N, X2 = N, X3 = N, X4 = N, and X5 = N represent favorable conditions in each respective aspect.
Netica is a powerful and widely used Bayesian network computing software developed by NORSYS Software Company, Vancouver, BC, Canada in 1992. In this paper, Netica software (v7.01) is used to build the Bayesian network model. According to Equation (1), the probability of health risk of operational subsea tunnel structure is predicted.

4. Validation of Health Risk Prediction Model for Operational Subsea Tunnel Structures

Due to the lack of data on the poor health status of the operational subsea metro shield tunnels, the validity of the risk prediction model proposed in this paper is verified using expert experiential knowledge. Insight into the risk factors leading to the poor health status of subsea metro shield tunnels is obtained through an expertly informed survey questionnaire. The risk factors that contribute to the poor health of the subsea tunnel structure are shown in Figure 3. The experts selected, the expert weights, and the calculation method for prior probabilities are the same as those described in Section 3.3 of this article.
Subsequently, the prior probabilities of each parent node are deduced via Formula (6), as shown in Table 5. Utilizing the Noisy-OR gate model and the Noisy-MAX model, the conditional probabilities of the child nodes are calculated, as shown in Table 3 and Table 4.
The health risk prediction of the Bayesian network model for the operational subsea metro shield tunnel is constructed with Netica software (v7.01). The framework of the discrete Bayesian network, as evidenced in Figure 4, is used to construct the structure of the health risk Bayesian network model of the operational subsea metro shield tunnel. Subsequently, the prior probabilities of parent nodes and the conditional probabilities of the child nodes are allocated to each node to facilitate the formulation of the health risk prediction model and the likelihood of health risk of the operational subsea metro shield tunnel is inferred through Formula (1).
The calculation results are shown in Figure 5. As can be seen from the figure, the inference made using the Bayesian network established in this paper indicates that the probabilities of health risk occurrence for operational subsea metro shield tunnel structure at levels 4 and 5 are the highest, at 22.9% and 32.5%, respectively, which demonstrates that the risk prediction model established in this paper is capable of effectively predicting the health risk of operational subsea metro shield tunnel structure.

5. Case Study

5.1. Overview of the Structural Engineering of the Dalian Subsea Metro Tunnel

The subsea section of the Dalian subsea tunnel extends to 2310 m in length, representing the first instance globally of a large-diameter, single-bore, double-track shield tunnel engineered through a karstic geological formation. Its geographical position is shown in Figure 6. The construction exhibits a minimal burial depth of 12.2 m and attains a maximal subaqueous depth of 14 m. The geological conditions encountered are intricate, predominantly encompassing moderately weathered dolomitic limestone, karst formation, moderately weathered calcareous slate, and moderately weathered slate formations, accompanied by the intrusion of diabase veins. The superincumbent layer at the zenith of the tunnel chiefly consists of silt, silty soil, and silty clay, with certain regions interspersed with a minor quantity of gravel strata. Engineered with an extensive shield mechanism, the tunnel manifests an external diameter of 11.8 m, an internal diameter of 10.2 m, a segmental thickness of 0.5 m, a ring breadth of 2 m, and a secondary lining thickness of 0.3 m. Marking a pioneering endeavor worldwide, as the first substantial shield tunnel fabricated through a subsea karstic zone, the excavation construction was conclusively realized successfully in early 2021.

5.2. General Situation of the Health Monitoring System of the Dalian Subsea Tunnel Structure

The Health Monitoring System devised for the Dalian Metro Line 5 subsea tunnel structure represents a comprehensive online monitoring framework that integrates aspects of structural monitoring and assessment, system identification, data integration, and early warning mechanisms. This system adopts a synthesized strategy, utilizing both point-specific vibrating wire sensors and spatially distributed optical fiber sensors. This combined technique allows for a thorough and diverse examination of the tunnel infrastructure’s performance state. Specifically, the monitoring scope includes variables such as the strain of concrete, internal force in steel bars, steel corrosion, seismic accelerations, segment misalignment, tunnel headroom convergence, tunnel vertical displacement, surrounding rock pressure, surrounding rock pore water pressure, as well as thermal variances. The positioning of some sensors is depicted in Figure 7. Furthermore, Table 6 systematically details the monitoring content, monitoring index, and the corresponding sensor type.

5.3. Health Risk Prediction of the Dalian Subsea Tunnel Structure

The discrete Bayesian network prediction method proposed in this article is used to predict the health status of the Dalian subsea shield tunnel structure. The occurrence probability of each health risk factor is obtained through on-site detection and monitoring data input as evidence into the Bayesian network model. Subsequently, the health status of the structure is predicted by inference which is compared with the actual project status to verify the effectiveness of the prediction model proposed in this paper from an engineering application case.
To predict the operational health risk by applying the risk prediction model presented in this paper, detecting and monitoring data of the subsea subway tunnel structure of the Dalian Metro Line 5 from April 2021 to September 2023 were selected. Based on an analysis of data validity, the occurrence probabilities of factors affecting the health risks of the subsea tunnel structure were statistically analyzed, which is shown in Table 7. These probabilities are used as evidence input into the Bayesian network model for predicting the health risks of the subsea shield tunnel structure using the computing software Netica (v7.01). The resulting inference of the health risks of the subsea tunnel structure of the Dalian Metro Line 5 is shown in Figure 6.
The analysis showed that it is highly unlikely for a health risk event to occur in the operational state of the subsea tunnel structure, with a probability of about 100%, as shown in Figure 8. This finding is consistent with the actual operational status of the tunnel structure, indicating the rationality of the proposed health risk prediction method in this study.

6. Conclusions and Suggestion

Subsea metro shield tunnels have a large volume of traffic. It is extremely difficult to carry out rescues after an accident and the poor health status of the tunnel structure is the main cause of tunnel structural safety accidents. To eliminate operational structural safety accidents, reduce operational risks, and ensure the health of the structure in operation, this paper proposes a discrete Bayesian network prediction method for the health risk of the undersea subway shield tunnel structure in operation, utilizing a discrete Bayesian network and expert experience, and integrating engineering detection and monitoring data. The main conclusions are as follows:
(1)
The health risk prediction method for the operational subsea metro shield tunnel structure is proposed based on a discrete Bayesian network, Noisy-OR gate model, and Noisy-MAX model, combining with engineering detection and monitoring data of 13 risk factors in five aspects such as structure mechanical condition, material properties, structural integrity state, environmental state, and structural deformation state.
(2)
The Noisy-OR gate and Noisy-MAX models are used to calculate the conditional probabilities of variables, which ensures that the workload of experts increases linearly with the number of parent nodes, rather than exponentially. And the workload of experts is significantly reduced.
(3)
Based on the proposed health risk prediction method and expert experience with tunnel structures of poor health status, it is calculated that the probability of structural health risk is at level 4 and level 5, reaching 22.9% and 32.5%, respectively. It shows the rationality of the prediction model proposed in this paper.
(4)
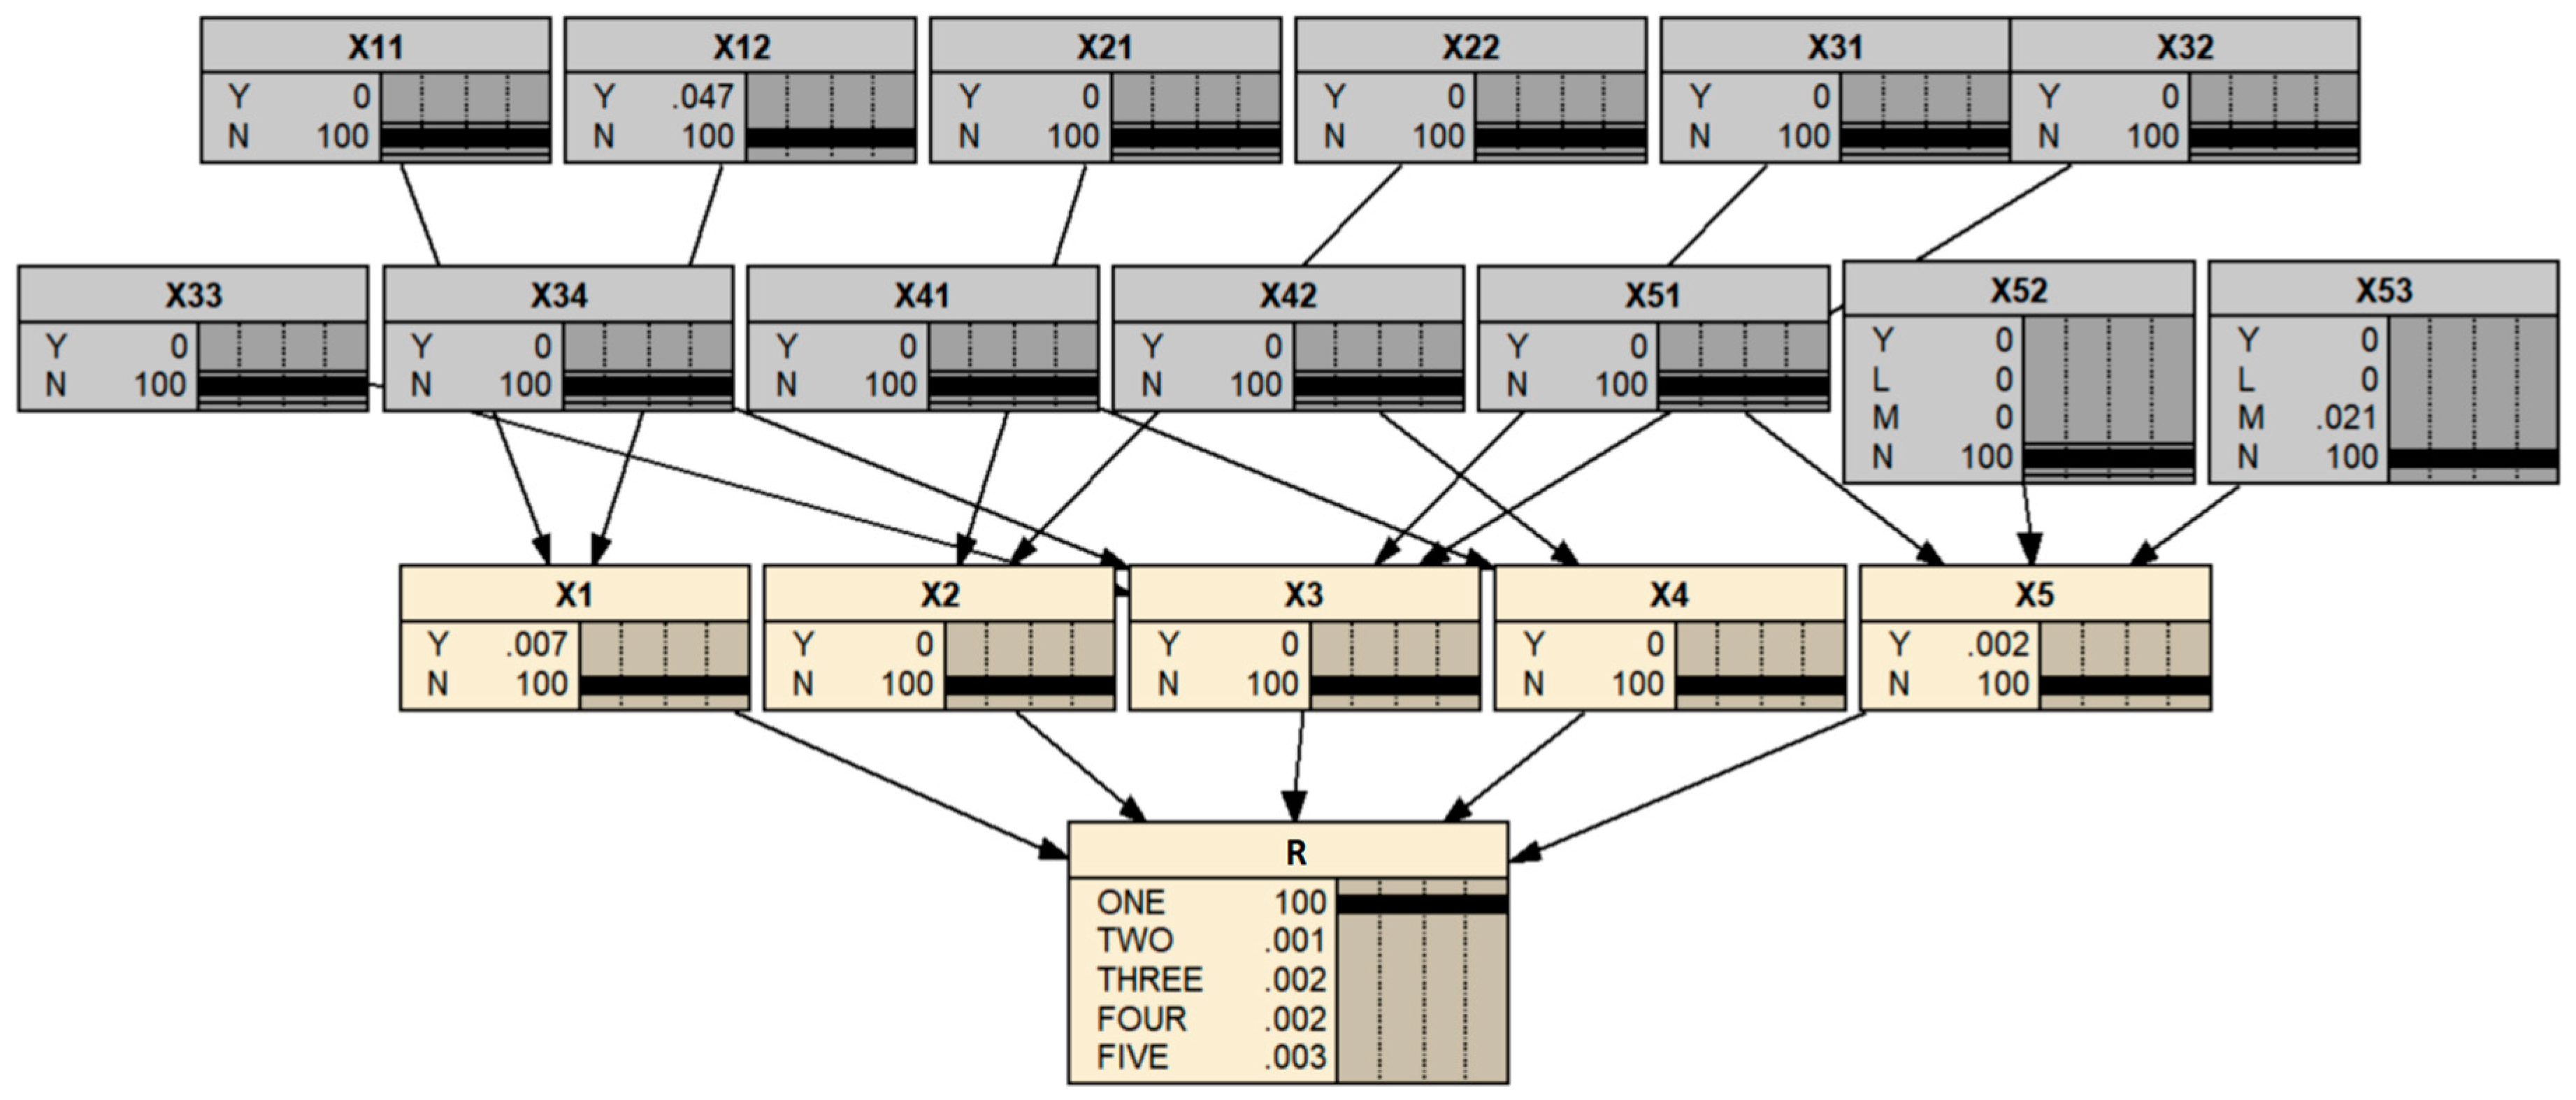
The proposed health risk prediction method is used to predict the health risk of the Dalian subsea metro tunnel structure. The health risk prediction outcomes are consistent with the actual operational status, which verifies the rationality of the method and provides decision support for health risk management.
(5)
Based on the proposed health risk prediction method, health risk prediction is carried out by combination with engineering field detection and monitoring data, which effectively reflect the real service state of the shield tunnel structure.
In addition, the Dalian Metro subsea tunnel structure is in the early stage of operation, and the health condition of the structure is good. With the increase in operation time in the future, the state space of risk factors will be more complex. The study of the health risk of the tunnel structure will be followed up to improve the health risk prediction model. At the same time, the risk factors need to be adjusted when the method proposed in this paper is applied to other types of tunnel structures.

Author Contributions

Conceptualization, H.N. and X.L.; methodology, H.N. and X.L.; software, H.N. and J.H.; validation, S.Z. and J.H.; formal analysis, S.Z. and J.H.; investigation, X.L. and S.Z.; resources, X.L. and S.Z.; data curation, H.N. and J.H.; writing—original draft preparation, H.N. and X.L.; writing—review and editing, H.N. and X.L.; visualization, H.N. and J.H.; supervision, S.Z. and J.H.; project administration, X.L. and J.H.; funding acquisition, S.Z. and X.L. All authors have read and agreed to the published version of the manuscript.

Funding

This work was funded by the Yunlonghu Laboratory Project of Deep Earth Science and Engineering (Grant No. 1040230030, the National Key Research and Development Program (Grant No. 2022YFC3003305). This support is gratefully acknowledged.

Data Availability Statement

The data presented in this study are available on request from the corresponding author. The data are not publicly available due to privacy.

Acknowledgments

We are grateful to the anonymous reviewers for their constructive comments.

Conflicts of Interest

The authors declare no conflicts of interest.

References

  1. Xiao, M.Q. Reprcsentativc projecis and development trend of underwater shield lunnels in China. Tunn. Constr. 2018, 38, 360–371. [Google Scholar]
  2. Chen, J.Q.; Feng, X.Y.; Wei, H.; Feng, H.H. Statistics on underwater tunnels in China. Tunn. Constr. 2021, 41, 483–516. [Google Scholar]
  3. Li, J.; Wei, D.H.; Cao, Y.Y.; Du, H.G. Geophysical prospecting for Xiang an Submarine Tunnel in Xiamen. J. Railw. Eng. Soc. 2010, 144, 27–31. [Google Scholar]
  4. Pan, G.D.; Zhou, S.M.; Duan, W.Z. Risk assessment and contrl of grouting construction of Qingdao Jiaozhouwan tunnel in subsea zone. J. Shi Jia Zhang Tiedao Univ. (Nat. Sci.) 2010, 23, 53–57. [Google Scholar]
  5. Xu, H.Y. Research on Risk Assessment of Operational Tunnelucture Based on Bayesian Network. Master’s Thesis, Hu Bei University of Technology, Wuhan, China, 2023. [Google Scholar]
  6. Hou, J.Y.; Yang, Q.X.; Guo, C. Study on Comprehensive Evaluation of Operation Safety of Long Highway Tunnel. Railw. Stand. Des. 2015, 59, 88–91+109. [Google Scholar]
  7. Luo, Y.; Li, Y.W.; Yuan, J.W.; Liu, D.G.; Wang, M.N. Study on Risk Assessment of Highway Tunnel Operational Safety. Mod. Tunn. Technol. 2016, 53, 25–30. [Google Scholar]
  8. Pan, Z.Z.; Wu, H.B.; Liao, J.H.; Wang, R.G. Study of Risk Management Techniques for Expressway Tunnels at Operation Phase. High Way 2017, 62, 141–146. [Google Scholar]
  9. Wang, Z.J.; Wang, R.L.; Shu, Y.X.; Wei, R.; Wang, Z.J.; Tan, J. Study on operation safety risk assessment of the extra-long expressway tunnel and tunnel group. Mod. Tunn. Technol. 2019, 56 (Suppl. S2), 36–43. [Google Scholar]
  10. Xu, C.; Liu, X.L.; Wang, E.Z.; Wang, S.J. Prediction and classification of strain mode rockburst based on five-factor criterion and combined weight-ideal point method. Chin. J. Geotech. Eng. 2017, 39, 2245–2252. [Google Scholar]
  11. Luo, Y.P.; Gao, G.F.; Wu, H.L. Study on Fuzzy evaluating system of traffic safety in higyway tunnel. J. Shi Jia Zhang Tiedao Univ. 2006, 19, 75–79. [Google Scholar]
  12. Gong, H.J. Reseath of Operation Safety Comprehensive Evaluation on the Tunnel of Freeway. Ph.D. Thesis, Chang’an University, Xi’an, China, 2009. [Google Scholar]
  13. Cheng, Y.; Liu, Z.B.; Liu, S.Y.; Cai, G.J.; Tong, L.Y. Risk recognition of construction of large-span and shallow buried-highway tunnels based on analytic hierarchy process. Chin. J. Geotech. Eng. 2011, 33 (Suppl. S1), 198–202. [Google Scholar]
  14. Khademi Hamidi, J.; Shahriar, K.; Rezai, B.; Rostami, J.; Bejari, H. Risk assessment based selection of rock TBM for adverse geological conditions using Fuzzy-AHP. Bull. Eng. Geol. Environ. 2010, 69, 523–532. [Google Scholar] [CrossRef]
  15. Aliahmadi, A.; Sadjadi, S.J.; Jafari-Eskandari, M. Design a new intelligence expert decision making using game theory and fuzzy AHP to risk management in design, construction, and operation of tunnel projects (case studies: Resalat Tunnel). Int. J. Adv. Manuf. Technol. 2011, 53, 789–798. [Google Scholar] [CrossRef]
  16. Liu, H.; Sun, S.M.; Zhang, X.M. Study and application of safety fuzzy assessment model for highway tunnel construction. Mod. Tunneling Technol. 2008, 45, 5–9. [Google Scholar]
  17. Liu, W. Risk Assessment and Its Application in Mountain Highway Tunnel Construction. Master’s Thesis, Changan University, Xi’an, China, 2011. [Google Scholar]
  18. Ma, A.Z. Research on Safety Risk Assessment and Its Application in Long and Large Tunnel Construction. Master’s Thesis, Southwest Jiaotong University, Chengdu, China, 2016. [Google Scholar]
  19. Tian, Y.; Ma, R.J.; Chen, A.R. Safety risk assessment for interactive influences between adjacent and parallel high-speed railway bridges and highway. J. Vib. Shock. 2016, 35, 69–75. [Google Scholar]
  20. Hyun, K.C.; Min, S.; Choi, H. Risk analysis using fault-tree analysis (FTA) and analytic hierarchy process (AHP) applicable to shield TBM tunnels. Tunn. Undergr. Space Technol. 2015, 49, 121–129. [Google Scholar] [CrossRef]
  21. Wang, Z.C.; Lu, B.Q.; Li, S.C. Risk assessment for an underground crude oil storage facility with water-curtaining system during construction phase. Chin. J. Geotech. Eng. 2015, 37, 1057–1067. [Google Scholar]
  22. Špačková, O.; Novotná, E.; Šejnoha, M. Probabilistic models for tunnel construction risk assessment. Adv. Eng. Softw. 2013, 62, 72–84. [Google Scholar] [CrossRef]
  23. Jiang, S.H.; Yang, J.H.; Yao, C. Quantitative risk assessment of slop failure considering spatial variability of soil properties. Eng. Mech. 2018, 35, 136–147. [Google Scholar]
  24. Kampmann, J.; Eskesen, S.; Summers, J. Risk assessment helps select the contractor for the Copenhagen Metro System. Proc. World Tunn. Congr. 1998, 98, 123–128. [Google Scholar]
  25. Xiang, W.; Zhou, W. Bayesian network model for predicting probability of third-party damage to underground pipelines and learning model parameters from incomplete datasets. Reliab. Eng. Syst. Saf. 2021, 20, 107–262. [Google Scholar] [CrossRef]
  26. Lu, X.Y.; Xu, C.S.; Hou, B.W. Risk assessment of metro construction based on dynamic Bayesian network. Chin. J. Geotech. Eng. 2022, 44, 492–501. [Google Scholar]
  27. Xu, X.L.; Ma, W.B.; Cai, D.G. Research on the whole life cycle detection and monitoring system of railway tunnel. Mod. Tunn. Technol. 2021, 58, 31–40. [Google Scholar]
  28. Huang, Z.; Fu, H.L.; Huang, H.C.W. A method for evaluating the structural health status of shield tunnel in operating subway. J. Undergr. Space Eng. 2018, 14, 1410–1418. [Google Scholar]
  29. Zagorecki, A.; Druzdzel, M.J. An empirical study of probability elicitation under Noisy-or assumption. In Proceedings of the American Association for Artificial Intelligence Flairs Conference, Miami Beach, FL, USA, 17–19 May 2004. [Google Scholar]
  30. Rui, M.; Yadi, W. Knowledge engineering for Bayesian networks: How common are Noisy-max distributions in practice. IEEE Trans. Syst. Man Cybern. Syst. 2013, 43, 186–195. [Google Scholar]
  31. Gao, X.L.; Chen, H.Y. Discrete Dynamic Bayesian Network Inference and Its Application; National Defense Industry Press: Beijing, China, 2016. [Google Scholar]
  32. Weber, P.; Medina-Oliva, G.; Simon, C.; Lung, B. Overview on Bayesian networks applications for dependability, risk analysis and maintenance areas. Eng. Appl. Artif. Intell. 2012, 25, 671–682. [Google Scholar] [CrossRef]
  33. GB 50652-2011; Code for Risk Management of Underground Works in Urban Rail Transit. China Standards Press: Beijing, China, 2011.
  34. Zhang, L.W.; Guo, H.H. Introduction to Bayesian Networks; Science Press: Beijing, China, 2006. [Google Scholar]
  35. GB 39559.3-2020; Specifications for Operational Monitoring of Urban Rail Transit Facilities—Part 3: Tunnel. China Standards Press: Beijing, China, 2020.
Figure 1. Schematic graph of discrete Bayesian network. (a) A directed acyclic graph; (b) conditional probability table.
Buildings 14 01475 g001
Figure 2. Construction process of Bayesian network.
Buildings 14 01475 g002
Figure 3. Health risk factors of subsea metro shield tunnel structure.
Buildings 14 01475 g003
Figure 4. Bayesian network framework for the health risk of operational subsea metro tunnel structure.
Buildings 14 01475 g004
Figure 5. DBN model for health risk prediction of operational subsea tunnel structure (unit: %).
Buildings 14 01475 g005
Figure 6. Geographical location of the metro tunnel in Dalian.
Buildings 14 01475 g006
Figure 7. Schematic diagram of sensor setup in shield tunnel structure.
Buildings 14 01475 g007
Figure 8. Health risk probability of subsea tunnel structure of the Dalian Metro Line 5 (unit: %).
Buildings 14 01475 g008
Table 1. Tunnel structure status and disposal measures corresponding to various levels of health risk.
LevelTunnel Structure StatusDisposal Measures
Level 1ExcellentNormal operation, regular monitoring
Level 2GoodNormal operation, enhanced monitoring
Level 3FairNormal operation, requiring maintenance
Level 4PoorConducting a safety assessment to determine whether to restrict the use
Level 5Very poorConducting a safety assessment to determine whether to stop the use
Table 2. The limits for states of the variables with multiple states.
StateTunnel Headroom ConvergenceTunnel Vertical Displacement
N<6‰<1 mm/a
M≥6‰, <9‰≥1 mm/a, <3 mm/a
L≥9‰, <12‰≥3 mm/a, <10 mm/a
Y≥12‰≥10 mm/a
Table 3. Conditional probability of the node “Mechanical condition X1”.
X11X12X1 = YX1 = N
YY0.5640.436
YN0.2050.795
NY0.4520.548
NN0.0001.000
Table 4. Conditional probability of the node “Health risk associated with the operational subsea metro tunnel structure R”.
Stress
State
X1
Material
Performance
X2
Integrity
State
X3
Environmental
Conditions
X4
Deformation
State
X5
Likelihood Level of Health Risk
Impossible
(r = 1)
Rare
(r = 2)
Occasional
(r = 3)
Possible
(r = 4)
Frequent
(r = 5)
YYYYY0.0000.0000.0040.0710.925
YYYYN0.0000.0000.0060.0720.922
YYYNY0.0000.0020.0230.2200.754
YYYNN0.0000.0040.0300.2120.754
YYNYY0.0000.0010.0090.0970.893
YYNYN0.0000.0010.0120.0980.889
YYNNY0.0000.0080.0480.2770.666
YYNNN0.0020.0160.0580.2730.651
YNYYY0.0000.0010.0190.1070.873
YNYYN0.0000.0030.0240.1060.867
YNYNY0.0000.0160.0980.2840.601
YNYNN0.0020.0310.1200.2640.584
YNNYY0.0000.0050.0390.1360.819
YNNYN0.0020.0090.0480.1300.812
YNNNY0.0090.0580.1880.3110.435
YNNNN0.0420.0900.2050.2530.410
Table 5. Prior probabilities of risk factors (unit: %).
Categories of risk factorsX1X2X3X4
Risk factor indicatorsX11X12X21X22X31X32X33X34X41X42
Risk factor statusYYYYYYYYYY
Prior probability28323325222135353233
Categories of risk factorsX5
Risk factor indicatorsX51X52X53
Risk factor statusYNMLYNMLY
Prior probability421320323510213435
Table 6. Structure monitoring content and sensor type.
NumberMonitoring ContentMonitoring IndexSensor Type
1Structural mechanical conditionInternal force in steel barsInstrumented rebar
2Strain of concreteConcrete strain meter
3Structural loadSurrounding rock pressureTotal pressure cell
4Surrounding rock pore water pressureVibrating wire piezometer
5Durability of structureSteel corrosionAnode ladder
6Structural vibrationAccelerationAccelerometer
7Structure leakingLeakageDistributed optical fiber
8Structural distortionSegment misalignment, Tunnel vertical displacementDistributed optical fiber
Table 7. Measured probability of evidence node variables (unit: %).
Categories of risk factorsX1X2X3X4
Risk factor indicatorsX11X12X21X22X31X32X33X34X41X42
Risk factor statusYYYYYYYYYY
Measured probability00.00100000000
Categories of risk factorsX5
Risk factor indicatorsX51X52X53
Risk factor statusYNMLYNMLY
Measured probability010000.99990.000100
Disclaimer/Publisher’s Note: The statements, opinions and data contained in all publications are solely those of the individual author(s) and contributor(s) and not of MDPI and/or the editor(s). MDPI and/or the editor(s) disclaim responsibility for any injury to people or property resulting from any ideas, methods, instructions or products referred to in the content.

