Article

Illumina Sequencing and Metabolomic Analysis Explored the Effects of the Mixed Silage of Rice Straw and Chinese Cabbage Waste on Fecal Microorganisms and Metabolites in Hu Sheep

1
College of Animal Science, Xinjiang Agricultural University, Urumqi 830091, China
2
Laboratory of Metabolic Manipulation of Herbivorous Animal Nutrition, College of Animal Science and Technology, Yangzhou University, Yangzhou 225009, China
3
State Key Laboratory of Sheep Genetic Improvement and Healthy Production, Xinjiang Academy of Agricultural Reclamation Sciences, Shihezi 832000, China
*
Authors to whom correspondence should be addressed.
These authors contributed equally to this work.
Fermentation 2024, 10(5), 233; https://doi.org/10.3390/fermentation10050233
Submission received: 19 February 2024 / Revised: 1 April 2024 / Accepted: 4 April 2024 / Published: 26 April 2024
(This article belongs to the Special Issue Application of Fermentation Technology in Animal Nutrition)

Abstract

:
Silage is the most important component of a ruminant diet and has important production and health significance in ruminant production. The aim of the research was to investigate how the mixed silage of Chinese cabbage waste and rice straw (mixed silage) impacts the fecal microorganisms and metabolites in Hu sheep using Illumina sequencing and metabolomic analysis. A total of 16 Hu sheep (8 rams and 8 ewes) weighing about 39 kg and 5.5 months old were used as experimental sheep and divided into two groups (4 rams and 4 ewes, n = 8) using the principle of randomized trials: the control group with peanut sprouts, corn husks, and sorghum husks as roughage and the silage group with the mixed silage as roughage. There were no significant differences in the average daily gain (ADG), dry matter intake (DMI), or feed conversion rate (FCR) between the control group and the mixed silage groups (p > 0.05). Microbiome results showed that 15 microorganisms such as Ruminococcaceae UCG 010, Breznakia, Erysipelothrix, Desulfovibrio, Succiniclasticum, and Shuttleworthia were significantly different between the two groups. In addition, metabolomics showed that the mixed silage modulated the concentrations and metabolic pathways of metabolites in the manure. Significantly different metabolites were mainly enriched in amino acid anabolism (“glycine, serine, and threonine metabolism”, “valine, leucine, and isoleucine biosynthesis”, “arginine biosynthesis”, etc.), nucleic acid metabolism (pyrimidine metabolism). In conclusion, the addition of mixed silage to the diet of Hu sheep can alter the structure of the hindgut microflora and regulate the metabolism of amino acids and nucleotides, which affects health performance.

1. Introduction

Between 2005 and 2050, global demand for meat and milk will increase by 57% and 48%, respectively, which is a huge challenge for the livestock industry [1]. Forage resources of sufficient quality and quantity are necessary to meet human demand for animal products. However, this is a great challenge for most countries. Therefore, researchers are turning to unconventional feed ingredients. Most non-conventional feeds have limited nutritional value, and some modifications should be considered before feeding to ruminants for optimal performance. Silage is an effective and widely used technology for long-term preservation of feed, with the characteristics of low cost and easy operation [2]. Silage is the most important component of ruminant diets and has important production and health implications in ruminant production by maintaining good rumen functional status and reducing the risk of diseases such as rumen acidosis and crumpled stomach displacement [3].
The nutritional value of rice straw is low, with protein content only accounting for 2–5% of dry matter (DM), fiber and lignin content exceeding 50%, and DM digestibility being low, resulting in feed intake of 1.5–2.0% [4]. Therefore, rice straw can be used as a good source of roughage for ruminants only after further treatment. Typically, rice straw stalks are harvested and collected after wilting and drying to yellow stalks. During the air-drying process, the water in the rice straw is almost completely evaporated, so the free sugar in the air-dried rice is difficult to obtain. Therefore, lower water-soluble carbohydrates and a higher lignin content will seriously affect the quality of silage [5]. In this regard, vegetable waste has high water-soluble carbohydrates and moisture content, which can make up for the shortcomings of rice straw in silage [6]. Previous research results showed that when the mixed feed of broccoli byproducts and wheat straw (ratio 69:31) in the DM diet does not exceed 200 g/kg, the growth performance and apparent digestibility of nutrients and rumen fermentation parameters of Fashandy lambs will not be affected [7].
Fecal samples are not only convenient to collect, but also have a unique metabolome of nutrients from feed, gut microbiota, and host products [8]. Due to the emergence of high-throughput sequencing technology, we have a deeper understanding of the composition, structure, and interactions of microorganisms in the gastrointestinal tract of livestock and poultry [9]. The gut microbiota plays a crucial role in the regulation of carbohydrates, amino acids, lipids, vitamins, and mineral metabolism [10,11], along with influencing the immune system of the host [12,13]. Studies have shown that dietary changes can alter the microflora structure of the gut [14,15]. Studies have explored the impact of gut microbiota on metabolic function through metabolomics approaches. Metabolomics is a high-throughput sequencing technology, following genomics and proteomics, that provides new insights into the effects of diet, drugs, and disease, and aims to characterize and quantify all small molecules in a sample [16]. It has been used in recent years to detect plasma, fecal, rumen, and tissue metabolite biomarkers in humans and animals [17,18,19,20].
There is limited information on the effect of the mixed silage as an unconventional roughage on the fecal microbiota and metabolites in Hu sheep. Therefore, the purpose of this study was to explore the effects of the mixed silage on hindgut microbiota composition and fecal metabolites in Hu sheep using 16s RNA gene sequencing technology and LC-MS metabolomics.

2. Materials and Methods

2.1. Experimental Diet, Experimental Animals, and Feeding

The mixed silage was made based on previous research [15]. A total of 16 Hu sheep (8 rams and 8 ewes) weighing about 39 kg and 5.5 months old were used as experimental sheep and divided into two groups (4 rams and 4 ewes, n = 8) using the principle of randomized trials: the control group with peanut sprouts, corn husks, and sorghum husks as roughage and the silage group with the mixed silage as roughage. The feed formulation was designed based on the nutritional requirements of mutton sheep (NRC, 2007) [21]. The entire experiment spanned 35 days, consisting of a preliminary 7-day pre-feeding phase followed by an official 28-day trial period. All the Hu sheep in the experiment were raised together in one pen, and prior to the study, the sheep enclosure underwent cleaning and disinfection. Both control and silage groups were fed 50% roughage and 50% concentrate in equal portions at 8:00 and 18:00. Table 1 provides the dietary composition and nutrient levels for both the control and silage groups. Before entering the sheep house, all test sheep received uniform deworming and immunization. Throughout the experiment, a feeding management system with unlimited access to food and water was implemented.

2.2. Sample Collection and Measurement

2.2.1. Growth Performance

During the experiment, the quantity of feed and remaining feed for every sheep were documented, and DMI was calculated. Each sheep was weighed before the start of the formal trial and at the end of the experiment before the morning feed to record its body weight, and ADG was calculated. Feed efficiency is expressed as FCR, which is the ratio of DMI to ADG.

2.2.2. Fecal Sample Collection

On the eve of concluding the feeding experiment, random rectal fecal samples were gathered from six Hu sheep in each group, with each individual sample weighing approximately 30 g. The samples were rapidly placed in liquid nitrogen to avoid the influence of environmental microorganisms on the samples. Subsequently, they were transferred to a −80 °C refrigerator for storage and used for the determination of fecal microorganisms and metabolomes.

2.2.3. 16S rRNA Microbial Community Analysis

Total DNA was extracted from 12 fecal samples using the HiPure Soil DNA Kit soil DNA extraction kit (Beijing Tiangen Biochemical Technology Co., Ltd., Beijing, China). The A260/A280 values were measured by an ultramicro-volume spectrophotometer (NzanoDrop-1000, Thermo Fisher Scientific Co., Ltd., Waltham, MA, USA), and electrophoresis was carried out using a 1% agarose gel to check the integrity and purity of the extracted DNA. Primers 341F (5′-CCTACGGGGGNGGCWGCAG-3′) and 806R (5′-GGACTACHVGGGGTWTCTAAT-3′) were used for PCR amplification of the V3 to V4 region of the 16S rDNA gene. The PCR amplification system was a 30 μL reaction system, which included 15 μL of 2 × Phanta Master Mix, 1 μL of Bar-PCR primer F (10 μM), 1 μL of Primer R (10 μM), 10 ng of Genomic DNA, and ddH2O. Thermal cycling conditions were pre-denaturation at 95 °C for 5 min, followed by denaturation at 95 °C for 30 s, annealing at 55 °C for 30 s, and extension at 72 °C for 45 s for 27 cycles; the final extension was at 72 °C for 10 min. After the PCR is completed, the products are extracted by 2% agar gel electrophoresis and further purified and quantified. The Illumina Novaseq PE250 platform was used to sequence the amplified products (Genepioneer Biotechnologies Co., Ltd., Nanjing, China).
The raw sequenced sequences were quality controlled and spliced using fastp (V 0.20.0) and FLASH (V 1.2.7) software, respectively [22,23]. The quality sequences were clustered at a 97% similarity level according to UCLUST (V.1.2.22q) software to obtain each OTU. The taxonomic information of the species corresponding to each OTU can be obtained by comparing the OTUs with the SILVA rRNA database [24].
OTU-based dilution curves were used to evaluate sequencing coverage depth and were accomplished with the R (V 4.0.2) “vegan”. Fecal microbial Venn diagrams were calculated with R (V 4.0.2) “VennDiagram” and visualized with “ggplot2”. Microbial richness (ACE and Chao1 indices), microbial diversity (Shannon and Simpson indices), and microbial coverage (goods_coverage) were calculated using the R (V 4.0.2) “picante”. Principal Coordinate Analysis (PCoA, weighted UniFrac distance) was used to assess the colony structure of the different microorganisms, and its visualization was done with the R “ggplot2” package [25]. The top ten dominant bacterial groups in phyla and genera were also visualized with R (V 4.0.2) “ggplot2”. Analysis of similarity (ANOSIM) is used to determine the similarity of groups, with “0” indicating indistinguishable and “1” indicating distinguishable. LDA effect size (LEfSe) analysis was applied to screen for signature differential flora in feces of Hu sheep fed different roughages. The Harvard University online analysis platform “http://huttenhower.sph.harvard.edu/galaxy (accessed on 20 December 2021)” was used to complete the LEfSe analysis. We believe that this bacterial group differed between the two groups, when the linear discriminant analysis (LDA) effect value was greater than 3.

2.2.4. Untargeted Metabolomics Based on Liquid Chromatography-Mass Spectrometry and Data Processing

The untargeted metabolome of fecal samples was analyzed by liquid chromatography-mass spectrometry (Waters, UPLC; Thermo, Q Exactive) platforms. A total of 50 mg of fecal sample was weighed into a 1.5 mL centrifuge tube, and 800× μL of 80% methanol was added and ground for 90 s at 65 Hz, and ground for 90 s. After sufficient mixing, the sample was sonicated for 30 min at 4 °C and then allowed to stand at −40 °C for 1 h with vortex oscillation for 30 s. The sample was then separated from the sample for 1 h with the vortex oscillator. The sample mix needs to be centrifuged (12,000 rpm) for 15 min, but it needs to be left at 4 °C for 30 min first. All of the supernatant solution was pipetted into a centrifuge tube at −40 °C for 60 min, and then centrifuged again at 4 °C at 12,000 rpm for 15 min, next, 200 μL of the supernatant was transferred to a vial, with 0.14 mg/mL dichlorophenylalanine of the internal standard being added, and stored at −80 °C to be analyzed on the machine.
A small amount of treated fecal extract was taken and separated by chromatography through a chromatograph. The model of the HPLC column was ACQUITY UPLC HSS T3 (2.1 × 100 mm, 1.8 μm). Chromatographic separations were performed in positive ion mode (ESI+) and negative ion mode (ESI−) using a preheated SuperGold C18 column (100 × 4.6 mm, 3 μm i.d.). Water and 0.05% acetonitrile with 0.1% formic acid formed solvent A. Acetonitrile mixed with 0.1% formic acid formed solvent B. The samples were eluted in the mobile phase, consisting of solvent A and solvent B at a flow rate of 0.3 μL/min. The elution of the samples was divided into a total of three steps, with the ratios of mobile phase A to mobile phase B being 95%:5%, 5%:95%, and 95%:5%, respectively; and the elution times for each step were 1 min, 25.5 min, and 29.6 min, respectively. QC samples need to be tested along with the test samples for monitoring and evaluating the stability and reliability of the system’s test data. The Q Exactive HF-X (Thermo Fisher Scientific, Waltham, MA, USA) mass spectrometer operates in positive/negative mode, with each sample detected under positive (ESI+) and negative (ESI−) ion mode conditions. Mass spectrometry parameter conditions differ in the ESI+ and ESI− modes. The mass spectrometry parameter conditions were different in positive and negative modes. In ESI+ mode, the heater temperature was 300 °C, the sheath gas flow rate was 45 arb, the auxiliary gas flow rate was 15 arb, the tail gas flow rate was 1 arb, the electrospray voltage was 3 kV, the capillary temperature was 350 °C, and the S-Lens RF Level was 30%. In ESI− mode, only the electrospray voltage (3.2 kV) and the S-Lens RF Level (60%) were changed; all other conditions remained the same. Peak extraction, baseline correction, and peak matching based on mass spectrometry data were performed using ChromaTOF software (V4.3x, LECO), and these peaks were matched to the LECO/Fiehn Metabolomics Library database to identify metabolites.
The normalized data were analyzed and visualized by multivariate analysis in SIMCA (V 14.1) software. The horizontal coordinates of the supervised partial least squares (OPLS-DA) score plot indicate the score values of the main components of the orthogonal signal correction (OSC) process, from which intergroup differences can be seen; the vertical coordinates indicate the score values of the orthogonal components of the OSC process; and intragroup differences (differences between samples within a group) can be seen on the vertical coordinates. The R2 and Q2 values of the OPLS-DA model were used to assess the model’s validity. VIP values were obtained from the OPLS-DA model, and p values were calculated by a one-way ANOVA with a t test. Differential metabolites were screened with VIP > 1 and p < 0.05. KEGG-enriched metabolic pathways were accomplished through the MetaboAnalyst online open-source website “https://www.metaboanalyst.ca (accessed on 7 July 2022)”. p < 0.05 was used as the criterion for having a significant functional pathway among the differential metabolites.

2.3. Data Analysis

Growth performance data were statistically analyzed using an independent t-test in SPSS 20.0 software (IBM Corporation, Armonk, NY, USA), and differences were considered significant at p < 0.05. Fecal microbiota and metabolites were correlated using Spearman’s rank correlation, and R and p values were calculated using the R (V 4.0.2) “Psych”, and correlations were considered when p < 0.05 and R > |0.8|. Correlation heatmaps were visualized using the R (V 4.0.2) “ggcorrplot”.

3. Results

3.1. Growth Performance

The effects of the mixed silage on the growth performance of Hu sheep are shown in Table 1. There were no differences in the ADG (Figure 1A), DMI (Figure 1B), or FCR (Figure 1C) between the control and silage groups (p > 0.05).

3.2. Fecal Microbiota Structure

In the fecal microbiome, a total of 1,111,942 reads were obtained. Based on 97% sequence similarity, an average of 894,173 valid data points were obtained after quality control, yielding 1839 OTUs. The results of the rarefaction curves (Supplementary Figure S1A) showed that with the gradual increase of sequences, the curve was in the rising stage, and a large number of microorganisms were found in the sample. As the number of measured sequences continued to increase, the dilution curve had gradually flattened, indicating that sequencing depth could cover most of the microbial groups in the sample and could be used for later experiments. The venn diagram results showed (Supplementary Figure S1B) that the number of OTUs in the control group was lower than the silage group, with 1380 OTUs shared between the two groups. In addition, the control group had exclusive access to 107 OTUs, and the silage group had exclusive access to 352 OTUs. The results of alpha diversity (Supplementary Figure S2) showed that the replacement of roughage in the control group by the mixed silage did not affect the Richness, Shannon, Simpson, Chao1, ACE, and goods_coverage indices of the microorganisms in manure (p > 0.05). The PCoA results (Figure 2A) showed that the contribution of the first and second principal coordinates of PCoA was 33.55% and 15.51%, respectively. Anosim analyses showed that the fecal microflora structure of Hu sheep was affected by the mixed silage (p = 0.011). At the phyla level (Figure 2B), Firmicutes, Bacteroidetes, and Proteobacteria were the dominant phyla in the both groups, followed by Spirochaetes, Verrucomicrobia, Planctomycetes, Patescibacteria, Fibrobacteres, Kiritimatiellaeota, and Actinobacteria. At the genera level (Figure 2C), Ruminococcaceae UCG-005 and the Christensenellaceae R-7 group were the dominant genera in the control group, and the Christensenellaceae R-7 group and the Rikenellaceae RC9 gut group were the dominant genera in the silage group. The results of LEfSe analysis (Figure 2D) showed that a total of 15 differentiated microorganisms were obtained, of which four were in the control group, namely Ruminococcaceae UCG_010, Breznakia, Erysipelothrix, and Desulfovibrio, and eleven in the silage group, which were mainly distributed in the Bacilli, Clostridiaceae1, Pseudomonadales, Succiniclasticum, and Shuttleworthia.

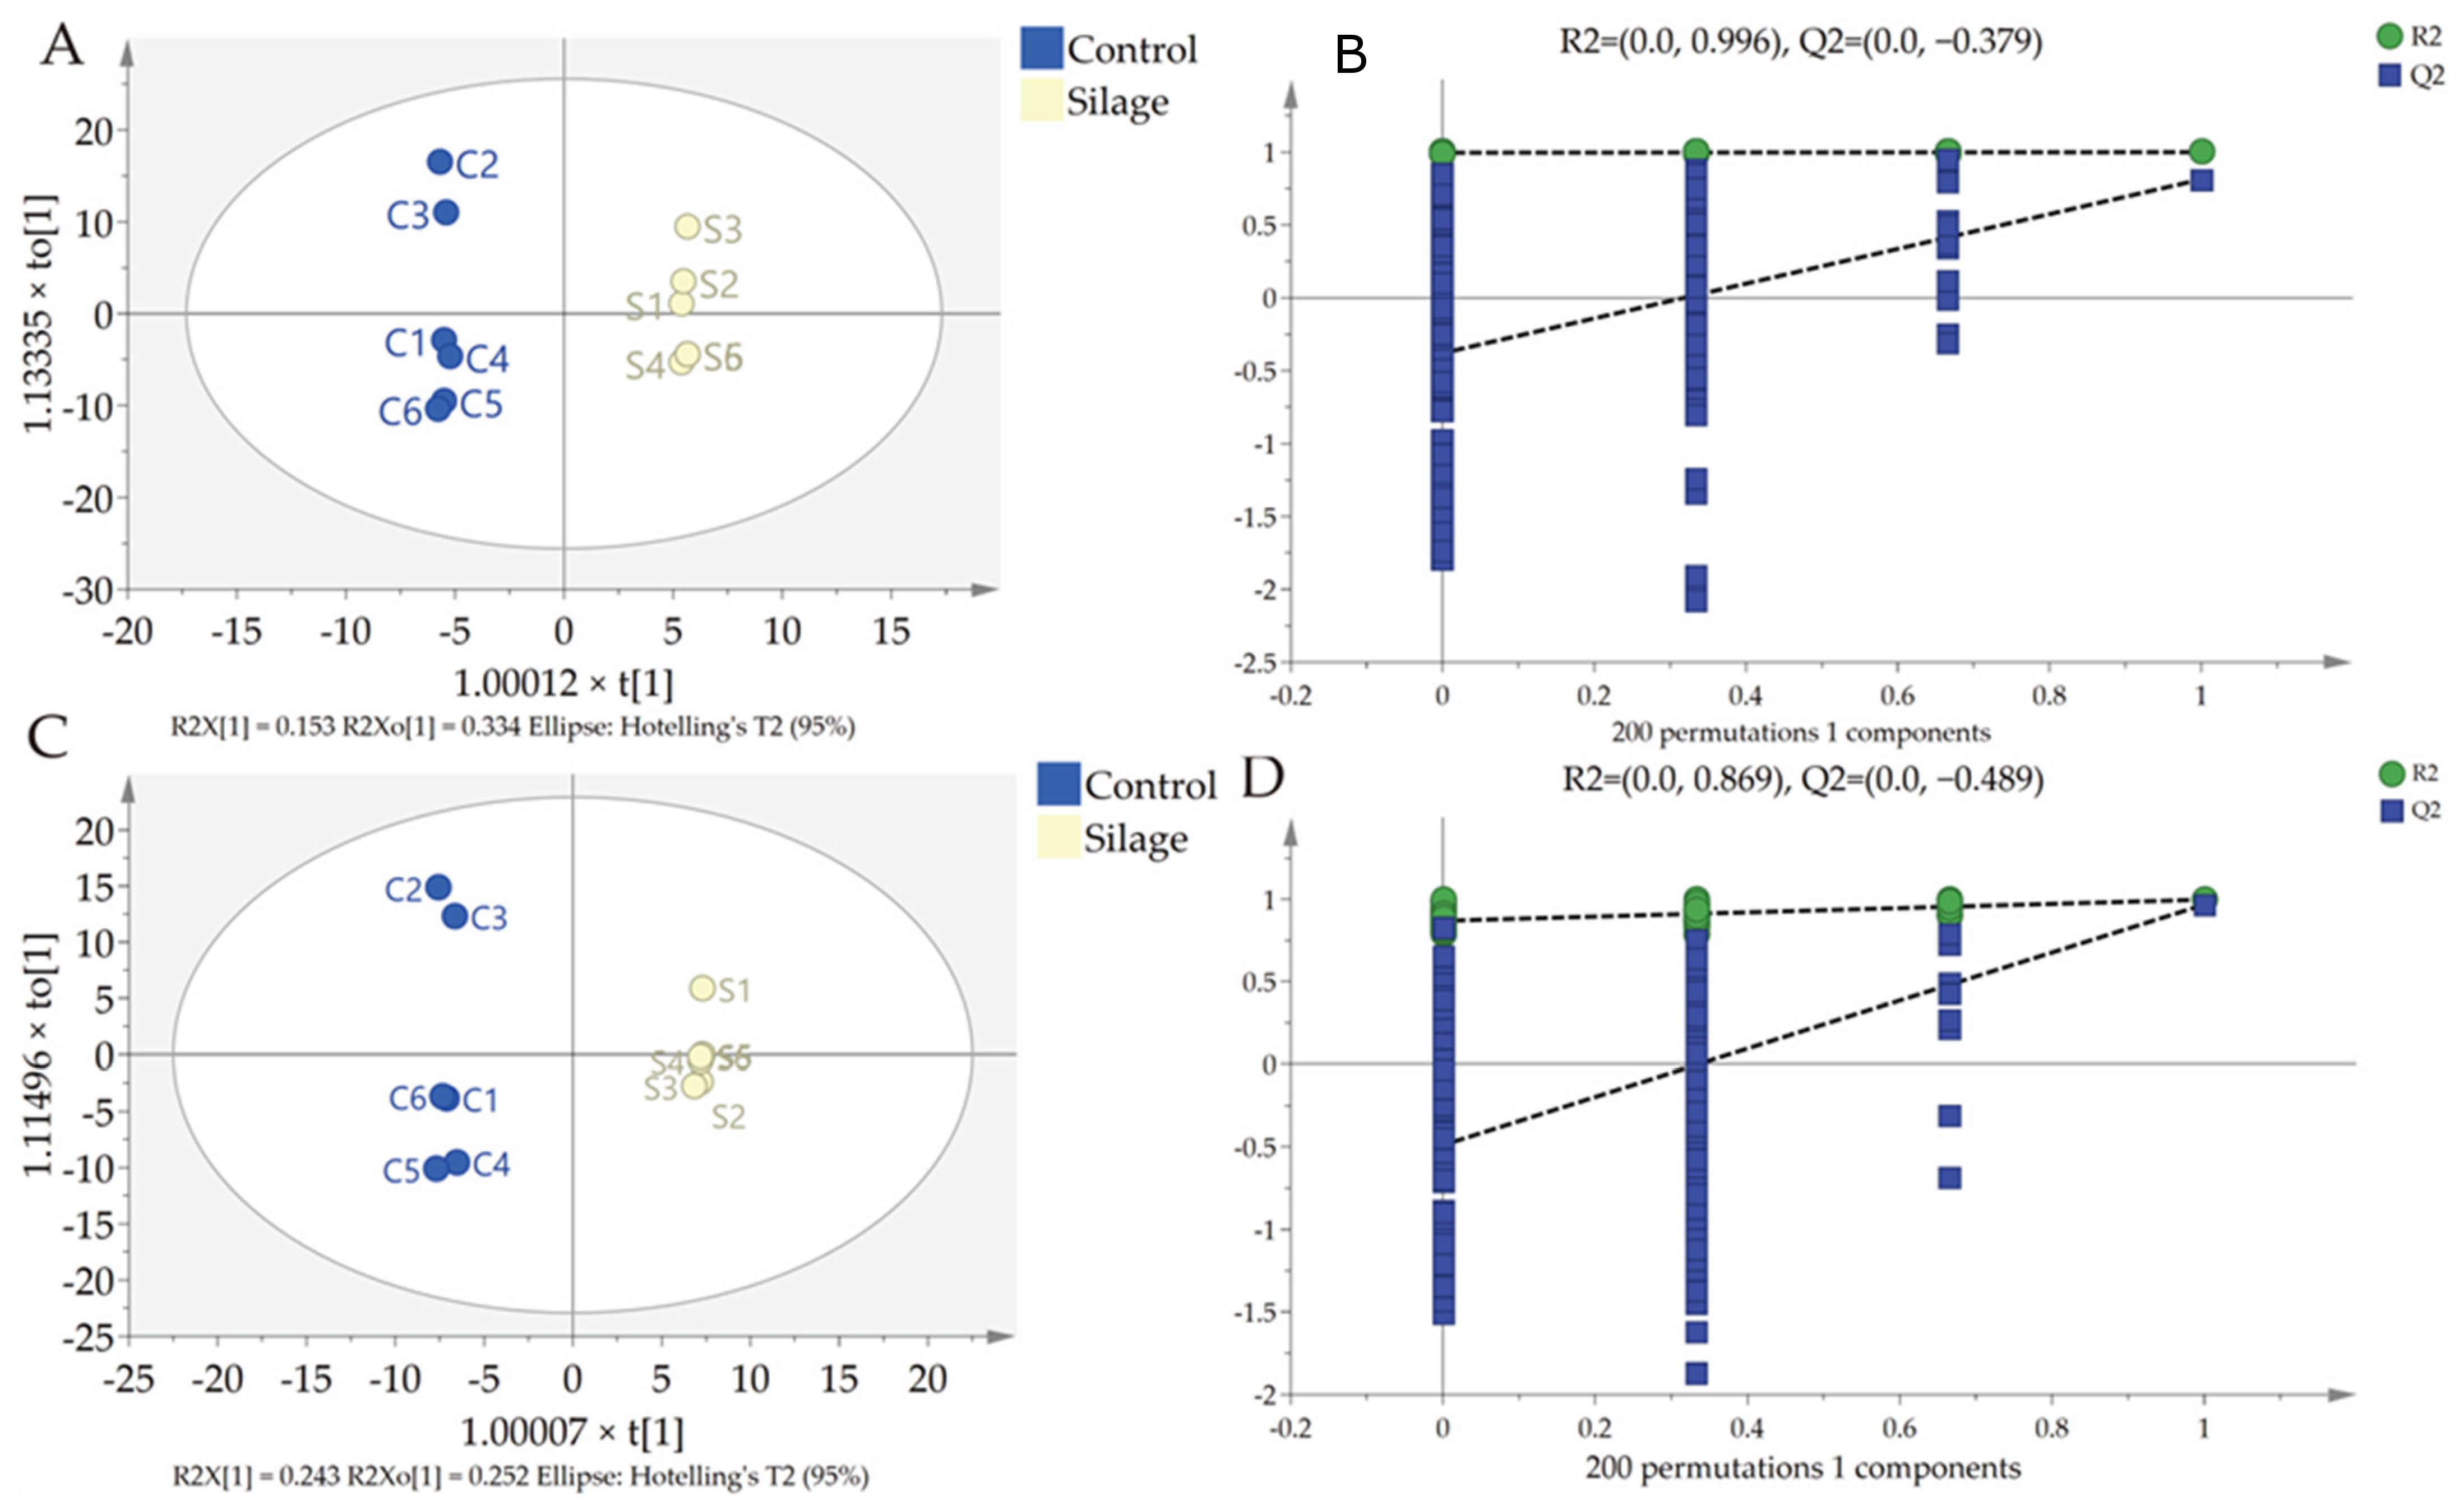
3.3. Fecal Metabolomics

Quality control (QC) samples were used throughout the trial to assess the stability and reproducibility of the data. The quality of the data is directly proportional to the correlation of the QC samples. The values for the R-type 2 ESI+ and ESI− polarity modes are 1 and 0.79, respectively (Supplementary Figure S3). OPLS-DA with supervision was used to distinguish differences in metabolic profiles between control and silage groups, and samples from control and silage groups were significantly separated in ESI+ or ESI− mode (Figure 3A,C). In addition, there was more aggregation between samples within the silage group than in the control group. These results suggested that silage can alter fecal metabolites in Hu sheep. After 200 response replacement tests, OPLS-DA calculated the regression intercept (Q2), and we considered the model to be valid when Q2 was less than zero. From (Figure 3B,D), the Q2 value is −0.199 for the ESI+ model (Figure 3B) and −0.858 for the ESI− model (Figure 3D). Therefore, we concluded that the model was reliable and stable.
The metabolites of the feces from the control and silage groups were analyzed by LC-MS, and 582 and 612 peaks were retained after preprocessing the raw data for ESI+ and ESI− modes, resulting in the identification and quantification of 217 positive and 231 negative compounds. Among these compounds, 19 positively ionized compounds and 59 negatively ionized compounds were differentiated (VIP > 1 and p < 0.05), and these metabolites were mainly distributed among amino acids, peptides, and analogues, benzoic acids and derivatives, bile acids, alcohols and derivatives, carbohydrates and carbohydrate conjugates, carbonyl compounds, eicosanoids, fatty acids and conjugates, isoflav-2-enes, pyrimidine 2′-deoxyribonucleosides, tetrahydrofuran lignans, and others (Table 2).

3.4. KEGG Enrichment Analysis

Enrichment analysis based on fecal differential metabolism metabolites (KEGG) showed that the mixed silage altered nine metabolic pathways (Figure 4). In the ESI+ mode (Figure 4A), the mixed silage diet altered four stored metabolic pathways, namely primary bile acid biosynthesis, pyrimidine metabolism, and glycine, serine, and threonine metabolism (p < 0.05). In the ESI− mode (Figure 4B), five metabolic pathways were altered, namely aminoacyl-tRNA biosynthesis, valine, leucine, and isoleucine biosynthesis, phenylalanine metabolism, arginine biosynthesis, and phenylalanine, tyrosine, and tryptophan biosynthesis (p < 0.05).

3.5. Analysis of Differential Metabolites and Fecal Microbial Correlations

The correlation analysis between differential metabolites and differential microorganisms is shown in Figure 5. Ruminococcaceae UCG_010 and L-valine, D-saccharic acid, lauric acid, NAG, metaxalone, vanillin, 3-hydroxyphenylacetic acid, D-aspartate, 3-indoxyl sulfate, gamma-glutamylleucine, L-phenylalanine, L-histidine, arginine, 3′2-hydroxyethyl indole, and 2-hydroxyhippuric acid were positively correlated, while they were negatively correlated with ferulic acid, santin, and 13-hpode (p < 0.05). Breznakia has a positive and significant correlation with N-isobutyrylglycine, daidzein, pseudouridine, butylparaben, uridine, equol, and dihydrojasmonic acid (p < 0.05). Desulfovibrio was positively correlated with pseudouridine, uridine, dihydrojasmonic acid, 2-hydroxyhippuric acid, uric acid, 3-indoxyl sulfate, ecgonine, vanillin, N-tigloylglycine, epinephrine, 3,2-hydroxyethyl indole, L-histidine, arginine, N-isobutyrylglycine, and L-valine (p < 0.05). Carnobacterium was positively correlated with DL-alanine, N-acetylneuraminic acid, glycine, and ferulic acid. Psychrobacter was positively correlated with 3-methylglutaric acid (p < 0.05).

4. Discussion

Silage can make up for the shortage of seasonal roughage and contribute to the feeding of ruminants. In this experiment, our results showed that the use of mixed silage in the diets of Hu sheep did not affect growth performance but had an effect on the structure of the microflora, metabolites, and metabolic pathways in the hindgut.
In this experiment, the difference in fecal microbial diversity and abundance between the silage and control groups was not significant, which is consistent with previous studies [26]. PCoA and Anosim analyses indicated that the mixed silage had a highly significant effect on the microflora structure of manure. At the phyla level, our results indicated that the predominant phyla in both groups was Firmicutes, followed by Bacteroidetes and Proteobacteria. Previous studies have shown that the main microorganisms considered to be present in sheep feces are Firmicutes [27]. The main phyla were shown to be Firmicutes, Bacteroidetes, and Proteobacteria in a study on the evolution of mammalian gut microorganisms [13]. In the intestinal tract of ruminants, Bacteroides plays a very important role in the degradation of cellulose [28]. It has been shown that Firmicutes plays a very important role in the digestion of carbohydrates and the fermentation of organic matter [29]. The role of Proteobacteria is not fully understood, and further studies are needed [30]. However, studies on the diversity and function of fecal microbiota in sheep have shown that the fecal microbiota is mainly associated with carbohydrate degradation and catabolism [27]. At the genera level, the main microorganisms within the silage group are dominated by the Christensenellaceae R-7 group and the Rikenellaceae RC9 gut group. The Christensenellaceae R-7 group is a genus in the family Christensenaceae, which is widespread in the human gut and animal intestinal tract and is closely related to the host’s health [31]. The function of the Rikenellaceae RC9 gut group may be related to fiber degradation [32,33]. Furthermore, the proportion of Rikenellaceae RC9 gut group in the feces of musk deer is significantly reduced when they experience diarrhea and exacerbate it [34]. The Christensenellaceae R-7 group was the dominant genera within the silage group, which is more favorable for Hu sheep health.
The LEfSe results showed that at the genera level, the signature microorganisms in the silage group were Psychrobacter, Succiniclasticum, and Carnobacterium. Psychrobacter has a wide range of cryophilic bacteria, with members of the genera varying widely in cold suitability and genome, and can be isolated from antarctic soils, seawater, Siberian tundra, and the intestinal tracts of marine fish. Psychrobacter has a wide range of cryophiles, and members of the genera have widely varying cold suitability and genomes that can be isolated from Antarctic soil, seawater, Siberian tundra, and the intestinal tracts of marine fish, but their metabolisms are unknown [35,36,37]. The addition of Psychrobacter to the diet could enhance the activity of digestive enzymes in the gut and improve the digestive utilization of feed [26]. Succiniclasticum may be a normal genus in the intestinal tract of ruminants that catabolizes succinic acid to produce propionic acid, and also has some catabolic capacity for cellulose and starch [38]. The elevated relative abundance of Succiniclasticum may be related to higher levels of NDF and ADF in the mixed silage. Carnobacterium is widely distributed in the gastrointestinal tract of meat, fish, and poultry or in lakes and produces lactic acid, which in part inhibits the action of harmful microorganisms [39,40]. In addition, the mixed silage reduced the proportion of Desulfovibrio, which has a toxic effect on the intestinal epithelium and contributes to gastrointestinal disorders [41,42].
Metabolomics can explain phenotypic changes better than genomics and proteomics [43]. Our metabolomics data suggest that the mixed silage altered the concentrations of many fecal metabolites, which may be related to changes in fecal microbial abundance. The screened differential metabolites were enriched in glycine, serine, and threonine metabolism, valine, leucine, and isoleucine biosynthesis, phenylalanine metabolism, arginine biosynthesis, phenylalanine metabolism, arginine, and phenylalanine, tyrosine, and tryptophan biosynthesis. Amino acids are important for microbial growth and metabolism, and are key components of protein and peptide synthesis and regulate several metabolic pathways [44]. L-valine enters the tricarboxylic acid cycle to provide energy and has important roles in protein synthesis, cell proliferation, and signaling pathway activation [45,46]. NAG is an important allosteric activator of carbamoyl phosphate synthase. NAG can activate carbamoylphosphate synthase and promote its synthesis of carbamoyl phosphate, thus promoting the synthesis of arginine. NAG participates in the urea cycle in the liver and combines with ornithine transcarbamylase to generate citrulline in the intestine, and then citrulline is converted into an important pathway for the synthesis of arginine in the kidney [47]. L-arginine is involved in the tricarboxylic acid cycle as well as the urea cycle and can regulate energy metabolism, amino acid metabolism, and microbial metabolism in animals [48]. NAG, L-valine, and L-arginine were significantly down-regulated in the silage group, which may be related to the decrease in the proportion of Ruminococcaceae UCG 010.
It is noteworthy that we found that the concentrated metabolites of concentrated pyrimidine metabolism also changed significantly. In our experiments, the mixed silage significantly upregulated 2′-deoxyuridine and thymidine. Pyrimidine metabolism is a prominent feature of the hindgut, and different combinations of nucleosides have variable effects on animal growth performance [49]. Feeding broilers with yeast extract as a source of nucleotides does not affect the growth performance of broilers, but adding nucleotides to the diet can improve the performance of piglets [50,51]. In addition, the study of Ma et al. [52] showed that the accumulation of nucleosides functioned to enhance the growth performance of Dorper sheep. Therefore, mixed silage has the potential to improve the growth performance of Hu sheep.

5. Conclusions

In conclusion, the mixed silage increased the relative abundance of microorganisms such as Psychrobacter, Succiniclasticum, and Carnobacterium and decreased the relative abundance of microorganisms such as Ruminococcaceae UCG_010 and Breznakia. In addition, the mixed silage alters the concentration of many fecal metabolites and enriches metabolic pathways, which is more beneficial to the healthy growth of Hu sheep.

Supplementary Materials

The following supporting information can be downloaded at: https://www.mdpi.com/article/10.3390/fermentation10050233/s1, Figure S1: Ruminal microbial OTUs with the different dietary groups. (A) OTU-based microbial sparsity profiles were used to assess the depth of coverage for each sample. (B) Venn diagram of fecal bacterial OTUs; Figure S2: Number of species, richness and diversity indices observed in fecal samples. Figure S3: Person Correlation of QC samples. (A) ESI+; (B) ESI−.

Author Contributions

Conceptualization, M.W., C.L. and Z.L.; methodology, R.Q., C.L., Y.L. and Z.L.; software, C.L., Z.Z. and Z.L.; validation, C.L., M.H.Z., R.Q., Z.Z., Z.L. and Y.L.; formal analysis, C.L., Y.L. and Z.L.; investigation, R.Q., C.L., Z.L. and M.H.Z.; resources, C.L. and Z.L.; data curation, C.L. and Z.L.; writing—original draft preparation, C.L. and M.H.Z.; writing—review and editing, M.W.; visualization, K.Y. and M.W.; supervision, K.Y. and M.W.; project administration, K.Y. and M.W.; funding acquisition, K.Y. and M.W. All authors have read and agreed to the published version of the manuscript.

Funding

This research is funded by the national 14th Five year Plan Key Research and Development Program (2023YFD1301705, 2021YFD1600702), the Key Program of State Key Laboratory of Sheep Genetic Improvement and Healthy Production (NCG202232), the High end Foreign Expert Project of the Ministry of Science and Technology (G2023014066L), and the Priority Academic Program Development of Jiangsu Higher Education Institution (PAPD), P.R. China.

Institutional Review Board Statement

All animal experiments were conducted in accordance with the Animal Protection Law, in accordance with the “Guidelines for the Care and Use of Experimental Animals” (SXXY 2015-0054) approved by the Ethics Committee of Yangzhou University.

Informed Consent Statement

The animal owners have expressed written informed consent to their animals participating in this study.

Data Availability Statement

The datasets presented in this study can be found in online repositories. The names of the reposi-tory/repositories and accession number(s) can be found below: NCBI SRA BioProject, accession no: PRJNA 1028414.

Acknowledgments

The authors sincerely thank Yangzhou University and Xinjiang Agricultural University for their support.

Conflicts of Interest

The authors declare that this study was conducted without any business or financial relationships that could be considered a potential conflict of interest.

References

  1. Alexandratos, N.; Bruinsma, J. World Agriculture towards 2030/2050: The 2012 Revision; Food and Agriculture Organization: Rome, Italy, 2012. [Google Scholar]
  2. Wang, C.; Zheng, M.; Wu, S.; Zou, X.; Chen, X.; Ge, L.; Zhang, Q. Effects of gallic acid on fermentation parameters, protein fraction, and bacterial community of whole plant soybean silage. Front. Microbiol. 2021, 12, 662966. [Google Scholar] [CrossRef]
  3. Wilkinson, J.; Rinne, M. Highlights of progress in silage conservation and future perspectives. Grass Forage Sci. 2018, 73, 40–52. [Google Scholar] [CrossRef]
  4. Wanapat, M.; Sundstøl, F.; Garmo, T. A comparison of alkali treatment methods to improve the nutritive value of straw. I. Digestibility and metabolizability. Anim. Feed Sci. Technol. 1985, 12, 295–309. [Google Scholar] [CrossRef]
  5. Weinberg, Z.; Chen, Y. Effects of storage period on the composition of whole crop wheat and corn silages. Anim. Feed Sci. Technol. 2013, 185, 196–200. [Google Scholar] [CrossRef]
  6. Ren, H.; Xu, N.; Li, J.; Li, Z.; Zhao, T.; Pei, F.; Yao, X.; Sun, Y. Effects of different mixed ratio of maize straw and cabbage wastes on silage quality. J. Biobased Mater. Bioenergy 2015, 9, 88–94. [Google Scholar] [CrossRef]
  7. Partovi, E.; Rouzbehan, Y.; Fazaeli, H.; Rezaei, J. Broccoli byproduct-wheat straw silage as a feed resource for fattening lambs. Transl. Anim. Sci. 2020, 4, txaa078. [Google Scholar] [CrossRef]
  8. Lu, H.; Yan, H.; Almeida, V.; Adeola, O.; Ajuwon, K. Effects of dietary resistant starch content on nutrient and energy digestibility and fecal metabolomic profile in growing pigs. J. Anim. Sci. 2016, 94, 364–368. [Google Scholar] [CrossRef]
  9. Kim, J.-H.; Hong, S.W.; Park, B.-Y.; Yoo, J.G.; Oh, M.-H. Characterisation of the bacterial community in the gastrointestinal tracts of elk (Cervus canadensis). Antonie Van Leeuwenhoek 2019, 112, 225–235. [Google Scholar] [CrossRef]
  10. Al-Lahham, S.a.H.; Roelofsen, H.; Priebe, M.; Weening, D.; Dijkstra, M.; Hoek, A.; Rezaee, F.; Venema, K.; Vonk, R.J. Regulation of adipokine production in human adipose tissue by propionic acid. Eur. J. Clin. Investig. 2010, 40, 401–407. [Google Scholar] [CrossRef]
  11. Ussar, S.; Fujisaka, S.; Kahn, C.R. Interactions between host genetics and gut microbiome in diabetes and metabolic syndrome. Mol. Metab. 2016, 5, 795–803. [Google Scholar] [CrossRef]
  12. Jia, W.; Li, H.; Zhao, L.; Nicholson, J.K. Gut microbiota: A potential new territory for drug targeting. Nat. Rev. Drug Discov. 2008, 7, 123–129. [Google Scholar] [CrossRef]
  13. Ley, R.E.; Hamady, M.; Lozupone, C.; Turnbaugh, P.J.; Ramey, R.R.; Bircher, J.S.; Schlegel, M.L.; Tucker, T.A.; Schrenzel, M.D.; Knight, R. Evolution of mammals and their gut microbes. Science 2008, 320, 1647–1651. [Google Scholar] [CrossRef]
  14. Johnson, A.J.; Vangay, P.; Al-Ghalith, G.A.; Hillmann, B.M.; Ward, T.L.; Shields-Cutler, R.R.; Kim, A.D.; Shmagel, A.K.; Syed, A.N.; Personalized Microbiome Class, S.; et al. Daily Sampling Reveals Personalized Diet-Microbiome Associations in Humans. Cell Host Microbe 2019, 25, 789–802.e785. [Google Scholar] [CrossRef]
  15. Li, C.; Chen, N.; Zhang, X.; Shahzad, K.; Qi, R.; Zhang, Z.; Lu, Z.; Lu, Y.; Yu, X.; Zafar, M.H. Mixed silage with Chinese cabbage waste enhances antioxidant ability by increasing ascorbate and aldarate metabolism through rumen Prevotellaceae UCG-004 in Hu sheep. Front. Microbiol. 2022, 13, 978940. [Google Scholar] [CrossRef]
  16. Nicholson, J.K.; Lindon, J.C. Metabonomics. Nature 2008, 455, 1054–1056. [Google Scholar] [CrossRef]
  17. Zhang, Z.; Shahzad, K.; Shen, S.; Dai, R.; Lu, Y.; Lu, Z.; Li, C.; Chen, Y.; Qi, R.; Gao, P. Altering Dietary Soluble Protein Levels With Decreasing Crude Protein May Be a Potential Strategy to Improve Nitrogen Efficiency in Hu Sheep Based on Rumen Microbiome and Metabolomics. Front. Nutr. 2021, 8, 815358. [Google Scholar] [CrossRef]
  18. Yi, H.; Yang, G.; Xiong, Y.; Wu, Q.; Xiao, H.; Wen, X.; Yang, X.; Wang, L.; Jiang, Z. Integrated metabolomic and proteomics profiling reveals the promotion of Lactobacillus reuteri LR1 on amino acid metabolism in the gut–liver axis of weaned pigs. Food Funct. 2019, 10, 7387–7396. [Google Scholar] [CrossRef]
  19. Plaizier, J.C.; Li, S.; Danscher, A.M.; Derakshani, H.; Andersen, P.H.; Khafipour, E. Changes in microbiota in rumen digesta and feces due to a grain-based subacute ruminal acidosis (SARA) challenge. Microb. Ecol. 2017, 74, 485–495. [Google Scholar] [CrossRef]
  20. Warner, R.D.; Jacob, R.H.; Rosenvold, K.; Rochfort, S.; Trenerry, C.; Plozza, T.; McDonagh, M.B. Altered post-mortem metabolism identified in very fast chilled lamb M. longissimus thoracis et lumborum using metabolomic analysis. Meat Sci. 2015, 108, 155–164. [Google Scholar] [CrossRef]
  21. National Research Council (NRC). Nutrient Requirements of Small Ruminants, Sheep, Goats, Cervids, and New World Camelids; National Academy Press: Washington, DC, USA, 2007. [Google Scholar]
  22. Magoč, T.; Salzberg, S.L. FLASH: Fast length adjustment of short reads to improve genome assemblies. Bioinformatics 2011, 27, 2957–2963. [Google Scholar] [CrossRef]
  23. Chen, S.; Zhou, Y.; Chen, Y.; Gu, J. fastp: An ultra-fast all-in-one FASTQ preprocessor. Bioinformatics 2018, 34, i884–i890. [Google Scholar] [CrossRef] [PubMed]
  24. Edgar, R.C. UPARSE: Highly accurate OTU sequences from microbial amplicon reads. Nat. Methods 2013, 10, 996–998. [Google Scholar] [CrossRef] [PubMed]
  25. Lozupone, C.; Knight, R. UniFrac: A new phylogenetic method for comparing microbial communities. Appl. Environ. Microbiol. 2005, 71, 8228–8235. [Google Scholar] [CrossRef] [PubMed]
  26. Sun, Y.Z.; Yang, H.L.; Ma, R.L.; Zhang, C.X.; Lin, W.Y. Effect of dietary administration of Psychrobacter sp. on the growth, feed utilization, digestive enzymes and immune responses of grouper Epinephelus coioides. Aquacult. Nutr. 2011, 17, e733–e740. [Google Scholar] [CrossRef]
  27. Tanca, A.; Fraumene, C.; Manghina, V.; Palomba, A.; Abbondio, M.; Deligios, M.; Pagnozzi, D.; Addis, M.F.; Uzzau, S. Diversity and functions of the sheep faecal microbiota: A multi-omic characterization. Microb. Biotechnol. 2017, 10, 541–554. [Google Scholar] [CrossRef] [PubMed]
  28. Shabana, I.; Albakri, N.; Bouqellah, N. Metagenomic investigation of faecal microbiota in sheep and goats of the same ages. J. Taibah Univ. Sci. 2021, 15, 1–9. [Google Scholar] [CrossRef]
  29. Spence, C.; Wells, W.G.; Smith, C.J. Characterization of the primary starch utilization operon in the obligate anaerobe Bacteroides fragilis: Regulation by carbon source and oxygen. J. Bacteriol. 2006, 188, 4663–4672. [Google Scholar] [CrossRef] [PubMed]
  30. Wang, J.; Fan, H.; Han, Y.; Zhao, J.; Zhou, Z. Characterization of the microbial communities along the gastrointestinal tract of sheep by 454 pyrosequencing analysis. Asian Australas. J. Anim. Sci. 2017, 30, 100. [Google Scholar] [CrossRef]
  31. Waters, J.L.; Ley, R.E. The human gut bacteria Christensenellaceae are widespread, heritable, and associated with health. BMC Biol. 2019, 17, 83. [Google Scholar] [CrossRef]
  32. Asma, Z.; Sylvie, C.; Laurent, C.; Jérôme, M.; Christophe, K.; Olivier, B.; Annabelle, T.-M.; Francis, E. Microbial ecology of the rumen evaluated by 454 GS FLX pyrosequencing is affected by starch and oil supplementation of diets. FEMS Microbiol. Ecol. 2013, 83, 504–514. [Google Scholar]
  33. Huang, C.; Ge, F.; Yao, X.; Guo, X.; Bao, P.; Ma, X.; Wu, X.; Chu, M.; Yan, P.; Liang, C. Microbiome and metabolomics reveal the effects of different feeding systems on the growth and ruminal development of yaks. Front. Microbiol. 2021, 12, 682989. [Google Scholar] [CrossRef]
  34. Li, Y.; Hu, X.; Yang, S.; Zhou, J.; Qi, L.; Sun, X.; Fan, M.; Xu, S.; Cha, M.; Zhang, M. Comparison between the fecal bacterial microbiota of healthy and diarrheic captive musk deer. Front. Microbiol. 2018, 9, 300. [Google Scholar] [CrossRef]
  35. Zhang, S.; Song, W.; Yu, M.; Lin, X. Comparative genomics analysis of five Psychrobacter strains isolated from world-wide habitats reveal high intra-genus variations. Extremophiles 2017, 21, 581–589. [Google Scholar] [CrossRef]
  36. Amato, P.; Christner, B.C. Energy metabolism response to low-temperature and frozen conditions in Psychrobacter cryohalolentis. Appl. Environ. Microbiol. 2009, 75, 711–718. [Google Scholar] [CrossRef]
  37. Lin, X.; Cui, S.; Xu, G.; Wang, S.; Du, N.; Shen, J. Cloning and heterologous expression of two cold-active lipases from the Antarctic bacterium Psychrobacter sp. G. Polar Res. 2010, 29, 421–429. [Google Scholar]
  38. Van Gylswyk, N. Succiniclasticum ruminis gen. nov., sp. nov., a ruminal bacterium converting succinate to propionate as the sole energy-yielding mechanism. Int. J. Syst. Evol. Microbiol. 1995, 45, 297–300. [Google Scholar] [CrossRef] [PubMed]
  39. Hammes, W.P.; Hertel, C. The genera lactobacillus and carnobacterium. Prokaryotes 2006, 4, 320–403. [Google Scholar]
  40. Zeineldin, M.; Barakat, R.; Elolimy, A.; Salem, A.Z.; Elghandour, M.M.; Monroy, J.C. Synergetic action between the rumen microbiota and bovine health. Microb. Pathog. 2018, 124, 106–115. [Google Scholar] [CrossRef]
  41. Murros, K.E.; Huynh, V.A.; Takala, T.M.; Saris, P.E. Desulfovibrio Bacteria Are Associated with Parkinson’s Disease. Front. Cell. Infect. Microbiol. 2021, 11, 378. [Google Scholar] [CrossRef]
  42. Xu, Y.; Shao, M.; Fang, X.; Tang, W.; Zhou, C.; Hu, X.; Zhang, X.; Su, K.-P. Antipsychotic-induced gastrointestinal hypomotility and the alteration in gut microbiota in patients with schizophrenia. Brain Behav. Immun. 2022, 99, 119–129. [Google Scholar] [CrossRef]
  43. Vinayavekhin, N.; Homan, E.A.; Saghatelian, A. Exploring disease through metabolomics. ACS Chem. Biol. 2010, 5, 91–103. [Google Scholar] [CrossRef] [PubMed]
  44. Mariz, L.; Amaral, P.; Valadares Filho, S.; Santos, S.; Detmann, E.; Marcondes, M.; Pereira, J.; Silva Júnior, J.; Prados, L.; Faciola, A. Dietary protein reduction on microbial protein, amino acid digestibility, and body retention in beef cattle: 2. Amino acid intestinal absorption and their efficiency for whole-body deposition. J. Anim. Sci. 2018, 96, 670–683. [Google Scholar] [CrossRef] [PubMed]
  45. Michonneau, P.; Fleurat-Lessard, P.; Cantereau, A.; Crépin, A.; Roblin, G.; Berjeaud, J.M. Implication of actin in the uptake of sucrose and valine in the tap root and leaf of sugar beet. Physiol. Plant. 2021, 172, 218–232. [Google Scholar] [CrossRef] [PubMed]
  46. Rose, A.J. Amino acid nutrition and metabolism in health and disease. Nutrients 2019, 11, 2623. [Google Scholar] [CrossRef] [PubMed]
  47. Shigesada, K.; Tatibana, M. Enzymatic synthesis of acetylglutamate by mammalian liver preparations and its stimulation by arginine. Biochem. Biophys. Res. Commun. 1971, 44, 1117–1124. [Google Scholar] [CrossRef] [PubMed]
  48. Guo, C.; Xue, Y.; Seddik, H.-E.; Yin, Y.; Hu, F.; Mao, S. Dynamic changes of plasma metabolome in response to severe feed restriction in pregnant ewes. Metabolites 2019, 9, 112. [Google Scholar] [CrossRef] [PubMed]
  49. Daneshmand, A.; Kermanshahi, H.; Mesgaran, M.D.; King, A.J.; Ibrahim, S.A.; Klasing, K.C. Combination of purine and pyrimidine nucleosides influences growth performance, gut morphology, digestive enzymes, serum biochemical indices and immune functions in broiler chickens. Anim. Feed Sci. Technol. 2017, 228, 186–193. [Google Scholar] [CrossRef]
  50. Jung, B.; Batal, A. Effect of dietary nucleotide supplementation on performance and development of the gastrointestinal tract of broilers. Brit. Poult. Sci. 2012, 53, 98–105. [Google Scholar] [CrossRef]
  51. Superchi, P.; Saleri, R.; Borghetti, P.; De Angelis, E.; Ferrari, L.; Cavalli, V.; Amicucci, P.; Ossiprandi, M.; Sabbioni, A. Effects of dietary nucleotide supplementation on growth performance and hormonal and immune responses of piglets. Animal 2012, 6, 902–908. [Google Scholar] [CrossRef]
  52. Ma, Y.; Yang, X.; Hua, G.; Deng, X.; Xia, T.; Li, X.; Feng, D.; Deng, X. Contribution of gut microbiomes and their metabolomes to the performance of Dorper and Tan sheep. Front. Microbiol. 2022, 13, 1047744. [Google Scholar] [CrossRef]
Figure 1. Effects of the mixed silage on growth performance in Hu sheep (n = 6). (A) Average daily feed intake; (B) average daily gain; (C) feed conversion ratio. Control: control group, the control group with peanut sprouts, corn husks and sorghum husks as roughage; Silage: silage group, the silage group with the mixed silage as roughage.
Fermentation 10 00233 g001
Figure 2. The structural composition of fecal microflora in the control group and silage group (n = 6). (A) Principal coordinate analysis (PCoA) demonstrated the separation of microbial communities in the feces of Hu sheep fed two diets based on the Bray–Curtis dissimilarity matrix. The top ten phyla (B) and genera (C) of fecal microbiota in the control group and silage group. (D) Discriminant analysis of fecal microbial OTU of Hu sheep fed with diet in the control group and silage group, with LDA score > 3. Control: control group, the control group with peanut sprouts, corn husks, and sorghum husks as roughage; Silage: silage group, the silage group with the mixed silage as roughage.
Fermentation 10 00233 g002
Figure 3. OPLS-DA score plot and response permutation test of fecal microbial flora structure in the control group and silage group. (A) OPLS-DA score plot of positive ion metabolites. (B) OPLS-DA response permutation test for positive ion metabolites. (C) OPLS-DA score plot of negative ion metabolites. (D) OPLS-DA response permutation test of negative ion metabolites.
Fermentation 10 00233 g003
Figure 4. Enrichment analysis (KEGG) of metabolic pathways of differential metabolites in the feces of Hu sheep fed control and silage diets. (A) ESI+. (B) ESI−.
Fermentation 10 00233 g004
Figure 5. Spearman rank correlation between fecal microbiota and metabolites. Blue indicates negative correlations, and red indicates positive correlations.
Fermentation 10 00233 g005
Table 1. Experimental diet formula and nutrition level (DM basis/%).
ItemsTreatment 1
ControlSilage
Ingredients (% of DM)
Peanut seedling30-
Corn husk15-
Sorghum shell5-
Mixed Silage050
Corn3434
Soybean meal75.5
Bran7.58
Corn gluten meal-1
NaHCO30.50.5
Premix contained 20.50.5
Salt0.50.5
Total100100
Nutrient composition (% of DM)
Digestive energy/DE (MJ/kg) 313.5214.73
Metabolizable energy/ME (MJ/kg) 418.9320.62
Crude protein, CP15.0815.11
Ash4.3612.33
Neutral Detergent Fiber, NDF47.6448.23
Acid Detergent Fiber, ADF23.7127.17
Ca0.480.45
P0.380.39
Note: 1 Control: control group, the control group with peanut sprouts, corn husks, and sorghum husks as roughage; Silage: silage group, the silage group with the mixed silage as roughage. 2 Premix contained (per kg): VA 70~130 kIU, VD 315~30 kIU, VE ≥ 130 kIU, Fe 0.4~0.8 g, Mn 0.5~1.0 g, Zn 1.5~3.0 g, Cu 0.1~0.2 g, Se 4~8 mg, Ca 8~16%, P ≥ 1%, NaCl 5~10%. 3,4 DE and ME were estimated according to NRC (2007). The others were measured values. The experimental design of this study was the same as that of Li et al. [15].
Table 2. Contents of differential metabolites in feces (n = 6).
MetabolitesGroup 1VIP 2pFC 3TrendMode
ControlSilage
Amino acids, peptides, and analogues
DL-Alanine0.0790.2421.4030.0183.071UpESI+
Glycine0.0030.0111.6370.0013.633UpESI+
LEVODOPA0.0040.0081.4300.0131.950UpESI+
N,N-Dimethylglycine0.0120.0031.2770.0420.268DownESI+
Ala-Ile0.0650.0271.1190.0450.407DownESI−
Arginine0.0530.0041.2990.0060.079DownESI−
D-ASPARTATE0.6440.0931.3750.0020.145DownESI−
gamma-Glutamylleucine0.0830.0271.4070.0010.328DownESI−
L-Histidine0.0550.0071.1470.0460.136DownESI−
L-Phenylalanine1.6300.4741.1650.0400.291DownESI−
L-Valine0.0770.0181.1970.0220.231DownESI−
N-Acetylglutamic acid (NAG)0.6410.2301.2200.0120.359DownESI−
N-Isobutyrylglycine1.3450.0171.2060.0150.012DownESI−
N-Tigloylglycine0.8610.0031.1990.0250.004DownESI−
Benzoic acids and derivatives
2-Hydroxyhippuric acid0.5440.0071.1990.0280.013DownESI−
5-Methoxysalicylic acid0.0180.0051.1350.0490.277DownESI−
Butylparaben0.2310.0631.1440.0190.275DownESI−
Bile acids, alcohols, and derivatives
Cholic Acid0.0150.0091.4190.0110.578DownESI+
Glycochenodeoxycholate0.0140.0011.2740.0450.040DownESI+
GLYCOCHOLATE0.0050.0021.4110.0110.441DownESI+
Carbohydrates and carbohydrate conjugates
N-Acetylneuraminic acid0.0180.1331.4870.0067.483UpESI+
D-SACCHARIC ACID0.1660.0531.4250.0010.318DownESI−
N-Acetylmannosamine8.2522.3331.2320.0100.283DownESI−
N-Acetylmuramic Acid0.6360.1411.4250.0010.222DownESI−
Carbonyl compounds
Acetophenone0.2430.0351.6270.0010.145DownESI+
4-Hydroxybenzaldehyde0.8440.2761.4240.0010.327DownESI−
Eicosanoids
Prostaglandin B10.0070.0791.2720.00711.976UpESI−
Resolvin E10.0110.0541.3760.0024.752UpESI−
Fatty acids and conjugates
3,3-Dimethylglutaric acid0.6420.1101.577<0.0010.172DownESI−
3-Methylglutaric acid0.0500.2241.1540.0324.455UpESI−
Arachidic acid0.3221.4981.1260.0164.655UpESI−
Lauric acid0.0610.0271.2240.0060.454DownESI−
Isoflav-2-enes
Daidzein0.1760.0501.1470.0240.283DownESI−
Genistein2.5300.4421.3760.0020.175DownESI−
Pyrimidine 2′-deoxyribonucleosides
2′-Deoxyuridine0.0020.0061.5640.0033.150UpESI+
Thymidine0.0180.0511.3300.0302.752UpESI+
Tetrahydrofuran lignans
Enterolactone0.0180.1101.1180.0296.082UpESI−
matairesinol0.1630.0151.2020.0100.091DownESI−
Others
Benzothiazole1.2481.0731.2950.0330.860DownESI+
Metaxalone0.0030.0011.3190.0290.219DownESI+
9-Fluorenone5.1950.8121.1720.0170.156DownESI−
Abietic acid0.0050.0161.1350.0343.514UpESI−
Biotin0.0380.0821.1570.0472.143UpESI−
Bis(4-hydroxyphenyl)methane0.0280.0741.1680.0222.634UpESI−
cirsimaritin0.0330.0021.508<0.0010.074DownESI−
delta7-Dafachronic acid0.0900.0471.1040.0480.525DownESI−
Ecgonine0.3810.0621.1370.0500.162DownESI−
Piceatannol0.0100.0591.3930.0016.047UpESI−
Pseudouridine1.7980.4571.1600.0330.254DownESI−
Resveratrol0.0710.1721.1290.0312.420UpESI−
santin0.0190.0851.2860.0094.525UpESI−
URIDINE1.5020.4551.1200.0430.303DownESI−
3-Hydroxyphenylacetic acid0.1080.0211.519<0.0010.199DownESI−
adrenosterone0.0440.0011.3290.0020.025DownESI−
3-Indoxyl sulphate2.9110.0041.1600.0420.001DownESI−
Epinephrine0.1900.0001.2030.0240.002DownESI−
Isobutyric acid0.0850.0191.2080.0200.220DownESI−
Bisphenol A0.0030.0451.4090.00116.963UpESI−
Glabranine1.7080.0691.608<0.0010.040DownESI−
Stearamide0.0220.0101.3650.0160.448DownESI+
Chrysin0.0270.0011.553<0.0010.045DownESI−
Ferulic acid0.0050.0121.3750.0232.257UpESI+
afzelechin0.0200.1161.3880.0025.671UpESI−
3-(2-Hydroxyethyl)indole0.0730.0011.1710.0350.019DownESI−
D-(+)-Tryptophan0.4590.1651.1620.0410.360DownESI−
Equol0.0720.0031.478<0.0010.043DownESI−
Dihydrojasmonic Acid0.3060.1281.2690.0110.419DownESI−
13-HPODE2.2604.1751.0910.0341.847UpESI−
Vanillin0.0250.0051.3620.0030.192DownESI−
Formononetin0.0690.0031.522<0.0010.045DownESI−
2-Hydroxyphenylacetic acid0.0600.0041.3180.0030.060DownESI−
2′-Deoxyinosine0.0290.0651.3600.0212.221UpESI+
Uric acid0.6710.0831.1650.0380.124DownESI−
4-Pyridoxic acid0.0600.0261.2940.0420.426DownESI+
Cytosine0.0450.0991.5200.0042.218UpESI+
Acetylcholine0.1510.0301.2950.0430.200DownESI+
4-Methyl-2-oxovaleric Acid1.3760.4151.1620.0130.302DownESI−
Note: 1 Control: control group, the control group with peanut sprouts, corn husks, and sorghum husks as roughage; Silage: silage group, the silage group with the mixed silage as roughage. 2 VIP: variable importance in projection; 3 FC: fold change.
Disclaimer/Publisher’s Note: The statements, opinions and data contained in all publications are solely those of the individual author(s) and contributor(s) and not of MDPI and/or the editor(s). MDPI and/or the editor(s) disclaim responsibility for any injury to people or property resulting from any ideas, methods, instructions or products referred to in the content.

