Article

Evaluation of Pigment-Modified Clear Binders and Asphalts: An Approach towards Sustainable, Heat Harvesting, and Non-Black Pavements

1
Civil, Construction and Environmental Engineering Department, North Dakota State University, Fargo, ND 58102, USA
2
Department of Civil Engineering, University of Engineering and Technology, Taxila 47050, Pakistan
*
Author to whom correspondence should be addressed.
Infrastructures 2024, 9(5), 88; https://doi.org/10.3390/infrastructures9050088
Submission received: 25 April 2024 / Revised: 13 May 2024 / Accepted: 15 May 2024 / Published: 17 May 2024
(This article belongs to the Special Issue Sustainable and Digital Transformation of Road Infrastructures)

Abstract

:
Pavement construction practices have evolved due to increasing environmental impact and urban heat island (UHI) effects, as pavements, covering over 30% of urban areas, contribute to elevated air temperatures. This study introduces heat-reflective pavements, by replacing conventional black bitumen with a clear binder and pigment-modified clear binders. Titanium dioxide white, zinc ferrite yellow, and iron oxide red pigments are used to give asphalt corresponding shades. The asphalt and bitumen specimens were subjected to thermal analysis in heat sinks, under varying solar fluxes. The pigment dosage was maintained at 4%, according to the weight of the total mix, for all pigment types. The samples were heated and cooled for 3 h and 2 h, respectively. Mechanical testing was conducted to ascertain the impact of temperature variations on both the neat clear binder (C.B) and pigmented C.B and asphalt mixture samples. Wheel tracking and dynamic modulus tests were conducted to evaluate their performance under high temperatures. The results indicate that non-black asphalt mixtures exhibit significant temperature reductions, up to 9 °C, which are further enhanced by pigmented binders, up to 11 °C. It was found that asphalt with a clear or transparent binder demonstrated lower temperatures and faster heat dissipation in extreme conditions. Moreover, C.B asphalt mixtures displayed a rut resistance of 15%, with the pigmented C.B asphalt mixture showing a remarkable rut resistance of 73%, outperforming conventional asphalt. Non-black mixtures, especially C.B + zinc ferrite, showed improved resistance to permanent deformation in dynamic modulus tests.

1. Introduction

Pavement construction practices, using advanced and innovative materials and techniques, have been on the rise in recent years. This is to lessen the impact of infrastructure on adjacent areas and to address environmental issues [1]. It is becoming increasingly common for natural ground surfaces to be covered by pavements; pavements typically account for over 30% of typical urban areas [2]. Compared to natural ground surfaces, the higher thermal inertia and lower evaporation rate of pavements contribute to the formation of urban heat islands. This phenomenon results in air temperatures in urban areas typically being higher than those of surrounding rural regions, with temperature differences ranging from 10 to 21 °C [3,4].
Asphaltenes are a class of crude oil compounds that are black in color, contributing to the dark appearance of traditional bitumen [5,6]. Conventional bitumen, which has a high tinting strength, is responsible for the black color of asphalt [7]. Studies have demonstrated that the dark color of asphalt is the leading cause of pavement high surface temperatures [8,9,10,11]. Furthermore, hot pavements significantly intensify the urban heat island effect [3]. The U.S. Environmental Protection Agency (U.S. EPA 2008) has defined low-temperature intensive or cool pavements as a range of established and emerging pavement-related solutions and technologies. These innovative pavement solutions have the potential to significantly lower pavement surface temperatures and, consequently, reduce the amount of heat released into the atmosphere when compared to conventional pavements [12]. Implementing these alternative pavement materials and technologies has the potential to mitigate the urban heat island effect and provide substantial environmental benefits.
The extent of UHI depends on various factors, such as time, city dimensions, weather conditions, urban layout, surface material composition, vegetation, and human activities [13,14,15]. In pavement engineering, it is important to highlight that the thermal properties of materials, including pavements, are markedly influenced by solar radiation, leading to absorbed, reflected, and stored energies [16]. Historically, numerous early studies have focused on employing thermally optimized solutions for paving, such as utilizing clear or colored materials and porous surfaces [17,18,19].
Several strategies for reducing the surface temperature of pavements have been developed to alleviate the urban heat island (UHI) effect. These strategies include heat-reflective pavements with surface coatings, evaporative pavements with porous surface layers, thermally modified pavements, and pavements with phase-change materials for heat storage [20,21,22,23,24,25]. As a result of the utilization of transparent bitumen by the asphalt industry, roads may be constructed in any color [26]. Producing colored asphalt mixtures for road pavements is essential to meet environmental, aesthetic, and functional requirements [27]. There are three different processes through which transparent bitumen can be produced, as follows:
  • The modification of bitumen, by removing the asphaltene responsible for its dark color [6];
  • Synthetic binders produced using naturally transparent and special polymer materials [28,29];
  • Proper resins combined with bio-oils or organic, renewable raw materials from vegetable sources [27,28]. While these materials are not bituminous, they display rheological properties similar to bitumen, making them appropriate for the construction of roads [6].
The literature has also demonstrated that clear binders and asphalt made with clear binders perform similarly to conventional bitumen and the corresponding asphalt mixtures (HMA) [30,31]. In addition, a recent study shows that clear binders and corresponding asphalt can dissipate heat faster and absorb heat slower than conventional black bitumen [32]. Moreover, studies have also shown that traditional binders and asphalts, when mixed with metal oxide pigments, increased the thermal conductivity of the pavement, which resulted in a significant enhancement of the high-temperature performance of the wearing course [33]. Furthermore, researchers have investigated the feasibility of utilizing innovative mixtures of clear and colored materials on pavement surfaces to mitigate the UHI effect by increasing the albedo and reducing the surface temperature [34,35,36]. It has been shown that clear mixtures reduce the temperature significantly compared to conventional black surfaces. It has also been shown that the surface color influences the thermal response and that oxide-modified mixtures exhibit promising mechanical properties, suggesting that they may be utilized in residential areas with low traffic [37]. Hence, altering the color of conventional black binders to any non-black color, or solely using a colorless binder, could result in durable and cooler pavement structures.
Colored asphalt pavements primarily include light-colored pavements and pigmented pavements [27]. In the former approach, the aggregates are covered and bound using transparent bitumen instead of traditional black bitumen. In areas with a significant landscape or areas of historical and cultural significance, these types of transparent bitumen enhance the natural color of mineral aggregates. In the latter type, transparent bitumen is blended with pigments in asphalt mixtures or artificially colored aggregates are incorporated into the mix to create a specific aesthetic feature [27].
During hot and sunny seasons, colored pavements display higher reflectance characteristics than traditional asphalt pavements [37]. Hence, those surfaces are less likely to absorb solar radiation and remain cooler when exposed to sunlight. As a result, the air temperature in the surrounding areas decreases, because less heat is transferred from the pavement to the air [11,38]. These pavements are also highly reflective, reducing the likelihood of overheating during the summer, which increases pavement durability and reduces damage [39]. It has also been demonstrated that transparent bitumen can lessen illumination needs, thereby decreasing electricity costs [27]. As part of an effective traffic management program, colored asphalt pavements might also be used to identify bus lanes, sidewalks, crosswalks, and pedestrian areas [30].

2. Objectives and Experimental Approach

This study aims to evaluate the thermal characteristics and structural performance of various non-black asphalt binders and mixtures, compared to conventional black bitumen and asphalt. Specifically, we aim to evaluate the heat conductions, absorption, and the rate of heating and cooling of pigment-modified and unmodified clear binders (C.B.) and asphalt mixtures, in comparison to conventional black bitumen and asphalt. The structural performance will be assessed using wheel tracking and dynamic modulus tests. Temperature measurements will be taken at five different depths for all the modified and unmodified binders and asphalt to analyze their thermal characteristics. Solar flux densities will be used to calculate the corresponding power and voltage applied to a silicon plate heater. The temperature measurements are recorded using a highly sensitive data acquisition system and highly calibrated thermocouples.

3. Materials and Methods

3.1. Binders and Aggregates

For this study, a clear asphalt binder (provided in Figure 1a [1]) was imported from China, which comprises thermoplastic bicomponent resins, whose color ranged from straw yellow to amber orange [1]. While locally manufactured conventional bitumen (ARL 60/70 pen grade) was used, which is the most used bitumen grade across the country. However, in this study, it was only used for a comparison. Our recently published research provides the conventional properties of both binders [32]. The aggregates used in this research were obtained from the Margalla quarry source. The aggregates from this quarry are limestone (basic) in nature [40], as calcium carbonate is a substantial portion of this quarry. The thermal properties, like the thermal conductivity and specific heat of the various materials used in this research, are summarized in Table 1.

3.2. Pigments

For the thermal analysis, titanium dioxide white and zinc ferrite yellow were used. However, iron oxide red was also used for mechanical testing, apart from titanium dioxide and zinc ferrite. All these pigments were imported from China. The distinct properties of all three types of pigments were extracted from their technical data sheets (TDSs) and are provided below in Table 2.

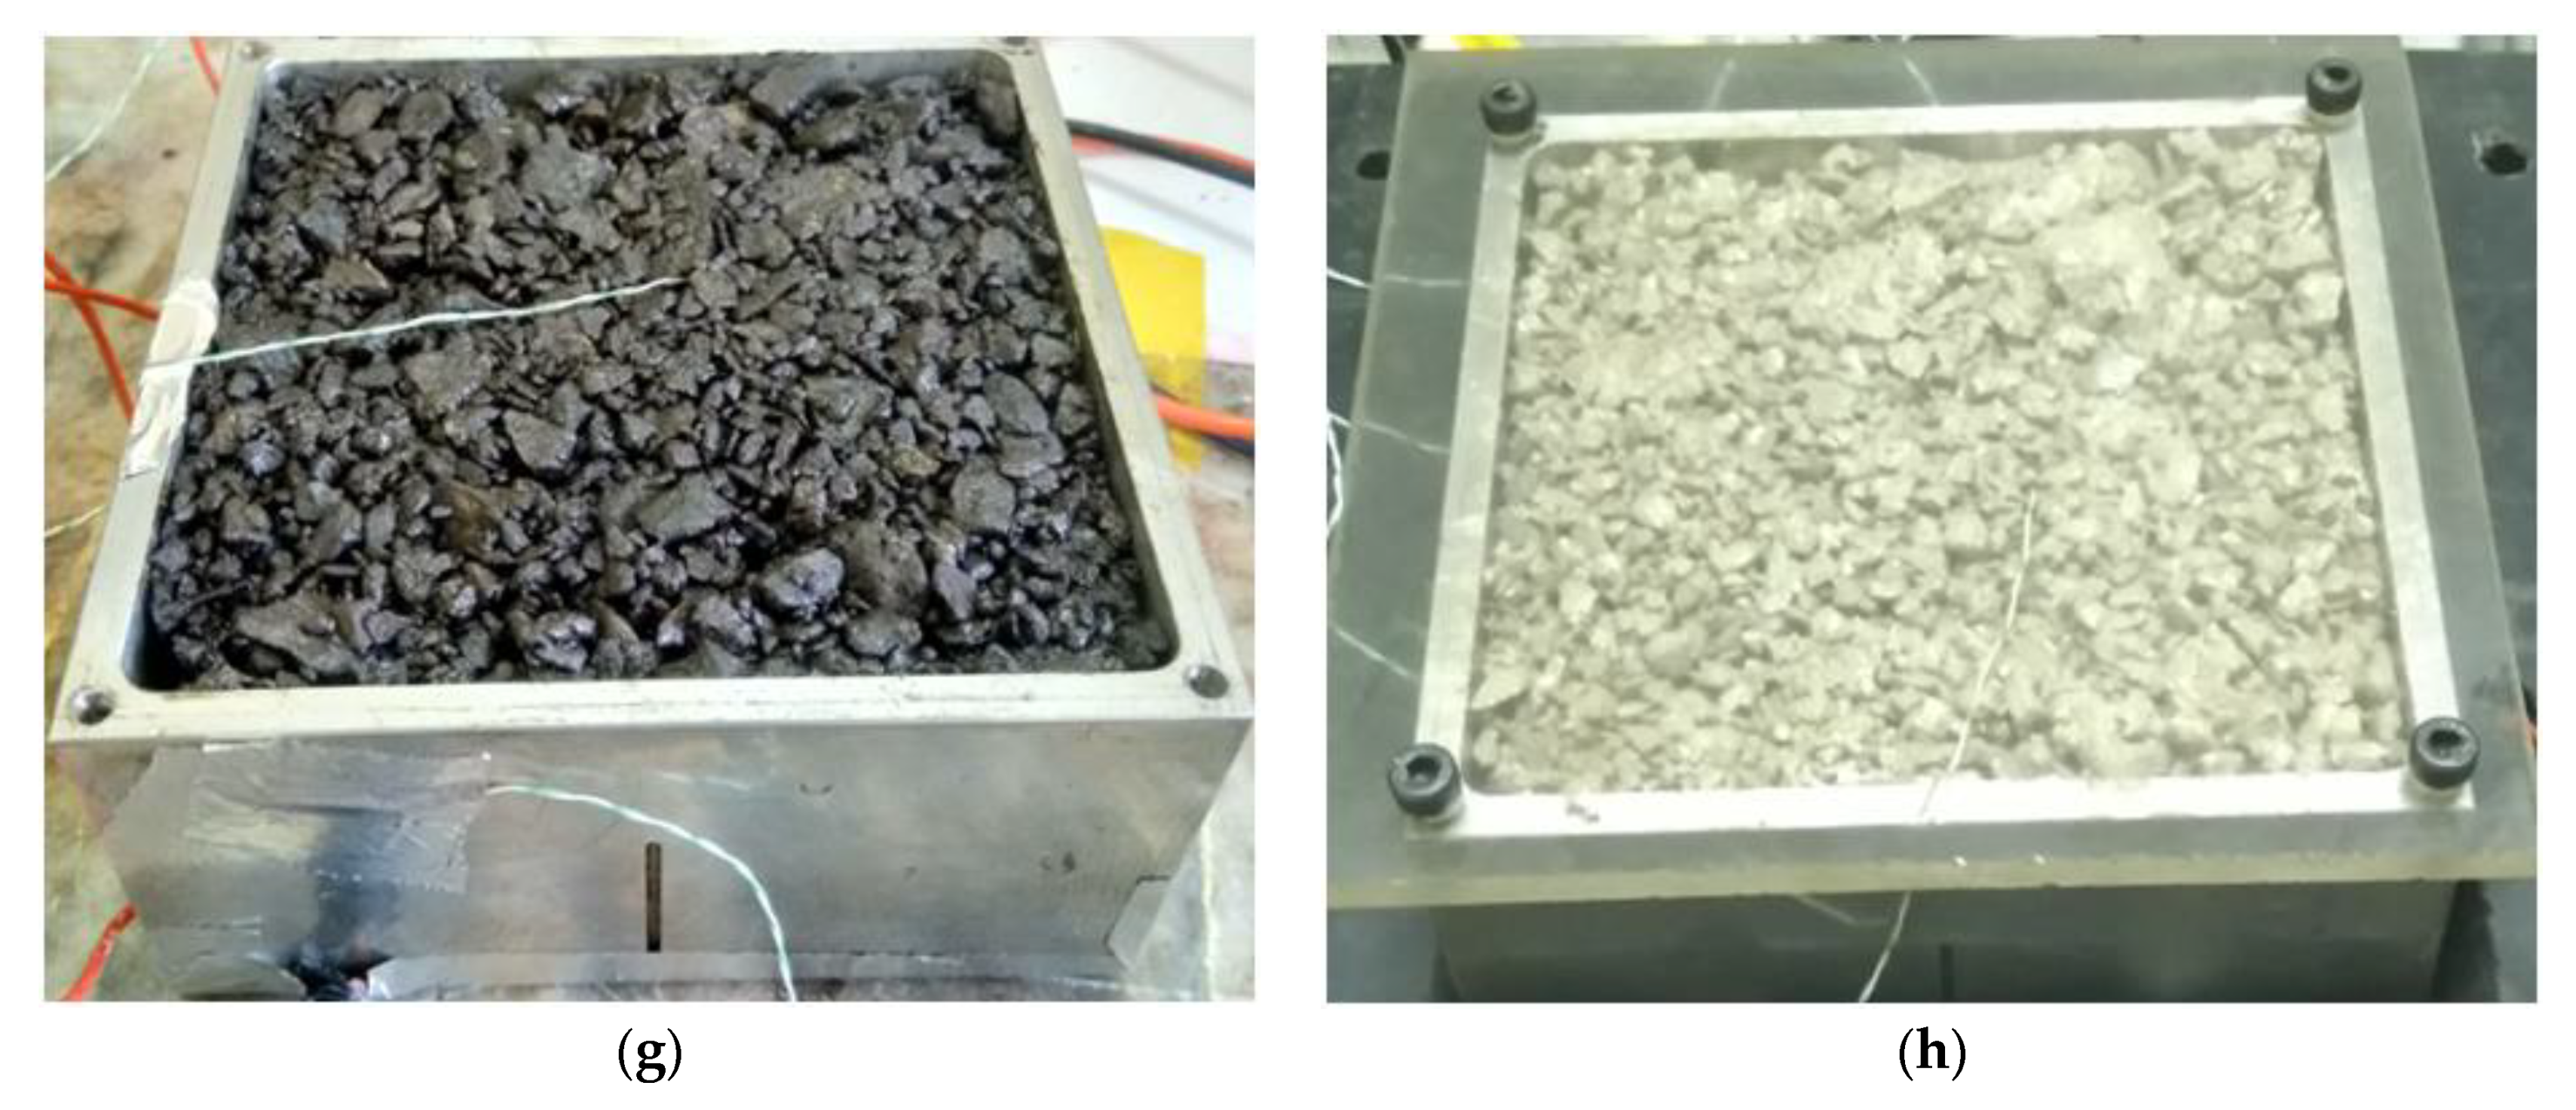
3.3. Material Mixing

The national highway authority’s (NHA) Class-B mid-point gradation (provided in Figure 1b) was followed to prepare the asphalt mixtures, which is the finer gradation for the asphalt wearing course. The maximum particle size in this gradation is 12.5 mm (about 0.49 in). After using the Marshall mix design method, 4.4% of optimum binder content was found for both the conventional and clear binder. Previous studies recommend a pigment concentration of 3–5% for asphalt coloring purposes [50,51]; however, a mean value of 4% was adopted in this study. Hence, a ratio of 4.4:4 was used to mix the binders with the pigments to make the pigmented binder samples. This was achieved using a mechanical stirrer, equipped with a simple fan blade configuration.
Similarly, 4% pigment, according to the weight of the total aggregate mix, was used for the asphalt mixture preparation. It was also ensured that the job mix formula (JMF) was not disturbed, so the 4% pigment weight was subtracted from all the sieve size aggregates corresponding to their percentage in the total mix. The aggregates were heated at 130–140 °C, before mixing them with the pigments. The pigments were then mixed with the aggregates for 60 to 90 s. To prevent pigment lumps or accumulations, a minimum mixing time of 10 to 15 s was ensured [52].

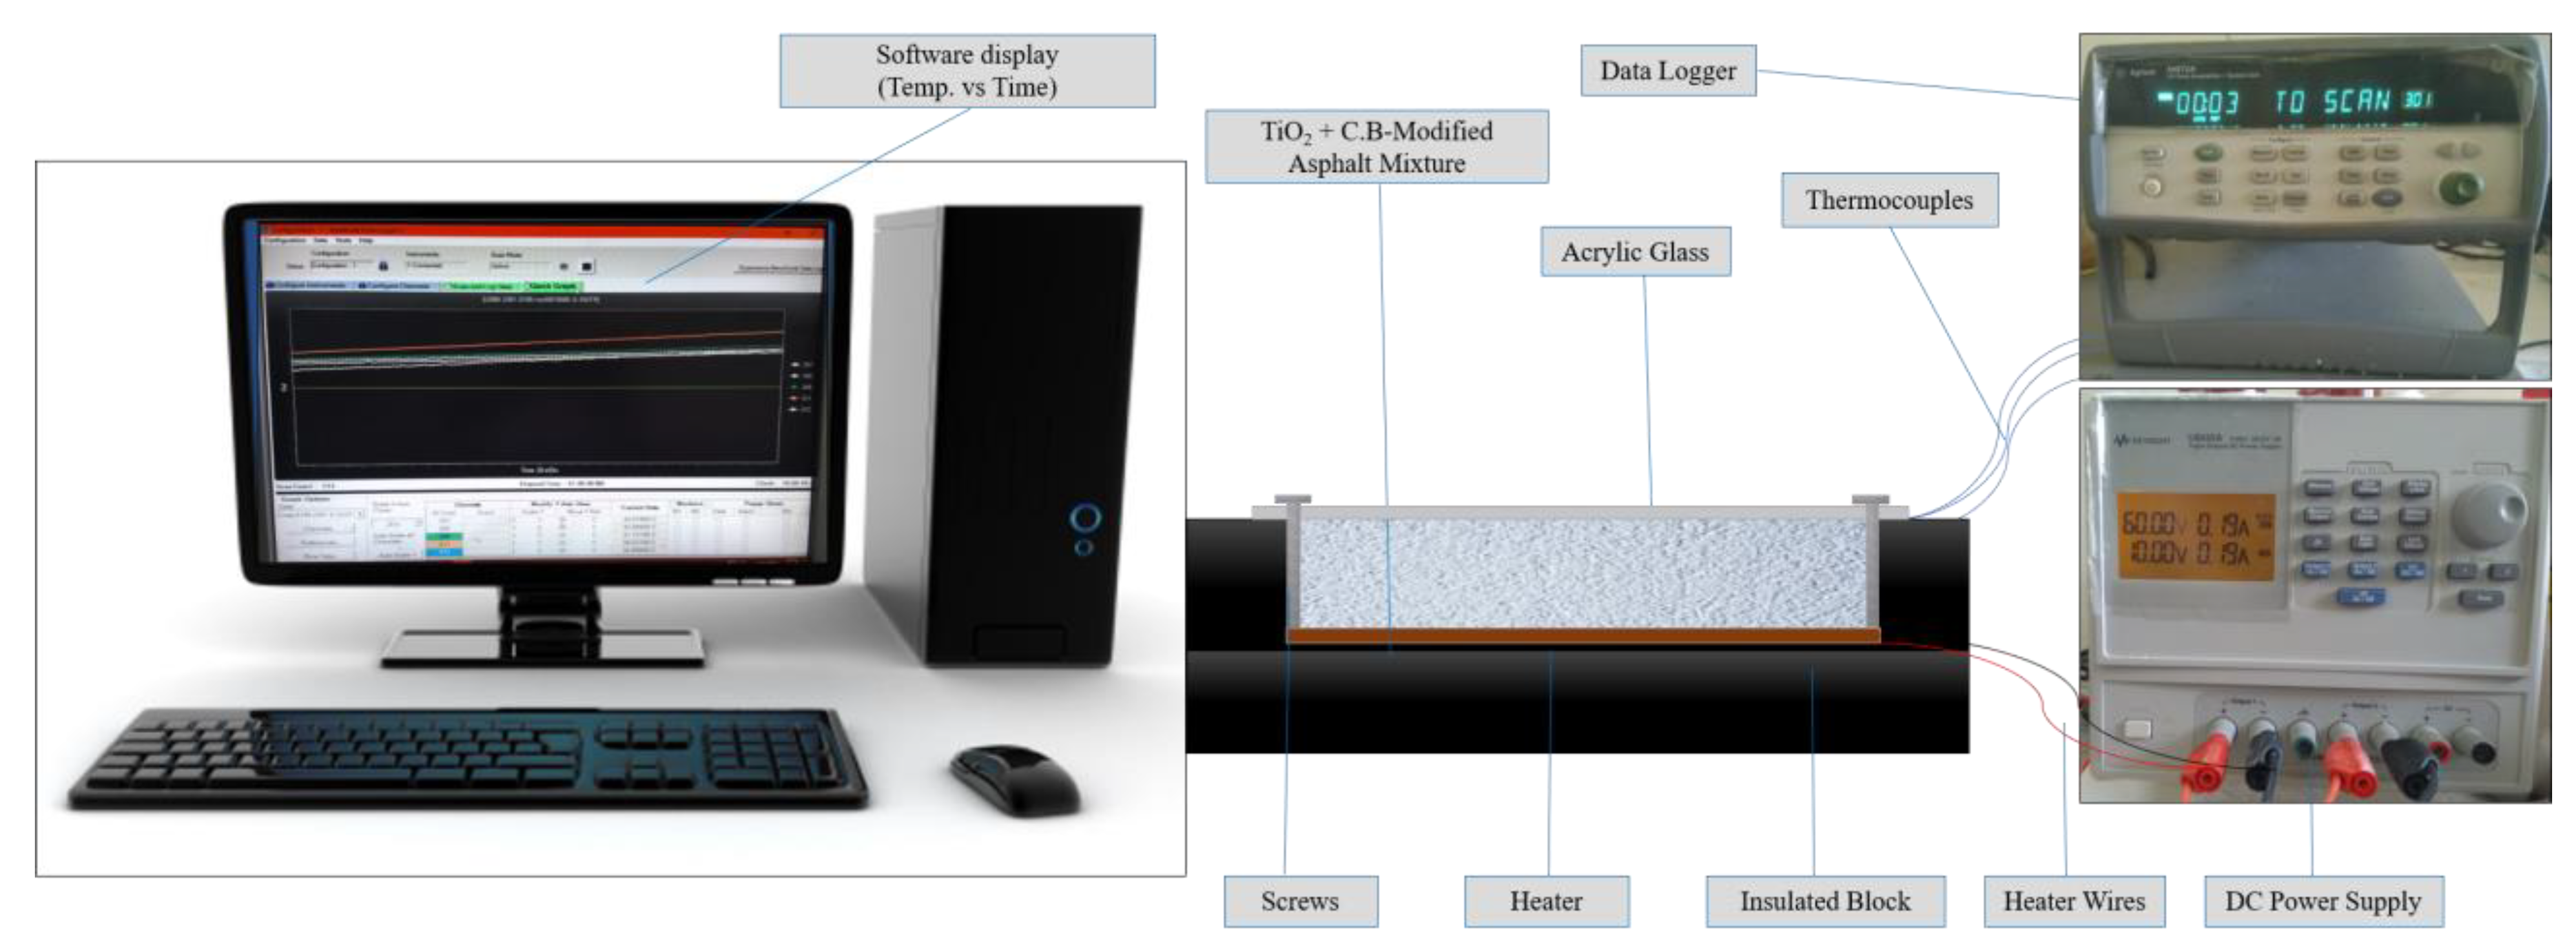
4. Experimental Setup

This study is broadly classified into two phases of laboratory testing. The first is thermal testing, and the second one is mechanical testing.

Thermal Testing Setup

During the design and manufacturing process, two aluminum heat sinks were designed and manufactured; the larger heat sink was intended for asphalt mixture analysis, while the smaller heat sink was designed for binder analysis. The walls of each heat sink were 5 mm (about 0.2 in) thick. The heat sink walls were lined with fiber block insulation to ensure a one-dimensional heat flow. A 5 mm thick piece of acrylic glass was also mounted on the top of each heat sink and tightened with screws on each side. The base of each heat sink was provided with two slots, measuring 1.5 mm (about 0.06 in) in depth, to enable the temperature measurements. K-type thermocouples were positioned in these slots. To provide heat, silicon plate heaters from Omega Engineering USA [52] were installed at the base of the heat sinks, as the energy source. Aluminum tape was used to secure the heaters and to ensure that the entire assembly was stable and airtight. K-type thermocouples were placed at five different depths within the heat sinks to measure the temperature at various locations within the specimens. The Agilent 34972A data acquisition system was used to monitor and record the temperature at these thermocouples. A DC power supply (Keysight U8032A) was used to supply power to the silicon plate heaters. A cotton covering was applied to the extended portion of the fiber block insulation on the heat sinks to prevent unwanted heat loss. This measure was taken to ensure the accuracy and reliability of the temperature readings.
Under the Energy Sector Management Assistance Program (ESMAP), data was obtained from the World Bank via ENERGYDATA.info [53]. Three flux densities of 800, 1000, and 1200 W/m2 were selected for analysis. After converting the flux density to power using Ohm’s law, the base area of the heat sink was considered to compute the corresponding power. The conversion resulted in the respective voltage and current values for each flux. A DC power supply was used to supply the corresponding power values (V × I) to the heater and, then, to the asphalt binder/mixture sample.
The charge time was defined as three hours, during which the power was supplied. The temperature was automatically recorded every 5 s during this period. The power supply was disconnected after the 3 h charging period, and the temperature measurements were continuously recorded during the following two hours, called the discharging period. Analysis was conducted throughout the 5 h period, i.e., both the heating and cooling cycles. To ensure consistency, the heating and cooling of the samples was performed in identical conditions (room temperature). Table 3 shows the dimensions of the heat sinks, the dimensions of the silicon heaters, and the locations of the thermocouples inside the heat sinks.
The flow chart in Figure 2 illustrates the steps involved in preparing the binders and mixtures, installing the thermocouples, and applying the heat (power) to them. It is important to note that all of the pictures do not reflect the preparation of one sample type; however, the images are combined randomly to reflect the sequential steps. Furthermore, Figure 3 and Figure 4 depict the schematics of the laboratory setup and 3D views of both heat sinks, respectively.

5. Results and Discussion

Eight combinations were prepared and evaluated for each of the three heat fluxes. The first four samples were asphalt mixture samples, while the remaining four were corresponding bitumen samples. It should be noted that all the tests were conducted at room temperature and that the cooling of all the samples was accomplished through natural convection.

5.1. Thermal Analysis of Asphalt Mixtures

Conventional asphalt, a clear binder (C.B), and the pigmented C.B-modified asphalt (white and yellow) specimens were meticulously prepared and placed into a large heat sink for thermal analysis. Each asphalt mixture was subjected to flux densities of 1200, 1000, and 800 W/m2 for three hours (heating time). The specimens were subsequently allowed to cool for two hours (cooling time). Before applying heat, the samples were cooled to room temperature. During the 5 h temperature cycle, the heat storage and dissipation behavior of the pigmented modified and clear binder asphalt mixtures were compared to conventional black asphalt. The goal was to observe whether there was any enhancement in the heat dissipation and diminutions in the heat storage behavior between the conventional and modified asphalt mixtures.
Figure 5a–d shows the temperature curves for the five-hour test period of all four asphalt mixtures at 1200 W/m2. T1-T5 represents the temperature at the five thermocouples from the heat sink’s base to the top (50 mm), respectively. Also, the average curve “Avg” was drawn, showing the average temperature of the entire 50 mm sample. As the heat source is applied to the mixtures, the temperature increases w.r.t time. Figure 5a shows three significantly different temperature readings at the five thermocouples. The T4 and T5 readings almost overlap until half of the heating time has elapsed. Similarly, there is no significant difference in the temperature readings for T1 and T2 in the first 20 to 30 min. The overlapping region indicates similar heat absorption at that specific time. However, the temperature curve for thermocouple T3 significantly differs from the four neighboring thermocouples. It is also worth noting that, although the curves are parabolic, they are more inclined towards linear behavior. The maximum surface temperature of asphalt (T2) is close to 65 °C, which is almost the same as the actual pavement surface temperature during peak summer [24], and the temperatures closer to 70 °C are responsible for the UHI effect [54]. The higher temperature curves, seen in Figure 5a, also indicate lower thermal conductivity and higher specific heat of conventional asphalt, which traps the heat in the asphalt for extended periods, elevating the overall temperature of the structure. The average “Avg” curve represents the average temperature of the 50 mm thick asphalt mixture sample and, in the first case, it almost overlaps with the temperature curve for T3. Hence, we can conclude that the average temperature of the 50 mm thick conventional asphalt lies at a depth of 10 mm (about 0.39 in).
The heating trend is pretty much different in the rest of the three asphalt mixture combinations, as seen in Figure 5b–d. Unlike conventional asphalt, the curves overlap only between T3 and T4 during almost the whole first hour of heating. However, in part (d) of Figure 5, there is no significant overlapping of the temperature curves. It means that all the modified asphalt mixture combinations distribute the heat evenly down the structure. Hence, the chances of heat accumulation are less. Moreover, the average curve for all the modified combinations is just above the T3 curve; thus, the average temperature of modified asphalt mixtures lies at a depth of less than 10 mm. This makes heat dissipation easier and faster for these mixtures, than for conventional asphalt. It is also worth noting that the gap between the T2 and T5 curves, representing the surface and 50 mm (about 1.97 in) temperatures, respectively, is significant for all the modified combinations compared to conventional asphalt. The gap between the T2 and T5 curves represents around a 4 °C gap in the temperature for the traditional black asphalt, while it is 7–8 °C for the other modified combinations. The maximum temperatures for all three combinations are around 52–53 °C in the modified mixtures. Therefore, it is easier for them to dissipate heat quickly.
Also, these combinations are less likely to participate in UHI augmentation, as their maximum absorbed temperature is far less than 70 °C. Many researchers have studied UHI mitigation by introducing pigments into asphalt mixtures. There was a maximum difference of 11 °C and an average of 7.5 °C between yellow pigment-modified asphalt pavement samples and conventional asphalt mixtures [55]. Similarly, pigments have also been found to cool the internal structure and surface of the pavement, making solar heating reflective coating layers (SHRCLs). Studies have reported a 10 ± 2.5 °C difference between unmodified asphalt and SHRCL surfaces [56]. Also, the internal temperature of asphalt was reduced by 11.5 °C and 13 °C with pigment G and pigment Y blends, respectively [35].
Figure 6a,b represents the mean temperature of all four asphalt mixture combinations at 1000 and 800 W/m2. The starting temperatures of the titanium dioxide and zinc ferrite C.B-modified samples are a little higher than room temperature; however, it does not affect the objectives of this study, as we aim to observe the maximum temperature absorbed by a sample at the end of the heating phase. Again, there is a massive difference between the conventional and modified mixtures at the end of the heating phase. The pigmented C.B mixtures have almost the same temperature throughout the heating and cooling phases at both fluxes. However, the neat C.B. asphalt mixture temperature is between that of the conventional and pigmented mixtures.

5.1.1. Thermal Analysis of Binders

Like Figure 6, a similar discussion applies to Figure 7a–d, which illustrates the heating and cooling behavior of conventional black bitumen, the neat clear binder, the titanium dioxide-modified clear binder, and the zinc ferrite-modified clear binder, respectively. Compared to Figure 6a, Figure 7a exhibits an almost identical pattern of overlapping curves; however, in the second half of the heating phase, the average curve does not overlap with T3, indicating a lower average temperature than the asphalt mixtures. The “Avg” curve indicates the mean temperature of a 25 mm (about 0.98 in) thick binder sample, which is close to the temperature at a depth of 6–7 mm. The most significant difference between all four samples is the temperature gap between T1 and T2. Unlike conventional asphalt, which allows the surface base of the heater to reach 72 °C (approx.), the C.B. and pigmented C.B. binder absorb and dissipate heat effectively, limiting T1 to 62 °C and below. As an additional point of interest, both virgin binders (black and transparent) exhibit similar temperature distributions between T2 and T5 (except for the actual temperatures). However, both pigmented C.B binders resist heat transfer and storage at the bottommost part (25 mm) of the sample. This could be attributed to the efficient heat dissipation capability of the pigments. Overall, the lower specific heat and higher thermal conductivity of pigments enable the corresponding samples to quickly dissipate heat back into the walls of the container (environment). This results in the samples staying at lower temperatures for an elongated period, thus decreasing the time required to cool down.
The shape of the curves in Figure 7 appear to be more bent during the heating phase, as opposed to the heating pattern of the asphalt mixture. Consequently, the change in heat over time is not linear, since binders, being viscoelastic, are highly susceptible to temperature changes [57]. The graphs demonstrate that the samples with pigment modifications tend to retain heat more in areas close to the heat source, leading to a faster dissipation of heat (when the heat supply is turned off). However, neat binders evenly distribute heat, resulting in higher temperatures at the end of the heating phase. The cooling behavior in almost all the graphs is identical; however, for conventional binders, T1 shows an abrupt cooling pattern similar to that of heating.
Figure 8a,b illustrates the mean temperature of all four binder combinations at 1000 and 800 W/m2. The starting temperature of the zinc ferrite C.B-modified sample is a little higher than the other samples; however, it does not affect the objectives of this study, as we aim to observe the amount of heat absorbed and dissipated at the end of the heating and cooling phase, which is independent of a difference of 2–3 °C in the initial temperatures. As is evident from the above comparison, there is a significant difference between the modified and conventional binders in terms of the absorbed temperature at the end of the heating phase. Pigmented C.B binders maintain, approximately, the same temperature at both flux levels throughout the heating and cooling phases. However, the neat C.B temperature is slightly higher than the pigmented binder temperature. On the other hand, the black binder appears to have absorbed the maximum temperature. The results of a similar study, in which the heat dissipation and energy storage capabilities of nano-modified binders were studied using the same test conditions, also support our findings. Nano-modified binders were reported to stay 8–10 °C cooler than unmodified binders [58].

5.1.2. Heating and Cooling Trends

Another factor that requires discussion in this study is the variation in the heating rate, in addition to the change in the elevated temperature. Since we are primarily concerned with asphalt mixtures as the actual materials used for road paving, the scope of this analysis is limited to asphalt mixtures only. We set a target temperature range of 45–50 °C (heating time) and 50–45 °C (cooling time) for every sample. The calculations are shown for a flux density of 1200 W/m2 for the heating and cooling phases, which is the extreme case in this study. The heat maps show the time each sample took to attain the designated temperature. As a point of clarification, both the heating and cooling rates were measured against the average curve, which reflects the overall temperature of a 50 mm sample.
Figure 9a shows the variation in heat intensity over time and the time each sample took to reach the designated temperature, i.e., 50 °C. The heat map of the heating time (Figure 9a) shows that the conventional asphalt mixture reached the target temperature in 0.4 h, while the neat clear binder took slightly less than twice the time to achieve 50 °C. Moreover, both C.B-pigmented asphalt mixtures took over an hour to attain the target temperature. However, the titanium dioxide-modified mixture proved to be the most resistant asphalt mixture to temperature absorption. Pigmented mixtures are highly thermally conductive, so they conduct heat to the outside and take longer to reach the same temperature. This property results in a faster heat dissipation rate in pigmented mixtures, resulting in cooler pavement structures. In addition, it also contributes to reducing the UHI effect and increasing the resistance to permanent deformation.
Similarly, Figure 9b shows the comparative cooling time of the asphalt mixture combinations. The time taken by all the mixtures (from 50 °C to 45 °C) was observed and used to draw heat maps. Also, the heat maps indicate the change in temperature for each mixture over time. The heat maps display a significant difference in the time taken by all the asphalt mixtures to attain 45 °C. Conventional asphalt took almost 0.45 h to drop its temperature to 5 °C. Similarly, asphalt prepared with a neat clear binder took nearly 0.35 h to drop its temperature. Adding pigments to the C.B asphalt mixtures made the cooling process even quicker. Hence, titanium dioxide C.B-prepared asphalt took the shortest time to reduce its temperature, while zinc ferrite took around 0.31 h to drop to 5 °C. Therefore, the heating and cooling analysis reflects the material’s thermal conductivity and specific heat values (from Table 1). Consequently, non-black asphalt mixtures are preferred over conventional asphalt due to their cooling behavior. Additionally, the cooling analysis has demonstrated that pigmented asphalt mixtures conduct more heat and effectively dissipate heat. This property could be directly attributed to UHI mitigation and a lower pavement temperature. The heat energy dissipation, in a similar study, also reported 8% to 9% of heat being dissipated by nano-modified bitumen, while the corresponding asphalt mixtures dissipated 14–16% of the absorbed heat [58].
The rate of heating and cooling of the binder combinations was also studied apart from observing the heating and cooling trends of the asphalt mixtures. Figure 10a demonstrates the time all the four binder combinations took to get from 45 °C to 55 °C. The time at 45 °C is considered the starting time, while the time corresponding to 55 °C is regarded as the final time. As binders are more temperature sensitive, a temperature bracket of 10 °C was considered to observe the heating and cooling time. The conventional binder reached the target temperature in less than half an hour, while the neat clear binder took twice the time, i.e., one hour. Adding pigments to the clear binder further increased the heating time, making it more resistant to absorbing higher temperatures. There is no relatively significant difference in the cooling time between the binders, as seen in Figure 10b. However, the neat C.B and pigmented binders took less time than conventional black binders to cool down from 55 °C to 45 °C.

5.1.3. Heat Maps

Although previously discussed graphs present the temperature behaviors of different asphalt binders and mixtures, it is essential to visualize the relative heating and cooling behaviors over time. Figure 11 illustrates the heat maps of all four combinations at 1200 W/m2, and these graphs depict the temperature intensities of the average curves, which is the overall temperature of the 50 mm (mixtures) and 25 mm (binders) thick samples. The most significant difference, as seen in both the images in Figure 11a,b, for the asphalt mixtures and bituminous binders, respectively, is the temperature intensity. However, in the asphalt mixtures, the conventional black asphalt maintains the highest temperature level absorbed for up to 20–30 min, even after turning off the power supply (cooling time). Moreover, at 45 °C and above, the temperature is expanded from the second to the fourth hour of the test duration.
In contrast, apart from the much lower temperature intensities, the neat clear binder and pigment-modified clear binder mixtures depict a higher temperature expansion for a maximum of two hours. The pigment-modified mixtures have nearly the same temperature pattern over the 5 h test cycle, except for titanium dioxide, which is more efficient during the cooling period. Furthermore, from the scale used, the difference in the maximum absorbed temperature between the black and non-black mixtures is around 15 °C.
Maintaining the highest temperature absorbed during the start of the cooling period can also be seen in the case of conventional black bitumen, as seen in Figure 11b. However, the clear binder and pigmented clear binders showed immediate cooling after switching off the power supply. The final cooling temperature is much higher for the clear and pigmented binders than for black bitumen. The difference in the maximum temperature between the black and non-black binders is also around 12–13 °C. The heat maps indicate that conventional black asphalt stores the highest temperature and stays at elevated temperatures for extended periods, which significantly aids the UHI effect [59].

5.2. Performance Analysis of Asphalt Mixtures

Performance tests were also performed in this study to observe the reflectance of thermal enhancement on the functional/structural performance of the corresponding asphalts.

5.2.1. Rut Resistance of Asphalt

According to the BS EN 12697-25 [60] standard, the Cooper wheel tracking test (CWTT) was performed to determine the resistance of various asphalt mixtures to permanent deformation or rutting. A slab measuring 300 × 300 × 50 mm3 was prepared and compacted using a Cooper roller compactor to perform the test. A wheel with a load between 700 and 740 N was used to pass each sample 10,000 times, and the rut depth was measured. A wheel with a diameter of 8 inches and a thickness of 2 inches was used. In addition, the machine ran at 26.5 rpm at 55 °C. Figure 12 shows the results of the CWTT. The rutting potential of five asphalt mixture combinations was measured, including conventional black asphalt, asphalt prepared with the neat clear binder, and pigment (red, white, orange)-modified C.B asphalts.
From the graph (Figure 12), it is clear that the neat C.B asphalt and all pigmented C.B asphalt mixtures demonstrated a significant increase in rut resistance over conventional black asphalt. It is evident that the rut value has decreased by 5 mm, which means that the rut resistance has increased. The maximum rut depth of around 5.8 mm was observed for conventional asphalt. In contrast, rut depths of 5.1 mm, 5 mm, 3.5 mm, and 1.8 mm were recorded for the neat C.B, iron oxide red, titanium dioxide white, and zinc ferrite orange asphalt mixtures. Hence, it can be concluded that the maximum rut depth was observed for conventional asphalt; however, the neat C.B, red, white, and orange-pigmented asphalt mixtures showed lesser rut depths. The zinc ferrite orange asphalt mixture was the most resistant to ruts, followed by titanium dioxide. Furthermore, one of the objectives of this research was to enhance the high-temperature performance by adding pigments and replacing the black binder, which was also achieved during the thermal analysis.
As demonstrated by the permanent deformation analysis, the increase in stiffness of the asphalt mixtures at higher temperatures indicates an improvement in the colored binder’s elastic response. This improves the performance of the asphalt mixtures at high temperatures. Additionally, the observed reduction in the pavement temperature, even by as little as 5 °C, can notably enhance the dynamic stability and rut resistance of asphalt, particularly as temperatures rise [61], apart from the reduction in heat islands. Furthermore, the high viscosity of colored asphalt is identified as a contributing factor to increased rut values [62]. This highlights the multifaceted nature of colored asphalt’s performance characteristics.

5.2.2. Dynamic Modulus Test

Various asphalt mixtures, including conventional asphalt and asphalt mixtures prepared with different combinations of clear binders (C.B) and pigments, namely, iron oxide red, titanium dioxide white, and zinc ferrite orange, were tested for dynamic modulus to determine their resistance to permanent deformation. A Superpave gyratory compactor was used to prepare cylindrical specimens, with a diameter of 150 mm and a height of 170 mm. Moreover, 600 kPa of pressure at 160 °C was applied to achieve the specified specimen height. From the compacted samples, specimens with a diameter of 101.6 mm and a height of 150 mm were extracted. The dynamic modulus was measured at frequencies ranging from 25 to 0.1 Hz, under various loading conditions, namely 1050, 525, 195, and 52.5 kPa. The AASHTO TP 62 [63] guidelines were followed for sample preparation and testing. To account for the regional climatic conditions, the tests were conducted at both 40 °C and 55 °C. Figure 13 illustrates the dynamic modulus test results. Also, Figure 14 shows the five colored cylindrical samples before and after cutting.
The dynamic modulus directly indicates a material’s resistance to permanent deformation, commonly known as rut resistance [64]. It can be seen from the graph (Figure 13) that the conventional asphalt has a lower dynamic modulus than asphalt mixtures prepared with a clear binder only and those containing red iron oxide pigments, white titanium dioxide pigments, and orange zinc ferrite pigments, particularly at higher temperatures. The dynamic modulus of pigmented asphalt mixtures appears to be higher for a range of frequencies, indicating a better performance when compared to pigmented asphalt mixtures.
In particular, the zinc ferrite orange-pigmented clear binder (C.B) asphalt exhibits the highest dynamic modulus and, therefore, the highest rutting resistance of all combinations. Asphalt prepared with C.B modified with Fe2O3 takes second place, while TiO2+C.B-pigmented asphalt takes third place. On the other hand, the neat clear binder (C.B) asphalt exhibits the lowest dynamic modulus and rut resistance compared to the colored mixtures. However, it still shows increased resistance than conventional black asphalt mixtures. It is evident that the higher the value of dynamic modulus, the higher the resistance against permanent deformation and vice versa, which means that it is a direct measure of rut resistance [64].
All the mixtures generally exhibited a higher dynamic modulus at lower temperatures (i.e., 40 °C). However, it was lower at higher temperatures (55 °C). This indicates that asphalt is a highly temperature-dependent material, indicating greater rut susceptibility at higher temperatures [65]. Overall, these dynamic modulus test results suggest that the addition of pigments, specifically zinc ferrite orange, significantly improves asphalt resistance to permanent deformation at higher temperatures, demonstrating the potential benefits of these pigment additives when it comes to improving the durability and performance of asphalt pavements. It is evident from these findings that pigment additives are essential for enhancing rut resistance in asphalt pavements under a variety of climatic conditions. These findings have significant implications for the design and construction of asphalt pavements. Furthermore, it has also been reported that adding pigments to asphalt mixtures improves the mixture’s high-temperature performance by reducing its surface and internal temperatures, while not compromising its fatigue life [33].

5.3. ANOVA (Analysis of Variance) Analysis

Based on the thermal testing results, the ANOVA analysis in Table 4 shows significant differences between conventional and other binders. The F-statistic indicates a statistically significant difference between the binder groups compared to a p-value of 0 (rounded). A significant F-statistic demonstrates different heating rates between the binder groups. The ANOVA results do not explicitly provide statistics about the cooling behavior; if the heating behavior differs significantly between the groups, we can infer that binders will also display different cooling behavior. We can examine the ANOVA results between the binder groups to understand how the clear binder (C.B) compares to the conventional binder (conv. black asphalt). The thermal test results indicate that the clear binder is slower to heat up than the conventional black asphalt (i.e., average for clear binder = 41.1069, average for conv. black asphalt = 49.0344).
Similarly, conventional asphalt (conv. black asphalt) may also cool down slower than clear asphalt, indicating a similar trend for cooling. These binder groups can be applied differently in different scenarios because of their significant differences in heating and cooling behaviors. A clear binder may be better than a conventional binder if slow heating and rapid cooling rates are desired. Considering the specific temperature requirements and performance expectations of various engineering projects, these findings can assist in optimizing the selection of binder materials.
The ANOVA results for measuring the rut depth in Table 5, using a wheel tracker, for the five binders (clear binder, red, white, yellow, and conventional) clearly show a different rut depth for at least two binders. Statistically significant differences in the rut depth of the binders are indicated by an F-statistic of 9.631 with a p-value of 6.271 × 10⁻⁶ (remarkably close to 0). Based on the small p-value, at least two binder groups perform differently, suggesting that the null hypothesis should be rejected. As we intend to compare the performance of the clear binder with that of the conventional binder, we will focus on the two relevant groups of binders. The wheel tracking test result for the conventional binder was 4.2781, while for the clear binder it was 3.7627. Compared to the conventional binder, the clear binder performs better, on average, due to its lower average penetration by the wheel tracker. Based on the ANOVA results, the clear binder performs significantly better than conventional binders in terms of its structural performance.
The normal probability plot, as shown in Figure 15a, clearly shows that our sample percentile is an evenly distributed pattern of data points compared to the conventional binder. The data points follow some skewness for the initial points. Still, the remaining points are perfectly normally distributed, which indicates a normally distributed dataset that validates the reliability of our analysis. Figure 15b–d shows the line fit plots of neat C.B asphalt, C.B + ZnFe2O4, and C.B + TiO2 with conventional black asphalt. By observing the line fit plots closely, it is clear that the conventional binder tends to attain higher temperatures than the clear and pigmented binders and asphalts, indicating its ability to dissipate heat faster.
Table 6 shows the correlation matrix of all four binders, by showing the effectiveness of the modified binders compared to the conventional black binder. The high correlation coefficients observed, among the variables, indicate strong linear relationships between the asphalt mixtures. By conducting correlation analysis, we aim to pinpoint which characteristics of the modified binders, such as the pigment content or clear binder composition, contribute most significantly to the observed differences in thermal performance compared to conventional black asphalt. This understanding will provide valuable insights for optimizing asphalt mixture design and performance in future applications.

6. Conclusions

This study aimed to introduce a clear binder and pigment-modified clear binders to replace black bitumen in the asphalt mixture, with a non-black and solar-reflective pavement surface that could help reduce the UHI effect. The following are the key findings in this study:
  • Asphalt prepared with neat C.B displayed an average 9 °C lower temperature than the conventional black asphalt mixture. The temperature was further reduced by 2 °C by adding pigments, resulting in an overall temperature difference of 11 °C.
  • Significant temperature differences between black and non-black asphalt mixtures were observed at 1000 and 800 W/m2, with gaps of 7 °C and 10 °C at 1000 flux and 2 °C and 5 °C at 800 flux, indicating a higher efficiency of non-black pavements at extreme temperatures.
  • The average temperature absorbed by the conventional black binder at 1200 W/m2 was just above 65 °C, while the neat clear binder displayed a 7 °C lower temperature. Similarly, pigmented binders further lowered the temperature to 1–2 °C. At the lower fluxes, i.e., 1000 and 800, the difference in the average absorbed temperature between the black bitumen and clear binder (C.B, pigmented C.B) was 5–7 °C and 2–3 °C, respectively.
  • The neat C.B asphalt mixture took 75% longer to reach the target temperature than conventional black asphalt, with the pigmented mixtures taking an additional 170% (zinc ferrite mix) to 180% (titanium dioxide mix) longer. It indicates a higher resistance to heat absorption and prolonged cooling.
  • The cooling rate revealed that conventional asphalt took the longest (approx. 0.45 h) to cool down to 45 °C, while the neat C.B mix took 27% less time (approx. 0.33 h) to return to the target temperature. The pigmented mixture further lessened the cooling time up to 33% (0.3 h) and 31% (0.31 h) for TiO2 and ZnFe2O4 mixtures, respectively.
  • The heat maps indicated significant heat accumulation in conventional asphalt mixtures and binders over a wide period. However, the neat and pigment-modified C.B mixtures appeared more relaxed over the entire heat cycle.
  • The neat C.B asphalt mixture exhibited around 15% more resistance to rut depth than conventional asphalt, with red, white, and orange-pigmented mixtures showing 20%, 43%, and 73% rut resistance, respectively.
  • All the non-black mixtures performed slightly better than conventional black mixtures in the dynamic modulus test. A maximum resistance to permanent deformation of 15% was noted in the C.B + ZnFe2O4 mixture compared to conventional black asphalt mixtures.
Overall, thermally conductive materials with a lower specific heat are preferred for heat harvesting and cool pavement applications, since they enhance the efficiency of heat transfer and storage. This helps harness thermal energy for various purposes, creating more excellent surfaces and mitigating urban heat issues.
Thermal analysis, in this study, was carried out assuming fixed solar flux densities (800, 1000, and 1200 W/m2) to simulate solar radiation; however, solar radiation varies considerably over time and geographical locations. Moreover, despite the efforts to ensure a one-dimensional heat flow and minimize transverse heat dissipation during the charging phase, it is recognized that achieving perfect insulation and heat confinement within heat sinks is challenging. This could introduce slight inaccuracies in the observed temperatures, particularly at higher heat flux levels. Additionally, variations in sensor placement (i.e., inaccurate height, other than specified) could impact the reliability of our temperature readings, or result in inaccurate temperature measurements at certain depths. Furthermore, the continuous heat dissipation during the charging phase and subsequent cooling period could slightly impact the observed maximum temperatures.
The authors recommend the strategic application of these mixtures in urban areas with high percentages of paved surfaces, specifically in densely populated streets, from a UHI mitigation perspective. They can be utilized in bicycle lanes, pedestrian walkways, tennis courts, running tracks, and bus stops, for thermal comfort. Colored pavements can also reduce lighting requirements, so their application in tunnels is also suggested. From a structural performance perspective, the authors suggest performing thermal analysis for at least 1–2 ft2 slabs under direct sunlight over 24 h to compare the performance of asphalt prepared with pigmented clear binders. After that, some correlations should be made for future reference to lab tests. Additionally, the adhesion properties of C.B and pigmented asphalt are worth investigating to understand their interaction and potential impact on pavement performance. Moreover, investigating the cracking resistance of these mixtures to assess their durability and long-term performance under various environmental conditions would be an interesting study for the future. After all these findings, constructing test tracks of up to a few hundred feet long of such materials for normal traffic to assess their durability and rut resistance at higher temperatures would be worth testing before scaling up to larger roadway constructions of such materials.

Author Contributions

Conceptualization, G.B. and N.A.; methodology, G.B. and N.A.; software, G.B. and Y.M.; validation, G.B., Y.H. and Y.M.; formal analysis, G.B. and Y.M.; investigation, G.B. and N.A.; resources, N.A. and Y.H.; data curation, G.B.; writing—original draft preparation, G.B.; writing—review and editing, G.B. and Y.M.; visualization, G.B.; supervision, N.A. and Y.H. All authors have read and agreed to the published version of the manuscript.

Funding

This research received no external funding.

Data Availability Statement

The data supporting the findings of this study are available within the article.

Conflicts of Interest

The authors declare that they have no known competing financial interests or personal relationships that could have appeared to influence the work reported in this paper.

References

  1. Asif, S.A.; Ahmad, N. Comparative Study of Various Properties of Clear Binder with Traditional Black Binder. Arab. J. Sci. Eng. 2022, 47, 12979–12991. [Google Scholar] [CrossRef]
  2. Akbari, H.; Kolokotsa, D. Three decades of urban heat islands and mitigation technologies research. Energy Build. 2016, 133, 834–842. [Google Scholar] [CrossRef]
  3. Sreedhar, S.; Biligiri, K.P. Comprehensive laboratory evaluation of thermophysical properties of pavement materials: Effects on urban heat island. J. Mater. Civ. Eng. 2016, 28, 04016026. [Google Scholar] [CrossRef]
  4. Chen, J.; Chu, R.; Wang, H.; Zhang, L.; Chen, X.; Du, Y. Alleviating urban heat island effect using high-conductivity permeable concrete pavement. J. Clean. Prod. 2019, 237, 117722. [Google Scholar] [CrossRef]
  5. Bai, Y.; Bai, Q. Subsea Engineering Handbook; Gulf Professional Publishing: Houston, TX, USA, 2018. [Google Scholar] [CrossRef]
  6. Lesueur, D. The colloidal structure of bitumen: Consequences on the rheology and on the mechanisms of bitumen modification. Adv. Colloid Interface Sci. 2009, 145, 42–82. [Google Scholar] [CrossRef] [PubMed]
  7. Badin, G.; Ahmad, N.; Ali, H.M.; Ahmad, T.; Jameel, M.S. Effect of addition of pigments on thermal characteristics and the resulting performance enhancement of asphalt. Constr. Build. Mater. 2021, 302, 124212. [Google Scholar] [CrossRef]
  8. Higashiyama, H.; Sano, M.; Nakanishi, F.; Takahashi, O.; Tsukuma, S. Field measurements of road surface temperature of several asphalt pavements with temperature rise reducing function. Case Stud. Constr. Mater. 2016, 4, 73–80. [Google Scholar] [CrossRef]
  9. US DOT (FHWA). Pavement Thermal Performance and Contribution to Urban and Global Climate. Available online: https://www.fhwa.dot.gov/pavement/sustainability/articles/pavement_thermal.cfm (accessed on 7 August 2023).
  10. Li, H.; Harvey, J.T.; Holland, T.J.; Kayhanian, M. The use of reflective and permeable pavements as a potential practice for heat island mitigation and stormwater management. Environ. Res. Lett. 2013, 8, 015023. [Google Scholar] [CrossRef]
  11. Synnefa, A.; Karlessi, T.; Gaitani, N.; Santamouris, M.; Assimakopoulos, D.N.; Papakatsikas, C. Experimental testing of cool colored thin layer asphalt and estimation of its potential to improve the urban microclimate. Build. Environ. 2011, 46, 38–44. [Google Scholar] [CrossRef]
  12. U.S. EPA. Reducing Urban Heat Islands: Compendium of Strategies (Cool Pavements); U.S. EPA: Washington, DC, USA, 2008; pp. 1–23. Available online: https://www.epa.gov/sites/default/files/2017-05/documents/reducing_urban_heat_islands_ch_5.pdf (accessed on 20 February 2024).
  13. Chang, H.-T. A temporal and spatial analysis of urban heat island in basin city utilizing remote sensing techniques. Int. Arch. Photogramm. Remote Sens. Spat. Inf. Sci. 2016, 41, 165–170. [Google Scholar] [CrossRef]
  14. Miner, M.J.; Taylor, R.A.; Jones, C.; Phelan, P.E. Efficiency, economics, and the urban heat island. Environ. Urban. 2017, 29, 183–194. [Google Scholar] [CrossRef]
  15. Robaa, E.-S. Effect of urbanization and industrialization processes on outdoor thermal human comfort in Egypt. Atmos. Clim. Sci. 2011, 1, 100. [Google Scholar] [CrossRef]
  16. Gutzler, D.S. Ecological climatology: Concepts and applications. Nat. Resour. J. 2003, 43, 1291–1296. [Google Scholar]
  17. Coseo, P.; Larsen, L. Cooling the heat island in compact urban environments: The effectiveness of Chicago’s green alley program. Procedia Eng. 2015, 118, 691–710. [Google Scholar] [CrossRef]
  18. Correia, D.; Ferreira, A. Energy Harvesting on Airport Pavements: State-of-the-Art. Sustainability 2021, 13, 5893. [Google Scholar] [CrossRef]
  19. Wang, Y.; Berardi, U.; Akbari, H. The urban heat island effect in the city of Toronto. Procedia Eng. 2015, 118, 137–144. [Google Scholar] [CrossRef]
  20. Qin, Y.H. A review on the development of cool pavements to mitigate urban heat island effect. Renew. Sustain. Energy Rev. 2015, 52, 445–459. [Google Scholar] [CrossRef]
  21. Santamouris, M.; Gaitani, N.; Spanou, A.; Saliari, M.; Giannopoulou, K.; Vasilakopoulou, K.; Kardomateas, T. Using cool paving materials to improve microclimate of urban areas—Design realization and results of the flisvos project. Build. Environ. 2012, 53, 128–136. [Google Scholar] [CrossRef]
  22. Chen, J.; Yin, X.J.; Wang, H.; Ding, Y.M. Evaluation of durability and functional performance of porous polyurethane mixture in porous pavement. J. Clean. Prod. 2018, 188, 12–19. [Google Scholar] [CrossRef]
  23. Chen, J.; Li, J.H.; Wang, H.; Huang, W.; Sun, W.; Xu, T. Preparation and effectiveness of composite phase change material for performance improvement of Open Graded Friction Course. J. Clean. Prod. 2019, 214, 259–269. [Google Scholar] [CrossRef]
  24. Shi, X.J.; Rew, Y.; Ivers, E.; Shon, C.S.; Stenger, E.M.; Park, P. Effects of thermally modified asphalt concrete on pavement temperature. Int. J. Pavement Eng. 2019, 20, 669–681. [Google Scholar] [CrossRef]
  25. Du, Y.F.; Liu, P.S.; Wang, J.C.; Wang, H.; Hu, S.W.; Tian, J.; Li, Y.T. Laboratory investigation of phase change effect of polyethylene glycolon on asphalt binder and mixture performance. Constr. Build. Mater. 2019, 212, 1–9. [Google Scholar] [CrossRef]
  26. Sengoz, B.; Bagayogo, L.; Oner, J.; Topal, A. Investigation of rheological properties of transparent bitumen. Constr. Build. Mater. 2017, 154, 1105–1111. [Google Scholar] [CrossRef]
  27. Bocci, M.; Grilli, A.; Cardone, F.; Virgili, A. Clear asphalt mixture for wearing course in tunnels: Experimental application in the province of bolzano. Procedia-Soc. Behav. Sci. 2012, 53, 115–124. [Google Scholar] [CrossRef]
  28. Partal, P.; Martinez-Boza, F.; Conde, B.; Gallegos, C. Rheological characterisation of synthetic binders and unmodified bitumens. Fuel 1999, 78, 1–10. [Google Scholar] [CrossRef]
  29. Airey, G.D.; Mohammed, M.H.; Fichter, C. Rheological characteristics of synthetic road binders. Fuel 2008, 87, 1763–1775. [Google Scholar] [CrossRef]
  30. Lee, H.; Kim, Y. Laboratory evaluation of color polymer concrete pavement with synthetic resin binder for exclusive bus lanes. Transp. Res. Rec. 2007, 1991, 124–132. [Google Scholar] [CrossRef]
  31. Santagata, F.; Canestrari, F.; Ferrotti, G.; Graziani, A. Experimental characterization of transparent synthetic binder mixes reinforced with cellulose fibres. In Proceedings of the 4th International SIIV Congress, Palermo, Italy, 12–14 September 2007; Available online: https://iris.univpm.it/handle/11566/52988 (accessed on 23 August 2023).
  32. Badin, G.; Huang, Y.; Ahmad, N. Comparative Analysis of Thermally Investigated Pigment-Modified Asphalt Binders. In Proceedings of the ASCE Airfield and Highway Pavements 2023 Conference, Austin, Texas, USA, June 14−17 2023; pp. 174–184. [Google Scholar]
  33. Badin, G.; Ahmad, N.; Ali, H.M. Experimental investigation into the thermal augmentation of pigmented asphalt. Phys. A Stat. Mech. Its Appl. 2020, 551, 123974. [Google Scholar] [CrossRef]
  34. Cheela, V.R.S.; John, M.; Biswas, W.; Sarker, P. Combating Urban Heat Island Effect-A Review of Reflective Pavements and Tree Shading Strategies. Buildings 2021, 11, 93. [Google Scholar] [CrossRef]
  35. Jiang, L.; Wang, L.C.; Wang, S.Y. A novel solar reflective coating with functional gradient multilayer structure for cooling asphalt pavements. Constr. Build. Mater. 2019, 210, 13–21. [Google Scholar] [CrossRef]
  36. Karlessi, T.; Santamouris, M.; Apostolakis, K.; Synnefa, A.; Livada, I. Development and testing of thermochromic coatings for buildings and urban structures. Sol. Energy 2009, 83, 538–551. [Google Scholar] [CrossRef]
  37. Pasetto, M.; Pasquini, E.; Giacomello, G.; Baliello, A. Innovative pavement surfaces as urban heat islands mitigation strategy: Chromatic, thermal and mechanical characterisation of clear/coloured mixtures. Road Mater. Pavement Des. 2019, 20, S533–S555. [Google Scholar] [CrossRef]
  38. Gaitani, N.; Spanou, A.; Saliari, M.; Synnefa, A.; Vassilakopoulou, K.; Papadopoulou, K.; Pavlou, K.; Santamouris, M.; Papaioannou, M.; Lagoudaki, A. Improving the microclimate in urban areas: A case study in the centre of Athens. Build. Serv. Eng. Res. Technol. 2011, 32, 53–71. [Google Scholar] [CrossRef]
  39. Pomerantz, M.; Akbari, H.; Harvey, J. The Benefits of Cooler Pavements on Durability and Visibility; Report No. LBNL-43443; Lawrence Berkeley National Laboratory: Berkeley, CA, USA, 2000. [Google Scholar]
  40. Jameel, M.S.; Ahmad, N.; Badin, G.; Khan, A.H.; Ali, B.; Raza, A. Comparison of hydrated lime, paraffin wax and low-density polyethylene modified bituminous binders: A perspective of adhesion and moisture damage. Int. J. Pavement Eng. 2023, 24, 2168659. [Google Scholar] [CrossRef]
  41. Elements, A. Iron(III) Oxide Properties (Theoretical). Available online: https://www.americanelements.com/iron-iii-oxide-1309-37-1 (accessed on 8 August 2023).
  42. Takeda, M.; Onishi, T.; Nakakubo, S.; Fujimoto, S. Physical Properties of Iron-Oxide Scales on Si-Containing Steels at High Temperature. Mater. Trans. 2009, 50, 2242–2246. [Google Scholar] [CrossRef]
  43. Corporation, G. Titanium Dioxide—Titania (TiO2). Available online: https://www.azom.com/properties.aspx?ArticleID=1179 (accessed on 7 August 2023).
  44. TDK. Mn-Zn Ferrite, Material Characteristics. 2022. Available online: https://product.tdk.com/system/files/dam/doc/product/ferrite/ferrite/ferrite-core/catalog/ferrite_mn-zn_material_characteristics_en.pdf (accessed on 8 August 2023).
  45. Ferrite Materials. MAGNETICS. Available online: https://www.mag-inc.com/Media/Magnetics/File-Library/Products/Ferrite/Magnetics-Ferrite-Materials-Web-8-17a.pdf (accessed on 7 August 2023).
  46. Overview of the Ferrite, in FERRITES—TDK. 2021. Available online: https://product.tdk.com/en/system/files?file=dam/doc/product/ferrite/ferrite/ferrite-core/catalog/ferrite_summary_en.pdf (accessed on 7 August 2023).
  47. Abbas, F.A.; Alhamdo, M.H. Enhancing the thermal conductivity of hot-mix asphalt. Results Eng. 2023, 17, 100827. [Google Scholar] [CrossRef]
  48. Lindberg, W.R.; Thomas, R.R.; Christensen, R.J. measurements of specific-heat, thermal-conductivity and thermal-diffusivity of Utah tar sands. Fuel 1985, 64, 80–85. [Google Scholar] [CrossRef]
  49. Pan, P.; Wu, S.P.; Hu, X.D.; Liu, G.; Li, B. Effect of Material Composition and Environmental Condition on Thermal Characteristics of Conductive Asphalt Concrete. Materials 2017, 10, 218. [Google Scholar] [CrossRef]
  50. Del Carpio, J.A.V.; Marinoski, D.L.; Triches, G.; Lamberts, R.; de Melo, J.V.S. Urban pavements used in Brazil: Characterization of solar reflectance and temperature verification in the field. Sol. Energy 2016, 134, 72–81. [Google Scholar] [CrossRef]
  51. LANXESS. Colouring of Bituminous Mixes, in “Inorganic Pigments—Technical Information Competence Center Construction. LANXESS Deutschland GmbH Business Unit, Inorganic Pigments D-51368 Leverkusen. 2002. Available online: https://lanxess.com/en/Products-and-Brands/Brands/Bayferrox/Construction-Applications (accessed on 7 July 2023).
  52. E. Inc. Silicone Rubber Fiberglass Flexible Heater. Available online: https://www.omega.com/en-us/industrial-heaters/surface-heaters/flexible-heaters/srfra-srfga/p/SRFGA-404-10-P (accessed on 9 July 2023).
  53. Affolter, R. Pakistan—Solar Radiation Measurement Data. 2017. Available online: https://energydata.info/dataset/pakistan-solar-radiation-measurement-data (accessed on 9 July 2023).
  54. Abbas, F.A.; Alhamdo, M.H. Thermal performance of asphalt solar collector by improving tube and slab characteristics. Int. J. Thermofluids 2023, 17, 100293. [Google Scholar] [CrossRef]
  55. Kyriakodis, G.; Santamouris, M. Using reflective pavements to mitigate urban heat island in warm climates-Results from a large scale urban mitigation project. Urban Clim. 2018, 24, 326–339. [Google Scholar] [CrossRef]
  56. Sha, A.; Liu, Z.; Tang, K.; Li, P. Solar heating reflective coating layer (SHRCL) to cool the asphalt pavement surface. Constr. Build. Mater. 2017, 139, 355–364. [Google Scholar] [CrossRef]
  57. Porto, M.; Caputo, P.; Loise, V.; Eskandarsefat, S.; Teltayev, B.; Rossi, C.O. Bitumen and Bitumen Modification: A Review on Latest Advances. Appl. Sci. 2019, 9, 742. [Google Scholar] [CrossRef]
  58. Qureshi, F.A.; Ahmad, N.; Ali, H.M. Heat dissipation in bituminous asphalt catalyzed by different metallic oxide nanopowders. Constr. Build. Mater. 2021, 276, 122220. [Google Scholar] [CrossRef]
  59. Jabbar, H.K.; Hamoodi, M.N.; Al-Hameedawi, A.N. Urban heat islands: A review of contributing factors, effects and data. IOP Conf. Ser. Earth Environ. Sci. 2023, 1129, 012038. [Google Scholar] [CrossRef]
  60. CSN EN 12697-25; Bituminous Mixtures-Test Methods-Part 25: Cyclic Compression Test. European Standards: Released 01 October, 2017. Available online: https://www.en-standard.eu/csn-en-12697-25-bituminous-mixtures-test-methods-part-25-cyclic-compression-test/ (accessed on 25 February 2024).
  61. Zheng, M.L.; Han, L.L.; Wang, F.; Mi, H.C.; Li, Y.F.; He, L.T. Comparison and analysis on heat reflective coating for asphalt pavement based on cooling effect and anti-skid performance. Constr. Build. Mater. 2015, 93, 1197–1205. [Google Scholar] [CrossRef]
  62. Xin, Z.G. Research application of colored asphalt mixture pavement. Adv. Mater. Res. 2014, 900, 459–462. [Google Scholar] [CrossRef]
  63. AASHTO TP 62; Standard Method of Test for Determining Dynamic Modulus of Hot Mix Asphalt (HMA). GlobalSpec: New York, NY, USA. Available online: https://standards.globalspec.com/std/1283471/aashto-tp-62 (accessed on 25 February 2024).
  64. Hafeez, M.; Ahmad, N.; Kamal, M.A.; Rafi, J.; Ul Haq, M.F.; Jamal; Zaidi, S.B.A.; Nasir, M.A. Experimental Investigation into the Structural and Functional Performance of Graphene Nano-Platelet (GNP)-Doped Asphalt. Appl. Sci. 2019, 9, 686. [Google Scholar] [CrossRef]
  65. Li, P.; Zheng, M.L.; Wang, F.; Che, F.; Li, H.Y.; Ma, Q.L.; Wang, Y.H. Laboratory Performance Evaluation of High Modulus Asphalt Concrete Modified with Different Additives. Adv. Mater. Sci. Eng. 2017, 2017, 7236153. [Google Scholar] [CrossRef]
Figure 1. (a) Thin layer of CB poured onto steel surface [1]; (b) mid-point gradation curve.
Infrastructures 09 00088 g001
Figure 2. Steps involved in the preparation of binders and asphalt mixtures for thermal analysis. (a) TiO2 being mixed with dry aggregates. (b) Binder poured into the TiO2 blended aggregates. (c) Placement of a silicon heater at the base of the heat sink. (d) Heat sink inside the fiber block insulation, with installed thermocouples and heater. (e) White pigmented (TiO2) clear binder poured into a container. (f) TiO2-modified CB under experimentation. (g) Conventional asphalt inside the large heat sink, with installed thermocouples and heater. (h) White pigmented asphalt mixture before the start of the test.
Infrastructures 09 00088 g002aInfrastructures 09 00088 g002b
Figure 3. Schematics of laboratory setup.
Infrastructures 09 00088 g003
Figure 4. Three dimensional views, with labeled dimensions (mm), of (a) larger heat sink, and (b) smaller heat sink.
Infrastructures 09 00088 g004
Figure 5. Heating and cooling temperature curves at 1200 flux for: (a) conventional asphalt mixture; (b) asphalt mixture prepared with neat clear binder; (c) asphalt mixture prepared with titanium dioxide-blended clear binder; and (d) asphalt mixture prepared with zinc ferrite-blended clear binder.
Infrastructures 09 00088 g005
Figure 6. Mean temperature of 50 mm thick asphalt mixtures at (a) 1000 W/m2 and (b) 800 W/m2.
Infrastructures 09 00088 g006
Figure 7. Heating and cooling temperature curves at 1200 flux for: (a) conventional black bitumen, (b) neat clear binder, (c) clear binder-modified with titanium dioxide pigments, and (d) clear binder-modified with zinc ferrite pigments.
Infrastructures 09 00088 g007
Figure 8. Mean temperature of 25 mm thick bituminous samples at (a) 1000 W/m2 and (b) 800 W/m2.
Infrastructures 09 00088 g008
Figure 9. Heat map against Avg. curve of the asphalt mixtures, showing (a) heating time from 45–50 °C and (b) cooling time from 50–45 °C.
Infrastructures 09 00088 g009
Figure 10. Heat map against Avg. curve of bituminous binders, showing (a) heating time from 45–55 °C and (b) cooling time from 55–45 °C.
Infrastructures 09 00088 g010
Figure 11. Heat map showing the temperature variations over time for (a) asphalt mixtures and (b) bituminous binders.
Infrastructures 09 00088 g011
Figure 12. Cooper wheel tracking test (CWTT) of asphalt mixtures at 55 °C.
Infrastructures 09 00088 g012
Figure 13. Dynamic modulus of asphalt mixtures at (a) 55 °C and (b) 40 °C.
Infrastructures 09 00088 g013
Figure 14. Dynamic modulus samples (a) after core cutting and (b) before core cutting.
Infrastructures 09 00088 g014
Figure 15. (a) Normal probability plot. (b) Line fit plot for neat C.B asphalt. (c) Line fit plot for C.B + ZnFe2O4. (d) Line fit plot for C.B + TiO2 with conventional black asphalt.
Infrastructures 09 00088 g015
Table 1. Thermal properties of pigments and other materials.
MaterialSpecific Heat
(J kg−1K−1)
Thermal Conductivity
(W m−1K−1)
Iron oxide red (Fe2O3)650 [41]3 (800 °C) and 8 (200 °C)
15 at room temperature [42]
Titanium dioxide white (TiO2)683–697 [43]11.7 at 25 °C [43]
Zinc ferrite yellow (ZnFe2O4)800 [44]3.5–4.3 at 25–85 °C [45]
1–5 at room temperature [46]
Conventional asphalt900 [9]1.35 at room temperature [47]
0.8–2.0 [9]
Conventional bitumen1850–3900
at 27–127 °C [48]
0.17–0.2 [49]
Table 2. Distinct properties of pigments extracted from their technical data sheets.
PropertyTitanium Dioxide WhiteZinc Ferrite YellowIron Oxide Red
Heat stability (°C)900–930260–300350–400
Particle size300 nm0.1–0.6 μm97% ≤ 45 μm
Particle shapeTetragonalAcicularSpherical
pH value6.5–8.05–83–7
Density (g/cm3)4.135.0–5.60.72–1.1
Chemical formulaTiO2ZnFe2O4Fe2O3·H2O
Tinting strength %≥17595–11095–105
Moisture at 105 °C, %0.5 Max0.5 Max1.0 Max
Oil absorption (mL/100 g)19~2225–4515–25
Matter soluble in water %0.5 Max0.5 Max0.5 Max
Table 3. Heat sink and heater dimensions, along with thermocouple positioning.
DimensionsInternal Dimensions
(mm3)
External Dimensions
(mm3)
Heater Dimensions
(mm3)
Thermocouple Positioning (mm)
Heat Sink T1T2T3T4T5
Larger Heat Sink100 × 100 × 50110 × 110 × 55100 × 100 × 1.5Heat sink base0103050
Smaller Heat Sink60 × 60 × 2570 × 70 × 3060 × 60 × 1.5051525
Table 4. Statistical and ANOVA analysis of thermal testing.
Statistics
GroupsCountSumAverageVariance
Conv. Black Asphalt3601176,572.932549.034469.7382
Neat C.B Asphalt3601155,958.991843.309954.0948
C.B + TiO23601148,025.992341.106947.0287
C.B + ZnFe2O43601148,432.817041.219946.0895
ANOVA Results for thermal testing
Source of VariationSSdfMSFp-ValueF crit
Between Groups149,366.1305349,788.7102917.970502.6055
Within Groups781,024.466814,40054.2378
Total930,390.597314,403
Table 5. Statistical and ANOVA analysis of rutting test.
Statistics
GroupsCountSumAverageVariance
Conventional1247.05864.27813.1557
Clear binder1241.39003.76272.4111
C.B + Fe2O31242.65003.55422.1059
C.B + TiO21227.37002.28081.0498
C.B + ZnFe2O41215.83001.31920.3082
ANOVA Results for rutting analysis
Source of VariationSSdfMSFp-valueF crit
Between Groups68.1594417.03989.63110.00002.5463
Within Groups93.7708531.7693
Total161.930157
Table 6. Correlation matrix of all four mixtures.
Conv. Black AsphaltNeat C.B AsphaltC.B + TiO2C.B + ZnFe2O4
Conv. Black Asphalt1
Neat C.B Asphalt0.99941
C.B + TiO20.99760.99651
C.B + ZnFe2O40.99840.99780.99971
Disclaimer/Publisher’s Note: The statements, opinions and data contained in all publications are solely those of the individual author(s) and contributor(s) and not of MDPI and/or the editor(s). MDPI and/or the editor(s) disclaim responsibility for any injury to people or property resulting from any ideas, methods, instructions or products referred to in the content.

