Article

Machine Learning in Allergic Contact Dermatitis: Identifying (Dis)similarities between Polysensitized and Monosensitized Patients

by
Aikaterini Kyritsi
1,
Anna Tagka
2,
Alexander Stratigos
2 and
Vangelis D. Karalis
2,*
1
Department of Pharmacy, School of Health Sciences, National and Kapodistrian University of Athens, Panepistimioupolis, 15784 Athens, Greece
2
First Department of Dermatology and Venereology, “Andreas Syggros” Hospital, National and Kapodistrian University of Athens, Medical School Ionos Dragoumi 5, 11621 Athens, Greece
*
Author to whom correspondence should be addressed.
BioMedInformatics 2024, 4(2), 1348-1362; https://doi.org/10.3390/biomedinformatics4020074
Submission received: 14 March 2024 / Revised: 3 April 2024 / Accepted: 15 May 2024 / Published: 17 May 2024
(This article belongs to the Special Issue Editor's Choices Series for Methods in Biomedical Informatics Section)

Abstract

:
Background: Allergic contact dermatitis (ACD) is a delayed hypersensitivity reaction occurring in sensitized individuals due to exposure to allergens. Polysensitization, defined as positive reactions to multiple unrelated haptens, increases the risk of ACD development and affects patients’ quality of life. The aim of this study is to apply machine learning in order to analyze the association between ACD, polysensitization, individual susceptibility, and patients’ characteristics. Methods: Patch test results and demographics from 400 ACD patients (Study protocol Nr. 3765/2022), categorized as polysensitized or monosensitized, were analyzed. Classic statistical analysis and multiple correspondence analysis (MCA) were utilized to explore relationships among variables. Results: The findings revealed significant associations between patient characteristics and ACD patterns, with hand dermatitis showing the strongest correlation. MCA provided insights into the complex interplay of demographic and clinical factors influencing ACD prevalence. Conclusion: Overall, this study highlights the potential of machine learning in unveiling hidden patterns within dermatological data, paving the way for future advancements in the field.

1. Introduction

Allergic contact dermatitis (ACD) is an inflammatory skin disease, which is characterized by a delayed type of IV hypersensitivity immune reaction. ACD occurs only in previously sensitized individuals [1], while the sensitization process is a result of the interplay between genetic and environmental factors [2,3,4,5]. Sensitized patients to one allergen have been shown to be at high risk of developing multiple contact allergies [2,4]. The term multiple sensitizations or polysensitizations is defined as having positive patch test reactions to three or more non-related haptens [2,3,4,5]. Polysensitization is considered to increase ACD prevalence and affect patients’ quality of life [5].
Patch testing is the in vivo method of choice for detecting allergen sensitization. The European baseline series (EBS) is the main contact allergen group that is used during patch testing. However, based on labor, social, and national norms, the EBS panel varies between different diagnostic departments and geographical regions [6,7,8]. For instance, Thimerosal 0.1% is included in the EBS of the National Reference Center for Occupational Dermatoses “Andreas Syggros” Hospital’ in Athens, Greece [7].
Thimerosal is an organic compound containing two sensitizing moieties, mercury and thiosalicylate [9,10]. It is worth mentioning that despite the fact that thimerosal trace levels are either eliminated or minimized in many products today, there is still pervasive exposure to the population as a result of its previous extensive use. In addition, due to its antimicrobial action, thimerosal is still added as a disinfectant agent in merthiolate tincture and as a preservative, especially, in biological products (vaccines and antitoxins) and pharmaceutical/self-hygiene products (ocular solutions, eye drops/ointments, and contact lens fluids), while less commonly than previously in cosmetics and tattoo inks [9,10,11]. The above thimerosal-containing products can provoke localized hypersensitivity reactions [9]. Thimerosal is, also, an indicator of photosensitivity to piroxicam, due to its thiosalicylic moiety [10,11]. Despite the prevalence of thimerosal sensitivity seeming to be quite high, the clinical relevance of a positive patch test to thimerosal is usually very difficult to establish [10,11,12]. In most cases it seems to be due either to ocular preparations or vaccines [11,12].
Artificial intelligence (AI) applications are outlined for a variety of medical specialties, such as dermatology, neurology, cardiology, pediatrics, surgery and others [13]. More specifically, machine learning algorithms have the ability to uncover data patterns from extensive repositories of patient information [14]. The application of machine learning algorithms on patch testing datasets was found to improve the process of contact sensitization detection [14,15]. So, machine learning models may contribute to ACD early diagnosis and enhance its precision, as well as the treatment strategy [13,14,15].
The general purpose of this study was the investigation of sensitization patterns in order to understand the association among ACD, polysensitization, individual susceptibility, and patients’ characteristics. In more detail, this analysis aimed to (a) identify relationships between patients’ characteristics and ACD patterns, and (b) compare the performance of the monosensitized patients (in terms of thimerosal) against that of the polysensitized. Machine learning and classical techniques were used in this retrospective study.

2. Materials and Methods

2.1. Study Design and Patient Selection

Patch test results from 400 ACD patients (200 polysensitized and 200 monosensitized) were collected at the National Reference Center for Occupational Dermatoses “Andreas Syggros” Hospital in Athens, Greece. In this observational study, data were retrospectively collected from decades worth of hospital medical records, and transcribed into an electronic medical dataset. In the current study, the entire data management was conducted under supervision of the treating physicians of the ACD patients. Furthermore, the Scientific Review Board of the “Andreas Syggros” Hospital reviewed and approved this study protocol (Protocol Nr. 3765/2022). All ethical aspects of the study were fully in line with the Helsinki Declaration (1975, review 2000). All participant data were anonymized, and no patient information could be identified. The whole study was conducted with respect to medical data confidentiality.
According to the guidelines of the Department for Patch Testing, an adapted EBS of 30 contact allergens is tested for contact sensitization, while exclusion criteria for patch testing are the high UV exposure and the chronic use of corticosteroids, immunomodulators, and anti-inflammatory drugs, that might produce false-positive or negative results [6,7,8]. The detection of sensitization (positive patch test) is based on the International Contact Dermatitis Research Group (ICDRG) criteria.
In this study, two groups were assigned: monosensitized patients having a positive patch test to thimerosal 0.1%, and polysensitized patients having positive patch test reactions to 3 or more unrelated haptens of the adapted EBS (the 30 specified contact allergens). In each case (mono- or polysensitized), the data collection was completed for the first 200 medical records of men and women, with an equal contribution to both groups. The baseline patients’ demographics and clinical characteristics are listed in Table 1.

2.2. Polysensitization

Polysensitization is defined as having positive patch test reactions to three or more non-related haptens [5]. The positive patch-test reactions of the polysensitized patients are listed in Table 2, which were methodically recorded based on the ICDRG criteria.

2.3. MOAHLFA Index

Patients’ characteristics, such as O (occupational dermatitis, OD), M (male), A (atopic dermatitis, AD), L (leg dermatitis, LD), H (hand dermatitis, HD), A (age > 40), and F (facial dermatitis, FD), were also collected. Trunk dermatitis was also evaluated in order to provide a multifunctional analysis of sensitization prevalence [7].

2.4. Data Analysis

Following data collection, descriptive statistics and statistical comparisons between groups were used in the study. In this study, all variables (except for age) were on the nominal or ordinal scale. Chi-square and multiple correspondence analysis (MCA) were performed. The chi-square analysis was used to investigate the relationship between two or more features (at the 5% nominal significance level). When more than two hypothesis tests were performed simultaneously, the Bonferroni correction was used.
MCA, a machine learning technique, serves as an extension of correspondence analysis (CA) and proves to be particularly advantageous when working with datasets that encompass multiple categorical variables, as in the case of this study [16]. The primary objective of MCA is to visually represent complex connections among categorical variables, thereby facilitating comprehension of patterns and associations within the data. Through the process of dimensionality reduction, MCA enables the representation of data in a manner that is both succinct and comprehensible, while still preserving the majority of the significant information. Each categorical variable is represented as a point in the MCA plot. The position of the point in the reduced space is determined based on the relationships and associations between categories of that variable with other variables in the dataset. The origin of the plot represents the centroid or the average of all the data points. It indicates the overall average of all the variables in the dataset. The vector lines extend from the origin (centroid) to the points representing the individual categorical variables. The direction of the vector line indicates the relationship and association between the variable and the overall average. The length of the vector line represents the strength of that association. Longer vector lines suggest a stronger association with the centroid. The angle between two vector lines represents the relationship and association between the corresponding variables in the reduced space. If two vector lines are closer together, it suggests that the categories they represent are similar or positively associated. Conversely, if they are far apart, it indicates dissimilarity or a negative association. A 90o angle indicates that the variables are not related.
By visualizing the vector lines in the MCA plot, you can gain insights into the relationships between categorical variables and identify patterns and groupings in the data. In general, the number of machine learning algorithms which analyze categorical data (nominal and ordinal) is limited, so the application of MCA was the most appropriate algorithm for this analysis. The MCA analysis was used to complement the chi-square findings and reveal the relationships among the variables in a compact way [16,17]. In this study, Varimax rotation was used to simplify the generated representations and contributed to model’s flexibility [16,17]. As measures of the internal model’s consistency, component loads were illustrated in the generated MCA plots.
In this study, the entire statistical analysis was implemented in IBM SPSS® v.28 (Chicago, IL, USA).

3. Results

3.1. Patients’ Demographic and Clinical Characteristics

A total of 400 medical records were examined, and no missing values were found in any feature. Half of the patients (i.e., 200) were polysensitized, while the remaining 200 patients were monosensitized. The variable of gender purposefully had an equal contribution from both groups, with 200 (50.0%) men and 200 (50.0%) women. The average age was 34.5 years in polysensitized and 36.7 years in monosensitized patients. In the total patient cohort, office employees accounted for 159 (39.7%) of all occupations, followed by technicians/metal workers, 64 (16.0%), healthcare workers, 45 (11.2%), cleaners/householders, 32 (8.0%), nail technicians and make-up artists, 31 (7.8%), engineers/builders, 29 (7.3%), bakers/cooks, 28 (7.0%), and hairdressers, 12 (3.0%). A total of 162 (40.5%) of the patients had a positive personal history of atopic dermatitis, whereas 101 (25.3%) had a positive family history. According to the MOAHLFA index, hand dermatitis was the most common dermatitis in 285 cases (71.3%), followed by facial dermatitis in 136 cases (34.0%), trunk dermatitis in 96 instances (24.0%), and leg dermatitis in 85 cases (21.3%). In 128 (32.0%) of the cases, occupational dermatitis was recorded. The baseline characteristics of each patient group are presented in Table 1.

3.2. Polysensitization

From 200 patch test results of polysensitized patients (Table 2), the predominant allergen category was preservatives 200 (100.0%) followed by fragrances, 173 (86.5%), metals, 110 (55.0%), medicines, 69 (34.5%), natural origin allergens, 43 (21.5%), dyes/colorants, 26 (13.0%), rubbers, 16 (8.0%), and plastic glues, 14 (7.0%).
Multiple sensitizations were induced mainly by three allergen-categories and accounted for 109 (54.5%) of all polysensitized patients, followed by four in 49 cases (24.5%), and five in 27 cases (13.5%). Among the polysensitization patterns, preservatives–fragrances–metals was the most frequent combination of contact allergens. The polysensitization patterns of this study are summarized in Table 3.

3.3. Associations among Patients’ Characteristics

Chi-square analysis revealed statistically significant relationships between hand dermatitis and patient group (p-value = 0.001). In particular, the percentage of monosensitized patients was higher than the percentage of polysensitized patients (monosensitization > polysensitization). None of the groups, however, were shown to be associated with the other dermatitis types (FD/Face Dermatitis, LD/Leg Dermatitis, TD/Trunk Dermatitis, and AD/Atopic Dermatitis). Also, both polysensitized (p-value = 0.003) and monosensitized (p-value = 0.000) individuals had significant relationships between hand dermatitis and occupation class. Only in the monosensitized patients’ group were significant relationships between hand dermatitis and gender revealed (p-value = 0.025), with males outnumbering females (number of males > number of females) (Table 4).

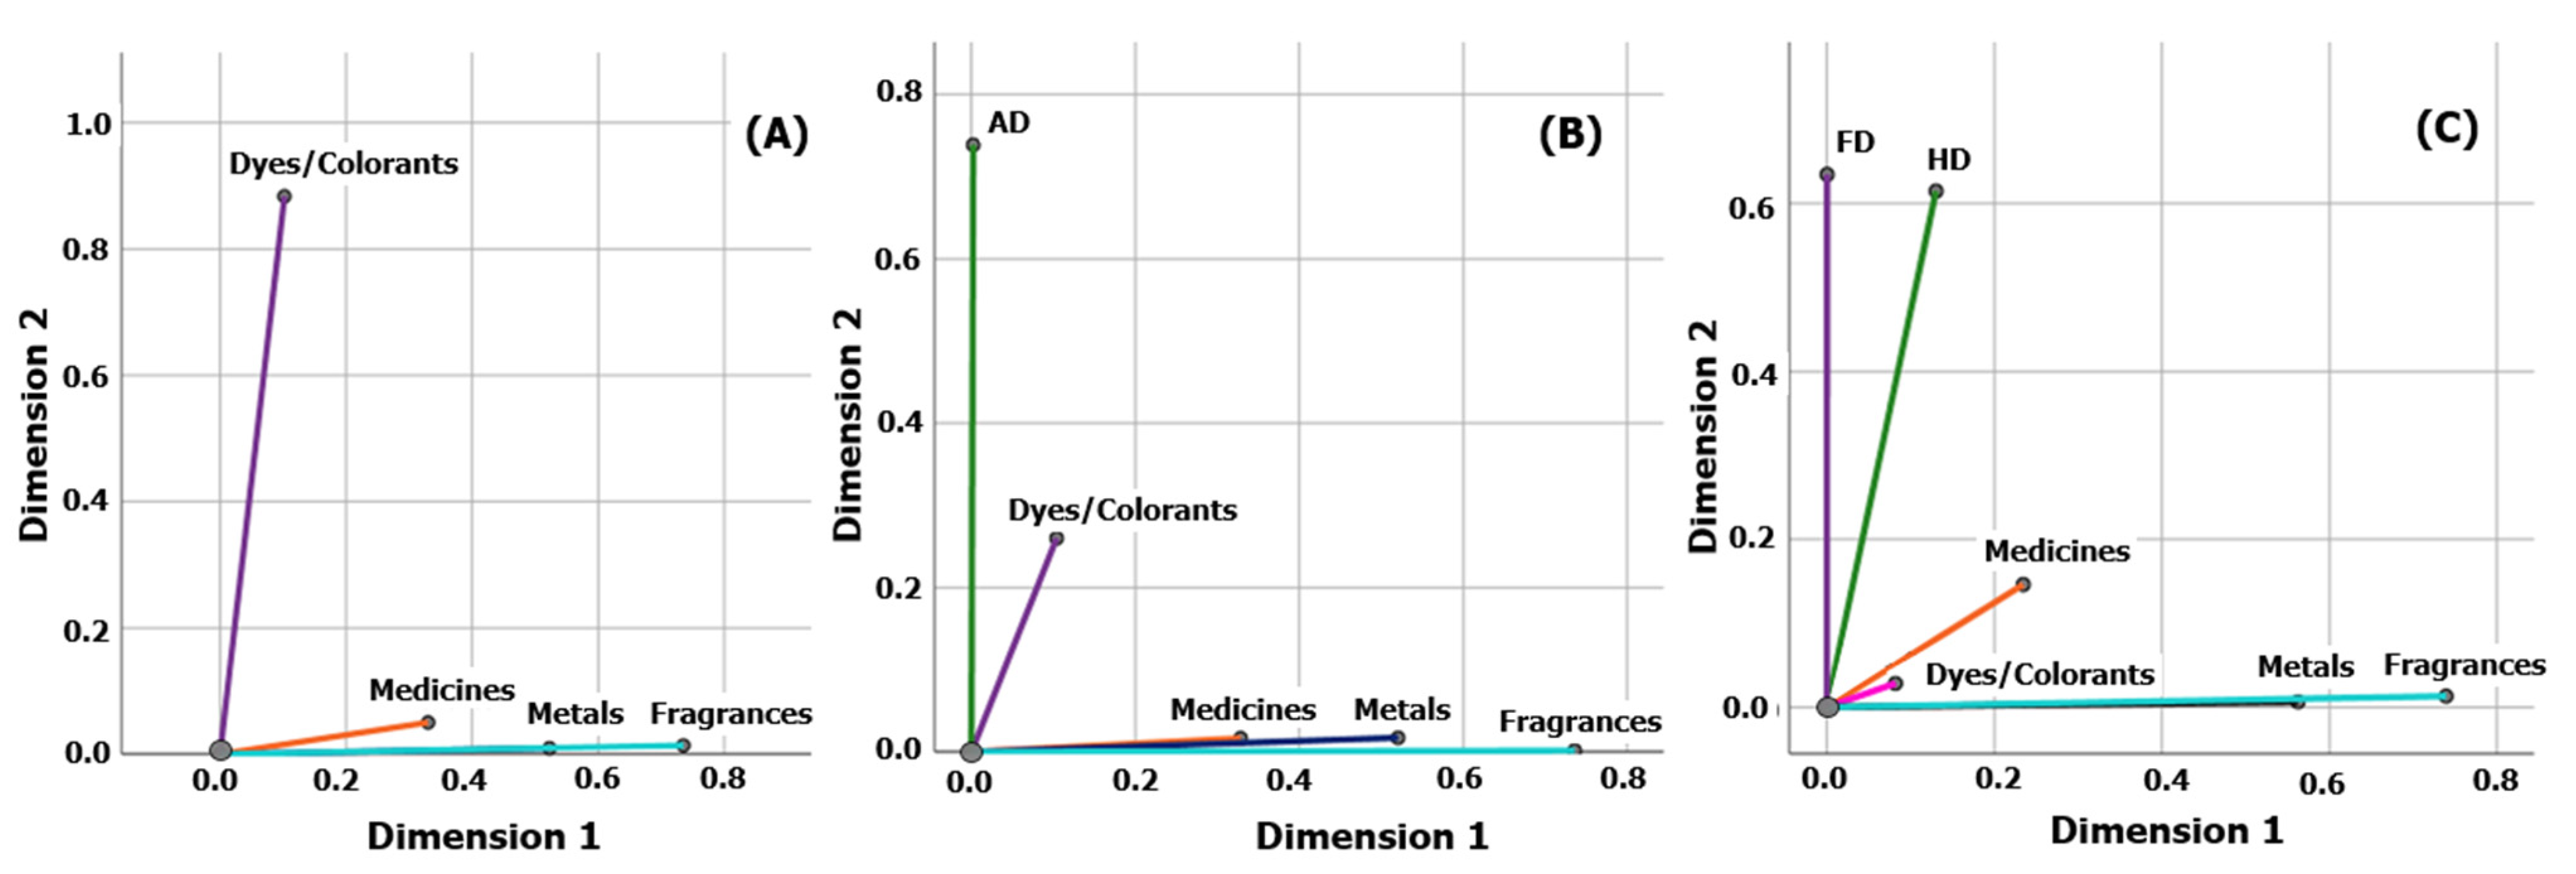
3.4. Multiple Correspondence Analysis

The application of MCA revealed interesting relationships among several patients’ characteristics. Indeed, occupation showed a strong association with gender and age, while AD was related to familial AD history (Figure 1A). Interestingly, the patient group was found not to be related to occupation, age, or gender, while the total patient cohort was associated with AD and family AD history (Figure 1A). Additional relationships were found among the anatomical regions of ACD. Specifically, HD was shown to be most associated with FD, then with LD, and less with TD (Figure 1B).
In terms of anatomical regions, gender was most strongly linked with FD and HD, then LD, and finally TD (Figure 2A). Age, on the other hand, was significantly related to TD, followed by LD, but not to HD or FD (Figure 2B). Occupation was most closely associated with HD and FD, then LD, and less correlated with TD (Figure 2C). Furthermore, both AD and family AD history were most strongly associated with TD, followed by LD, HD, and less so with FD (Figure 2D,E).
Additional correlations were found between patient groups and the anatomical regions of ACD in the following descending order: HD > TD > FD > LD (Figure 3).
MCA analysis was also performed to assess the influence of gender, age, occupation, AD, family AD history, and anatomical sites of ACD on the polysensitized patients. The same analysis was performed on the monosensitized patients for comparison (Figure 4). In the group of polysensitized patients, similar positive correlations to in the total patient cohort (Figure 1A) were identified for the following variables: Occupation manifested a positive correlation with gender and age, as well as AD with family AD history (Figure 4A). In the group of monosensitized patients, occupation also manifested a positive correlation with gender and age, as well as AD with family AD history. On the contrary, AD and family AD history were found to be independent of age and gender (Figure 4B).
In the group of polysensitized patients, HD, in contrast to the total patient cohort (Figure 1B), was found to be most correlated to LD, then to FD and TD (Figure 4C). In the group of monosensitized patients, HD, as in the total patient cohort, was found to be most correlated with FD. On the contrary, LD was found to be most correlated with TD and independent of HD and FD (Figure 4D).
Additional results regarding polysensitization are shown in Figure 5. The application of MCA revealed interesting relationships among medicines, metals, and fragrances, while colorant contact allergens were found to be independent of the other allergen types (Figure 5A). On the other hand, only dyes–colorants were strongly linked with AD (Figure 5B). The anatomical regions of HD and FD were, also, significantly related to medicines, followed by dyes–colorants, but not to fragrances and metals (Figure 5C).

4. Discussion

This study aimed to investigate the patterns of contact sensitization using machine learning (ML) methods, in order to unveil any association among ACD, polysensitization, individual susceptibility, and patient characteristics. Patients diagnosed with ACD are at an increased risk of developing additional hypersensitivity reactions [4]. Contact sensitization varies among individuals due to both environmental and genetic factors, while polysensitization occurs more often than expected based on population frequencies of individual sensitization [4]. Therefore, polysensitized patients represent a special subgroup with increased susceptibility to contact allergy [2,3,4].
Thimerosal 0.1% was selected as the allergen for monosensitization, since based on previous results, it was one of the most prevalent allergens [7]. It should be mentioned that despite thimerosal having now been either reduced or removed from many pharmaceutical and cosmetic products, there remains widespread exposure in the population due to its previous extensive use. Indeed, there is a significant geographical variability in the incidence of thimerosal sensitization, which can be explained by its availability and application between different formulations in each country [10]. Despite the quite high prevalence of thimerosal sensitivity, as in Greece, the clinical relevance of a positive patch test to thimerosal is usually very difficult to establish [10,11,12]. In most cases this seems to be due to use of ocular preparations and topical medicines, but it is more likely to be attributable to high vaccination levels of the general population, and to occupational vaccinations against infectious diseases (influenza, hepatitis), such as in healthcare workers [10,11,12]. It is worth mentioning that all comparisons made between the polysensitized and monosensitized patients actually refer to thimerosal sensitization.
In the current study, the dimensionality reduction method of MCA was applied for investigation of data patterns, as well as for data interpretability and visualization of patients’ characteristics. More specifically, dimensionality reduction is the process of taking data in a high dimensional space and mapping them into a new space whose dimensionality is much smaller [17]. Dimensionality reduction is categorized in the ML subgroup of unsupervised learning, which includes algorithms that work solely on data without prior knowledge of any input or output variables [13,16,17]. However, the number of machine learning algorithms which analyze categorical data (nominal and ordinal) is limited. This means that machine learning techniques that rely on numerical data could not be used because our dataset consisted almost completely of nominal/ordinal variables. Other suitable algorithms, like random forest and logistic regression, were not used since their scope did not fit the goals of this study. For example, logistic regression is used for classification purposes. That means predicting the probability of an event occurring (e.g., belonging to the mono- or polysensitized group) given some input features (e.g., patients’ characteristics) [16,17]. Consequently, the application of MCA was the most appropriate algorithm for this analysis.
In addition, it is commonly advised to perform machine learning in large datasets, which represents the diversity and complexity of the investigated problem, in order to prevent overfitting. If the model becomes “overfitted,”, it means that it is unable to generalize well to new data and eventually performs the classification or prediction tasks that it was intended for. Usually, a dataset should ideally contain a minimum of ten times the number of features in order to ensure sufficient data points (records) for effective model training. The quantity of data required for conducting MCA can also depend on various factors, such as the quantity of categorical variables, the number of categories within each variable, and the intricacy of the interrelationships among the variables [17]. In our case, the number of tested variables never exceeded five, which means that the number of participants (i.e., 400 in total, or 200 per group) was more than adequate to allow for obtaining robust results.
MCA allowed assessing the influence of patients’ profiles on ACD prevalence. Despite the fact that authors have described a decreased risk of sensitization in AD patients, the penetration of haptens seemed to be higher in patients with persistent AD due to the established barrier dysfunction [18,19]. Interestingly, in this study positive correlations were identified between AD and family AD history in the total ACD patient cohort.
The MOAHLFA index calculation is an essential parameter in the clinical evaluation of ACD [6,7,8]. In the total patient cohort, the most common ACD anatomical region was the hand, which is in agreement with the ESSCA patch test database [20]. Based on the chi-square analysis, significant associations were found between the patient group and HD, while MCA revealed additional correlations between the patient group and all anatomical regions of ACD in the following descending order: HD > TD > FD > LD. Therefore, haptens seem to be transferred among the affected anatomical body sites, such as from hands to face [11].
Comparing patient groups, chi-square analysis found significant associations between HD and occupation in both patient groups, while between HD and gender only in monosensitized patients. MCA revealed additional and similar correlations among gender, age, and occupation, indicating that these are important risk factors for both individual susceptibility and polysensitization [5]. Moreover, MCA showed that in the polysensitized patients, HD was found to be most correlated to LD, then to FD and TD, while in the monosensitized patients, HD was found to be most correlated to FD and independent of LD and TD. This confirms the hypothesis, that patients with HD and patients with LD and/or chronic leg ulcers are likely to be polysensitized [3,4,5].
MCA showed that polysensitization was induced mainly by the combination of medicines, metals, and fragrances, revealing a unique link among these allergen categories. Dyes–colorants might provoke severe barrier dysfunction [11], since they were found to be strongly linked with AD. Finally, the anatomical regions of HD and FD were significantly related to medicines, followed by dyes–colorants, indicating that hand and head are the most exposed body sites to contact haptens [5,20].
This study was one of the first to utilize machine learning approaches to investigate clinical problems, such as ACD. The number of studies using AI (machine learning and deep learning techniques) has been recently increased, demonstrating significant potential in the clinical setting [13]. Apart from its widespread application in diagnostic methods, AI has been incorporated into diverse medical specialties such as dermatology, pneumonology, neurology, cardiology, gynecology, anesthesiology, surgery, urology, and more [21,22,23,24,25,26,27,28,29,30,31,32,33,34].
In dermatology, image-based screening technologies are developed for the diagnosis and management of skin diseases [14,15,35,36,37]. Recent studies have been conducted to assess the effectiveness of machine learning algorithms and convolutional neural networks models in precisely detecting and diagnosing ACD from patch test images. In both studies, a cohort of 200 ACD patients was examined using a new medical device the Antera® 3D camera (Miravex Limited, Ireland), while the acquired spectral 3D images were used to map chromophores’ concentration (hemoglobin, and melanin) and skin parameters (texture, volume, folds, and fine lines) [15,35]. In the first study, the results indicated that the synergy of convolutional neural networks (CNNs) and machine learning algorithms can achieve a success rate of 85% in ACD detection, indicating a high level of correct diagnostic predictions [15]. Convolutional neural networks exhibited high accuracy in ACD diagnosis based on the hemoglobin concentration, while the textural information (texture, volume, folds, and fine lines) was insufficient for classifying a positive allergic reaction [35]. Furthermore, ML algorithms offer the ability to recognize unique patterns in the datasets from extensive repositories of patient information [13,14]. A retrospective analysis of ACD, in which the MCA algorithm was used, revealed unique associations among ACD onset, patch test positive reactions, and patients’ demographics [38]. In particular, hands were found to be the most affected body site in ACD patients; as well as this, the occupation class was found to be correlated to the anatomic site of dermatitis in the following ascending order: HD > FD > LD > TD. In addition, the type of allergen and gender were also found to be correlated to occupation class [38]. The above findings are in accordance with the results of this study. The MCA technique has been, recently, applied to investigate data patterns in different dermatological disorders [39,40,41]. In a patient cohort with atopic dermatitis, significant correlations were found among disease severity, gender, age, treatment strategy and quality of life [39]. MCA was also applied in datasets from breast cancer patients undergoing radiotherapy to explore the symptoms patterns of radiation-irritated skin [40]. MCA plots were contributed to psychometric variables investigation in patients with psoriasis, unveiling that the highest levels of depression/anxiety were associated with low income, middle age and females [41]. The results of this study complement the findings of a previous study series on ACD research, which have been conducted using classical statistics [5,6,7,20,42,43,44,45,46,47,48,49,50,51].
The application of ML algorithms on patch test datasets/images was found to improve the process of contact sensitization detection [14,15,35]. Furthermore, the ML algorithms, such as MCA, can unveil unique relationships among psychometric clinimetric and demographic variables [38,39,40,41]. So, the integration of AI technology in dermatology can contribute to early ACD diagnosis, enhance its precision and offer an individualized treatment strategy. The automation of diagnosis can, also, reduce clinician workload and diagnosis time, as well as facilitate a wider range of treatment options especially for marginalized regions. Overall, the application of AI in clinical practice can significantly improve the management of ACD patients and their quality of life, and contribute to an up-to-date surveillance of contact sensitization prevalence. AI has the potential to fundamentally transform the healthcare system and improve patient monitoring [13,52,53,54].
A limitation of this study was the reduced sample size in order to investigate more subtle differences between the mono- and polysensitized groups. It should not be disregarded that the issue of assessing the relationship between poly- and monosensitization is rather wide; thus, in order to provide an overall answer to this question, investigation of all possible associations should be explored, namely, to use every possible allergen for monosensitization. However, this cannot be implemented in a single study since the analysis performed in this analysis should at least be repeated for 30 times (30 specified allergens). Thus, many studies are required to provide an overall understanding.
In conclusion, the MCA analysis allowed identifying the link between patients’ demographic and clinical characteristics. The MCA analysis was used to complement the chi-square findings and reveal the relationships among the variables in a compact way. This study showed how the application of machine learning can identify unique patterns in the data.

5. Conclusions

Patients diagnosed with ACD face an increased risk of developing additional delayed-type hypersensitivity reactions. This study aimed to explore contact sensitization patterns using machine learning techniques to better comprehend the connections among ACD, polysensitization, individual susceptibility, and patient characteristics. Through MCA, we were able to assess how patients’ profiles influence ACD prevalence and reveal associations not observable through traditional statistics alone. The analysis highlighted that polysensitization predominantly originated from combinations of medications, metals, and fragrances, indicating a direct link among these allergen categories. Dyes and colorants were identified as potential triggers for severe barrier dysfunction, as they exhibited strong associations with AD. Moreover, anatomical regions such as the hands and face were significantly associated with medications, followed by dyes and colorants, suggesting that these body sites are most susceptible to contact allergens. To the best of our knowledge, this is the first study to utilize machine learning to analyze contact hypersensitivity.

Author Contributions

A.K.: investigation; writing—original draft; methodology; validation; writing—review and editing; software; formal analysis; data curation; resources. A.T.: writing—review and editing; data curation; supervision; resources. A.S.: writing—review and editing; project administration; supervision; resources. V.D.K.: writing—original draft; methodology; validation; visualization; writing—review and editing; project administration; supervision; resources; conceptualization; formal analysis. All authors have read and agreed to the published version of the manuscript.

Funding

This research received no external funding.

Institutional Review Board Statement

The study was conducted in accordance with the Declaration of Helsinki, and approved by the Scientific Review Board of the “Andreas Syggros” Hospital (Protocol Nr. 3765/2022). Approval Date: 14 January 2022.

Informed Consent Statement

Informed consent was obtained from all subjects involved in the study.

Data Availability Statement

The data that support the findings of this study are available on request from the corresponding author. The data are not publicly available due to privacy and/or ethical restrictions.

Conflicts of Interest

The authors declare no conflicts of interest.

References

  1. Brites, G.S.; Ferreira, I.; Sebastião, A.I.; Silva, A.; Carrascal, M.; Neves, B.M.; Cruz, M. Allergic contact dermatitis: From pathophysiology to development of new preventive strategies. Pharmacol. Res. 2020, 162, 105282. [Google Scholar] [CrossRef] [PubMed]
  2. Carlsen, C.B.; Andersen, E.K.; Menne, T.; Johansen, D.J. Patients with multiple contact allergies: A review. Contact Dermat. 2008, 58, 1–8. [Google Scholar] [CrossRef]
  3. Schnuch, A.; Brasch, J.; Uter, W. Polysensitization and increased susceptibility in contact allergy: A review. Allergy 2008, 63, 156–167. [Google Scholar] [CrossRef]
  4. Gosnell, L.A.; Schmotzer, B.; Nedorost, T.S. Polysensitization and Individual Susceptibility to Allergic Contact Dermatitis. Contact Dermat. 2015, 26, 133–135. [Google Scholar] [CrossRef]
  5. Dittmar, D.; Uter, W.; Bauer, A.; Fortina, A.B.; Bircher, A.J.; Czarnecka-Operacz, M.; Dugonik, A.; Elsner, P.; Gallo, R.; Ghaffar, S.A.; et al. European Surveillance System on Contact Allergies (ESSCA): Polysensitization, 2009–2014. Contact Dermat. 2018, 78, 373–385. [Google Scholar] [CrossRef] [PubMed]
  6. Uter, W.; Bauer, A.; Fortina, A.B.; Bircher, A.J.; Brans, R.; Buhl, T.; Cooper, S.M.; Czarnecka-Operacz, M.; Dickel, H.; Dugonik, A.; et al. Patch test results with the European baseline series and additions thereof in the ESSCA network, 2015–2018. Contact Dermat. 2021, 84, 109–120. [Google Scholar] [CrossRef] [PubMed]
  7. Tagka, A.; Stratigos, A.; Stavropoulos, P.; Rigopoulos, D.; Chatziioannou, A. An epidemiological study of allergic contact dermatitis in Greece: Prevalence of sensitization to an adapted European baseline series allergens. Int. J. Res. Dermatol. 2018, 4, 460–470. [Google Scholar] [CrossRef]
  8. Johansen, J.D.; Aalto-Korte, K.; Agner, T.; Andersen, K.E.; Bircher, A.; Bruze, M.; Cannavó, A.; Giménez-Arnau, A.; Gonçalo, M.; Goossens, A.; et al. European Society of Contact Dermatitis guideline for diagnostic patch testing—Recommendations on best practice. Contact Dermat. 2015, 73, 195–221. [Google Scholar] [CrossRef] [PubMed]
  9. Nguyen, H.; Yiannias, J. Contact Dermatitis to Medications and Skin Products. Clin. Rev. Allergy Immunol. 2019, 56, 41–59. [Google Scholar] [CrossRef]
  10. Rocha, V.B.; Scherrer, M.A.R. Thimerosal: Current sources of contact in Brazil. An. Bras. Dermatol. 2014, 89, 376–378. [Google Scholar] [CrossRef]
  11. Frosch, J.P.; Kugler, K. Contact Dermatitis, 5th ed.; Johansen, D.J., Frosch, J.P., Lepoittevin, P.J., Eds.; Springer: New York, NY, USA, 2010; pp. 831–840. [Google Scholar]
  12. Ibler, S.K.; Jemec, G.; Garvey, L.; Agner, T. Prevalence of delayed-type and immediate-type hypersensitivity in healthcare workers with hand eczema. Contact Dermat. 2016, 75, 223–229. [Google Scholar] [CrossRef] [PubMed]
  13. Karalis, V. The Integration of Artificial Intelligence into Clinical Practice. Appl. Biosci. 2024, 3, 14–44. [Google Scholar] [CrossRef]
  14. Chan, W.; Srivastava, R.; Damaraju, N.; Do, H.; Burnett, G.; MacFarlane, J.; Xie, S.; Chen, J.; Honari, G.; Sarin, K. Automated detection of skin reactions in epicutaneous patch testing using machine learning. Br. J. Dermatol. 2021, 185, 456–458. [Google Scholar] [CrossRef] [PubMed]
  15. Panagiotidis, K.; Tagka, A.; Vezakis, I.; Kakkos, I.; Kyritsi, A.; Matsopoulos, G. Allergic Contact Dermatitis Detection with Machine Learning. TechRxiv 2024, preprints. [Google Scholar] [CrossRef]
  16. Greenacre, M.; Blasius, J. Multiple Correspondence Analysis and Related Methods, 1st ed.; Chapman and Hall/CRC: New York, NY, USA, 2006. [Google Scholar]
  17. Shai, S.; Shai, B.D. Understanding Machine Learning: From Theory to Algorithms, 1st ed.; Cambridge University Press: New York, NY, USA, 2014. [Google Scholar]
  18. Newell, L.; Polak, M.E.; Perera, J.; Owen, C.; Boyd, P.; Pickard, C.; Howarth, P.H.; Healy, E.; Holloway, J.W.; Friedmann, P.S.; et al. Sensitization via healthy skin programs Th2 responses in individuals with atopic dermatitis. J. Investig. Dermatol. 2013, 133, 2372–2380. [Google Scholar] [CrossRef] [PubMed]
  19. Schnuch, A.; Uter, W.; Reich, K. Allergic contact dermatitis and atopic eczema. In Handbook of Atopic Eczema, 2nd ed.; Ring, J., Przybilla, B., Ruzicka, T., Eds.; Springer: Berlin/Heidelberg, Germany; New York, NY, USA, 2005; Chapter 17; pp. 176–199. [Google Scholar]
  20. Oosterhaven, J.; Uter, W.; Aberer, W.; Armario-Hita, J.C.; Ballmer-Weber, B.K.; Bauer, A.; Czarnecka-Operacz, M.; Elsner, P.; García-Gavín, J.; Giménez-Arnau, A.M.; et al. European Surveillance System on Contact Allergies (ESSCA): Contact allergies in relation to body sites in patients with allergic contact dermatitis. Contact Dermat. 2019, 80, 263–272. [Google Scholar] [CrossRef] [PubMed]
  21. Hashimoto, R.; Requa, J.; Dao, T.; Ninh, A.; Tran, E.; Mai, D.; Lugo, M.; El-Hage Chehade, N.; Chang, K.J.; Karnes, W.E.; et al. Artificial Intelligence Using Convolutional Neural Networks for Real-Time Detection of Early Esophageal Neoplasia in Barrett’s Esophagus (with Video). Gastrointest. Endosc. 2020, 91, 1264–1271.e1. [Google Scholar] [CrossRef] [PubMed]
  22. Attia, Z.I.; Kapa, S.; Lopez-Jimenez, F.; McKie, P.M.; Ladewig, D.J.; Satam, G.; Pellikka, P.A.; Enriquez-Sarano, M.; Noseworthy, P.A.; Munger, T.M.; et al. Screening for Cardiac Contractile Dysfunction Using an Artificial Intelligence–Enabled Electrocardiogram. Nat. Med. 2019, 25, 70–74. [Google Scholar] [CrossRef] [PubMed]
  23. Carron, M.; Safaee Fakhr, B.; Ieppariello, G.; Foletto, M. Perioperative Care of the Obese Patient. Br. J. Surg. 2020, 107, e39–e55. [Google Scholar] [CrossRef]
  24. Attallah, O.; Sharkas, M.A.; Gadelkarim, H. Fetal Brain Abnormality Classification from MRI Images of Different Gestational Age. Brain Sci. 2019, 9, 231. [Google Scholar] [CrossRef]
  25. Xue, B.; Li, D.; Lu, C.; King, C.R.; Wildes, T.; Avidan, M.S.; Kannampallil, T.; Abraham, J. Use of Machine Learning to Develop and Evaluate Models Using Preoperative and Intraoperative Data to Identify Risks of Postoperative Complications. JAMA Netw. Open 2021, 4, e212240. [Google Scholar] [CrossRef] [PubMed]
  26. Moraes, L.O.; Pedreira, C.E.; Barrena, S.; Lopez, A.; Orfao, A. A Decision-Tree Approach for the Differential Diagnosis of Chronic Lymphoid Leukemias and Peripheral B-Cell Lymphomas. Comput. Methods Programs Biomed. 2019, 178, 85–90. [Google Scholar] [CrossRef] [PubMed]
  27. Zhao, W.; Yang, J.; Sun, Y.; Li, C.; Wu, W.; Jin, L.; Yang, Z.; Ni, B.; Gao, P.; Wang, P.; et al. 3D Deep Learning from CT Scans Predicts Tumor Invasiveness of Subcentimeter Pulmonary Adenocarcinomas. Cancer Res. 2018, 78, 6881–6889. [Google Scholar] [CrossRef] [PubMed]
  28. Chang, P.; Grinband, J.; Weinberg, B.D.; Bardis, M.; Khy, M.; Cadena, G.; Su, M.-Y.; Cha, S.; Filippi, C.G.; Bota, D.; et al. Deep-Learning Convolutional Neural Networks Accurately Classify Genetic Mutations in Gliomas. Am. J. Neuroradiol. 2018, 39, 1201–1207. [Google Scholar] [CrossRef]
  29. Freeman, K.; Dinnes, J.; Chuchu, N.; Takwoingi, Y.; Bayliss, S.E.; Matin, R.N.; Jain, A.; Walter, F.M.; Williams, H.C.; Deeks, J.J. Algorithm Based Smartphone Apps to Assess Risk of Skin Cancer in Adults: Systematic Review of Diagnostic Accuracy Studies. BMJ 2020, 368, m127. [Google Scholar] [CrossRef] [PubMed]
  30. Quinten, V.M.; van Meurs, M.; Wolffensperger, A.E.; ter Maaten, J.C.; Ligtenberg, J.J.M. Sepsis Patients in the Emergency Department. Eur. J. Emerg. Med. 2018, 25, 328–334. [Google Scholar] [CrossRef] [PubMed]
  31. Niel, O.; Boussard, C.; Bastard, P. Artificial Intelligence Can Predict GFR Decline During the Course of ADPKD. Am. J. Kidney Dis. 2018, 71, 911–912. [Google Scholar] [CrossRef] [PubMed]
  32. Wu, Y.; Shen, Y.; Sun, H. Intelligent Algorithm-Based Analysis on Ultrasound Image Characteristics of Patients with Lower Extremity Arteriosclerosis Occlusion and Its Correlation with Diabetic Mellitus Foot. J. Healthc. Eng. 2021, 2021, 7758206. [Google Scholar] [CrossRef]
  33. Cicione, A.; De Nunzio, C.; Manno, S.; Damiano, R.; Posti, A.; Lima, E.; Tubaro, A.; Balloni, F. An Update on Prostate Biopsy in the Era of Magnetic Resonance Imaging. Minerva Urol. Nephrol. 2018, 70, 264–274. [Google Scholar] [CrossRef]
  34. Peng, Y.; Dharssi, S.; Chen, Q.; Keenan, T.D.; Agrón, E.; Wong, W.T.; Chew, E.Y.; Lu, Z. DeepSeeNet: A Deep Learning Model for Automated Classification of Patient-Based Age-Related Macular Degeneration Severity from Color Fundus Photographs. Ophthalmology 2019, 126, 565–575. [Google Scholar] [CrossRef]
  35. Vezakis, I.; Lambrou, G.; Kyritsi, A.; Tagka, A.; Chatziioannou, A.; Matsopoulos, G. Detecting Skin Reactions in Epicutaneous Patch Testing withDeep Learning: An Evaluation of Pre-Processing and Modality Performance. Bioengineering 2023, 10, 924. [Google Scholar] [CrossRef] [PubMed]
  36. Kaliyadan, F.; Ashique, K. Use of Mobile Applications in Dermatology. Indian J. Dermatol. 2020, 65, 371. [Google Scholar] [CrossRef] [PubMed]
  37. Malhi, I.S.; Yiu, Z.Z.N. Algorithm-based Smartphone Apps to Assess Risk of Skin Cancer in Adults: Critical Appraisal of a Systematic Review. Br. J. Dermatol. 2021, 184, 638–639. [Google Scholar] [CrossRef] [PubMed]
  38. Kyritsi, A.; Tagka, A.; Stratigos, A.; Pesli, M.; Lagiokapa, P.; Karalis, V. A Retrospective Analysis to Investigate Contact Sensitization in Greek Population Using Classic and Machine Learning Techniques. Adv. Exp. Med. Biol. 2023, 1424, 145–155. [Google Scholar] [PubMed]
  39. Marani, A.; Bianchelli, T.; Gesuita, R.; Faragalli, A.; Foti, C.; Malara, G.; Micali, G.; Amerio, P.; Rongioletti, F.; Corazza, M.; et al. Gender differences in adult atopic dermatitis and clinical implication: Results from a nationwide multicentre study. J. Eur. Acad. Dermatol. Venereol. 2023, 38, 375–383. [Google Scholar] [CrossRef] [PubMed]
  40. Chu, C.N.; Hu, K.C.; Wu, R.S.C.; Bau, D.T. Radiation-irritated skin and hyperpigmentation may impact the quality of life of breast cancer patients after wholebreast radiotherapy. BMC Cancer 2021, 21, 330. [Google Scholar] [CrossRef] [PubMed]
  41. Pollo, C.; Miot, H.; Sousa Matos, T.; Souza, J.; Jorge, M.; Miot, L.; Meneguin, S. Prevalence and factors associated with depression and anxiety in patients with psoriasis. J. Clin. Nurs. 2021, 30, 572–580. [Google Scholar] [CrossRef]
  42. Uter, W.; Wilkinson, S.M.; Aerts, O.; Bauer, A.; Borrego, L.; Brans, R.; Buhl, T.; Dickel, H.; Dugonik, A.; Filon, F.L.; et al. Patch test results with the European baseline series, 2019/20-Joint European results of the ESSCA and the EBS working groups of the ESCD, and the GEIDAC. Contact Dermat. 2022, 87, 343–355. [Google Scholar] [CrossRef] [PubMed]
  43. Bauer, A.; Pesonen, M.; Brans, R.; Caroppo, F.; Dickel, H.; Dugonik, A.; Filon, F.L.; Geier, J.; Gimenez-Arnau, A.M.; Napolitano, M.; et al. Occupational contact allergy: The European perspective-Analysis of patch test data from ESSCA between 2011 and 2020. Contact Dermat. 2023, 88, 263–274. [Google Scholar] [CrossRef]
  44. Uter, W.; Gefeller, O.; Giménez-Arnau, A.; Frosch, P.; Johansen, J.D.; Schuttelaar, M.L.; Rustemeyer, T.; Filon, F.L.; Dugonik, A.; Bircher, A.; et al. Characteristics of patients patch tested in the European Surveillance System on Contact Allergies (ESSCA) network, 2009–2012. Contact Dermat. 2015, 73, 82–90. [Google Scholar] [CrossRef]
  45. ESSCA Writing Group. The European Surveillance System of Contact Allergies (ESSCA): Results of patch testing the standard series, 2004. J. Eur. Acad. Dermatol. Venereol. 2008, 22, 174–181. [Google Scholar] [CrossRef] [PubMed]
  46. Uter, W.; Schnuch, A.; Wilkinson, M.; Dugonik, A.; Dugonik, B.; Gansland, T. Registries in Clinical Epidemiology: The European Surveillance System on Contact Allergies (ESSCA). Methods Inf. Med. 2016, 55, 193–199. [Google Scholar] [PubMed]
  47. Pesonen, M.; Jolanki, R.; Filon, F.L.; Wilkinson, M.; Kręcisz, B.; Kieć-Świerczyńska, M.; Bauer, A.; Mahler, V.; John, S.M.; Schnuch, A.; et al. Patch test results of the European baseline series among patients with occupational contact dermatitis across Europe—Analyses of the European Surveillance System on Contact Allergy network, 2002–2010. Contact Dermat. 2015, 72, 154–163. [Google Scholar] [CrossRef] [PubMed]
  48. Uter, W.; Amario-Hita, J.C.; Balato, A.; Ballmer-Weber, B.; Bauer, A.; Fortina, A.B.; Bircher, A.; Chowdhury, M.M.U.; Cooper, S.M.; Czarnecka-Operacz, M.; et al. European Surveillance System on Contact Allergies (ESSCA): Results with the European baseline series, 2013/2014. J. Eur. Acad. Dermatol. Venereol. 2017, 31, 1516–1525. [Google Scholar] [CrossRef] [PubMed]
  49. Frosch, J.P.; Johansen, J.D.; Schuttelaar, M.L.A.; Silvestre, J.F.; Sánchez-Pérez, J.; Weisshaar, E.; Weisshaar, W.; ESSCA network. Patch test results with fragrance markers of the baseline series—Analysis of the European Surveillance System on Contact Allergies (ESSCA) network 2009–2012. Contact Dermat. 2015, 73, 163–171. [Google Scholar] [CrossRef]
  50. Giménez-Arnau, A.M.; Deza, G.; Bauer, A.; Johnston, G.A.; Johnston, V.; Schuttelaar, M.L.; Sanchez-Perez, J.; Silvestre, J.F.; Wilkinson, M.; Uter, W. Contact allergy to preservatives: ESSCA* results with the baseline series, 2009–2012. J. Eur. Acad. Dermatol. Venereol. 2017, 31, 664–671. [Google Scholar] [CrossRef] [PubMed]
  51. Horton, E.; Uter, W.; Geier, J.; Ballmer-Weber, B.; Bauer, A.; Bircher, A.; Dickel, H.; Giménez-Arnau, A.; Gonçalo, M.; John, S.M.; et al. Developing a cosmetic series: Results from the ESSCA network, 2009–2018. Contact Dermat. 2021, 84, 82–94. [Google Scholar] [CrossRef]
  52. Amann, J.; Blasimme, A.; Vayena, E.; Frey, D.; Madai, V.I. Explainability for Artificial Intelligence in Healthcare: A Multidisciplinary Perspective. BMC Med. Inform. Decis. Mak. 2020, 20, 310. [Google Scholar] [CrossRef]
  53. Kaul, V.; Enslin, S.; Gross, S.A. History of Artificial Intelligence in Medicine. Gastrointest. Endosc. 2020, 92, 807–812. [Google Scholar] [CrossRef]
  54. Ferrara, P.; Battiato, S.; Polosa, R. Progress and Prospects for Artificial Intelligence in Clinical Practice: Learning from COVID-19. Intern. Emerg. Med. 2022, 17, 1855–1857. [Google Scholar] [CrossRef]
Figure 1. Multiple correspondence analysis of the patients’ characteristics (A) and anatomical regions (B) of allergic contact dermatitis. The analysis was performed for the following patients’ features: patient group (polysensitized and monosensitized patients), atopic dermatitis (AD), family atopic dermatitis (AD) history, occupation class (health workers, hairdressers, cleaners, bakers, cooks, builders, engineers, householders, office workers, nail technicians, make-up artists, technicians, metal workers), age group (≤40, >40), gender. Key: face dermatitis (FD), hand dermatitis (HD), leg dermatitis (LD), and trunk dermatitis (TD).
Biomedinformatics 04 00074 g001
Figure 2. Relationships between the anatomical regions of allergic contact dermatitis with patient characteristics. Multiple correspondence analysis was performed for (A) gender, (B) age group (≤40, >40), (C) occupation class, (D) atopic dermatitis (AD), and (E) family atopic dermatitis history. The anatomic sites refer to hand dermatitis (HD), face dermatitis (FD), leg dermatitis (LD), and trunk dermatitis (TD).
Biomedinformatics 04 00074 g002
Figure 3. Multiple correspondence analysis of patient group (polysensitized patients or monosensitized patients) in relation with the anatomical site. Key: HD, hand dermatitis; LD, leg dermatitis; FD, face dermatitis; TD, trunk dermatitis.
Biomedinformatics 04 00074 g003
Figure 4. Separate multiple correspondence analysis for the polysensitized (A,C) and thimerosal monosensitized (B,D) patients. Key: AD, atopic dermatitis history, occupation class (health workers, hairdressers, cleaners, bakers, cooks, builders, engineers, householders, office workers, nail technicians, make-up artists, technicians, and metal workers), age group (≤40, >40), gender; HD, hand dermatitis; LD, leg dermatitis; FD, face dermatitis; TD, trunk dermatitis.
Biomedinformatics 04 00074 g004
Figure 5. Multiple correspondence analysis of polysensitization. The analysis was performed for (A) allergen category (dyes, colorants, medicines, metals, fragrances), (B) atopic dermatitis (AD) in relation to allergen category, and (C) anatomical regions of allergic contact dermatitis. Key: HD, hand dermatitis; FD, face dermatitis.
Biomedinformatics 04 00074 g005
Table 1. Baseline characteristics of the patients.
CharacteristicPolysensitized Patients
(N = 200, 50.0%)
Monosensitized Patients
(N = 200, 50.0%)
Gender
Male100 (50.0%)100 (50.0%)
Female100 (50.0%)100 (50.0%)
Age (median, range)34.5 (18–79)36.7 (18–82)
Occupation Class
Cleaners/Householders23 (11.5%)9 (4.5%)
Bakers/Cooks13 (6.5%)15 (7.5%)
Engineers/Builders12 (6.0%)17 (8.5%)
Nail Technicians & Make-up Artists16 (8.0%)15 (7.5%)
Healthcare Workers19 (9.5%)26 (13.0%)
Office Workers79 (39.5%)80 (40.0%)
Technicians/Metal Workers33 (16.5%)31 (15.5%)
Hairdressers5 (2.5%)7 (3.5%)
MOAHLFA Index
Male (M)100 (50.0%)100 (50.0%)
Occupational Dermatitis (O)92 (46.0%)36 (18.0%)
Atopic Dermatitis (A)83 (41.5%)79 (39.5%)
Hand Dermatitis (H)128 (64.0%)157 (78.5%)
Leg Dermatitis (L)54 (27.0%)31 (15.5%)
Facial Dermatitis (F)57 (28.5%)79 (39.5%)
Age 40+ (A)51 (25.5%)65 (32.5%)
Trunk Dermatitis (T)59 (29.5%)37 (18.5%)
Atopic Dermatitis History
Family Positive History43 (21.5%)58 (29.0%)
Table 2. Positive patch test reactions of the polysensitized patients.
Sample SizePolysensitized PatientsSample SizePolysensitized Patients
(N, %)(N = 200, 100.0%)(N, %)(N = 200, 100.0%)
Preservatives Plastic Glues
Thimerosal 0.1%200 (100.0%)Paratertiarybutyl Phenol formaldehyde
Methyldibromo-Glutaronitrile 0.5%10 (5.0%)Resin (BPF-Resin) 1%6 (3.0%)
KATHON 0.02%9 (4.5%)2-Hydroxyethyl-Methacrylate/HEMA 2%5 (2.5%)
Formaldehyde 2%8 (4.0%)Epoxy Resin 1%3 (1.5%)
Quaternium 15 1%4 (2.0%)
Paraben Mix 16%2 (1.0%)
Medicines Natural Origin
Ethylenediamine Dihydr 1%51 (25.5%)Propolis 10%28 (14.0%)
Budesonide 0.01%16 (8.0%)Sesquiterpenelactone Mix 0.1%6 (3.0%)
Neomycin Sulphate 20%7 (3.5%)Colophonium 20%5 (2.5%)
Caine Mix 7%3 (1.5%)Wool Alcohols 30%3 (1.5%)
Metals Fragrances
Nickel Sulphate 5%95 (47.5%)Fragrance Mix II 14%150 (75.0%)
Cobalt Chloride 1%26 (13.0%)Fragrance Mix I 8%41 (20.5%)
Potassium Dichromate 0.5%14 (7.0%)Balsam of Peru 25%23 (11.5%)
Dyes/Colorants Rubbers
Paraphenylenediamine 1% 14 (7.0%)Thiuram Mix 1%11 (5.5%)
PPD-Black Rubber Mix 0.1%9 (4.5%)Mercaptobenzothiazole (MBT) 2%3 (1.5%)
Textile Dye Mix 6.6%7 (3.5%)Mercapto Mix 2%2 (1.0%)
Table 3. Polysensitization patterns.
Allergen CategoriesPolysensitized Patients
(N = 200, 100.0%)
Number of Allergens
3109 (54.5%)
449 (24.5%)
527 (13.5%)
67 (3.5%)
74 (2.0%)
82 (1.0%)
91 (0.5%)
111 (0.5%)
Most Frequent Polysensitization Patterns
Preservatives/Fragrances/Metals110 (55.0%)
Preservatives/Fragrances/Medicines56 (28.0%)
Preservatives/Metals/Medicines28 (14.0%)
Preservatives/Fragrances/Metals/Medicines19 (9.5%)
Table 4. Results of chi-square analysis according to hand dermatitis.
Hand Dermatitis (HD)
Group VariablesTotalNoYesp-Value
All PatientsPatient Group [n (%)]n = 400n = 115n = 2850.001
Polysensitized200 (50)72 (62.7)128 (44.9)
Monosensitized200 (50)43 (37.3)157 (55.1)
Polysensitized PatientsOccupation Class [n (%)]n = 200n = 70n = 1300.003
Cleaners/Householders23 (11.5)6 (8.6)17 (13.1)
Bakers/Cooks13 (6.5)2 (2.8)11 (8.5)
Engineers/Builders12 (6.0)5 (7.2)7 (5.4)
Nail Technicians & Make-up Artists16 (8.0)6 (8.6)10 (7.7)
Healthcare Workers19 (9.5)4 (5.6)15 (11.5)
Office Workers79 (39.5)39 (55.8)40 (30.8)
Technicians/Metal Workers33 (16.5)7 (10.0)26 (20.0)
Hairdressers5 (2.5)1 (1.4)4 (3.0)
Polysensitized PatientsGender [n (%)]n = 200n = 72n = 1280.077
Males100 (50)30 (41.7)70 (54.7)
Females100 (50)42 (58.3)58 (45.3)
Monosensitized PatientsOccupation Class [n (%)]n = 200n = 43n = 1570.000
Cleaners/Householders9 (4.5)1 (2.3)8 (5.0)
Bakers/Cooks15 (7.5)0 (0)15 (9.6)
Engineers/Builders17 (8.5)1 (2.3)16 (10.1)
Nail Technicians and Make-up Artists15 (7.5)1 (2.3)14 (9.0)
Healthcare Workers26 (13.0)2 (4.6)24 (15.2)
Office Workers80 (40.0)32 (74.5)48 (30.6)
Technicians/Metal Workers31 (15.5)5 (11.7)26 (16.6)
Hairdressers7 (3.5)1 (2.3)6 (3.9)
Monosensitized PatientsGender [n (%)]n = 200n = 43n = 1570.025
Males100 (50)15 (34.9)85 (54.1)
Females100 (50)28 (65.1)72 (45.9)
Key: p-value refers to chi-square test (at the 5% nominal significance level).
Disclaimer/Publisher’s Note: The statements, opinions and data contained in all publications are solely those of the individual author(s) and contributor(s) and not of MDPI and/or the editor(s). MDPI and/or the editor(s) disclaim responsibility for any injury to people or property resulting from any ideas, methods, instructions or products referred to in the content.

