
Acoustic Emission Monitoring for Damage Assessment of a Magnetite Ultra-High-Performance Concrete (MUHPC) Block in a Bending Test

School of Civil Engineering, Zhengzhou University, Zhengzhou 450001, China
NDT 2024, 2(2), 87-107; https://doi.org/10.3390/ndt2020006
Submission received: 29 February 2024
/
Revised: 24 April 2024
/
Accepted: 3 May 2024
/
Published: 8 May 2024
Abstract
:Ultra-high-performance concrete (UHPC) is widely used because of its exceptional properties, such as high compressive and flexural strength, low permeability, and resistance to abrasion and chemical attack. It is commonly employed for intricate constructions like skyscrapers, precast concrete components, and infrastructure. Nevertheless, the incorporation of appropriate fibers into UHPC is carried out in order to accomplish objectives such as augmenting strength, enhancing toughness, and regulating cracking. This study employed magnetite as an additive to a UHPC block in order to examine the mechanical characteristics of a newly cast UHPC block. Acoustic emission was employed to evaluate the damage to the UHPC block for tracking purposes. Acoustic emission is a non-invasive testing technique that does not cause harm to the specimen when it is exposed to a load. On the basis of this, many critical locations that indicated the propagation of cracks were analyzed, as well as various loading stages across the specimen. The b-value is a method that can evaluate the extent of damage by analyzing the amplitude distribution. Distinct paths of b-values were noted for each loading stage, indicating major damage scenarios based on their slopes.
1. Introduction
Ultra-high-performance concrete (UHPC) is a fiber-reinforced cement-based material [1]. The main components of this mixed substance include additives such as silica fume, quartz flour, fine silica, sand, high-range water reducer, steel fibers, and cement. UHPC exhibits exceptional mechanical properties and demonstrates enhanced toughness [2]. It has become a ground-breaking substance that is expanding the possibilities for concrete [3]. This newly cementitious concrete is increasingly being used in many civil engineering projects, including infrastructure development [4] and the manufacturing of urban furniture and decorative objects [5]. This product’s outstanding attributes make it well-suited for various applications, such as bridge deck building [6], high-performance column fabrication [7,8], placement of architectural cladding [9], and the manufacturing of precast components [10]. UHPC exhibits remarkable strength, flexibility, and durability, with compressive strengths exceeding 150 MPa [11], tensile strengths exceeding 20 MPa [12], and improved durability against chemical and physical deterioration [13,14]. Several studies have been conducted to survey the mechanical behavior of UHPC when it was reinforced with additives. In Meng’s study, the utilization of graphite nanoplatelets and carbon nanofibers in UHPC was investigated, resulting in enhanced mechanical characteristics. Increasing the concentration of nanomaterials from 0 to 0.3% resulted in a 56% rise in tensile strength and a 187% increase in energy absorption capacity. Similarly, flexural strength and toughness increased by 59% and 276%, respectively [15]. Yu [16] demonstrated that the mechanical qualities of the mixture containing ground granulated blast-furnace slag are superior to those containing fly ash or limestone powder, both at 28 and 91 days. The pozzolanic reaction of fly ash is greatly delayed in UHPC due to the low water content and comparatively high dosage of superplasticizer. In addition, the estimations of the embedded CO2 emission indicate that the cement and mineral admixtures are effectively utilized in the developed UHPC, resulting in a reduced environmental impact compared to previous UHPCs documented in the literature [16].
UHPC has various shortcomings despite its benefits. Its inherent brittleness may cause breaking under compressive stresses [17]. One way to reduce this issue is by adding steel fibers to increase ductility [18]. The high cost of materials and manufacture, industry inexperience, and lack of design protocols also hinder UHPC adoption [19]. The high cement and silica fume requirements for UHPC manufacturing create economic and ecological challenges that hinder its practical adoption and sustainability [17,20]. In addition, UHPC overlays provide increased durability for bridge decks by minimizing the penetration of water and chloride. However, it is essential to pay close attention to structural aspects such as cold-joint details in order to ensure sustained enhancement in performance [21]. Magnetite nanoparticles are widely utilized in diverse domains, including medicine, cancer therapy, and biosensing, due to their biocompatibility and distinctive features [22]. Colloid magnetite particles have been employed in the field of medical nanotechnology to produce biocompatible sorbents that have a strong ability to absorb substances and have beneficial effects on cell metabolism. This offers a way to remove toxins from the body and regulate cellular processes [23,24]. Furthermore, much research has been conducted on the phase and mineral composition of magnetite to enhance its application in the manufacturing of iron concentrate, yielding valuable insights for its utilization [25]. Although magnetite is a valuable material, it possesses various vulnerabilities. Belov [26] observed a phase transition in the “weak” sublattice of magnetite, indicating a low-temperature transition. Kasama [27] examined magnetite microstructures and magnetic properties. The analysis found closely spaced planar faults and superstructures in the material. Svindrych [28] investigated a low-temperature magnetite magnetic anomaly that may be related to a glass-like transition. Kobori [29] noted a distinctive localized spin-freezing phenomenon in magnetite sinter, suggesting possible difficulties in its magnetic properties. The structural and behavioral shortcomings of magnetite may have an impact on its performance in different applications. Meanwhile, magnetite is used in UHPC as a replacement for river sand. This helps to improve qualities such as compressive strength and radiation-shielding capacities [30]. It was discovered that incorporating magnetite fine aggregate into UHPC greatly enhanced its mechanical and radiation-shielding characteristics, resulting in a 56.8% rise in the linear attenuation coefficient. These findings indicate that magnetite has the potential to improve the effectiveness of UHPC in shielding against radiation [30].
Despite the numerous advantages of UHPC, there are some shortcomings of this substance. For instance, due to the intricate characteristics of UHPC, including its distinct microstructure and reinforcement with fibers, it is imperative to obtain a more profound comprehension of how it undergoes damage progression when subjected to different loading circumstances. Conventional methods such as visual inspection and strain gauges are typically insufficient for detecting the complex micro-cracking and internal damage development in specimens made of UHPC [1,31]. The AE approach serves as an effective means for non-destructive damage assessment [32]. The main concept for AE testing is to non-destructively monitor and detect damage mechanisms and failure processes in materials during mechanical loads [33]. The above-mentioned non-destructive test provides numerous benefits in diverse applications. One of those advantages is that it allows for the continuous monitoring of tool deterioration in real time [34]. This technique is utilized for nondestructive evaluation of various materials such as metal, concrete, composites, polymers, and wood [35]. The utilization of this approach is growing in its application across diverse civil engineering projects, encompassing infrastructure building as well as the production of urban furniture and decorative products [36]. The AE approach is employed to examine the progression of damage and the response of UHPC under loading [37,38]. UHPC surface fractures and sources of internal damage can be identified using this nondestructive testing method [39]. AE is an inherent occurrence caused by the abrupt release of energy within a structure [40], leading to a transient elastic wave [41]. It also operates by detecting the sounds emitted by a structure when it is under stress or experiencing internal damage, such as delamination or crack propagation [42]. AE equipment can detect sound frequencies between 100 kHz and 1 MHz, and can also accommodate lower frequency ranges if necessary [43]. In general, the analysis of AE can be categorized into two main types: waveform analysis and parameter analysis. The output signal (waveform analysis) of this test is usually categorized into three categories: burst, continuous, and mixed. Burst signals are brief signals that arise from internal material damage, such as delamination and fiber fracture. In contrast, the continuous signal arises from the superimposition of bursts that cannot be distinguished separately. A mixed signal, commonly found in service, refers to a situation where both discrete bursts and a continuous signal coexist [44]. This approach is capable of monitoring the failure mechanisms of materials or structures under various failure modes. The parameter-based analysis method is currently being widely used in many applications to monitor the structural health of buildings due to its straightforward and uncomplicated nature [45]. Given that a single AE parameter may not provide a reliable assessment of damage to materials, structures, or crack mechanisms, it is necessary to employ complete AE parameter analysis methodologies, such as the b-value [46,47], the improved b-value (Ib-value) [48], RA-AF association analysis method [49], and AE intensity analysis method, which are extensively utilized for monitoring concrete structure damage using AE technology [50].
This study was executed to analyze and survey the behavior of a magnetite ultra-high-performance concrete (MUHPC) block in a bending test. The objective of this study was to observe and record the damage mechanism of the magnetite to have a better understanding of its durability as it is subjected to a bending test. The novelty of this research is the addition of magnetite as an additive to UHPC and simultaneous utilization of the proper non-destructive test to monitor the damage mechanism of magnetite during the loading process. Based on the AE charter, rapid release of energy will be released, whereas this method is a passive test when the specimen is subjected to loading. AE parameter analysis was used to realize the damage procedure. An investigation was conducted into the characteristics of AE cumulative ringing counts, energy, peak frequencies, and b-value as the load increased. The results show five distinct damage loading procedures, as well as the micro-crack and macro-crack points, and each damage loading has its own characteristics based on its slopes. The b-value is an approach used to assess the damage scenario based on amplitude distribution, even without directly referring to the load parameter. The outcome of this parameter of AE demonstrated the durability of MUHPC.
2. Experimental Setup
2.1. Material and Specimen
This experiment was a bending test (3-point bending test) for an ultra-high-performance concrete (UHPC) block with 20% magnetite in total volume. The exact dimension of that UHPC block was 40 mm × 40 mm × 160 mm. First, the UHPC block was prefabricated, the mold was removed after two days, and curing continued, after removing the mold, for 28 days. Second, the UHPC block was subjected to a 3-point bending test while 4 acoustic emission sensors were mounted on the surface of the specimen. Table 1 clarifies the mix ratio for 20% magnetite and its details for the experiment.
2.2. Test Setup
Throughout the course of the experiment, a bending test was carried out. The particular bending test that was carried out was known as the three-point bending test as it was conducted. In this scenario, the MUHPC block was placed on two support points while a load was imposed in the center. The loading method employed was monotonic static loading, and the loading rate that was utilized was 0.5 kN/s. Five hundred newtons per second was the peak pressure that was achieved as a result of this. The “TYA 300B, Xin Luda Instrument and Equipment” model was used to evaluate the bending strength of the MUHPC blocks. Figure 1 illustrates the schematic design of the bending test. The three-point bending test involves applying a single focused stress to the MUHPC block while supporting them at two fixed places that are spaced apart. The spacing between the supports is a critical factor since it directly affects the distribution of stress within the block. During our experiments, the span was adjusted based on the normal recommendations for the dimensions of the blocks utilized.
The blocks were strategically placed on the support points to provide a uniform distribution of the weight across the whole width of the block. Precise alignment is crucial for ensuring the accuracy of the test, as any variation may result in the formation of stress concentrations that do not accurately reflect the material’s actual bending strength.
After the sample was placed securely on the machine, the loading head, which had a highly accurate force transducer, was positioned in line with the center of the specimen’s top surface. The downward movement of the loading head was programmed to start at a pace of 0.5 kN/s while a precision measurement system continuously monitored the force exerted at each instant. The loading rate was deliberately selected to be sufficiently slow, ensuring that the material under test can be treated as being in a quasi-static state. This assumption allows the inertial effects to be disregarded.
As the stress intensified, the MUHPC block experienced deflection. The deflection was continuously monitored in conjunction with the applied load. The linked laptop utilized software to record these data points and provide real-time visualization of the load against the deflection curve. The test proceeded until the MUHPC block failed, at which point the maximum load-bearing capacity was determined by analyzing the highest point on the load–deflection curve.
2.3. AE Monitoring
The AE signals were gathered and recorded using the AE data acquisition system during this experiment. The system incorporated a DS5-16B holographic AE signal analyzer, RS-2A sensors, and 40 dB gain pre-amplifiers. All of this equipment was bought from Beijing Softland Company. Four AE sensors were strategically placed on the upper and lateral surfaces of the MUHPC block to carry out the test. Due to this configuration, it was ensured that all of the AE signals produced during the specimen’s failure phase were captured.
The sensors employed in this experiment were produced by Beijing Softland Company(Beijing, China). For this specific inquiry, the RS-2A sensors were chosen from the range of sensor types offered by the company. Piezoelectric materials provide a direct method of converting signals between the mechanical and electrical domains. The reversible and linear piezoelectric effect can manifest as the generation of an electric charge (voltage) when stress is applied (direct effect) or as the production of strain (stress) when an electric field is applied (converse effect).
Epoxy resin adhesives are typically utilized for attaching piezoelectric sensors to concrete surfaces due to their outstanding bonding properties, durable nature, and ability to endure environmental factors. Prior to attaching the sensors, it is imperative to clean the surface of the UHPC thoroughly. All particles, pieces, grease, or other contaminants that could affect adhesion should be removed. To ensure proper application, a uniform coating of epoxy adhesive should be applied to the rear surface of the piezoelectric sensor using a small brush or spatula. It is vital to guarantee that the entire surface is fully encompassed. An excessive quantity of adhesive should be avoided since any extra adhesive may be forced out when the sensor is applied to the concrete surface.
A typical AE sensor based on a PZT element can convert elastic motions with a displacement of 1 pm into electrical signals with a voltage of 1 μV [51]. A wear plate is attached to the surface, and the piezoelectric element is contained within a housing for its protection. Figure 2 depicts a straightforward diagram of an AE sensor’s internal workings. The function of each component is defined in the following sections.
The primary component of the sensor is the PZT element, which is a piezoelectric material that demonstrates the ability to produce an electric charge when subjected to mechanical stress. Within the framework of AE, when an acoustic wave originating from a material being examined makes contact with the PZT element, the force exerted by the wave induces a tiny deformation in the PZT. The deformation of the PZT element generates a voltage, which can be detected and documented. The wear plate functions as a protective layer that is positioned on top of the PZT element. The objective of the shield is to protect the piezoelectric material from wearing out and being damaged by the environment while still permitting the effective transmission of acoustic emissions from the test material to the PZT element. The housing encloses the PZT element and wear plate, creating a robust and safe environment for the sensor components. Its purpose is to preserve the sensor’s integrity throughout its lifespan and facilitate the transmission of acoustic signals to the PZT element. The connector functions as an intermediary between the PZT sensor and the equipment employed for signal processing, such as a data-gathering system. The connector ensures the precise and dependable transmission of the electrical signals produced by the PZT element for examination.
The accurate identification of damage relies heavily on the careful selection and precise positioning of suitable sensors. Attenuation pertains to the decrease in amplitude of AE waves as they travel through a material. The determination of attenuation can be achieved by utilizing the exponential relationship, depicted as follows:
where Af indicates the amplitude at the sensing point, A0 represents the initial amplitude at the source location, α represents the attenuation coefficient, and d denotes the distance traveled by waveform [52].
The subsequent data (Table 2) present detailed information about these sensors.
2.4. Data Acquisition System
A data acquisition system (DAS), is a collection of hardware and software components that are employed to capture, record, and process acoustic signals emitted by stressed materials or structures. A data acquisition system (DAS) is a crucial element in the AE testing and analysis procedure since it gathers and archives data for subsequent analysis and interpretation [53,54,55].
3. Results
Analysis of Characteristics of AE Parameters
The utilization of AE technology allows for the observation and analysis of minute alterations in the configuration and development of fractures in materials exposed to external forces, as well as the advancement and enlargement of these fractures. In order to accurately determine the AE characteristics of the AE source during the bending test of ultra-high-performance concrete (UHPC), it is essential to carefully analyze the variation characteristics of various AE parameters. These parameters include amplitude, frequency, ringing count, energy, and peak frequency. The failure process in the bending test of UHPC is complex and sophisticated, making it necessary to thoroughly consider these parameters. Figure 4 depicts the schematic representation of the gathered AE parameters and a typical AE signal.
- Amplitude and frequency
Figure 5 illustrates that the highest amplitude measured during the entire experiment was at the 127th second for sensor 1 and at the 114th second for sensors two and four. Sensor three exhibited its maximum amplitude values at the 134th second, distinguishing it from the other sensors. The maximum magnitudes detectable by sensors one to four are 94.57, 98.6, 91.46, and 93.42 dB, respectively.
Figure 6 illustrates the amplitude vs. frequency domain generated from the data acquisition system tool (Beijing Softland Co., Beijing, China) for the fourth sensor. The Fast Fourier Transform (FFT) was utilized to determine the frequency characteristics during the gathering of parametric data in the aforementioned data acquisition system. The data reveal that the predominant frequencies lie within the range of 87 to 283 kHz, with minor peaks occurring between 284 and 400 kHz.
- Acoustic Emission Ringing Count
The AE ringing count refers to the quantification of oscillations that surpass a specific threshold, providing an approximate indication of the frequency and intensity of the AE signal [58,59]. The slope of the cumulative ringing count in the acoustic emission count can offer useful insights into monitoring the advance of damage, evaluating the integrity of structures, and anticipating potential failure mechanisms in various materials and structural elements undergoing AE testing. It can be used to study the degradation and breakage mechanisms of materials.
As can be observed in Figure 7, the bending test of magnetite UHPC may be broken down into five distinct stages, each of which exhibits its own set of characteristics that are distinct from those of the previous stages. According to the cumulative ringing count graph, the change in slopes along the graph can be used to determine when the specimen is entering a new phase or stage. This can be done by observing the progression of the slopes.
The stages can be categorized as the initial stage (pre-cracking), the hardening stage, the critical transition stage, the pull-out stage, and the failure stage, based on their respective characteristics. The characteristics of each step are as follows: for the initial step, there should be a low cumulative ringing count, while the hardening stage should show a gradual increase in the cumulative ringing count. There is an abrupt surge in the total number of ringing counts during the critical transition stage. There is a distinct increase in the total number of ringing counts during the pull-out stage, followed by a rapid decrease or significant shift in the graph displaying the total ringing counts.
In accordance with Figure 7, the initial phase for all four sensors lasted until 0.1 F/Fmax. At this time, there was no noticeable crack, and the MUHPC experienced elastic deformation. Upon reaching a load of 0.1 F/Fmax, the hardening stage commenced and persisted until 0.71 F/Fmax for all sensors. During this phase, when stress levels rise, the material begins to experience damage, micro-cracking, or other forms of deformation, resulting in a higher occurrence of acoustic emission events. The critical transition stage commenced when the load reached 0.71 times the maximum load (F/Fmax) and persisted until it reached 0.93 times F/Fmax for all sensors. This stage potentially signifies the commencement of cracking or the initiation of substantial harm within the material. The pull-out stage commenced when the load reached 0.93 times the maximum load capacity (F/Fmax) and continued until it reached 0.98 F/Fmax for all sensors. During this stage, cracks spread and interactions between fibers led to a higher cumulative ringing count. The final phase, known as the failure stage, commenced at 0.98 F/Fmax and continued until the material, MUHPC, experienced complete and catastrophic failure at maximum stress.
As previously mentioned, the macro-cracks begin to propagate within the specimen during the pull-out stage, which is characterized by a significant increase in the cumulative ringing count.
Another crucial aspect that warrants emphasis is the concept of the “inflection” point. Inflection points are locations where cracks are evident and can be interpreted as instances of changing slope, particularly when the slope alters from positive to negative or vice versa, or when it changes from positive or negative to zero. These points may indicate significant stages or thresholds in the material’s behavior. These points may serve as indicators of various stages of the test or certain occurrences in the material. Figure 7 reveals the presence of inflection points, namely for sensors 1 and 4. These inflection points, occurring during the pull-out stage, indicate the initiation of macro-cracks. Three inflection points were found for sensor 2. One of these points corresponds to the critical transition stage, indicating the presence of micro-cracks. The remaining two points correspond to the pull-out stage, indicating the initiation of macro-cracks.
Table 3 presents the precise slopes for each level. Based on the data, it can be found that sensors 2 and 3 exhibited greater activity, and the slope rate for these two sensors was higher compared to the other two. Table 3 shows that the slope rate for sensor 2 was higher than that for sensor 1 during the critical transition stage, whereas the slope rate for sensor 1 was higher than that for sensor 2 during the pull-out stage.
To better assess the damage level, the statements below should be noted. The graph exhibiting the highest number of ringing counts or the steepest rise in cumulative ringing counts typically reflects the sensor that identified the most substantial damage. The sensor is expected to display the most extreme amount of damage or the most critical scenario.
- Early inflection points: This indicates that the onset of damage occurs at lower levels of applied force.
- A steeper slope in cumulative ringing counts indicates a higher rate of damage occurring within a smaller range of loads.
- Increased overall ringing counts indicate a higher frequency of acoustic emissions and possibly more extensive damage.
Sensor (1) displays the first points of inflection, followed by a progressive rise in the cumulative ringing counts. This implies the beginning of harm, but not always the most severe state. Sensor (2) displays inflection points A, B, and C, along with a notable surge in ringing counts during phase III. This surge may suggest rapid deterioration and a severe state of the condition. Sensor (3) shows that the slope of cumulative ringing counts remains generally constant until phase IV, suggesting that serious damage occurs later. Sensor (4) exhibits a similar pattern to graph (3), showing that the majority of activity occurs in phase IV. This indicates that damage primarily occurs at greater loads.
According to this research, the sensor associated with sensor (2) exhibits the most serious damage condition. This is evident from its earliest and most inflection points, as well as the greatest cumulative ringing counts. This indicates that the sensor identified the start of damage at a lower level of stress and noticed a fast progression of the damage. This could be a sign that the worst possible scenario occurred among the four possibilities that were offered.
Meanwhile, this statement should be noted to evaluate the stability:
- Decreased ringing counts: A reduction in the number of acoustic emissions may represent a decrease in activity inside the material, indicating a lower occurrence of damaging events.
- Gradual cumulative increase: A smoother and steady upward trend in the cumulative ringing count line indicates a regular rate of sound emission without abrupt spikes, which are usually linked to instances of damage.
Sensor (1) displays the cumulative count in this graph, showing continuous growth in damage without any sudden spikes. However, there are some initial points where the rate of increase changes. Sensor (2) displays several inflection points and a sharp rise in cumulative counts, suggesting a less stable condition with the possibility of more significant damage. Sensor (3) depicts a period of a low and steady starting phase followed by a sharp rise in phase IV, indicating overall stability for most of the loading process but instability at greater loads. Sensor (4) has a similar pattern to sensor (3), demonstrating stability at first and then experiencing a sudden and significant increase towards the end.
Sensor (1) demonstrates the highest level of stability due to its steady and progressive increase in cumulative ringing counts during the loading phases. Although there were some initial changes, the absence of significant increases indicates that the identified instances of damage were rather stable and not sudden or extreme.
- Acoustic Emission Energy
The AE energy, which represents the strength of AE signals, is determined by calculating the integral of the AE signals within the detection envelope [60]. AE signal strength corresponds to the area of the waveform envelope, which indicates the comparative energy and intensity of AE activities [61]. This parameter may serve as an indicator of the entire damage process, and variational characteristics are frequently employed as AE testing criteria for structures or materials.
The graph of F/Fmax against cumulative energy, similar to the graph of F/Fmax versus cumulative ringing count, displays the same pattern and allows for the identification of each stage based on the slopes seen. Figure 8 highlights the presence of inflection points during the hardening stage, critical transition stage, and pull-out stage. Sensor 1 detects the presence of macro-cracks during the pull-out phase. Sensor 2 exhibits two micro-cracks during the hardening stage and two macro-cracks during the pull-out stage. Sensors 2 and 3 exhibit identical signal strength patterns, with one micro-crack observed during the hardening stage and one macro-crack observed during the pull-out stage.
Table 4 provides the precise slopes for each sensor at the corresponding stages. During the hardening and critical periods, sensor 3 exhibited greater activation and recorded the highest slope value. For pull-out stages, sensor 2 exhibited the highest observed slope. Thus, the slopes of the cumulative ringing count and cumulative energy curves during the bending test of the MUPHC block varied at different stages. AE energy and ringing counts can effectively differentiate between the five stages of the failure process of the multi-scale ultra-high-performance concrete (MUHPC) block.
In order to assess the extent of the damage, it is important to observe the behavior of each individual sensor. Sensor (1) displays a moderate degree of energy release and a consistent, gradual increase in cumulative energy. This indicates a steady progression of harm without any abrupt or catastrophic events. Sensor (2) displays a far greater and more diverse energy release with a steep cumulative energy curve, suggesting a more severe damage scenario with multiple large damage occurrences (inflection points A, B, C, and D). Sensor (3) displays a modest energy release and a steady increase in cumulative energy, followed by a sudden rise at the conclusion. This suggests that the specimen remained stable until it neared failure. Sensor (4) exhibits a minimal energy release over much of the loading process, followed by a sudden surge in cumulative energy towards the end. This pattern is comparable to sensor (3), indicating overall stability during the bulk of the test, followed by rapid damage accumulation towards the end.
In the evaluation of the stability and extent of damage, sensor (3) can be regarded as the most stable due to its minimal overall energy release and a steady increase in cumulative energy, which persisted until just before the conclusion of the test. Indications point to the fact that the material exhibited elastic behavior or experienced minimal damage throughout the majority of the test. Sensor (2) exhibited the most severe damage scenario. The test exhibits the greatest energy release, several points of change in direction, and the most rapid accumulation of energy, suggesting the occurrence of multiple severe damage events and a significant build-up of energy associated with damage.
To summarize, sensor (2) represents the highest degree of destruction, whereas sensor (c) demonstrates the greatest level of stability until the last stages. To ensure accurate conclusions regarding the damaged status of the tested specimen, it is essential to verify the interpretation of the AE data by conducting a physical inspection and gaining a thorough understanding of the material qualities and loading conditions.
- Peak Frequency
The peak frequency of AE can be used to differentiate between different types of damage inside materials and structures. It is employed to analyze the frequency distribution characteristics of the signals produced by material damage [62,63]; Figure 9 displays the AE peak frequency band ratio and AE peak frequency distribution for the five damage stages observed during the bending test.
The scatter plot of the AE peak frequency distribution revealed that the AE peak frequency exhibited a pattern of non-continuous interval distribution during the loading process. The AE peak frequencies were mostly divided into six bands: the low-frequency band (5–25 kHz), the upper-low-frequency band (44–65 kHz), the middle-frequency band (157–205 kHz), the upper-middle-frequency band (258–302 kHz), the high-frequency band (336–446 kHz), and other frequency bands. The other frequency bands possess a broad spectrum, encompassing from 1 to over 400 kHz, which is considered negligible.
The peak frequency band ratio for the five phases can be determined by interpreting and identifying the stages indicated in the cumulative ringing count or the cumulative energy graphs. During the initial stages of evolution, the majority of the frequency band ratios are in the low-frequency band, with sensor 1 displaying the greatest value. During the hardening phases, sensor 4 recorded the highest value for the low-frequency band ratio. However, during the critical transition stage, pull-out stage, and failure stage, sensor 3 recorded a distinct ratio in the middle-frequency band. In the final stage, known as the failure stage, sensor 2 detected the highest value for the ratio of middle-frequency bands. It can be inferred that during the initial stage (less than 0.1 F/Fmax) and the hardening stage (from 0.1 to 0.71 F/Fmax), the low-frequency band ratio (44–65 kHz) was observed. However, during the stages that followed from the critical transition stage to the failure stage, the middle-frequency band ratio (157–205 kHz) was observed.
In summary, the variation in the ratio of AE peak frequency bands effectively indicates the distinctive features of the five distinct loading stages in the bending test.
The subsequent statement is made in order to evaluate the extent of damage. A sensor exhibiting a consistent peak frequency range during the loading phases can be regarded as being more stable, indicating that the damage mechanism has not undergone substantial changes with increasing load; meanwhile, an elevation in peak frequency or a transition towards higher frequencies may suggest a shift from less severe forms of damage, such as plastic deformation (often linked to lower frequencies), to more severe forms, such as fracture propagation (linked to higher frequencies). Sensor (1) demonstrates the highest level of stability by consistently maintaining a distribution of lower frequencies throughout the loading stages. Sensor (2) exhibits the most prominent shift towards higher frequencies in the later stages, suggesting a possible deterioration in the damage. This sensor appears to be displaying the most unfavorable condition compared to the rest of the group.
In general, a transition from a lower frequency range (1–25 kHz) to a higher range (40–55 kHz) may indicate a shift in the underlying mechanism causing damage to the material. In broad terms, higher frequencies are linked to more fragile behaviors, such as the spreading of cracks, whereas lower frequencies may be linked to more flexible behaviors or events involving friction. Hence, an increase in frequencies does not usually signify a favorable condition; rather, it implies a move towards more severe damage mechanisms that could potentially jeopardize the integrity of the tested material or structure.
- b-value
b-value analysis is the name given to the method that is utilized to carry out damage assessment, and is becoming increasingly significant. In seismology, b-value analysis is comparable to the phenomenon where events of higher magnitude happen less frequently than events of lower magnitude. The relationship can be explicitly expressed using the formula devised by Gutenberg and Richter [64,65]:
The Richter magnitude of the events is represented by ML, while the number of events with magnitudes within the range ML ± ΔM/2 is represented by N. The empirical constants a and b are utilized in this context:
where AdB represents the maximum amplitude of AE events measured in decibels and can be expressed as:
The b-value represents the slope of the logarithmic-linear graph that compares the magnitude of AE events with their occurrence rate. It has been found that the value changes in different phases of deterioration. As an example, the b-value increases significantly when micro-cracks first show during the initial stages of damage. However, it then decreases to a lesser value as macro-cracks become visible [66]. Consequently, a reduction in the b-value indicates a rise in the frequency of high-amplitude impacts, implying the development of large cracks and substantial damage.
The b-value can be rewritten as follows [57]:
where AdB represents the maximum amplitude of the AE signal in decibels. N indicates the count of AE events with amplitudes over the threshold. The fitting constant is denoted by a, while b represents the slope of the straight line used for fitting.
To analyze the b-value, initially, within the given time duration, the levels of intensity of the b-value data points are analyzed. Subsequently, the fluctuations in the b-value during the loading procedure are examined to discern the stages of structural deterioration.
Despite the efficiency of this method, the b-value still has the following shortcomings:
- It only confronts the peak amplitude of the AE signal and does not consider the energy from the low amplitude part. Consequently, the assessment of structural fracture propagation using this method is not without flaws [67].
- The principle underlying this is the Gutenberg–Richter law, which asserts that the magnitude of acoustic emissions diminishes as damage progresses [68].
- This method may lack effectiveness in accurately discerning the exact attributes of stress waves released from particular sources [69].
- The b-value in reinforced concrete beams reaches its minimum point around the peak load and falls when micro-fractures merge together. However, it may not offer a complete evaluation of the extent of damage [70].
- The amplitude distribution of impacts in rock under stress is not strongly concentrated around a particular value, which can further complicate the application of the b-value method [71].
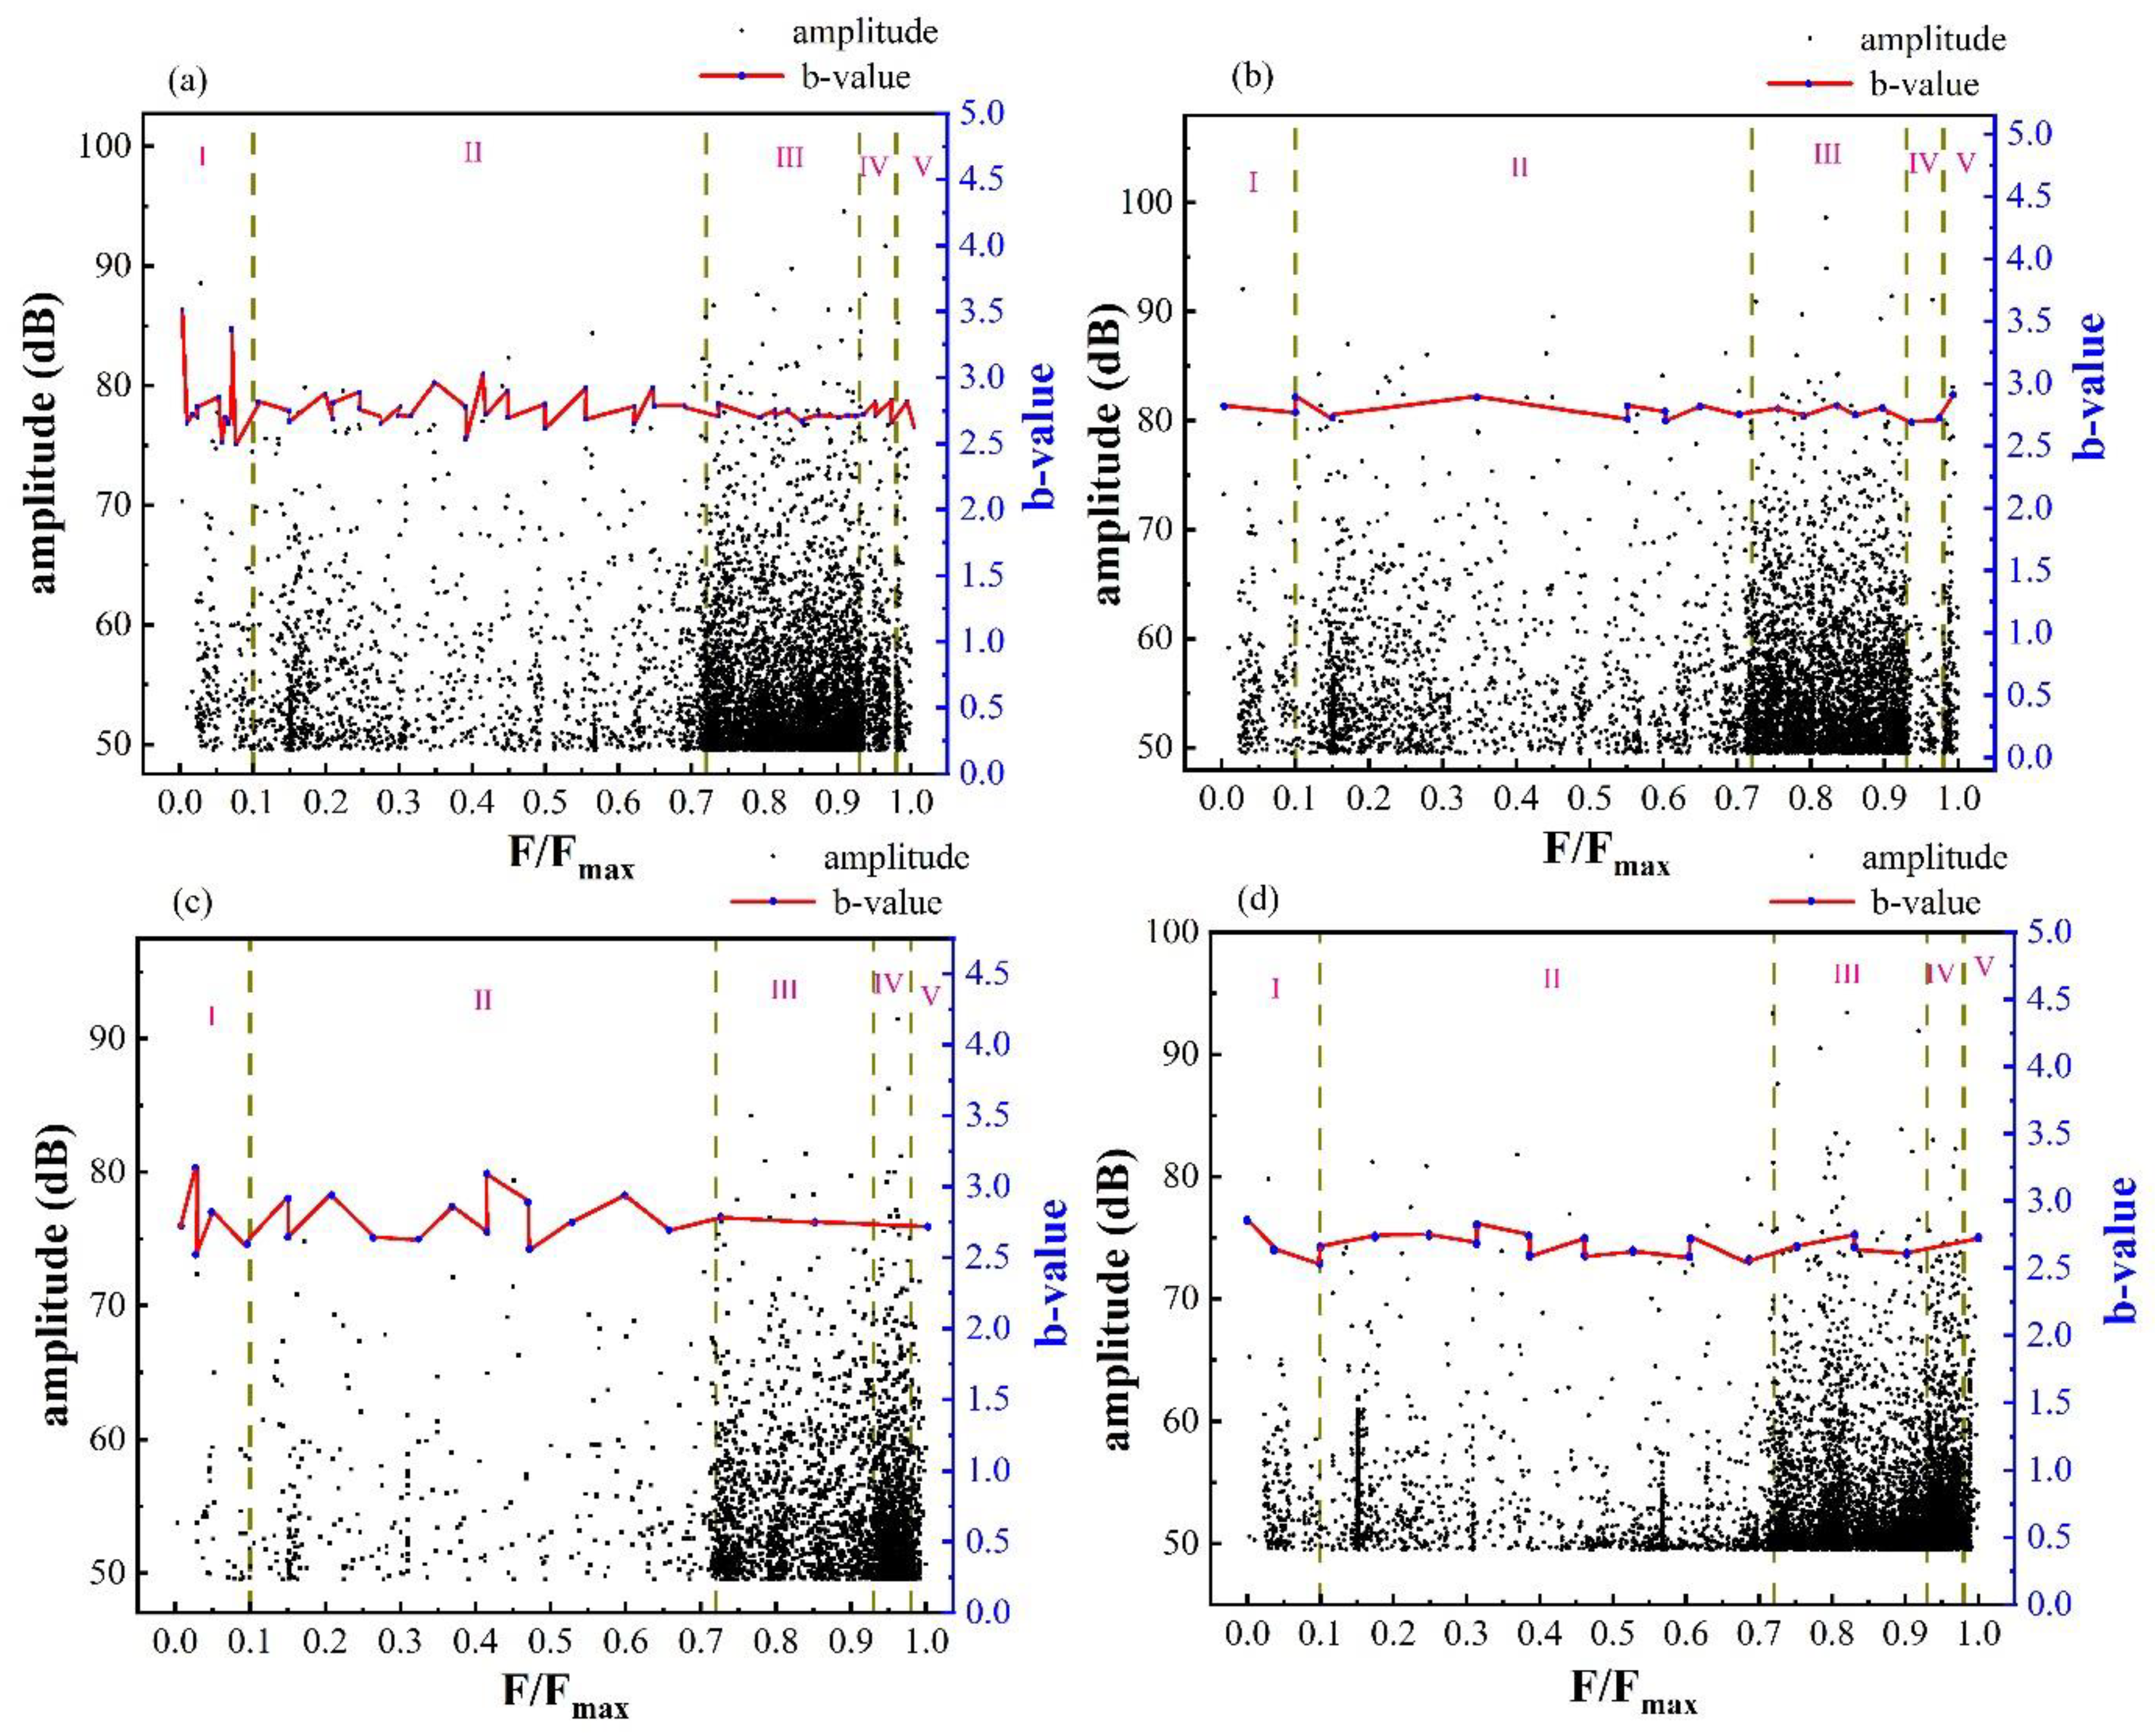
Figure 10 shows the observed b-value quantity for all four sensors. The sensor with the lowest b-value was sensor 3.
During the initial stages of loading, sensor 1 detected the highest b-value with an amplitude exceeding 86 dB. During this phase, the b-values for sensors 1 and 3 exhibited several fluctuations. The b-value for sensor 1 varied from 2.75 to 3.5, whereas for sensor 3, it ranged from 2.6 to 3. These b-values indicate the presence of starting micro-cracks.
During the hardening stage, sensors 1 and 3 exhibited the most adverse b-value scenario, indicating that a smaller amplitude may have a significant proportion. According to Figure 5c, sensor 3 did not capture an adequate amplitude. The cause of this problem remains unclear. Currently, the b-value for sensor 2 is stable, with consistent and consecutive slopes.
During the critical transition stage, sensors 1 and 2 detected the presence of macro-cracks, as evidenced by the drop in slopes. Sensor 3, on the other hand, demonstrated the most stable condition, with slopes remaining reasonably consistent.
During the pull-out stage, sensor 2 exhibited a limited number of amplitude variations, and the slopes remained consistent. In contrast, sensor 1 detected a relative reduction in the b-value and had some macro-cracks. The condition of sensor 3 remained stable as the slope exhibited a modest reduction.
During the failure stage, sensors 2, 3, and 4 exhibited a more stable situation as their slopes grew. In contrast, sensor 1 revealed the presence of macro-cracks as its slopes declined.
To summarize, an upward increase in the slope of the b-value indicates increased brittleness or higher levels of stress concentration in the material, which could be concerning depending on the circumstances. Conversely, a downward decrease in the b-value suggests the presence of defects, cracks, or other discontinuities within the material. It may indicate a shift towards a more diverse material or the existence of areas of stress concentration that facilitate the spreading of cracks.
It can be concluded that in the scatter graph of amplitude versus b-value, if the range of amplitude recorded by the sensors becomes narrower, the b-value stays in a row. If the amplitude recorded by the sensors has a vast dispersion from a large to a small amount, or even vice versa, the b-value would have many fluctuations and slopes that would go upward or downward, even if the number of recorded amplitudes was low.
These conclusions may provide valuable insights to evaluate the extent of the damage:
- A higher b-value indicates a greater number of low-amplitude AE hits relative to high-amplitude ones. This is typically linked to smaller micro-fractures and less serious damage.
- A lower b-value indicates a higher frequency of high-amplitude AE hits, which often correspond to more substantial damage, such as greater cracks or failures.
- A decreasing b-value indicates that the material is transitioning to more severe damage states, with greater AE occurrences becoming more frequent.
- Increasing the b-value indicates a shift towards less severe damage states, with a higher occurrence of mild AE occurrences.
Based on the above-mentioned states, the precise interpretation for all graphs is as follows:
Sensor (1): Stages I–IV have a reasonably constant b-value, indicating a consistent level of damage occurring throughout the test. The minor decreasing trend suggests a slight rise in more substantial damage incidents as the load intensifies.
Sensor (2): There is a significant decrease in the b-value throughout Stage IV, indicating an escalation in severe damage events at increasing loads.
Sensor (3): The b-value exhibits fluctuations but generally shows a modest downward trend, similar to (a), suggesting a progressive rise in more severe damage events leading to failure.
Sensor (4): The b-value exhibits a significant decline, particularly in Stage IV, indicating that the load is approaching its maximum and causing increasingly severe damage.
According to the b-value, sensor (1) appears to exhibit the highest level of stability. This is evident from the rather constant trend of the b-value, indicating a consistent level of damage without any notable increase in major events until extremely high loads. Sensor (4) indicates the most severe damage condition, as indicated by the lower b-value in the latter phases. This suggests a shift towards a state where larger and perhaps more harmful AE events are more common.
4. Conclusions and Discussion
The objective of this study was to examine the reactivity of magnetite when incorporated into a UHPC block and analyze the material’s behavior under various loading conditions. The inclusion of magnetite in the UHPC block serves to augment its endurance and mitigate cracking, which are the primary objectives when incorporating any fiber into UHPC. The precise proportion of magnetite used in this investigation was 20%, with the remaining 80% consisting of river sand, making up the overall volume of the UHPC block. The specific formula and proportioning can be found in Table 1.
AE is a non-destructive test (NDT) that enables the observation of damage in any specimen. This test is predicated on the phenomenon by which high-frequency ultrasonic waves are produced due to the fast discharge of energy within a substance, such as from the beginning and propagation of fractures.
The variation features of AE ringing counts, energy, peak frequency, and b-value were studied with the increase in load to inspect damage stages. The specific results were as follows:
- (1)
- The observation of the five unique stages of loading was made based on the comparison between cumulative ringing count and F/Fmax, or cumulative energy and F/Fmax. Based on their distinctive features, they may be categorized into the following stages: initial stage (pre-cracking), hardening stage, critical transition stage, pull-out stage, and failure stage. Each level possesses a distinct gradient that can serve as a criterion for comprehending the commencement of each stage. The pull-out stage exhibited the greatest slope, indicating a distinct increase in ringing count or energy. During the critical and failure stages, the slopes transitioned from positive values to zero, which are referred to as inflection points. Inflection points are locations that indicate the initiation of cracks or transitional stages, which can be considered a shift from elastic to plastic deformation. Typically, the occurrence of an inflection point before the pull-out stage may indicate the presence of micro-cracks, whereas the pull-out stage and failure stage are indicative of macro-cracks.
- (2)
- Throughout the loading process, the dominant frequencies of AE peaks were primarily found in the low-frequency range (5–25 kHz), the upper-low-frequency range (44–65 kHz), the middle-frequency range (157–205 kHz), the upper-middle-frequency range (258–302 kHz), and the high-frequency range (336–446 kHz). Initially, the dominant frequencies seen for all sensors were in the low-frequency band ratios. Sensors 1 to 3 measured the middle-frequency band ratio during the hardening stage, critical transition stage, and failure stage. Sensor 4 measured the low frequency, specifically during the hardening stage. As previously stated, the failure stage was consistent across all sensors. During the initial stage of loading, the sensors primarily detected low-frequency band ratios. However, for the subsequent loading stages, the sensors recorded medium frequencies.
The peak frequency cannot be considered when evaluating the damage level of the specimen in AE, although surveying the peak frequency will provide the following conditions:
- The presence of a maintained peak frequency range during the loading phases indicates stability in the damage mechanism, suggesting that there have been no significant changes with increasing load. On the contrary, an increase in peak frequency or a shift towards higher frequencies may indicate a transition from less severe forms of damage, such as plastic deformation (typically associated with lower frequencies), to more severe forms, such as fracture propagation (associated with higher frequencies).
- (3)
- The abrupt change in b-value points indicates the shift in the mechanical mechanism throughout different stages of the bending resistance test. The mechanical response of the specimen to withstand shear stress varies at different phases. The variability in b-value measurements can indicate distinct levels of structural deterioration.
To evaluate the damage degree based on the b-value approach, both quantification and slope should be noted.
- A decrease in the b-value indicates an increase in the occurrence of high-amplitude AE hits, which are generally associated with more significant damage, such as larger cracks or failures. Conversely, a higher b-value signifies a larger quantity of low-amplitude AE hits compared to high-amplitude ones. This is commonly associated with few micro-fractures and less severe harm.
- A declining b-value suggests that the material is shifting towards more critical damage states, with an increasing frequency of acoustic emission (AE) events. An increased b-value implies a shift towards less severe damage states, with a greater frequency of mild AE events.
- It should be noted that despite fluctuation and verification of the b-value graph, magnetite is still a durable additive to UHPC, whereas for both the micro-cracking stage and macro-cracking stage, the recorded amplitudes were close together, and black dots of amplitude dispersal demonstrated the lower amplitudes between 60 dB to 70 dB.
- Since magnetite has not been used in any other scientific research when added to UHPC, and there is no adequate research that has observed the damage mechanism of this additive, it is highly suggested that additional research should be conducted to develop new MUHPC blocks with a wide range of additives with different mix ratios in order to understand the damage mechanism and make comprehensive comparisons.
Funding
This research received no external funding.
Institutional Review Board Statement
Not applicable.
Informed Consent Statement
Not applicable.
Data Availability Statement
Readers may reach to the author’s email to have access the data.
Conflicts of Interest
The authors declare no conflicts of interest.
Abbreviations
| UHPC | ultra-high-performance concrete |
| MUHPC | magnetite ultra-high-performance concrete |
| AE | acoustic emission |
| F/Fmax | applied load ratio to the maximum applied load |
References
- Xu, X.; Jin, Z.; Yu, Y.; Li, N. Damage source and its evolution of ultra-high performance concrete monitoring by digital image correlation and acoustic emission technologies. J. Build. Eng. 2023, 65, 105734. [Google Scholar] [CrossRef]
- Zhang, Y.; Li, X.; Zhu, Y.; Shao, X. Experimental study on flexural behavior of damaged reinforced concrete (RC) beam strengthened by toughness-improved ultra-high performance concrete (UHPC) layer. Compos. Part B Eng. 2020, 186, 107834. [Google Scholar] [CrossRef]
- Gu, C.; Ye, G.; Sun, W. Ultrahigh performance concrete-properties, applications and perspectives. Sci. China Technol. Sci. 2015, 58, 587–599. [Google Scholar] [CrossRef]
- Green, B.H.; Moser, R.D.; Scott, D.A.; Long, W.R. Ultra-high performance concrete history and usage by the Corps of Engineers. Adv. Civil. Eng. Mater. 2015, 4, 132–143. [Google Scholar] [CrossRef]
- Resplendino, J.; Toulemonde, F. Designing and Building with UHPFRC; John Wiley & Sons: Hoboken, NJ, USA, 2013. [Google Scholar]
- Aaleti, S.; Sritharan, S. Quantifying bonding characteristics between UHPC and normal-strength concrete for bridge deck application. J. Bridge Eng. 2019, 24, 04019041. [Google Scholar] [CrossRef]
- Tazarv, M.; Saiidi, M.S. Design and construction of UHPC-filled duct connections for precast bridge columns in high seismic zones. Struct. Infrastruct. Eng. 2017, 13, 743–753. [Google Scholar] [CrossRef]
- Tazarv, M.; Saiidi, M.S. UHPC-filled duct connections for accelerated bridge construction of RC columns in high seismic zones. Eng. Struct. 2015, 99, 413–422. [Google Scholar] [CrossRef]
- Perry, V. Ultra-high-performance-concrete advancements and industrialization—The need for standard testing. Adv. Civil. Eng. Mater. 2015, 4, 1–16. [Google Scholar] [CrossRef]
- Luo, D.; Lu, T.; Chen, Y.F. Application of ultra-high-performance concrete in prefabricated buildings. Mater. Test. 2021, 63, 1174–1183. [Google Scholar] [CrossRef]
- Shao, Y.; Billington, S. Utilizing full UHPC compressive strength in steel reinforced UHPC beams. In International Interactive Symposium on Ultra-High Performance Concrete; Iowa State University Digital Press: Ames, IA, USA, 2019. [Google Scholar]
- Yao, Y.; Silva, F.A.; Butler, M.; Mechtcherine, V.; Mobasher, B. Tensile and flexural behavior of ultra-high performance concrete (UHPC) under impact loading. Int. J. Impact Eng. 2021, 153, 103866. [Google Scholar] [CrossRef]
- Muzenski, S.; Graybeal, B. Structural Performance of UHPC Overlays. In International Interactive Symposium on Ultra-High Performance Concrete; Iowa State University Digital Press: Ames, IA, USA, 2023. [Google Scholar]
- Kostelecká, M. Monitoring the Degradation of UHPC Boards. Appl. Mech. Mater. 2015, 752, 518–521. [Google Scholar] [CrossRef]
- Meng, W.; Khayat, K.H. Mechanical properties of ultra-high-performance concrete enhanced with graphite nanoplatelets and carbon nanofibers. Compos. Part B Eng. 2016, 107, 113–122. [Google Scholar] [CrossRef]
- Yu, R.; Spiesz, P.; Brouwers, H. Development of an eco-friendly Ultra-High Performance Concrete (UHPC) with efficient cement and mineral admixtures uses. Cem. Concr. Compos. 2015, 55, 383–394. [Google Scholar] [CrossRef]
- Abdal, S.; Mansour, W.; Agwa, I.; Nasr, M.; Abadel, A.; Özkılıç, Y.O.; Akeed, M.H. Application of ultra-high-performance concrete in bridge engineering: Current status, limitations, challenges, and future prospects. Buildings 2023, 13, 185. [Google Scholar] [CrossRef]
- Shao, R.; Wu, C.; Li, J.; Liu, Z. Development of sustainable steel fibre-reinforced dry ultra-high performance concrete (DUHPC). J. Clean. Prod. 2022, 337, 130507. [Google Scholar] [CrossRef]
- Amran, M.; Huang, S.-S.; Onaizi, A.M.; Makul, N.; Abdelgader, H.S.; Ozbakkaloglu, T. Recent trends in ultra-high performance concrete (UHPC): Current status, challenges, and future prospects. Constr. Build. Mater. 2022, 352, 129029. [Google Scholar] [CrossRef]
- Amran, M.; Murali, G.; Makul, N.; Tang, W.; Alluqmani, A.E. Sustainable development of eco-friendly ultra-high performance concrete (UHPC): Cost, carbon emission, and structural ductility. Constr. Build. Mater. 2023, 398, 132477. [Google Scholar] [CrossRef]
- Sitnikov, V. Ice formwork for high-performance concrete: A model of lean production for prefabricated concrete industry. In Structures; Elsevier: Amsterdam, The Netherlands, 2019. [Google Scholar]
- Ganapathe, L.S.; Mohamed, M.A.; Yunus, R.M.; Berhanuddin, D.D. Magnetite (Fe3O4) nanoparticles in biomedical application: From synthesis to surface functionalisation. Magnetochemistry 2020, 6, 68. [Google Scholar] [CrossRef]
- Belousov, A. Spectrum of application magnetite nanopaticles in medicine. Nanotech 2009, 2, 154–157. [Google Scholar]
- Belousov, A.N. The use of magnetite nanoparticles in applied medicine. In Materials Science Forum; Trans Tech Publications: Stafa-Zurich, Switzerland, 2011. [Google Scholar]
- Nie, Y.M.; Lu, X.L.; Dai, Q.H.; Wang, B. Mineral processing experiment research of low grade magnetite. Adv. Mater. Res. 2013, 641, 448–451. [Google Scholar] [CrossRef]
- Belov, K. On the nature of a low-temperature transition in magnetite. J. Exp. Theor. Phys. C/C Zhurnal Eksperimental’noi I Teor. Fiz. 1996, 83, 1152–1155. [Google Scholar]
- Kasama, T.; Harrison, R.J.; Church, N.S.; Nagao, M.; Feinberg, J.M.; Dunin-Borkowski, R.E. Ferrimagnetic/ferroelastic domain interactions in magnetite below the Verwey transition. Part I: Electron holography and Lorentz microscopy. Phase Transit. 2013, 86, 67–87. [Google Scholar] [CrossRef]
- Švindrych, Z.; Janů, Z.; Kozłowski, A.; Honig, J.M. Low-Temperature Magnetic Anomaly in Magnetite; 2012. Available online: https://journals.aps.org/prb/abstract/10.1103/PhysRevB.86.214406 (accessed on 7 January 2024).
- Kobori, H.; Ohnishi, K.; Sugimura, A.; Taniguchi, T. Reversal magnetoresistance and unusual localized-spin freezing in magnetite sinter made from low size-dispersion hematite nano-particles with high temperature calcination. Phys. Status Solidi C 2006, 3, 4204–4207. [Google Scholar] [CrossRef]
- Han, J.; Xi, Z.; Yu, R.; Guan, J.; Lv, Y.; Li, G. Preparation and comprehensive properties of a high-radiation-shielding UHPC by using magnetite fine aggregate. Materials 2022, 15, 978. [Google Scholar] [CrossRef] [PubMed]
- Yang, Z.; Qsymah, A.; Peng, Y.; Margetts, L.; Sharma, R. 4D characterisation of damage and fracture mechanisms of ultra high performance fibre reinforced concrete by in-situ micro X-Ray computed tomography tests. Cem. Concr. Compos. 2020, 106, 103473. [Google Scholar] [CrossRef]
- Zaki, A.; Chai, H.K.; Aggelis, D.G.; Alver, N. Non-destructive evaluation for corrosion monitoring in concrete: A review and capability of acoustic emission technique. Sensors 2015, 15, 19069–19101. [Google Scholar] [CrossRef] [PubMed]
- Huang, M.; Jiang, L.; Liaw, P.K.; Brooks, C.R.; Seeley, R.; Klarstrom, D.L. Using acoustic emission in fatigue and fracture materials research. JOM 1998, 50, 1–14. [Google Scholar]
- Li, W.; Xu, C.; Ho, S.C.M.; Wang, B.; Song, G. Monitoring concrete deterioration due to reinforcement corrosion by integrating acoustic emission and FBG strain measurements. Sensors 2017, 17, 657. [Google Scholar] [CrossRef] [PubMed]
- Carrasco, Á.; Méndez, F.; Leaman, F.; Vicuña, C.M. Short review of the use of acoustic emissions for detection and monitoring of cracks. Acoust. Aust. 2021, 49, 273–280. [Google Scholar] [CrossRef]
- Ospitia, N.; Korda, E.; Kalteremidou, K.-A.; Lefever, G.; Tsangouri, E.; Aggelis, D.G. Recent developments in acoustic emission for better performance of structural materials. Dev. Built Environ. 2023, 13, 100106. [Google Scholar] [CrossRef]
- Guo, J.-Y.; Wang, J.-Y.; Bian, C. Cyclic tensile behavior of high strain hardening UHPC analyzed by acoustic emission techniques. Constr. Build. Mater. 2021, 267, 121797. [Google Scholar] [CrossRef]
- Wang, J.-Y.; Guo, J.-Y. Damage investigation of ultra high performance concrete under direct tensile test using acoustic emission techniques. Cem. Concr. Compos. 2018, 88, 17–28. [Google Scholar] [CrossRef]
- Bian, C.; Wang, J.-Y.; Guo, J.-Y. Damage mechanism of ultra-high performance fibre reinforced concrete at different stages of direct tensile test based on acoustic emission analysis. Constr. Build. Mater. 2021, 267, 120927. [Google Scholar] [CrossRef]
- Behnia, A.; Chai, H.K.; Shiotani, T. Advanced structural health monitoring of concrete structures with the aid of acoustic emission. Constr. Build. Mater. 2014, 65, 282–302. [Google Scholar] [CrossRef]
- Aggelis, D.; Mpalaskas, A.; Ntalakas, D.; Matikas, T. Effect of wave distortion on acoustic emission characterization of cementitious materials. Constr. Build. Mater. 2012, 35, 183–190. [Google Scholar] [CrossRef]
- Scholey, J.J.; Wilcox, P.D.; Wisnom, M.R.; Friswell, M.I. Quantitative experimental measurements of matrix cracking and delamination using acoustic emission. Compos. Part. A Appl. Sci. Manuf. 2010, 41, 612–623. [Google Scholar] [CrossRef]
- De Groot, P.J.; Wijnen, P.A.; Janssen, R.B. Real-time frequency determination of acoustic emission for different fracture mechanisms in carbon/epoxy composites. Compos. Sci. Technol. 1995, 55, 405–412. [Google Scholar] [CrossRef]
- Unnþórsson, R. Hit detection and determination in AE bursts. In Acoustic Emission-Research and Applications; INTECH: Atyrau, Kazakhstan, 2013; pp. 1–20. [Google Scholar]
- Wu, Y.; Li, S. Damage degree evaluation of masonry using optimized SVM-based acoustic emission monitoring and rate process theory. Measurement 2022, 190, 110729. [Google Scholar] [CrossRef]
- Bahari, N.; Shahidan, S.; Shukri, M.; Zuki, S.S.M.; Norbazlan, M.; Ibrahim, M.; Nazri, F.M. Identifying the crack nature using b-value acoustic emission signal analysis. In Proceedings of the AICCE’19: Transforming the Nation for a Sustainable Tomorrow 4; Springer: Berlin/Heidelberg, Germany, 2020. [Google Scholar]
- Carnì, D.L.; Scuro, C.; Lamonaca, F.; Olivito, R.S.; Grimaldi, D. Damage analysis of concrete structures by means of b-Value Technique. Int. J. Comput. 2017, 16, 82–88. [Google Scholar] [CrossRef]
- Abdul Kudus, S.; Bunnori, N.M.; Mustaffa, N.K.; Jamadin, A. Investigation on acoustic emission parameters due to fatigue damage of concrete beams with variable notched depth. Int. J. Concr. Struct. Mater. 2022, 16, 29. [Google Scholar] [CrossRef]
- Mandal, D.D.; Bentahar, M.; El Mahi, A.; Brouste, A.; El Guerjouma, R.; Montresor, S.; Cartiaux, F.-B. Acoustic Emission Monitoring of Progressive Damage of Reinforced Concrete T-Beams under Four-Point Bending. Materials 2022, 15, 3486. [Google Scholar] [CrossRef] [PubMed]
- Abouhussien, A.A.; Hassan, A.A. The use of acoustic emission intensity analysis for the assessment of cover crack growth in corroded concrete structures. J. Nondestruct. Eval. 2016, 35, 52. [Google Scholar] [CrossRef]
- Grosse, C.U.; Ohtsu, M.; Aggelis, D.G.; Shiotani, T. Acoustic Emission Testing: Basics for Research–Applications in Engineering; Springer Nature: Berlin/Heidelberg, Germany, 2021. [Google Scholar]
- Finlayson, R.D.; Luzio, M.A.; Miller, R.K.; Pollock, A.A. Continuous health monitoring of graphite epoxy motorcases (GEM). In Nondestructive Evaluation and Health Monitoring of Aerospace Materials and Composites II; SPIE: Bellingham, WA, USA, 2003. [Google Scholar]
- Available online: http://www.aesoftland.com/en/intro/intro_36.html (accessed on 25 January 2024).
- Poon, H. Applications of data acquisition systems. Comput. Ind. 1989, 13, 49–59. [Google Scholar] [CrossRef]
- Willis, R.R. DAS: An automated system to support design analysis. In Proceedings of the 15th Design Automation Conference, Las Vegas, NV, USA, 19–21 June 1978; IEEE: Piscataway, NJ, USA, 1978. [Google Scholar]
- Zhao, T.; Tang, J.; Chen, X. A data acquisition system in intelligent environmental monitoring device for industrial field. In IOP Conference Series: Earth and Environmental Science; IOP Publishing: Bristol, UK, 2018. [Google Scholar]
- Li, S.-L.; Kang, Z.-Z.; Wu, G.-M.; Guo, P.; Gu, S. Acoustic emission-based transition monitoring of mechanical mechanism for bolted shear connection in GFRP–UHPC hybrid beams. Measurement 2022, 198, 111358. [Google Scholar] [CrossRef]
- Li, S.; Liang, Z.; Zhang, L. Corrosion evaluation of prestressed high-strength steel wires with impressed current cathodic protection based on acoustic emission technique. Struct. Control. Health Monit. 2022, 29, e2934. [Google Scholar] [CrossRef]
- Kageyama, K.; Kojima, K.; Nakamura, T. Ae measurement approach for activity monitoring of foliage plants. In Proceedings of the 2017 IEEE 6th Global Conference on Consumer Electronics (GCCE), Nagoya, Japan, 24–27 October 2017; IEEE: Piscataway, NJ, USA, 2017. [Google Scholar]
- Chen, Y.; Zhao, Z. Correlation between shear induced asperity degradation and acoustic emission energy in single granite fracture. Eng. Fract. Mech. 2020, 235, 107184. [Google Scholar] [CrossRef]
- Aldahdooh, M.; Bunnori, N.M.; Johari, M.M. Damage evaluation of reinforced concrete beams with varying thickness using the acoustic emission technique. Constr. Build. Mater. 2013, 44, 812–821. [Google Scholar] [CrossRef]
- Li, S.; Zhang, L.; Guo, P.; Zhang, P.; Wang, C.; Sun, W.; Han, S. Characteristic analysis of acoustic emission monitoring parameters for crack propagation in UHPC-NC composite beam under bending test. Constr. Build. Mater. 2021, 278, 122401. [Google Scholar] [CrossRef]
- McCrory, J.P.; Al-Jumaili, S.K.; Crivelli, D.; Pearson, M.R.; Eaton, M.J.; Featherston, C.A.; Guagliano, M.; Holford, K.M.; Pullin, R. Damage classification in carbon fibre composites using acoustic emission: A comparison of three techniques. Compos. Part. B Eng. 2015, 68, 424–430. [Google Scholar] [CrossRef]
- Sharon, M.; Kurzon, I.; Wetzler, N.; Sagy, A.; Marco, S.; Ben-Avraham, Z. Variations of the seismic b-value along the Dead Sea transform. Front. Earth Sci. 2022, 10, 1074729. [Google Scholar] [CrossRef]
- Carpinteri, A.; Lacidogna, G.; Niccolini, G. Critical behaviour in concrete structures and damage localization by acoustic emission. Key Eng. Mater. 2006, 312, 305–310. [Google Scholar] [CrossRef]
- Ulmer, K.; Green, R.; Rodriguez-Marek, A. Recommended b-value for computing number of equivalent stress cycles and magnitude scaling factors for simplified liquefaction triggering evaluation procedures. J. Geotech. Geoenvironmental Eng. 2022, 148, 04022113. [Google Scholar] [CrossRef]
- Zhang, X.; Shan, W.; Zhang, Z.; Li, B. AE monitoring of reinforced concrete squat wall subjected to cyclic loading with information entropy-based analysis. Eng. Struct. 2018, 165, 359–367. [Google Scholar] [CrossRef]
- Iturrioz, I.; Lacidogna, G.; Carpinteri, A. Acoustic Emission Detection in Concrete Specimens: Experimental Analysis and Simulations by a lattice model. Int. J. Damage Mech. 2014, 23, 327–358. [Google Scholar] [CrossRef]
- Green, R.E.J. Acoustic emission source identification. J. Acoust. Soc. Am. 1980, 68, S103. [Google Scholar] [CrossRef]
- Vidya Sagar, R.; Prasad, B.R.; Kumar, S.S. Comparison of acoustic emission b-values with strains in reinforced concrete beams for damage evaluation. In Proceedings of the Institution of Civil Engineers—Bridge Engineering; Thomas Telford Ltd.: London, UK, 2012. [Google Scholar]
- Liu, X.-l.; Li, X.-b.; Hong, L.; Yin, T.-b.; Rao, M. Acoustic emission characteristics of rock under impact loading. J. Cent. South. Univ. 2015, 22, 3571–3577. [Google Scholar] [CrossRef]
Figure 1.
Bending test for UHPC block with mounting acoustic emission sensors.

Figure 2.
AE sensor piezoelectric element [51].
Figure 2.
AE sensor piezoelectric element [51].

Figure 3.
DS5-16B AE System.

Figure 4.
Typical AE signals and schematically recovered AE characteristics [57].
Figure 4.
Typical AE signals and schematically recovered AE characteristics [57].
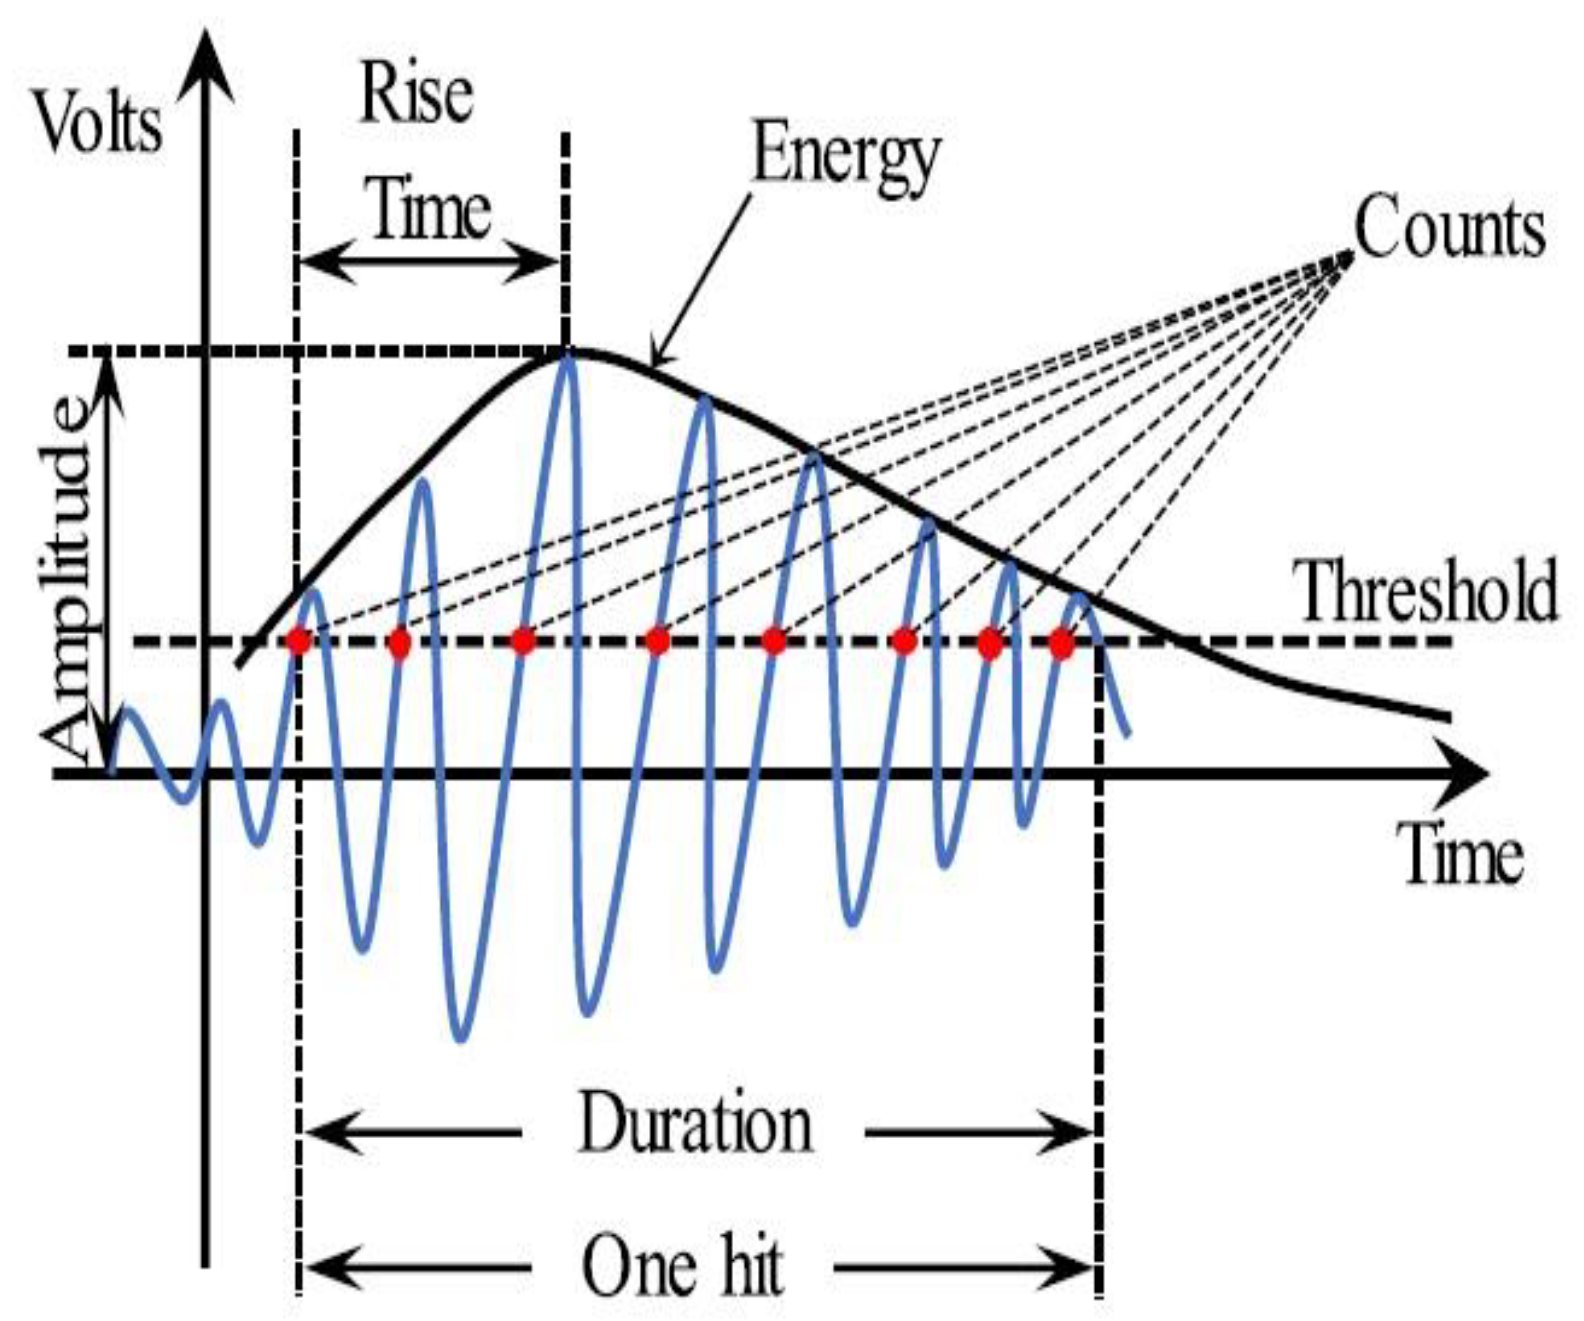
Figure 5.
Amplitude–time domain: (a) sensor 1, (b) sensor 2, (c) sensor 3, (d) sensor 4.

Figure 6.
Amplitude–frequency domain (sensor 1).

Figure 7.
Ringing count vs. F/Fmax vs. cumulative ringing count: (a) AE sensor 1, (b) AE sensor 2, (c) AE sensor 3, and (d) AE sensor 4.
Figure 7.
Ringing count vs. F/Fmax vs. cumulative ringing count: (a) AE sensor 1, (b) AE sensor 2, (c) AE sensor 3, and (d) AE sensor 4.

Figure 8.
Energy vs. F/Fmax vs. Cumulative Energy: (a) AE sensor 1, (b) AE sensor-2, (c) AE sensor 3, and (d) AE sensor 4.
Figure 8.
Energy vs. F/Fmax vs. Cumulative Energy: (a) AE sensor 1, (b) AE sensor-2, (c) AE sensor 3, and (d) AE sensor 4.

Figure 9.
Peak frequency: (a) AE sensor 1, (b) AE sensor 2, (c) AE sensor 3, and (d) AE sensor 4.

Figure 10.
Variation characteristics of b-value and amplitude of AE signal with relative load: (a) AE sensor 1, (b) AE sensor 2, (c) AE sensor 3, (d) AE sensor 4.
Figure 10.
Variation characteristics of b-value and amplitude of AE signal with relative load: (a) AE sensor 1, (b) AE sensor 2, (c) AE sensor 3, (d) AE sensor 4.

Table 1.
Composition and mix ratio of MUHPC (kg/m3).
| Item | Silica Fume | Cement | Fly Ash | River Sand/mm | Magnetite/mm | Water | Water Reducer | Steel Fiber | ||
|---|---|---|---|---|---|---|---|---|---|---|
| 0–0.6 | 0.6–1.18 | 0–0.6 | 0.6–1.18 | |||||||
| R20 | 101 | 803 | 181 | 574 | 210 | 287 | 105 | 206 | 30 | 156 |
Note: R20 represents 20% magnetite for the UHPC block mix ratio while including 80% ordinary river sand.
Table 2.
RS-2A specification [53].
Table 2.
RS-2A specification [53].
| Type | Diameter | Height | Port | Shell Material | Contact Surface Material | Frequency Range | Center Frequency | Temperature |
|---|---|---|---|---|---|---|---|---|
| RS-2A | 18.8 mm | 15 mm | M5-KY | Stainless Steel | Ceramics | 50–400 KHz | 150 KHz | −20~130 °C |
Table 3.
The slope of cumulative ringing count for the distinct loading stage (20% replacement of magnetite).
Table 3.
The slope of cumulative ringing count for the distinct loading stage (20% replacement of magnetite).
| Sensor 1 | Sensor 2 | Sensor 3 | Sensor 4 | |
|---|---|---|---|---|
| Initial Stage (Pre-Cracking) | 0.11 | 0.13 | 0.02 | 0.02 |
| Hardening Stage | 0.09 | 0.14 | 0.03 | 0.04 |
| Critical Transition stage | 1.67 | 2.13 | 0.5 | 0.85 |
| Pull-Out stage | 11.3 | 10.7 | 3.09 | 5.7 |
| Failure stage | 0.86 | 0.66 | 0.21 | 0.14 |
Table 4.
The slope of cumulative energy for the distinct loading stage (20% replacement of magnetite).
Table 4.
The slope of cumulative energy for the distinct loading stage (20% replacement of magnetite).
| Sensor 1 | Sensor 2 | Sensor 3 | Sensor 4 | |
|---|---|---|---|---|
| Initial Stage (Pre-Cracking) | 0.05 | 0 | 0.56 | 0.38 |
| Hardening Stage | 0.03 | 0.87 | 1.16 | 0.37 |
| Critical Transition stage | 0.4 | 4.05 | 7.70 | 2.13 |
| Pull-Out stage | 5.34 | 6.61 | 0.71 | 2.05 |
| Failure stage | 0.23 | 0.17 | 0.01 | 0.15 |
Disclaimer/Publisher’s Note: The statements, opinions and data contained in all publications are solely those of the individual author(s) and contributor(s) and not of MDPI and/or the editor(s). MDPI and/or the editor(s) disclaim responsibility for any injury to people or property resulting from any ideas, methods, instructions or products referred to in the content. |
© 2024 by the author. Licensee MDPI, Basel, Switzerland. This article is an open access article distributed under the terms and conditions of the Creative Commons Attribution (CC BY) license (https://creativecommons.org/licenses/by/4.0/).
Share and Cite
MDPI and ACS Style
Bourbour, C. Acoustic Emission Monitoring for Damage Assessment of a Magnetite Ultra-High-Performance Concrete (MUHPC) Block in a Bending Test. NDT 2024, 2, 87-107. https://doi.org/10.3390/ndt2020006
AMA Style
Bourbour C. Acoustic Emission Monitoring for Damage Assessment of a Magnetite Ultra-High-Performance Concrete (MUHPC) Block in a Bending Test. NDT. 2024; 2(2):87-107. https://doi.org/10.3390/ndt2020006
Chicago/Turabian StyleBourbour, Cyrus. 2024. "Acoustic Emission Monitoring for Damage Assessment of a Magnetite Ultra-High-Performance Concrete (MUHPC) Block in a Bending Test" NDT 2, no. 2: 87-107. https://doi.org/10.3390/ndt2020006