Journal Description
Analytics
Analytics
is an international, peer-reviewed, open access journal on methodologies, technologies, and applications of analytics, published quarterly online by MDPI.
- Open Access— free for readers, with article processing charges (APC) paid by authors or their institutions.
- Rapid Publication: manuscripts are peer-reviewed and a first decision is provided to authors approximately 21.2 days after submission; acceptance to publication is undertaken in 5.5 days (median values for papers published in this journal in the second half of 2023).
- Recognition of Reviewers: APC discount vouchers, optional signed peer review, and reviewer names published annually in the journal.
- Analytics is a companion journal of Mathematics.
Latest Articles
Beyond the ROC Curve: The IMCP Curve
Analytics 2024, 3(2), 221-224; https://doi.org/10.3390/analytics3020012 - 27 May 2024
Abstract
►
Show Figures
The ROC curve [...]
Full article
Open AccessArticle
Interconnected Markets: Unveiling Volatility Spillovers in Commodities and Energy Markets through BEKK-GARCH Modelling
by
Tetiana Paientko and Stanley Amakude
Analytics 2024, 3(2), 194-220; https://doi.org/10.3390/analytics3020011 - 16 Apr 2024
Abstract
Food commodities and energy bills have experienced rapid undulating movements and hikes globally in recent times. This spurred this study to examine the possibility that the shocks that arise from fluctuations of one market spill over to the other and to determine how
[...] Read more.
Food commodities and energy bills have experienced rapid undulating movements and hikes globally in recent times. This spurred this study to examine the possibility that the shocks that arise from fluctuations of one market spill over to the other and to determine how time-varying the spillovers were across a time. Data were daily frequency (prices of grains and energy products) from 1 July 2019 to 31 December 2022, as quoted in markets. The choice of the period was to capture the COVID pandemic and the Russian–Ukrainian war as events that could impact volatility. The returns were duly calculated using spreadsheets and subjected to ADF stationarity, co-integration, and the full BEKK-GARCH estimation. The results revealed a prolonged association between returns in the energy markets and food commodity market returns. Both markets were found to have volatility persistence individually, and time-varying bidirectional transmission of volatility across the markets was found. No lagged-effects spillover was found from one market to the other. The findings confirm that shocks that emanate from fluctuations in energy markets are impactful on the volatility of prices in food commodity markets and vice versa, but this impact occurs immediately after the shocks arise or on the same day such variation occurs.
Full article
(This article belongs to the Special Issue Business Analytics and Applications)
►▼
Show Figures
Figure 1
Open AccessArticle
Learner Engagement and Demographic Influences in Brazilian Massive Open Online Courses: Aprenda Mais Platform Case Study
by
Júlia Marques Carvalho da Silva, Gabriela Hahn Pedroso, Augusto Basso Veber and Úrsula Gomes Rosa Maruyama
Analytics 2024, 3(2), 178-193; https://doi.org/10.3390/analytics3020010 - 3 Apr 2024
Abstract
This paper explores the dynamics of student engagement and demographic influences in Massive Open Online Courses (MOOCs). The study analyzes multiple facets of Brazilian MOOC participation, including re-enrollment patterns, course completion rates, and the impact of demographic characteristics on learning outcomes. Using survey
[...] Read more.
This paper explores the dynamics of student engagement and demographic influences in Massive Open Online Courses (MOOCs). The study analyzes multiple facets of Brazilian MOOC participation, including re-enrollment patterns, course completion rates, and the impact of demographic characteristics on learning outcomes. Using survey data and statistical analyses from the public Aprenda Mais Platform, this study reveals that MOOC learners exhibit a strong tendency toward continuous learning, with a majority re-enrolling in subsequent courses within a short timeframe. The average completion rate across courses is around 42.14%, with learners maintaining consistent academic performance. Demographic factors, notably, race/color and disability, are found to influence enrollment and completion rates, underscoring the importance of inclusive educational practices. Geographical location impacts students’ decision to enroll in and complete courses, highlighting the necessity for region-specific educational strategies. The research concludes that a diverse array of factors, including content interest, personal motivation, and demographic attributes, shape student engagement in MOOCs. These insights are vital for educators and course designers in creating effective, inclusive, and engaging online learning experiences.
Full article
(This article belongs to the Special Issue New Insights in Learning Analytics)
►▼
Show Figures
Figure 1
Open AccessArticle
Optimal Matching with Matching Priority
by
Massimo Cannas and Emiliano Sironi
Analytics 2024, 3(1), 165-177; https://doi.org/10.3390/analytics3010009 - 19 Mar 2024
Abstract
►▼
Show Figures
Matching algorithms are commonly used to build comparable subsets (matchings) in observational studies. When a complete matching is not possible, some units must necessarily be excluded from the final matching. This may bias the final estimates comparing the two populations, and thus it
[...] Read more.
Matching algorithms are commonly used to build comparable subsets (matchings) in observational studies. When a complete matching is not possible, some units must necessarily be excluded from the final matching. This may bias the final estimates comparing the two populations, and thus it is important to reduce the number of drops to avoid unsatisfactory results. Greedy matching algorithms may not reach the maximum matching size, thus dropping more units than necessary. Optimal matching algorithms do ensure a maximum matching size, but they implicitly assume that all units have the same matching priority. In this paper, we propose a matching strategy which is order optimal in the sense that it finds a maximum matching size which is consistent with a given matching priority. The strategy is based on an order-optimal matching algorithm originally proposed in connection with assignment problems by D. Gale. When a matching priority is given, the algorithm ensures that the discarded units have the lowest possible matching priority. We discuss the algorithm’s complexity and its relation with classic optimal matching. We illustrate its use with a problem in a case study concerning a comparison of female and male executives and a simulation.
Full article
Figure 1
Open AccessFeature PaperReview
Artificial Intelligence and Sustainability—A Review
by
Rachit Dhiman, Sofia Miteff, Yuancheng Wang, Shih-Chi Ma, Ramila Amirikas and Benjamin Fabian
Analytics 2024, 3(1), 140-164; https://doi.org/10.3390/analytics3010008 - 1 Mar 2024
Abstract
In recent decades, artificial intelligence has undergone transformative advancements, reshaping diverse sectors such as healthcare, transport, agriculture, energy, and the media. Despite the enthusiasm surrounding AI’s potential, concerns persist about its potential negative impacts, including substantial energy consumption and ethical challenges. This paper
[...] Read more.
In recent decades, artificial intelligence has undergone transformative advancements, reshaping diverse sectors such as healthcare, transport, agriculture, energy, and the media. Despite the enthusiasm surrounding AI’s potential, concerns persist about its potential negative impacts, including substantial energy consumption and ethical challenges. This paper critically reviews the evolving landscape of AI sustainability, addressing economic, social, and environmental dimensions. The literature is systematically categorized into “Sustainability of AI” and “AI for Sustainability”, revealing a balanced perspective between the two. The study also identifies a notable trend towards holistic approaches, with a surge in publications and empirical studies since 2019, signaling the field’s maturity. Future research directions emphasize delving into the relatively under-explored economic dimension, aligning with the United Nations’ Sustainable Development Goals (SDGs), and addressing stakeholders’ influence.
Full article
(This article belongs to the Special Issue Business Analytics and Applications)
►▼
Show Figures
Figure 1
Open AccessArticle
Visual Analytics for Robust Investigations of Placental Aquaporin Gene Expression in Response to Maternal SARS-CoV-2 Infection
by
Raphael D. Isokpehi, Amos O. Abioye, Rickeisha S. Hamilton, Jasmin C. Fryer, Antoinesha L. Hollman, Antoinette M. Destefano, Kehinde B. Ezekiel, Tyrese L. Taylor, Shawna F. Brooks, Matilda O. Johnson, Olubukola Smile, Shirma Ramroop-Butts, Angela U. Makolo and Albert G. Hayward II
Analytics 2024, 3(1), 116-139; https://doi.org/10.3390/analytics3010007 - 5 Feb 2024
Abstract
The human placenta is a multifunctional, disc-shaped temporary fetal organ that develops in the uterus during pregnancy, connecting the mother and the fetus. The availability of large-scale datasets on the gene expression of placental cell types and scholarly articles documenting adverse pregnancy outcomes
[...] Read more.
The human placenta is a multifunctional, disc-shaped temporary fetal organ that develops in the uterus during pregnancy, connecting the mother and the fetus. The availability of large-scale datasets on the gene expression of placental cell types and scholarly articles documenting adverse pregnancy outcomes from maternal infection warrants the use of computational resources to aid in knowledge generation from disparate data sources. Using maternal Severe Acute Respiratory Syndrome Coronavirus 2 (SARS-CoV-2) infection as a case study in microbial infection, we constructed integrated datasets and implemented visual analytics resources to facilitate robust investigations of placental gene expression data in the dimensions of flow, curation, and analytics. The visual analytics resources and associated datasets can support a greater understanding of SARS-CoV-2-induced changes to the human placental expression levels of 18,882 protein-coding genes and at least 1233 human gene groups/families. We focus this report on the human aquaporin gene family that encodes small integral membrane proteins initially studied for their roles in water transport across cell membranes. Aquaporin-9 (AQP9) was the only aquaporin downregulated in term placental villi from SARS-CoV-2-positive mothers. Previous studies have found that (1) oxygen signaling modulates placental development; (2) oxygen tension could modulate AQP9 expression in the human placenta; and (3) SARS-CoV-2 can disrupt the formation of oxygen-carrying red blood cells in the placenta. Thus, future research could be performed on microbial infection-induced changes to (1) the placental hematopoietic stem and progenitor cells; and (2) placental expression of human aquaporin genes, especially AQP9.
Full article
(This article belongs to the Special Issue Visual Analytics: Techniques and Applications)
►▼
Show Figures
Figure 1
Open AccessArticle
Interoperable Information Flow as Enabler for Efficient Predictive Maintenance
by
Marco Franke, Quan Deng, Zisis Kyroudis, Maria Psarodimou, Jovana Milenkovic, Ioannis Meintanis, Dimitris Lokas, Stefano Borgia and Klaus-Dieter Thoben
Analytics 2024, 3(1), 84-115; https://doi.org/10.3390/analytics3010006 - 1 Feb 2024
Abstract
►▼
Show Figures
Industry 4.0 enables the modernisation of machines and opens up the digitalisation of processes in the manufacturing industry. As a result, these machines are ready for predictive maintenance as part of Industry 4.0 services. The benefit of predictive maintenance is that it can
[...] Read more.
Industry 4.0 enables the modernisation of machines and opens up the digitalisation of processes in the manufacturing industry. As a result, these machines are ready for predictive maintenance as part of Industry 4.0 services. The benefit of predictive maintenance is that it can significantly extend the life of machines. The integration of predictive maintenance into existing production environments faces challenges in terms of data understanding and data preparation for machines and legacy systems. Current AI frameworks lack adequate support for the ongoing task of data integration. In this context, adequate support means that the data analyst does not need to know the technical background of the pilot’s data sources in terms of data formats and schemas. It should be possible to perform data analyses without knowing the characteristics of the pilot’s specific data sources. The aim is to achieve a seamless integration of data as information for predictive maintenance. For this purpose, the developed data-sharing infrastructure enables automatic data acquisition and data integration for AI frameworks using interoperability methods. The evaluation, based on two pilot projects, shows that the step of data understanding and data preparation for predictive maintenance is simplified and that the solution is applicable for new pilot projects.
Full article
Figure 1
Open AccessArticle
Analysing the Influence of Macroeconomic Factors on Credit Risk in the UK Banking Sector
by
Hemlata Sharma, Aparna Andhalkar, Oluwaseun Ajao and Bayode Ogunleye
Analytics 2024, 3(1), 63-83; https://doi.org/10.3390/analytics3010005 - 26 Jan 2024
Abstract
►▼
Show Figures
Macroeconomic factors have a critical impact on banking credit risk, which cannot be directly controlled by banks, and therefore, there is a need for an early credit risk warning system based on the macroeconomy. By comparing different predictive models (traditional statistical and machine
[...] Read more.
Macroeconomic factors have a critical impact on banking credit risk, which cannot be directly controlled by banks, and therefore, there is a need for an early credit risk warning system based on the macroeconomy. By comparing different predictive models (traditional statistical and machine learning algorithms), this study aims to examine the macroeconomic determinants’ impact on the UK banking credit risk and assess the most accurate credit risk estimate using predictive analytics. This study found that the variance-based multi-split decision tree algorithm is the most precise predictive model with interpretable, reliable, and robust results. Our model performance achieved 95% accuracy and evidenced that unemployment and inflation rate are significant credit risk predictors in the UK banking context. Our findings provided valuable insights such as a positive association between credit risk and inflation, the unemployment rate, and national savings, as well as a negative relationship between credit risk and national debt, total trade deficit, and national income. In addition, we empirically showed the relationship between national savings and non-performing loans, thus proving the “paradox of thrift”. These findings benefit the credit risk management team in monitoring the macroeconomic factors’ thresholds and implementing critical reforms to mitigate credit risk.
Full article
Figure 1
Open AccessArticle
Code Plagiarism Checking Function and Its Application for Code Writing Problem in Java Programming Learning Assistant System
by
Ei Ei Htet, Khaing Hsu Wai, Soe Thandar Aung, Nobuo Funabiki, Xiqin Lu, Htoo Htoo Sandi Kyaw and Wen-Chung Kao
Analytics 2024, 3(1), 46-62; https://doi.org/10.3390/analytics3010004 - 17 Jan 2024
Abstract
A web-based Java programming learning assistant system (JPLAS) has been developed for novice students to study Java programming by themselves while enhancing code reading and code writing skills. One type of the implemented exercise problem is code writing problem (CWP), which asks
[...] Read more.
A web-based Java programming learning assistant system (JPLAS) has been developed for novice students to study Java programming by themselves while enhancing code reading and code writing skills. One type of the implemented exercise problem is 
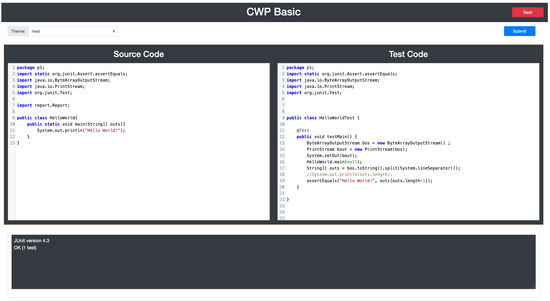
code writing problem (CWP), which asks students to create a source code that can pass the given test code. The correctness of this answer code is validated by running them on JUnit. In previous works, a Python-based 
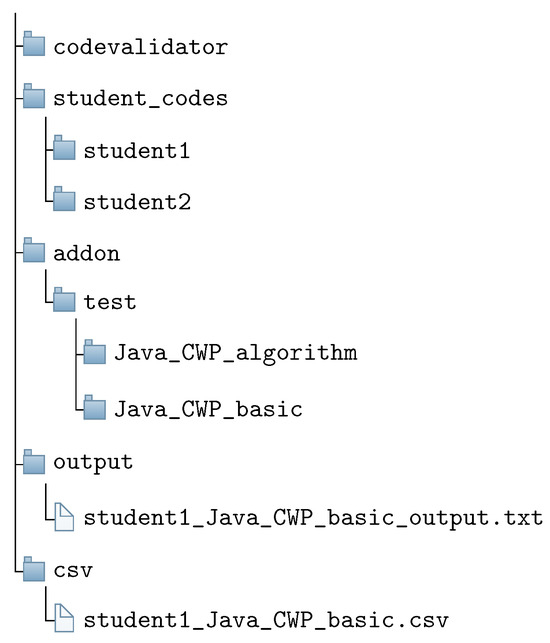
answer code validation program was implemented to assist teachers. It automatically verifies the source codes from all the students for one test code, and reports the number of passed test cases by each code in the CSV file. While this program plays a crucial role in checking the correctness of code behaviors, it cannot detect code plagiarism that can often happen in programming courses. In this paper, we implement a code plagiarism checking function in the answer code validation program, and present its application results to a Java programming course at Okayama University, Japan. This function first removes the whitespace characters and the comments using the regular expressions. Next, it calculates the Levenshtein distance and 
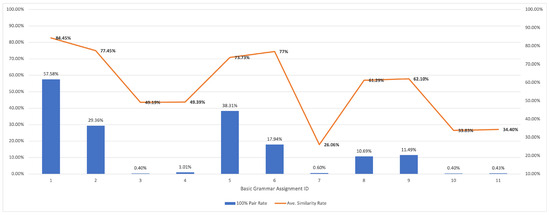
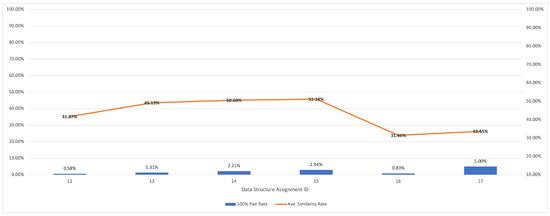
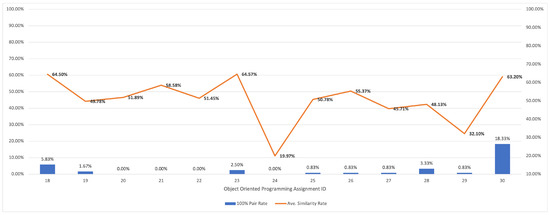
similarity score for each pair of source codes from different students in the class. If the score is larger than a given threshold, they are regarded as 
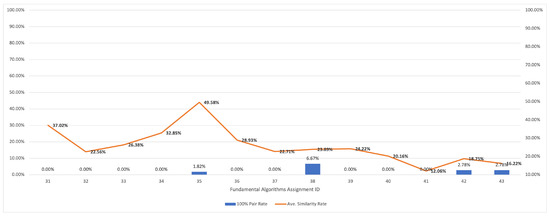
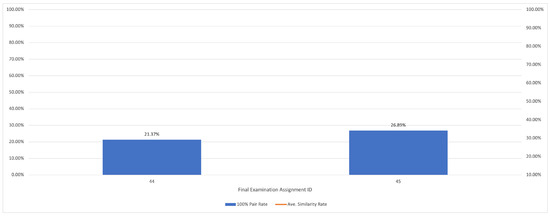
plagiarism. Finally, it outputs the scores as a CSV file with the student IDs. For evaluations, we applied the proposed function to a total of 877 source codes for 45 CWP assignments submitted from 9 to 39 students and analyzed the results. It was found that (1) CWP assignments asking for shorter source codes generate higher scores than those for longer codes due to the use of test codes, (2) proper thresholds are different by assignments, and (3) some students often copied source codes from certain students.
Full article
(This article belongs to the Special Issue New Insights in Learning Analytics)
►▼
Show Figures
Figure 1
Open AccessArticle
An Optimal House Price Prediction Algorithm: XGBoost
by
Hemlata Sharma, Hitesh Harsora and Bayode Ogunleye
Analytics 2024, 3(1), 30-45; https://doi.org/10.3390/analytics3010003 - 2 Jan 2024
Abstract
►▼
Show Figures
An accurate prediction of house prices is a fundamental requirement for various sectors, including real estate and mortgage lending. It is widely recognized that a property’s value is not solely determined by its physical attributes but is significantly influenced by its surrounding neighborhood.
[...] Read more.
An accurate prediction of house prices is a fundamental requirement for various sectors, including real estate and mortgage lending. It is widely recognized that a property’s value is not solely determined by its physical attributes but is significantly influenced by its surrounding neighborhood. Meeting the diverse housing needs of individuals while balancing budget constraints is a primary concern for real estate developers. To this end, we addressed the house price prediction problem as a regression task and thus employed various machine learning (ML) techniques capable of expressing the significance of independent variables. We made use of the housing dataset of Ames City in Iowa, USA to compare XGBoost, support vector regressor, random forest regressor, multilayer perceptron, and multiple linear regression algorithms for house price prediction. Afterwards, we identified the key factors that influence housing costs. Our results show that XGBoost is the best performing model for house price prediction. Our findings present valuable insights and tools for stakeholders, facilitating more accurate property price estimates and, in turn, enabling more informed decision making to meet the housing needs of diverse populations while considering budget constraints.
Full article
Figure 1
Open AccessArticle
Exploring Infant Physical Activity Using a Population-Based Network Analysis Approach
by
Rama Krishna Thelagathoti, Priyanka Chaudhary, Brian Knarr, Michaela Schenkelberg, Hesham H. Ali and Danae Dinkel
Analytics 2024, 3(1), 14-29; https://doi.org/10.3390/analytics3010002 - 31 Dec 2023
Abstract
Background: Physical activity (PA) is an important aspect of infant development and has been shown to have long-term effects on health and well-being. Accurate analysis of infant PA is crucial for understanding their physical development, monitoring health and wellness, as well as identifying
[...] Read more.
Background: Physical activity (PA) is an important aspect of infant development and has been shown to have long-term effects on health and well-being. Accurate analysis of infant PA is crucial for understanding their physical development, monitoring health and wellness, as well as identifying areas for improvement. However, individual analysis of infant PA can be challenging and often leads to biased results due to an infant’s inability to self-report and constantly changing posture and movement. This manuscript explores a population-based network analysis approach to study infants’ PA. The network analysis approach allows us to draw conclusions that are generalizable to the entire population and to identify trends and patterns in PA levels. Methods: This study aims to analyze the PA of infants aged 6–15 months using accelerometer data. A total of 20 infants from different types of childcare settings were recruited, including home-based and center-based care. Each infant wore an accelerometer for four days (2 weekdays, 2 weekend days). Data were analyzed using a network analysis approach, exploring the relationship between PA and various demographic and social factors. Results: The results showed that infants in center-based care have significantly higher levels of PA than those in home-based care. Moreover, the ankle acceleration was much higher than the waist acceleration, and activity patterns differed on weekdays and weekends. Conclusions: This study highlights the need for further research to explore the factors contributing to disparities in PA levels among infants in different childcare settings. Additionally, there is a need to develop effective strategies to promote PA among infants, considering the findings from the network analysis approach. Such efforts can contribute to enhancing infant health and well-being through targeted interventions aimed at increasing PA levels.
Full article
(This article belongs to the Special Issue Feature Papers in Analytics)
►▼
Show Figures
Figure 1
Open AccessArticle
Does Part of Speech Have an Influence on Cyberbullying Detection?
by
Jingxiu Huang, Ruofei Ding, Yunxiang Zheng, Xiaomin Wu, Shumin Chen and Xiunan Jin
Analytics 2024, 3(1), 1-13; https://doi.org/10.3390/analytics3010001 - 21 Dec 2023
Abstract
►▼
Show Figures
With the development of the Internet, the issue of cyberbullying on social media has gained significant attention. Cyberbullying is often expressed in text. Methods of identifying such text via machine learning have been growing, most of which rely on the extraction of part-of-speech
[...] Read more.
With the development of the Internet, the issue of cyberbullying on social media has gained significant attention. Cyberbullying is often expressed in text. Methods of identifying such text via machine learning have been growing, most of which rely on the extraction of part-of-speech (POS) tags to improve their performance. However, the current study only arbitrarily used part-of-speech labels that it considered reasonable, without investigating whether the chosen part-of-speech labels can better enhance the effectiveness of the cyberbullying detection task. In other words, the effectiveness of different part-of-speech labels in the automatic cyberbullying detection task was not proven. This study aimed to investigate the part of speech in statements related to cyberbullying and explore how three classification models (random forest, naïve Bayes, and support vector machine) are sensitive to parts of speech in detecting cyberbullying. We also examined which part-of-speech combinations are most appropriate for the models mentioned above. The results of our experiments showed that the predictive performance of different models differs when using different part-of-speech tags as inputs. Random forest showed the best predictive performance, and naive Bayes and support vector machine followed, respectively. Meanwhile, across the different models, the sensitivity to different part-of-speech tags was consistent, with greater sensitivity shown towards nouns, verbs, and measure words, and lower sensitivity shown towards adjectives and pronouns. We also found that the combination of different parts of speech as inputs had an influence on the predictive performance of the models. This study will help researchers to determine which combination of part-of-speech categories is appropriate to improve the accuracy of cyberbullying detection.
Full article
Figure 1
Open AccessArticle
Learning Analytics in the Era of Large Language Models
by
Elisabetta Mazzullo, Okan Bulut, Tarid Wongvorachan and Bin Tan
Analytics 2023, 2(4), 877-898; https://doi.org/10.3390/analytics2040046 - 16 Nov 2023
Abstract
Learning analytics (LA) has the potential to significantly improve teaching and learning, but there are still many areas for improvement in LA research and practice. The literature highlights limitations in every stage of the LA life cycle, including scarce pedagogical grounding and poor
[...] Read more.
Learning analytics (LA) has the potential to significantly improve teaching and learning, but there are still many areas for improvement in LA research and practice. The literature highlights limitations in every stage of the LA life cycle, including scarce pedagogical grounding and poor design choices in the development of LA, challenges in the implementation of LA with respect to the interpretability of insights, prediction, and actionability of feedback, and lack of generalizability and strong practices in LA evaluation. In this position paper, we advocate for empowering teachers in developing LA solutions. We argue that this would enhance the theoretical basis of LA tools and make them more understandable and practical. We present some instances where process data can be utilized to comprehend learning processes and generate more interpretable LA insights. Additionally, we investigate the potential implementation of large language models (LLMs) in LA to produce comprehensible insights, provide timely and actionable feedback, enhance personalization, and support teachers’ tasks more extensively.
Full article
(This article belongs to the Special Issue New Insights in Learning Analytics)
►▼
Show Figures
Figure 1
Open AccessArticle
A Comparative Analysis of VirLock and Bacteriophage ϕ6 through the Lens of Game Theory
by
Dimitris Kostadimas, Kalliopi Kastampolidou and Theodore Andronikos
Analytics 2023, 2(4), 853-876; https://doi.org/10.3390/analytics2040045 - 6 Nov 2023
Abstract
►▼
Show Figures
The novelty of this paper lies in its perspective, which underscores the fruitful correlation between biological and computer viruses. In the realm of computer science, the study of theoretical concepts often intersects with practical applications. Computer viruses have many common traits with their
[...] Read more.
The novelty of this paper lies in its perspective, which underscores the fruitful correlation between biological and computer viruses. In the realm of computer science, the study of theoretical concepts often intersects with practical applications. Computer viruses have many common traits with their biological counterparts. Studying their correlation may enhance our perspective and, ultimately, augment our ability to successfully protect our computer systems and data against viruses. Game theory may be an appropriate tool for establishing the link between biological and computer viruses. In this work, we establish correlations between a well-known computer virus, VirLock, with an equally well-studied biological virus, the bacteriophage . VirLock is a formidable ransomware that encrypts user files and demands a ransom for data restoration. Drawing a parallel with the biological virus bacteriophage , we uncover conceptual links like shared attributes and behaviors, as well as useful insights. Following this line of thought, we suggest efficient strategies based on a game theory perspective, which have the potential to address the infections caused by VirLock, and other viruses with analogous behavior. Moreover, we propose mathematical formulations that integrate real-world variables, providing a means to gauge virus severity and design robust defensive strategies and analytics. This interdisciplinary inquiry, fusing game theory, biology, and computer science, advances our understanding of virus behavior, paving the way for the development of effective countermeasures while presenting an alternative viewpoint. Throughout this theoretical exploration, we contribute to the ongoing discourse on computer virus behavior and stimulate new avenues for addressing digital threats. In particular, the formulas and framework developed in this work can facilitate better risk analysis and assessment, and become useful tools in penetration testing analysis, helping companies and organizations enhance their security.
Full article
Figure 1
Open AccessArticle
Can Oral Grades Predict Final Examination Scores? Case Study in a Higher Education Military Academy
by
Antonios Andreatos and Apostolos Leros
Analytics 2023, 2(4), 836-852; https://doi.org/10.3390/analytics2040044 - 2 Nov 2023
Abstract
This paper investigates the correlation between oral grades and final written examination grades in a higher education military academy. A quantitative, correlational methodology utilizing linear regression analysis is employed. The data consist of undergraduate telecommunications and electronics engineering students’ grades in two courses
[...] Read more.
This paper investigates the correlation between oral grades and final written examination grades in a higher education military academy. A quantitative, correlational methodology utilizing linear regression analysis is employed. The data consist of undergraduate telecommunications and electronics engineering students’ grades in two courses offered during the fourth year of studies, and spans six academic years. Course One covers period 2017–2022, while Course Two, period 1 spans 2014–2018 and period 2 spans 2019–2022. In Course One oral grades are obtained by means of a midterm exam. In Course Two period 1, 30% of the oral grade comes from homework assignments and lab exercises, while the remaining 70% comes from a midterm exam. In Course Two period 2, oral grades are the result of various alternative assessment activities. In all cases, the final grade results from a traditional written examination given at the end of the semester. Correlation and predictive models between oral and final grades were examined. The results of the analysis demonstrated that, (a) under certain conditions, oral grades based more or less on midterm exams can be good predictors of final examination scores; (b) oral grades obtained through alternative assessment activities cannot predict final examination scores.
Full article
(This article belongs to the Special Issue New Insights in Learning Analytics)
►▼
Show Figures
Figure 1
Open AccessArticle
Relating the Ramsay Quotient Model to the Classical D-Scoring Rule
by
Alexander Robitzsch
Analytics 2023, 2(4), 824-835; https://doi.org/10.3390/analytics2040043 - 17 Oct 2023
Abstract
►▼
Show Figures
In a series of papers, Dimitrov suggested the classical D-scoring rule for scoring items that give difficult items a higher weight while easier items receive a lower weight. The latent D-scoring model has been proposed to serve as a latent mirror of the
[...] Read more.
In a series of papers, Dimitrov suggested the classical D-scoring rule for scoring items that give difficult items a higher weight while easier items receive a lower weight. The latent D-scoring model has been proposed to serve as a latent mirror of the classical D-scoring model. However, the item weights implied by this latent D-scoring model are typically only weakly related to the weights in the classical D-scoring model. To this end, this article proposes an alternative item response model, the modified Ramsay quotient model, that is better-suited as a latent mirror of the classical D-scoring model. The reasoning is based on analytical arguments and numerical illustrations.
Full article
Figure 1
Open AccessArticle
An Exploration of Clustering Algorithms for Customer Segmentation in the UK Retail Market
by
Jeen Mary John, Olamilekan Shobayo and Bayode Ogunleye
Analytics 2023, 2(4), 809-823; https://doi.org/10.3390/analytics2040042 - 12 Oct 2023
Cited by 3
Abstract
►▼
Show Figures
Recently, peoples’ awareness of online purchases has significantly risen. This has given rise to online retail platforms and the need for a better understanding of customer purchasing behaviour. Retail companies are pressed with the need to deal with a high volume of customer
[...] Read more.
Recently, peoples’ awareness of online purchases has significantly risen. This has given rise to online retail platforms and the need for a better understanding of customer purchasing behaviour. Retail companies are pressed with the need to deal with a high volume of customer purchases, which requires sophisticated approaches to perform more accurate and efficient customer segmentation. Customer segmentation is a marketing analytical tool that aids customer-centric service and thus enhances profitability. In this paper, we aim to develop a customer segmentation model to improve decision-making processes in the retail market industry. To achieve this, we employed a UK-based online retail dataset obtained from the UCI machine learning repository. The retail dataset consists of 541,909 customer records and eight features. Our study adopted the RFM (recency, frequency, and monetary) framework to quantify customer values. Thereafter, we compared several state-of-the-art (SOTA) clustering algorithms, namely, K-means clustering, the Gaussian mixture model (GMM), density-based spatial clustering of applications with noise (DBSCAN), agglomerative clustering, and balanced iterative reducing and clustering using hierarchies (BIRCH). The results showed the GMM outperformed other approaches, with a Silhouette Score of 0.80.
Full article
Figure 1
Open AccessArticle
A Novel Curve Clustering Method for Functional Data: Applications to COVID-19 and Financial Data
by
Ting Wei and Bo Wang
Analytics 2023, 2(4), 781-808; https://doi.org/10.3390/analytics2040041 - 8 Oct 2023
Abstract
Functional data analysis has significantly enriched the landscape of existing data analysis methodologies, providing a new framework for comprehending data structures and extracting valuable insights. This paper is dedicated to addressing functional data clustering—a pivotal challenge within functional data analysis. Our contribution to
[...] Read more.
Functional data analysis has significantly enriched the landscape of existing data analysis methodologies, providing a new framework for comprehending data structures and extracting valuable insights. This paper is dedicated to addressing functional data clustering—a pivotal challenge within functional data analysis. Our contribution to this field manifests through the introduction of innovative clustering methodologies tailored specifically to functional curves. Initially, we present a proximity measure algorithm designed for functional curve clustering. This innovative clustering approach offers the flexibility to redefine measurement points on continuous functions, adapting to either equidistant or nonuniform arrangements, as dictated by the demands of the proximity measure. Central to this method is the “proximity threshold”, a critical parameter that governs the cluster count, and its selection is thoroughly explored. Subsequently, we propose a time-shift clustering algorithm designed for time-series data. This approach identifies historical data segments that share patterns similar to those observed in the present. To evaluate the effectiveness of our methodologies, we conduct comparisons with the classic K-means clustering method and apply them to simulated data, yielding encouraging simulation results. Moving beyond simulation, we apply the proposed proximity measure algorithm to COVID-19 data, yielding notable clustering accuracy. Additionally, the time-shift clustering algorithm is employed to analyse NASDAQ Composite data, successfully revealing underlying economic cycles.
Full article
(This article belongs to the Special Issue Feature Papers in Analytics)
►▼
Show Figures
Figure 1
Open AccessArticle
Image Segmentation of the Sudd Wetlands in South Sudan for Environmental Analytics by GRASS GIS Scripts
by
Polina Lemenkova
Analytics 2023, 2(3), 745-780; https://doi.org/10.3390/analytics2030040 - 21 Sep 2023
Cited by 2
Abstract
This paper presents the object detection algorithms GRASS GIS applied for Landsat 8-9 OLI/TIRS data. The study area includes the Sudd wetlands located in South Sudan. This study describes a programming method for the automated processing of satellite images for environmental analytics, applying
[...] Read more.
This paper presents the object detection algorithms GRASS GIS applied for Landsat 8-9 OLI/TIRS data. The study area includes the Sudd wetlands located in South Sudan. This study describes a programming method for the automated processing of satellite images for environmental analytics, applying the scripting algorithms of GRASS GIS. This study documents how the land cover changed and developed over time in South Sudan with varying climate and environmental settings, indicating the variations in landscape patterns. A set of modules was used to process satellite images by scripting language. It streamlines the geospatial processing tasks. The functionality of the modules of GRASS GIS to image processing is called within scripts as subprocesses which automate operations. The cutting-edge tools of GRASS GIS present a cost-effective solution to remote sensing data modelling and analysis. This is based on the discrimination of the spectral reflectance of pixels on the raster scenes. Scripting algorithms of remote sensing data processing based on the GRASS GIS syntax are run from the terminal, enabling to pass commands to the module. This ensures the automation and high speed of image processing. The algorithm challenge is that landscape patterns differ substantially, and there are nonlinear dynamics in land cover types due to environmental factors and climate effects. Time series analysis of several multispectral images demonstrated changes in land cover types over the study area of the Sudd, South Sudan affected by environmental degradation of landscapes. The map is generated for each Landsat image from 2015 to 2023 using 481 maximum-likelihood discriminant analysis approaches of classification. The methodology includes image segmentation by ‘i.segment’ module, image clustering and classification by ‘i.cluster’ and ‘i.maxlike’ modules, accuracy assessment by ‘r.kappa’ module, and computing NDVI and cartographic mapping implemented using GRASS GIS. The benefits of object detection techniques for image analysis are demonstrated with the reported effects of various threshold levels of segmentation. The segmentation was performed 371 times with 90% of the threshold and minsize = 5; the process was converged in 37 to 41 iterations. The following segments are defined for images: 4515 for 2015, 4813 for 2016, 4114 for 2017, 5090 for 2018, 6021 for 2019, 3187 for 2020, 2445 for 2022, and 5181 for 2023. The percent convergence is 98% for the processed images. Detecting variations in land cover patterns is possible using spaceborne datasets and advanced applications of scripting algorithms. The implications of cartographic approach for environmental landscape analysis are discussed. The algorithm for image processing is based on a set of GRASS GIS wrapper functions for automated image classification.
Full article
(This article belongs to the Special Issue Feature Papers in Analytics)
►▼
Show Figures
Figure 1
Open AccessReview
Application of Machine Learning and Deep Learning Models in Prostate Cancer Diagnosis Using Medical Images: A Systematic Review
by
Olusola Olabanjo, Ashiribo Wusu, Mauton Asokere, Oseni Afisi, Basheerat Okugbesan, Olufemi Olabanjo, Olusegun Folorunso and Manuel Mazzara
Analytics 2023, 2(3), 708-744; https://doi.org/10.3390/analytics2030039 - 19 Sep 2023
Cited by 2
Abstract
►▼
Show Figures
Introduction: Prostate cancer (PCa) is one of the deadliest and most common causes of malignancy and death in men worldwide, with a higher prevalence and mortality in developing countries specifically. Factors such as age, family history, race and certain genetic mutations are some
[...] Read more.
Introduction: Prostate cancer (PCa) is one of the deadliest and most common causes of malignancy and death in men worldwide, with a higher prevalence and mortality in developing countries specifically. Factors such as age, family history, race and certain genetic mutations are some of the factors contributing to the occurrence of PCa in men. Recent advances in technology and algorithms gave rise to the computer-aided diagnosis (CAD) of PCa. With the availability of medical image datasets and emerging trends in state-of-the-art machine and deep learning techniques, there has been a growth in recent related publications. Materials and Methods: In this study, we present a systematic review of PCa diagnosis with medical images using machine learning and deep learning techniques. We conducted a thorough review of the relevant studies indexed in four databases (IEEE, PubMed, Springer and ScienceDirect) using the Preferred Reporting Items for Systematic Reviews and Meta-Analyses (PRISMA) guidelines. With well-defined search terms, a total of 608 articles were identified, and 77 met the final inclusion criteria. The key elements in the included papers are presented and conclusions are drawn from them. Results: The findings show that the United States has the most research in PCa diagnosis with machine learning, Magnetic Resonance Images are the most used datasets and transfer learning is the most used method of diagnosing PCa in recent times. In addition, some available PCa datasets and some key considerations for the choice of loss function in the deep learning models are presented. The limitations and lessons learnt are discussed, and some key recommendations are made. Conclusion: The discoveries and the conclusions of this work are organized so as to enable researchers in the same domain to use this work and make crucial implementation decisions.
Full article
Figure 1
Highly Accessed Articles
Latest Books
E-Mail Alert
News
Topics
Conferences
Special Issues
Special Issue in
Analytics
Business Analytics and Applications
Guest Editors: Tatiana Ermakova, Benjamin FabianDeadline: 31 August 2024
Special Issue in
Analytics
Visual Analytics: Techniques and Applications
Guest Editors: Katerina Vrotsou, Kostiantyn KucherDeadline: 30 September 2024
Special Issue in
Analytics
Data Analytics and Quality 4.0: Innovations and Applications
Guest Editor: Elizabeth CudneyDeadline: 31 October 2024
Special Issue in
Analytics
Advances in Applied Data Science: Bridging Theory and Practice
Guest Editor: R. Jordan CrouserDeadline: 31 March 2025