
Cistus, Acacia, and Lemon verbena Valorization through Response Surface Methodology: Optimization Studies and Potential Application in the Pharmaceutical and Nutraceutical Industries

 ,
,  ,
,  ,
,  , and
, and 
Abstract
:
1. Introduction
2. Results and Discussion
2.1. Description of the Phenolic Profile of the Different Extracts under Study
2.2. RSM Conditions and Optimized Responses
2.2.1. Optimization of the Extraction Parameters of Cistus
2.2.2. Optimization of the Extraction of Acacia
2.2.3. Optimization of the Extraction of Lemon verbena
2.2.4. General Considerations
3. Materials and Methods
3.1. Samples
3.1.1. Standards and Reagents
3.1.2. Heat-Assisted Extraction (Dynamic Maceration)
3.1.3. Ultrasound-Assisted Extraction (UAE)
3.1.4. Analysis of Phenolic Compounds
3.1.5. Experimental Design and Statistical Analysis
4. Conclusions
Author Contributions
Funding
Institutional Review Board Statement
Informed Consent Statement
Data Availability Statement
Conflicts of Interest
References
- Fernandes, F.; Pereira, E.; Círić, A.; Soković, M.; Calhelha, R.C.; Barros, L.; Ferreira, I.C.F.R. Ocimum basilicum var. Purpurascens leaves (red rubin basil): A source of bioactive compounds and natural pigments for the food industry. Food Funct. 2019, 10, 3161–3171. [Google Scholar] [CrossRef] [PubMed]
- Borges, A.; José, H.; Homem, V.; Simões, M. Comparison of techniques and solvents on the antimicrobial and antioxidant potential of extracts from acacia dealbata and olea europaea. Antibiotics 2020, 9, 48. [Google Scholar] [CrossRef]
- Clemente-Villalba, J.; Burló, F.; Hernández, F.; Carbonell-Barrachina, Á.A. Valorization of Wild Edible Plants as Food Ingredients and Their Economic Value. Foods 2023, 12, 1012. [Google Scholar] [CrossRef] [PubMed]
- Spiliopoulou, K.; Brooks, T.M.; Dimitrakopoulos, P.G.; Oikonomou, A.; Karavatsou, F.; Stoumboudi, M.T.; Triantis, K.A. Protected areas and the ranges of threatened species: Towards the EU Biodiversity Strategy 2030. Biol. Conserv. 2023, 284, 110166. [Google Scholar] [CrossRef]
- Jardim Botânico da UTAD. Available online: https://jb.utad.pt/ (accessed on 22 January 2024).
- El Karkouri, J.; Bouhrim, M.; Al Kamaly, O.M.; Mechchate, H.; Kchibale, A.; Adadi, I.; Amine, S.; Ismaili, S.A.; Zair, T. Chemical composition, antibacterial and antifungal activity of the essential oil from cistus ladanifer L. Plants 2021, 10, 2068. [Google Scholar] [CrossRef] [PubMed]
- Frazão, D.F.; Raimundo, J.R.; Domingues, J.L.; Quintela-Sabarís, C.; Gonçalves, J.C.; Delgado, F. Cistus ladanifer (Cistaceae): A natural resource in Mediterranean-type ecosystems. Planta 2018, 247, 289–300. [Google Scholar] [CrossRef]
- Raimundo, J.R.; Frazão, D.F.; Domingues, J.L.; Quintela-Sabarís, C.; Dentinho, T.P.; Anjos, O.; Alves, M.; Delgado, F. Neglected Mediterranean plant species are valuable resources: The example of Cistus ladanifer. Planta 2018, 248, 1351–1364. [Google Scholar] [CrossRef] [PubMed]
- Raposo, M.A.M.; Pinto Gomes, C.J.; Nunes, L.J.R. Evaluation of Species Invasiveness: A Case Study with Acacia dealbata link. on the Slopes of Cabeça (Seia-Portugal). Sustainability 2021, 13, 11233. [Google Scholar] [CrossRef]
- Oliveira, C.S.D.; Moreira, P.; Resende, J.; Cruz, M.T.; Pereira, C.M.F.; Silva, A.M.S.; Santos, S.A.O.; Silvestre, A.J.D. Characterization and cytotoxicity assessment of the lipophilic fractions of different morphological parts of acacia dealbata. Int. J. Mol. Sci. 2020, 21, 1814. [Google Scholar] [CrossRef]
- Bahramsoltani, R.; Rostamiasrabadi, P.; Shahpiri, Z.; Marques, A.M.; Rahimi, R.; Farzaei, M.H. Aloysia citrodora Paláu (Lemon verbena): A review of phytochemistry and pharmacology. J. Ethnopharmacol. 2018, 222, 34–51. [Google Scholar] [CrossRef]
- Afonso, S.; Arrobas, M.; Ferreira, I.Q.; Rodrigues, M.Â. Leaf nutrient concentration standards for lemon verbena (Aloysia citrodora Paláu) obtained from field and pot fertilization experiments. J. Appl. Res. Med. Aromat. Plants 2018, 8, 33–40. [Google Scholar] [CrossRef]
- Leichtweis, M.G.; Molina, A.K.; Petropoulos, S.A.; Carocho, M.; Pires, T.C.S.P.; Dias, M.I.; Calhelha, R.; Oliveira, M.B.P.P.; Pereira, C.; Barros, L. Valorization of Pumpkin Peel as a Source of Bioactive Compounds: Optimization of Heat- and Ultrasound-Assisted Extraction. Molecules 2023, 28, 3168. [Google Scholar] [CrossRef] [PubMed]
- Kumar, K.; Srivastav, S.; Sharanagat, V.S. Ultrasound assisted extraction (UAE) of bioactive compounds from fruit and vegetable processing by-products: A revissew. Ultrason. Sonochem. 2021, 70, 105325. [Google Scholar] [CrossRef] [PubMed]
- Fernández-Arroyo, S.; Barrajón-Catalán, E.; Micol, V.; Seguera-Carretero, A.; Fernández-Gutiérrez, A. High-performance liquid chromatography with diode array detection coupled to electrospray time-of-flight and ion-trap tandem mass spectrometry to identify phenolic compounds from a Cistus ladanifer aqueous extract. Phytochem. Anal. 2010, 21, 307–313. [Google Scholar] [CrossRef] [PubMed]
- Seeram, N.; Lee, R.; Hardy, M.; Heber, D. Rapid large scale purification of ellagitannins from pomegranate husk, a by-product of the commercial juice industry. Sep. Purif. Technol. 2005, 41, 49–55. [Google Scholar] [CrossRef]
- Saracini, E.; Tattini, M.; Traversi, M.L.; Vincieri, F.F.; Pinelli, P. Simultaneous LC-DAD and LC-MS determination of ellagitannins, flavonoid glycosides, and acyl-glycosyl flavonoids in Cistus salvifolius L. leaves. Chromatographia 2005, 62, 245–249. [Google Scholar] [CrossRef]
- Barros, L.; Dueñas, M.; Alves, C.T.; Silva, S.; Henriques, M.; Santos-Buelga, C.; Ferreira, I.C.F.R. Antifungal activity and detailed chemical characterization of Cistus ladanifer phenolic extracts. Ind. Crop. Prod. 2013, 41, 41–45. [Google Scholar] [CrossRef]
- Matłok, N.; Lachowicz, S.; Gorzelany, J.; Balawejder, M. Influence of drying method on some bioactive compounds and the composition of volatile components in dried pink rock rose (Cistus creticus L.). Molecules 2020, 25, 2596. [Google Scholar] [CrossRef]
- Li, P.; Du, R.; Chen, Z.; Wang, Y.; Zhan, P.; Liu, X.; Kang, D.; Chen, Z.; Zhao, X.; Wang, L.; et al. Punicalagin is a neuraminidase inhibitor of influenza viruses. J. Med. Virol. 2021, 93, 3465–3472. [Google Scholar] [CrossRef]
- Bouyahya, A.; El Omari, N.; Elmenyiy, N.; Guaouguaou, F.E.; Balahbib, A.; Belmehdi, O.; Salhi, N.; Imtara, H.; Mrabti, H.N.; El-Shazly, M.; et al. Moroccan antidiabetic medicinal plants: Ethnobotanical studies, phytochemical bioactive compounds, preclinical investigations, toxicological validations and clinical evidences, challenges, guidance and perspectives for future management of diabetes world. Trends Food Sci. Technol. 2021, 115, 147–254. [Google Scholar] [CrossRef]
- Uushona, T.; Chikwanha, O.C.; Tayengwa, T.; Katiyatiya, C.L.F.; Strydom, P.E.; Mapiye, C. Nutraceutical and preservative potential of Acacia mearnsii and Acacia dealbata leaves for ruminant production and product quality enhancement. J. Agric. Sci. 2021, 159, 743–756. [Google Scholar] [CrossRef]
- Shen, D.; Wu, Q.; Wang, M.; Yang, Y.; Lavoie, E.J.; Simon, J.E. Determination of the predominant catechins in Acacia catechu by liquid chromatography/electrospray ionization-mass spectrometry. J. Agric. Food Chem. 2006, 54, 3219–3224. [Google Scholar] [CrossRef] [PubMed]
- Kaur, P.; Arora, S.; Singh, R. Isolation, characterization and biological activities of betulin from Acacia nilotica bark. Sci. Rep. 2022, 12, 9370. [Google Scholar] [CrossRef] [PubMed]
- Wu, C.; He, L.; Zhang, Y.; You, C.; Li, X.; Jiang, P.; Wang, F. Separation of flavonoids with significant biological activity from Acacia mearnsii leaves. RSC Adv. 2023, 13, 9119–9127. [Google Scholar] [CrossRef] [PubMed]
- Muhaisen, H.M.H.; Ilyas, M.; Mushfiq, M.; Parveen, M.; Basudan, O.A. Flavonoids from Acacia tortilis. J. Chem. Res. 2002, 6, 276–278. [Google Scholar] [CrossRef]
- Aghababaei, F.; Hadidi, M. Recent Advances in Potential Health Benefits of Quercetin. Pharmaceuticals 2023, 16, 1020. [Google Scholar] [CrossRef] [PubMed]
- Shoaib, S.; Ansari, M.A.; Fatease, A.A.; Safhi, A.Y.; Hani, U.; Jahan, R.; Alomary, M.N.; Ansari, M.N.; Ahmed, N.; Wahab, S.; et al. Plant-Derived Bioactive Compounds in the Management of Neurodegenerative Disorders: Challenges, Future Directions and Molecular Mechanisms Involved in Neuroprotection. Pharmaceutics 2023, 15, 749. [Google Scholar] [CrossRef] [PubMed]
- Leyva-Jiménez, F.J.; Lozano-Sánchez, J.; Fernández-Ochoa, Á.; Cádiz-Gurrea, M.D.L.L.; Arraéz-Román, D.; Segura-Carretero, A. Optimized Extraction of Phenylpropanoids and Flavonoids from Lemon Verbena Leaves by Supercritical Fluid System Using Response Surface Methodology. Foods 2020, 9, 931. [Google Scholar] [CrossRef]
- Marchetti, L.; Pellati, F.; Graziosi, R.; Brighenti, V.; Pinetti, D.; Bertelli, D. Identification and determination of bioactive phenylpropanoid glycosides of Aloysia polystachya (Griseb. et Moldenke) by HPLC-MS. J. Pharm. Biomed. Anal. 2019, 166, 364–370. [Google Scholar] [CrossRef]
- Marques, A.A.M.; Lorençone, B.R.; Romão, P.V.M.; Guarnier, L.P.; Palozi, R.A.C.; Moreno, K.G.T.; Tirloni, C.A.S.; dos Santos, A.C.; Souza, R.I.C.; Klider, L.M.; et al. Ethnopharmacological investigation of the cardiovascular effects of the ethanol-soluble fraction of Aloysia polystachya (Griseb.) Moldenke leaves in spontaneously hypertensive rats. J. Ethnopharmacol. 2021, 274, 114077. [Google Scholar] [CrossRef]
- Leyva-Jiménez, F.J.; Lozano-Sánchez, J.; Borrás-Linares, I.; Arráez-Román, D.; Segura-Carretero, A. Comparative study of conventional and pressurized liquid extraction for recovering bioactive compounds from Lippia citriodora leaves. Food Res. Int. 2018, 109, 213–222. [Google Scholar] [CrossRef] [PubMed]
- Alipieva, K.; Korkina, L.; Orhan, I.E.; Georgiev, M.I. Verbascoside—A review of its occurrence, (bio)synthesis and pharmacological significance. Biotechnol. Adv. 2014, 32, 1065–1076. [Google Scholar] [CrossRef] [PubMed]
- Gaweł-Bęben, K.; Kukula-Koch, W.; Hoian, U.; Czop, M.; Strzępek-Gomółka, M.; Antosiewicz, B. Characterization of cistus × incanus L. and Cistus ladanifer L. extracts as potential multifunctional antioxidant ingredients for skin protecting cosmetics. Antioxidants 2020, 9, 202. [Google Scholar] [CrossRef] [PubMed]
- Lekbach, Y.; Xu, D.; El Abed, S.; Dong, Y.; Liu, D.; Khan, M.S.; Ibnsouda Koraichi, S.; Yang, K. Mitigation of microbiologically influenced corrosion of 304L stainless steel in the presence of Pseudomonas aeruginosa by Cistus ladanifer leaves extract. Int. Biodeterior. Biodegrad. 2018, 133, 159–169. [Google Scholar] [CrossRef]
- Rita, I.; Pereira, C.; Barros, L.; Ferreira, I.C. Exploring reserve lots of Cymbopogon citratus, Aloysia citrodora and Thymus × citriodorus as improved sources of phenolic compounds. Food Chem. 2018, 257, 83–89. [Google Scholar] [CrossRef] [PubMed]
- Tammar, S.; Salem, N.; Aidi Wannes, W.; Limam, H.; Bourgou, S.; Fares, N.; Dakhlaoui, S.; Hammami, M.; Khammassi, S.; Re, G.D.; et al. Chemometric profiling and bioactivity of verbena (Aloysia citrodora) methanolic extract from four localities in Tunisia. Foods 2021, 10, 2912. [Google Scholar] [CrossRef] [PubMed]
- Ziani, B.E.; Carocho, M.; Abreu, R.M.; Bachari, K.; Alves, M.J.; Calhelha, R.C.; Talhi, O.; Barros, L.; Ferreira, I.C. Phenolic profiling, biological activities and in silico studies of Acacia tortilis (Forssk.) Hayne ssp. raddiana extracts. Food Biosci. 2020, 36, 100616. [Google Scholar] [CrossRef]
- Venusova, E.; Kolesarova, A.; Horky, P.; Slama, P. Physiological and immune functions of punicalagin. Nutrients 2021, 13, 2150. [Google Scholar] [CrossRef]
- Xu, P.; Xu, L.; Huang, S.; Li, D.; Liu, Y.; Guo, H.; Dai, N.; Hong, Z.; Zhong, S. Analysis of the Molecular Mechanism of Punicalagin in the Treatment of Alzheimer’s Disease by Computer-Aided Drug Research Technology. ACS Omega 2022, 7, 6121–6132. [Google Scholar] [CrossRef]
- Živković, J.; Šavikin, K.; Janković, T.; Ćujić, N.; Menković, N. Optimization of ultrasound-assisted extraction of polyphenolic compounds from pomegranate peel using response surface methodology. Sep. Purif. Technol. 2018, 194, 40–47. [Google Scholar] [CrossRef]
- Yang, H.; Tuo, X.; Wang, L.; Tundis, R.; Portillo, M.P.; Simal-Gandara, J.; Yu, Y.; Zou, L.; Xiao, J.; Deng, J. Bioactive procyanidins from dietary sources: The relationship between bioactivity and polymerization degree. Trends Food Sci. Technol. 2021, 111, 114–127. [Google Scholar] [CrossRef]
- Taheri, Y.; Suleria, H.A.R.; Martins, N.; Sytar, O.; Beyatli, A.; Yeskaliyeva, B.; Seitimova, G.; Salehi, B.; Semwal, P.; Painuli, S.; et al. Myricetin bioactive effects: Moving from preclinical evidence to potential clinical applications. BMC Complement. Med. Ther. 2020, 20, 241. [Google Scholar] [CrossRef]
- Tomaz, I.; Maslov, L.; Stupic, D.; Preiner, D.; Ašperger, D.; Karoglan Kontic, J. Multi-response optimisation of ultrasound-assisted extraction for recovery of flavonoids from red grape skins using response surface methodology. Phytochem. Anal. 2016, 27, 13–22. [Google Scholar] [CrossRef] [PubMed]
- Li, X.; Zhang, Y.; Hong, Z.; Gong, S.; Liu, W.; Zhou, X.; Sun, Y.; Qian, J.; Qu, H. Transcriptome profiling analysis reveals the potential mechanisms of three bioactive ingredients of Fufang E’jiao Jiang during chemotherapy-induced myelosuppression in mice. Front. Pharmacol. 2018, 9, 616. [Google Scholar] [CrossRef] [PubMed]
- Fang, X.; Gu, S.; Jin, Z.; Hao, M.; Yin, Z.; Wang, J. Optimization of ultrasonic-assisted simultaneous extraction of three active compounds from the fruits of forsythia suspensa and comparison with conventional extraction methods. Molecules 2018, 23, 2115. [Google Scholar] [CrossRef] [PubMed]
- Leyva-Jiménez, F.J.; Lozano-Sánchez, J.; Borrás-Linares, I.; Arráez-Román, D.; Segura-Carretero, A. Manufacturing design to improve the attainment of functional ingredients from Aloysia citriodora leaves by advanced microwave technology. J. Ind. Eng. Chem. 2019, 79, 52–61. [Google Scholar] [CrossRef]
- Mandim, F.; Petropoulos, S.A.; Pinela, J.; Dias, M.I.; Kostic, M.; Soković, M.; Ferreira, I.C.; Santos-Buelga, C.; Barros, L. Phenolic Composition and Antioxidant, Anti-Inflammatory, Cytotoxic, and Antimicrobial Activities of Cardoon Blades at Different Growth Stages. Biology 2022, 11, 699. [Google Scholar] [CrossRef]

| Peak | Rt (min) | λmax (nm) | [M-H]− (m/z) | MS2 (m/z) | Tentative Identification |
|---|---|---|---|---|---|
| 1 | 5.05 | 258, 380 | 1083 | 781 (17), 601 (16), 301 (100) | Punicalagin isomer I |
| 2 | 5.92 | 259, 378 | 1251 | 1083 (4), 781 (13), 601 (4), 301 (13) | Punicalagin gallate isomer I |
| 3 | 7.38 | 258, 378 | 1251 | 1083 (4), 781 (13), 601 (4), 301 (13) | Punicalagin gallate isomer II |
| 4 | 10.48 | 338 | 757 | 595 (100), 463 (8), 301 (9) | Quercetin-O-di-hexose-O-pentose |
| 5 | 13.11 | 342 | 625 | 301 (100) | Quercetin-dihexoside |
| 6 | 14.61 | 259, 378 | 1251 | 1083 (4), 781 (13), 601 (4), 301 (13) | Punicalagin gallate isomer III |
| 7 | 15.72 | 258, 380 | 1083 | 781 (17), 601 (16), 301 (100) | Punicalagin isomer II |
| 8 | 17.61 | 341 | 433 | 301 (100) | Quercetin-O-pentoside |
| 9 | 21.02 | 342 | 447 | 285 (100) | Kaempferol-3-O-glucoside |
| 10 | 21.96 | 345 | 447 | 301 (100) | Quercetin-O-deoxyhexoside |
| 11 | 23.92 | 334 | 593 | 285 (100) | Kaempferol-3-O-rutinoside |
| 12 | 24.64 | 332 | 667 | 505 (65), 463 (41), 301 (100) | Quercetin-O-acetyl-di-hexoside |
| 13 | 33.55 | 380 | 1083 | 781 (17), 601 (16), 301 (100) | Punicalagin isomer III |
| 14 | 36.03 | 384 | 1251 | 1083 (4), 781 (13), 601 (4), 301 (13) | Punicalagin gallate isomer IV |
| 15 | 36.1 | 384 | 1251 | 1083 (4), 781 (13), 601 (4), 301 (13) | Punicalagin gallate isomer V |
| Peak | Rt (min) | λmax (nm) | [M-H]− (m/z) | MS2 (m/z) | Tentative Identification |
|---|---|---|---|---|---|
| 1 | 5.92 | 273 | 289 | 245 (100) | (+)-Catechin |
| 2 | 6.73 | 278 | 385 | 223 (100) | Sinapic acid hexoside |
| 3 | 7.38 | 280 | 865 | 289 (100) | Procyanidin trimer |
| 4 | 7.43 | 286 | 421 | 289 (100) | Catechin-pentoside |
| 5 | 7.89 | 281 | 449 | 287 (100) | Eriodictyol-O-hexoside |
| 6 | 8.31 | 280 | 577 | 289 (100) | Procyanidin dimer |
| 7 | 9.79 | 280 | 577 | 289 (100) | Procyanidin dimer |
| 8 | 10.84 | 256 | 771 | 625 (15), 463 (45), 317 (100) | Myricetin-O-deoxyhexoside-O-hexosyl-deoxyhexoside |
| 9 | 12.08 | 356 | 625 | 317 (100) | Myricetin-O-hexosyl-deoxyhexoside |
| 10 | 13.56 | 355 | 755 | 301 (100) | Quercetin-O-deoxyhexosyl- (hexosyl-deoxyhexoside) |
| 11 | 14.17 | 356 | 625 | 317 (100) | Myricetin-O-hexosyl-deoxyhexoside |
| 12 | 14.49 | 355 | 479 | 317 (100) | Myricetin-3-O-glucoside |
| 13 | 15.12 | 355 | 595 | 287 (100) | Eriodictyol-O-hexosyl-deoxyhexoside |
| 14 | 16.64 | 355 | 609 | 301 (100) | Quercetin-O-hexosyl-deoxyhexoside |
| 15 | 17.34 | 355 | 609 | 301 (100) | Quercetin-3-O-rutinoside |
| 16 | 17.88 | 350 | 463 | 301 (100) | Quercetin-3-O-glucoside |
| 17 | 18.42 | 352 | 579 | 301 (100) | Quercetin-O-deoxyhexosyl-pentoside |
| 18 | 19.96 | 353 | 463 | 317 (100) | Myricetin-3-O-rhamnoside |
| 19 | 22.71 | 356 | 593 | 301 (100) | Quercetin-O-di-deoxyhexoside |
| 20 | 23.45 | 341 | 593 | 285 (100) | Luteolin-7-O-rutinoside |
| 21 | 24.23 | 341 | 447 | 285 (100) | Luteolin-7-O-glucoside |
| Peak | Rt (min) | λmax (nm) | [M-H]− (m/z) | MS2 (m/z) | Tentative Identification |
|---|---|---|---|---|---|
| 1 | 7.32 | 347 | 637 | 351 (43), 285 (100), 193 (39), 175 (5) | Plantainoside C |
| 2 | 7.57 | 331 | 639 | 161 (100), 179 (47) | β-Hydroxy-verbascoside |
| 3 | 7.96 | 330 | 639 | 161 (100), 179 (28) | β-hydroxy-Isoverbascoside |
| 4 | 13.81 | 343 | 651 | 351 (72), 299 (5), 193 (100) | Martynoside |
| 5 | 14.54 | 330 | 623 | 461 (11), 315 (15), 179 (5), 161 (100) | Forsythiaside |
| 6 | 15.51 | 337 | 491 | 315 (100), 300 (23) | Isorhamnetin-3-O-glucuronide |
| 7 | 16.34 | 329 | 623 | 461 (21), 315 (5), 179 (15), 161 (100) | Verbascoside |
| 8 | 16.59 | 329 | 623 | 461 (18), 315 (8), 179 (11), 161 (100) | Isoverbascoside |
| 9 | 18.51 | 329 | 637 | 461 (18), 315 (13), 193 (31), 175 (100), 161 (25) | Eukovoside |
| Run | Cistus | Acacia | Lemon verbena | |||||||||
|---|---|---|---|---|---|---|---|---|---|---|---|---|
| HAE | UAE | HAE | UAE | HAE | UAE | |||||||
| R1 | R2 | R1 | R2 | R1 | R2 | R1 | R2 | R1 | R2 | R1 | R2 | |
| TPu | DR | TPu | DR | TPro | DR | TMy | DR | TMar | DR | TFor | DR | |
| 1 | 263.53 | 0.22 | 225.20 | 0.22 | 64.40 | 0.20 | 84.73 | 0.10 | 71.26 | 0.32 | 76.66 | 0.24 |
| 2 | 209.57 | 0.26 | 233.09 | 0.20 | 140.42 | 0.13 | 50.22 | 0.13 | 0.00 | 0.12 | 78.76 | 0.11 |
| 3 | 225.32 | 0.25 | 211.70 | 0.09 | 113.87 | 0.20 | 97.90 | 0.11 | 88.65 | 0.32 | 77.69 | 0.11 |
| 4 | 211.90 | 0.29 | 213.34 | 0.30 | 75.04 | 0.12 | 101.17 | 0.01 | 83.32 | 0.32 | 70.86 | 0.11 |
| 5 | 126.46 | 0.16 | 246.13 | 0.26 | 113.57 | 0.27 | 77.48 | 0.04 | 0.00 | 0.11 | 21.48 | 0.25 |
| 6 | 265.13 | 0.23 | 226.14 | 0.30 | 123.02 | 0.21 | 99.30 | 0.13 | 94.73 | 0.33 | 82.73 | 0.03 |
| 7 | 253.19 | 0.28 | 199.19 | 0.34 | 217.94 | 0.32 | 81.56 | 0.04 | 102.06 | 0.25 | 41.43 | 0.21 |
| 8 | 107.46 | 0.21 | 180.46 | 0.11 | 105.33 | 0.29 | 82.09 | 0.14 | 88.24 | 0.29 | 100.48 | 0.04 |
| 9 | 229.03 | 0.24 | 204.18 | 0.27 | 676.17 | 0.24 | 83.53 | 0.10 | 0.00 | 0.08 | 78.62 | 0.12 |
| 10 | 205.68 | 0.26 | 275.01 | 0.18 | 193.21 | 0.27 | 86.65 | 0.03 | 112.84 | 0.24 | 74.87 | 0.09 |
| 11 | 217.11 | 0.35 | 211.55 | 0.16 | 172.22 | 0.34 | 51.37 | 0.13 | 90.23 | 0.32 | 76.59 | 0.26 |
| 12 | 250.86 | 0.30 | 235.67 | 0.87 | 188.66 | 0.07 | 86.06 | 0.12 | 0.00 | 0.15 | 43.44 | 0.21 |
| 13 | 259.72 | 0.34 | 159.03 | 0.28 | 185.27 | 0.15 | 91.74 | 0.06 | 78.93 | 0.23 | 78.42 | 0.28 |
| 14 | 240.71 | 0.34 | 236.96 | 0.28 | 119.42 | 0.27 | 85.34 | 0.03 | 98.67 | 0.30 | 72.87 | 0.12 |
| 15 | 65.97 | 0.12 | 195.53 | 0.20 | 152.34 | 0.33 | 108.82 | 0.02 | 88.80 | 0.07 | 82.75 | 0.03 |
| 16 | 217.03 | 0.33 | 267.06 | 0.18 | 153.12 | 0.17 | 96.84 | 0.23 | 0.00 | 0.29 | 29.29 | 0.23 |
| 17 | 236.52 | 0.24 | 44.97 | 0.08 | 152.07 | 0.22 | 101.35 | 0.10 | 105.75 | 0.25 | 64.98 | 0.17 |
| 18 | 58.78 | 0.24 | 201.78 | 0.10 | 111.69 | 0.22 | 64.48 | 0.01 | 91.93 | 0.29 | 80.28 | 0.15 |
| 19 | 229.32 | 0.14 | 203.02 | 0.22 | 158.43 | 0.36 | 100.86 | 0.10 | 104.21 | 0.29 | 80.61 | 0.10 |
| 20 | 234.27 | 0.25 | 255.98 | 0.21 | 139.83 | 0.25 | 44.21 | 0.09 | 100.27 | 0.32 | 71.26 | 0.03 |
| 21 | 227.02 | 0.29 | 25.12 | 0.14 | 162.17 | 0.10 | 97.29 | 0.09 | 64.52 | 0.32 | 74.02 | 0.10 |
| 22 | 202.29 | 0.34 | 169.65 | 0.28 | 133.02 | 0.05 | 94.76 | 0.19 | 94.34 | 0.31 | 85.43 | 0.16 |
| 23 | 144.53 | 0.19 | 193.51 | 0.27 | 160.04 | 0.18 | 116.51 | 0.02 | 84.89 | 0.30 | 80.40 | 0.10 |
| 24 | 235.65 | 0.33 | 251.70 | 0.07 | 118.77 | 0.24 | 81.75 | 0.02 | 91.46 | 0.26 | 80.04 | 0.16 |
| 25 | 85.74 | 0.17 | 220.82 | 0.24 | 121.89 | 0.18 | 46.79 | 0.11 | 0.00 | 0.14 | 94.01 | 0.07 |
| 26 | 225.96 | 0.28 | 26.79 | 0.14 | 154.03 | 0.15 | 11.61 | 0.10 | 100.37 | 0.30 | 80.53 | 0.27 |
| 27 | 212.42 | 0.32 | 186.07 | 0.20 | 152.64 | 0.17 | 31.19 | 0.08 | 83.46 | 0.26 | 45.73 | 0.21 |
| 28 | 187.92 | 0.28 | 154.16 | 0.18 | 139.14 | 0.24 | 87.75 | 0.09 | 97.33 | 0.29 | 89.44 | 0.03 |
| 29 | 244.95 | 0.21 | 162.29 | 0.04 | 180.16 | 0.27 | 45.15 | 0.13 | 86.60 | 0.40 | 33.49 | 0.25 |
| Cistus | Equation | |
|---|---|---|
| HAE | R1 = 218 − 79.94EtOH + 13.97t + 10.62T − 0.2257S/L Ratio + 7.05EtOH·t + 5.75EtOH·T − 14.14EtOH·S/L Ratio − 19.49t·T − 15.15t·S/L Ratio − 10.81T·S/L Ratio − 54.14EtOH2 − 4.33t2 − 1.80T2 + 7.25S/L Ratio2 1st Time (t) 2nd Temperature (T) 3rd Ethanol (EtOH) | (1) |
| R2 = 1.68 − 0.0321EtOH + 0.0210t + 0.0417T + 0.0179EtOH·T + 0.0238EtOH·S/L Ratio − 0.0965EtOH2 − 0.0389t2 − 0.0150T2 1st Temperature (T) 2nd Time (t) 3rd Interaction ethanol + solid/liquid ratio (EtOH·S/L Ratio) | (2) | |
| UAE | R1 = 198.13 − 32.95EtOH + 11.98t − 6.13P + 5.12S/L Ratio + 5.18EtOH·t + 29.63EtOH·P + 1.18EtOH·S/L Ratio + 3.24t·P − 4.06t·S/L Ratio − 107.20P·S/L Ratio + 33.40EtOH2 + 27.36t2 − 28.97P2 − 29.18S/L Ratio2 1st Ethanol2 (EtOH2) 2nd Interaction ethanol and ultrasonic power (EtOH·P) 3rd Time2(t2) | (3) |
| R2 = 0.2695 − 0.0132EtOH + 0.0449t + 0.0517P + 0.0220S/L Ratio + 0.0328EtOH·t − 0.0219EtOH·P + 0.0305EtOH·S/L Ratio + 0.0758t·P + 0.0575P·S/L Ratio − 0.0655EtOH2 − 0.0114t2 − 0.0863P2 − 0.0168S/L Ratio2 1st Interaction time and ultrasonic power (t·P) 2nd Interaction ultrasonic power and solid/liquid ratio (P·S/L Ratio) 3rd Ultrasonic power (P) | (4) | |
| Acacia | ||
| HAE | R1 = 121.53 + 30.06EtOH − 2.46t+ 7.03T − 12.26S/L Ratio + 9.41EtOH·t − 13.46EtOH·T − 18.57EtOH·S/L Ratio + 13.48t·T − 32.60t·S/L Ratio − 59.64T·S/L Ratio − 11.89EtOH2 − 1.51t2 + 33.81T2 + 41.99S/L Ratio2 1st Solid/liquid Ratio2 (S/L Ratio2) 2nd Interaction time and temperature (t·T) 3rd Interaction ethanol and time (EtOH·t) | (5) |
| R2 = 0.2707 − 0.0294EtOH + 0.0591t + 0.0665T − 0.0167S/L Ratio + 0.0109EtOH·t + 0.0268EtOH·T + 0.0332t·T − 0.0218t·S/L Ratio − 0.0841EtOH2 − 0.0538t2 − 0.0118T2 1st Temperature (T) 2nd Time (t) 3rd Interaction time and temperature (t·T) | (6) | |
| UAE | R1 = 92.93 + 17.36EtOH − 0.7926t − 2.09P + 0.8464S/L Ratio − 4.97EtOH·t + 2.48EtOH·P + 0.9422EtOH·S/L Ratio + 4.72t·P + 3.27t·S/L Ratio − 4.19P·S/L Ratio − 32.57EtOH2 − 2.57t2 + 4.13P2 + 3.91S/L Ratio2 1st Ethanol (EtOH) 2nd Interaction time and ultrasonic power (t·P) 3rd Interaction time and solid/liquid ratio (t·S/L Ratio) | (7) |
| R2 = 0.1022 − 0.0261EtOH + 0.0148t + 0.0633P − 0.0316S/L Ratio + 0.0432EtOH·P − 0.0249EtOH·S/L Ratio + 0.0237t·P − 0.0134EtOH2 − 0.0263t2 + 0.0153S/L Ratio2 1st Ultrasonic power (P) 2nd Interaction ethanol and ultrasonic power (EtOH·P) 3rd Interaction ethanol and solid/liquid ratio (EtOH·S/L Ratio) | (8) | |
| Lemon verbena | ||
| HAE | R1 = 91.84 − 49.65EtOH + 2.08t − 2.86T − 2.03S/L Ratio + 1.18EtOH·t + 17.28EtOH·T + 3.30EtOH·S/L Ratio − 5.89t·T − 4.76t·S/L Ratio − 0.2039T·S/L Ratio − 44.42EtOH2 − 0.3719t2 − 4.16T2 + 0.8070S/L Ratio2 1st Interaction ethanol and temperature (EtOH·T) 2nd Interaction ethanol and solid/liquid ratio (EtOH·S/L) 3rd Time (t) | (9) |
| R2 = 0.3117 − 0.0809EtOH + 0.0289t + 0.0341T − 0.0161EtOH·S/L Ratio − 0.1126EtOH2 − 0.0148t2 1st Temperature (T) 2nd Time (t) 3rd Interaction time and temperature (t·T) | (10) | |
| UAE | R1 = 79.68 + 25.48EtOH + 1.82t − 0.0862P + 0.1613S/L Ratio + 6.92EtOH·t + 11.75EtOH·P − 4.71EtOH·S/L Ratio − 1.40t·P − 6.01t·S/L Ratio + 0.7934P·S/L Ratio − 17.52EtOH 2 + 0.5586t2 − 2.41P2 − 0.7346S/L Ratio2 1st Ethanol (EtOH) 2nd Interaction ethanol and time (EtOH·t) 3rd Interaction ethanol and ultrasonic power (EtOH·P) | (11) |
| R2 = 0.1373 − 0.0967EtOH + 0.0139t + 0.0722P − 0.0127S/L Ratio − 0.0113P·S/L Ratio + 0.0493P2 1st Ultrasonic power (P) 2nd Ultrasonic power2 (P2) 3rd Time (t) | (12) |
| HAE | UAE | ||||||||||
|---|---|---|---|---|---|---|---|---|---|---|---|
| Optimal Variable Conditions | Optimal Variable Conditions | ||||||||||
| X1 EtOH (%, v/v) | X2 t (min) | X3 T (°C) | X4 S/L Ratio | Predicted Quantity (mg/g dw) (g/g) | X1 EtOH (%, v/v) | X2 t(min) | X3 P(W) | X4 S/L Ratio | Predicted Quantity (mg/g dw) (g/g) | ||
| Cistus | Major phenolic compound (mg/g dw) | 19 | 178 | 30 | 11 | TPu = 266 | 3.22 | 22 | 171 | 35 | TPu = 284 |
| Extraction yield (g/g) | 48 | 121 | 80 | 36 | DR = 0.35 | 55 | 27 | 421 | 39 | DR = 0.35 | |
| Derringer’s desirability | 34 | 120 | 80 | 10 | TPu = 262 DR = 0.35 | 37 | 30 | 406 | 25 | TPu = 246 DR = 0.33 | |
| Acacia | Major phenolic compound (mg/g dw) | 74 | 86 | 24 | 50 | TPro = 233 | 65 | 8 | 50 | 50 | TMy = 111 |
| Extraction yield (g/g) | 28 | 160 | 80 | 12 | DR = 0.37 | 70 | 20 | 483 | 10 | DR = 0.24 | |
| Derringer’s desirability | 69 | 173 | 73 | 11 | TPro = 287 DR = 0.37 | 65 | 17 | 500 | 10 | TMy = 105 DR = 0.23 | |
| Lemon verbena | Major phenolic compound (mg/g dw) | 13 | 96 | 49 | 17 | TMar = 114 | 94 | 25 | 399 | 29 | TFor = 101 |
| Extraction yield (g/g) | 31 | 120 | 80 | 40 | DR = 0.39 | 7 | 12 | 387 | 38 | DR = 0.31 | |
| Derringer’s desirability | 30 | 120 | 64 | 10 | TMar = 109 DR = 0.34 | 66 | 30 | 400 | 10 | TFor = 96 DR = 0.26 | |
| HAE | |||
|---|---|---|---|
| R1—TPu | R2—DR | Desirability | |
| Temperature vs. Time |  | 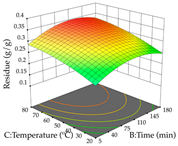 |  |
| Solvent vs. Time | 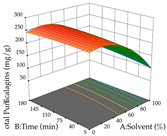 |  |  |
| Solvent vs. Temperature | 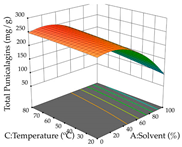 | 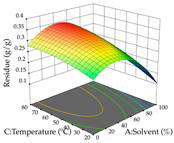 |  |
| Temperature vs. Ratio |  |  |  |
| Time vs. Ratio |  |  |  |
| Solvent vs. Ratio |  |  |  |
| UAE | |||
|---|---|---|---|
| R1—TPu | R2—DR | Desirability | |
| Power vs. Time |  |  |  |
| Solvent vs. Time |  | 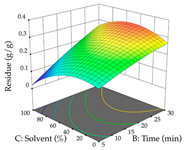 |  |
| Solvent vs. Power |  | 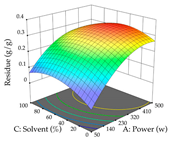 |  |
| Power vs. Ratio |  |  |  |
| Time vs. Ratio |  |  |  |
| Solvent vs. Ratio |  |  |  |
| HAE | |||
|---|---|---|---|
| R1—TPro | R2—DR | Desirability | |
| Temperature vs. Time |  |  |  |
| Solvent vs. Time | 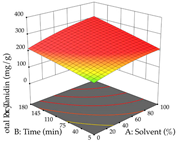 |  |  |
| Solvent vs. Temperature |  |  | 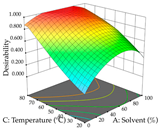 |
| Temperature vs. Ratio |  |  |  |
| Time vs. Ratio |  |  |  |
| Solvent vs. Ratio |  |  |  |
| UAE | |||
|---|---|---|---|
| R1—TMy | R2—DR | Desirability | |
| Power vs. Time |  |  |  |
| Solvent vs. Time |  |  |  |
| Solvent vs. Power |  |  | 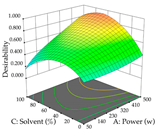 |
| Power vs. Ratio |  |  |  |
| Time vs. Ratio |  |  |  |
| Solvent vs. Ratio |  |  |  |
| HAE | |||
|---|---|---|---|
| R1—Mar | R2—DR | Desirability | |
| Temperature vs. Time |  |  |  |
| Solvent vs. Time |  |  |  |
| Solvent vs. Temperature | 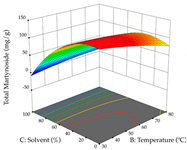 |  |  |
| Temperature vs. Ratio |  |  |  |
| Time vs. Ratio |  |  |  |
| Solvent vs. Ratio | 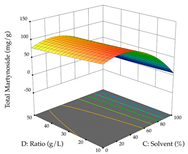 |  |  |
| UAE | |||
|---|---|---|---|
| R1—TFor | R2—DR | Desirability | |
| Power vs. Time |  | 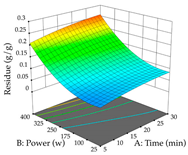 | 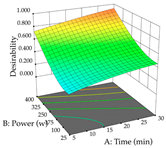 |
| Solvent vs. Time |  |  |  |
| Solvent vs. Power |  |  |  |
| Power vs. Ratio |  |  |  |
| Time vs. Ratio |  |  |  |
| Solvent vs. Ratio | 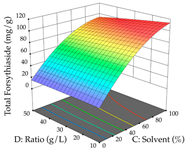 |  |  |
| HAE | UAE | |||||||
|---|---|---|---|---|---|---|---|---|
| Run | X1 EtOH (%, v/v) | X2 t (min) | X3 T (°C) | X4 S/L Ratio | X1 P (W) | X2 t (min) | X3 EtOH (%, v/v) | X4 S/L Ratio |
| 1 | 0 | 92.5 | 50 | 50 | 275 | 30 | 0 | 30 |
| 2 | 50 | 5 | 50 | 50 | 275 | 17.5 | 0 | 50 |
| 3 | 50 | 92.5 | 20 | 50 | 50 | 30 | 50 | 30 |
| 4 | 50 | 180 | 50 | 50 | 500 | 17.5 | 50 | 50 |
| 5 | 100 | 92.5 | 50 | 10 | 275 | 30 | 100 | 30 |
| 6 | 0 | 92.5 | 20 | 30 | 275 | 30 | 50 | 50 |
| 7 | 50 | 5 | 80 | 30 | 500 | 30 | 50 | 30 |
| 8 | 100 | 92.5 | 50 | 50 | 275 | 17.5 | 100 | 10 |
| 9 | 50 | 180 | 20 | 30 | 275 | 17.5 | 50 | 30 |
| 10 | 50 | 92.5 | 20 | 10 | 275 | 5 | 0 | 30 |
| 11 | 50 | 92.5 | 80 | 50 | 50 | 5 | 50 | 30 |
| 12 | 50 | 180 | 50 | 10 | 500 | 17.5 | 50 | 10 |
| 13 | 50 | 180 | 80 | 30 | 275 | 17.5 | 50 | 30 |
| 14 | 50 | 92.5 | 80 | 10 | 275 | 17.5 | 50 | 30 |
| 15 | 100 | 5 | 50 | 30 | 500 | 17.5 | 0 | 30 |
| 16 | 50 | 92.5 | 50 | 30 | 50 | 17.5 | 0 | 30 |
| 17 | 0 | 180 | 50 | 30 | 50 | 17.5 | 100 | 30 |
| 18 | 100 | 92.5 | 80 | 30 | 275 | 5 | 100 | 30 |
| 19 | 100 | 92.5 | 20 | 30 | 275 | 5 | 50 | 50 |
| 20 | 0 | 92.5 | 80 | 30 | 275 | 17.5 | 0 | 10 |
| 21 | 50 | 92.5 | 50 | 30 | 500 | 17.5 | 100 | 30 |
| 22 | 50 | 92.5 | 50 | 30 | 275 | 17.5 | 50 | 30 |
| 23 | 50 | 5 | 20 | 30 | 275 | 30 | 50 | 10 |
| 24 | 50 | 92.5 | 50 | 30 | 50 | 17.5 | 50 | 50 |
| 25 | 100 | 180 | 50 | 30 | 275 | 17.5 | 50 | 30 |
| 26 | 0 | 92.5 | 50 | 10 | 50 | 17.5 | 50 | 10 |
| 27 | 50 | 92.5 | 50 | 30 | 500 | 5 | 50 | 30 |
| 28 | 50 | 5 | 50 | 10 | 275 | 5 | 50 | 10 |
| 29 | 0 | 5 | 50 | 30 | 275 | 17.5 | 100 | 50 |
| HAE | UAE | |||||||
|---|---|---|---|---|---|---|---|---|
| Run | X1 EtOH (%, v/v) | X2 t (min) | X3 T (°C) | X4 S/L Ratio | X1 P (W) | X2 t (min) | X3 EtOH (%, v/v) | X4 S/L Ratio |
| 1 | 0 | 180 | 50 | 30 | 275 | 17.5 | 50 | 30 |
| 2 | 100 | 92.5 | 50 | 50 | 275 | 17.5 | 0 | 10 |
| 3 | 0 | 92.5 | 50 | 50 | 275 | 17.5 | 50 | 30 |
| 4 | 0 | 5 | 50 | 30 | 50 | 30 | 50 | 30 |
| 5 | 50 | 180 | 20 | 30 | 275 | 30 | 100 | 30 |
| 6 | 50 | 92.5 | 20 | 10 | 500 | 17.5 | 50 | 50 |
| 7 | 50 | 180 | 50 | 10 | 500 | 17.5 | 100 | 30 |
| 8 | 50 | 92.5 | 50 | 30 | 275 | 30 | 50 | 10 |
| 9 | 50 | 92.5 | 20 | 50 | 500 | 5 | 50 | 30 |
| 10 | 50 | 92.5 | 50 | 30 | 275 | 17.5 | 100 | 10 |
| 11 | 50 | 92.5 | 80 | 10 | 500 | 17.5 | 0 | 30 |
| 12 | 100 | 92.5 | 20 | 30 | 275 | 30 | 50 | 50 |
| 13 | 50 | 5 | 50 | 50 | 275 | 5 | 50 | 50 |
| 14 | 50 | 92.5 | 50 | 30 | 275 | 17.5 | 100 | 50 |
| 15 | 50 | 92.5 | 80 | 50 | 50 | 5 | 50 | 30 |
| 16 | 50 | 5 | 80 | 30 | 500 | 17.5 | 50 | 10 |
| 17 | 100 | 92.5 | 80 | 30 | 275 | 17.5 | 50 | 30 |
| 18 | 0 | 92.5 | 50 | 10 | 50 | 17.5 | 100 | 30 |
| 19 | 50 | 180 | 80 | 30 | 275 | 5 | 50 | 10 |
| 20 | 50 | 92.5 | 50 | 30 | 50 | 17.5 | 0 | 30 |
| 21 | 50 | 5 | 20 | 30 | 50 | 17.5 | 50 | 10 |
| 22 | 100 | 5 | 50 | 30 | 500 | 30 | 50 | 30 |
| 23 | 100 | 180 | 50 | 30 | 50 | 17.5 | 50 | 50 |
| 24 | 50 | 180 | 50 | 50 | 275 | 5 | 100 | 30 |
| 25 | 0 | 92.5 | 20 | 30 | 275 | 30 | 0 | 30 |
| 26 | 50 | 5 | 50 | 10 | 275 | 17.5 | 50 | 30 |
| 27 | 100 | 92.5 | 50 | 10 | 275 | 5 | 0 | 30 |
| 28 | 0 | 92.5 | 80 | 30 | 275 | 17.5 | 50 | 30 |
| 29 | 50 | 92.5 | 50 | 30 | 275 | 17.5 | 0 | 50 |
| HAE | UAE | |||||||
|---|---|---|---|---|---|---|---|---|
| Run | X1 EtOH (%, v/v) | X2 t (min) | X3 T (°C) | X4 S/L Ratio | X1 P (W) | X2 t (min) | X3 EtOH (%, v/v) | X4 S/L Ratio |
| 1 | 50 | 62.5 | 55 | 30 | 400 | 5 | 50 | 30 |
| 2 | 100 | 120 | 55 | 30 | 25 | 17.5 | 50 | 10 |
| 3 | 50 | 62.5 | 55 | 30 | 25 | 17.5 | 50 | 50 |
| 4 | 50 | 120 | 55 | 50 | 212.5 | 5 | 50 | 10 |
| 5 | 100 | 62.5 | 55 | 50 | 400 | 17.5 | 0 | 30 |
| 6 | 50 | 62.5 | 80 | 10 | 212.5 | 5 | 100 | 30 |
| 7 | 0 | 5 | 55 | 30 | 212.5 | 17.5 | 0 | 50 |
| 8 | 50 | 62.5 | 30 | 50 | 212.5 | 30 | 100 | 30 |
| 9 | 100 | 5 | 55 | 30 | 212.5 | 17.5 | 50 | 30 |
| 10 | 0 | 62.5 | 30 | 30 | 25 | 5 | 50 | 30 |
| 11 | 50 | 62.5 | 80 | 50 | 400 | 30 | 50 | 30 |
| 12 | 100 | 62.5 | 80 | 30 | 212.5 | 5 | 0 | 30 |
| 13 | 50 | 5 | 30 | 30 | 400 | 17.5 | 50 | 10 |
| 14 | 50 | 62.5 | 55 | 30 | 212.5 | 30 | 50 | 50 |
| 15 | 100 | 62.5 | 30 | 30 | 212.5 | 17.5 | 100 | 50 |
| 16 | 0 | 62.5 | 55 | 50 | 212.5 | 17.5 | 0 | 10 |
| 17 | 0 | 62.5 | 55 | 10 | 212.5 | 30 | 50 | 10 |
| 18 | 50 | 62.5 | 30 | 10 | 212.5 | 17.5 | 50 | 30 |
| 19 | 50 | 120 | 30 | 30 | 212.5 | 5 | 50 | 50 |
| 20 | 50 | 62.5 | 55 | 30 | 25 | 17.5 | 100 | 30 |
| 21 | 0 | 62.5 | 80 | 30 | 212.5 | 17.5 | 50 | 30 |
| 22 | 50 | 120 | 55 | 10 | 212.5 | 17.5 | 50 | 30 |
| 23 | 50 | 5 | 80 | 30 | 25 | 30 | 50 | 30 |
| 24 | 50 | 5 | 55 | 50 | 212.5 | 17.5 | 50 | 30 |
| 25 | 100 | 62.5 | 55 | 10 | 400 | 17.5 | 100 | 30 |
| 26 | 50 | 62.5 | 55 | 30 | 400 | 17.5 | 50 | 50 |
| 27 | 50 | 5 | 55 | 10 | 25 | 17.5 | 0 | 30 |
| 28 | 0 | 120 | 55 | 30 | 212.5 | 17.5 | 100 | 10 |
| 29 | 50 | 120 | 80 | 30 | 212.5 | 30 | 0 | 30 |
Disclaimer/Publisher’s Note: The statements, opinions and data contained in all publications are solely those of the individual author(s) and contributor(s) and not of MDPI and/or the editor(s). MDPI and/or the editor(s) disclaim responsibility for any injury to people or property resulting from any ideas, methods, instructions or products referred to in the content. |
© 2024 by the authors. Licensee MDPI, Basel, Switzerland. This article is an open access article distributed under the terms and conditions of the Creative Commons Attribution (CC BY) license (https://creativecommons.org/licenses/by/4.0/).
Share and Cite
Fernandes, F.A.; Carocho, M.; Finimundy, T.C.; Prieto, M.A.; Ferreira, I.C.F.R.; Barros, L.; Heleno, S.A. Cistus, Acacia, and Lemon verbena Valorization through Response Surface Methodology: Optimization Studies and Potential Application in the Pharmaceutical and Nutraceutical Industries. Pharmaceuticals 2024, 17, 593. https://doi.org/10.3390/ph17050593
Fernandes FA, Carocho M, Finimundy TC, Prieto MA, Ferreira ICFR, Barros L, Heleno SA. Cistus, Acacia, and Lemon verbena Valorization through Response Surface Methodology: Optimization Studies and Potential Application in the Pharmaceutical and Nutraceutical Industries. Pharmaceuticals. 2024; 17(5):593. https://doi.org/10.3390/ph17050593
Chicago/Turabian StyleFernandes, Filipa A., Márcio Carocho, Tiane C. Finimundy, Miguel A. Prieto, Isabel C. F. R. Ferreira, Lillian Barros, and Sandrina A. Heleno. 2024. "Cistus, Acacia, and Lemon verbena Valorization through Response Surface Methodology: Optimization Studies and Potential Application in the Pharmaceutical and Nutraceutical Industries" Pharmaceuticals 17, no. 5: 593. https://doi.org/10.3390/ph17050593