

Optimal Scheduling Strategy for Distribution Network with Mobile Energy Storage System and Offline Control PVs to Minimize the Solar Energy Curtailment


1
School of Electrical Engineering, Anam Campus, Korea University, 145 Anam-ro, Seoul 02841, Republic of Korea
2
Electricity Policy Research Center, Korea Electrotechnology Research Institute (KERI), Uiwang 16029, Republic of Korea
*
Author to whom correspondence should be addressed.
Energies 2024, 17(9), 2234; https://doi.org/10.3390/en17092234
Submission received: 9 April 2024
/
Revised: 30 April 2024
/
Accepted: 2 May 2024
/
Published: 6 May 2024
(This article belongs to the Special Issue Optimal Planning and Operation in RES-Rich Power Systems under Electricity and Carbon Emission Market Environment)
Abstract
:As offline control photovoltaic (PV) plants are not equipped with online communication and remote control systems, they cannot adjust their power in real-time. Therefore, in a distribution network saturated with offline control PVs, the distribution system operator (DSO) should schedule the distributed energy resources (DERs) considering the uncertainty of renewable energy to prevent curtailment due to overvoltage. This paper presents a day-ahead network operation strategy using a mobile energy storage system (MESS) and offline control PVs to minimize power curtailment. The MESS model efficiently considers the transportation time and power loss of the MESS, and models various operating modes, such as the charging, discharging, idle, and moving modes. The optimization problem is formulated based on mixed-integer linear programming (MILP) considering the spatial and temporal operation constraints of MESSs and is performed using chanced constrained optimal power flow (CC-OPF). The upper limits for offline control PVs are set based on the probabilistic approach, thus mitigating overvoltage due to forecasting errors. The proposed operation strategy was tested in the IEEE 33-node distribution system coupled with a 15-node transportation system. The test results show the effectiveness of the proposed method for minimizing curtailment in offline control PVs.
1. Introduction
Over the last decade, the penetration of renewable energy resources (RESs) in a distribution grid has dramatically increased in many countries across the world. However, integration of the distributed and highly uncertain generation from RESs into the distribution grid poses several challenges for grid planning and operation. System operators (SOs) have faced several system security and quality problems, such as voltage rise, congestion, stability, and low flexibility [1,2,3,4]. These problems have inevitably caused a percentage of renewable energy generation to be cut off.
Fast-developing energy storage technology could offer carbon-free power system operations with a fast response, improving flexibility and stability of the system, while enabling high efficiency, a long life cycle, and low maintenance. Energy storage types are classified into four technologies for grid-scale applications including electrical, mechanical, chemical, and thermal [5,6]. Mechanical storage systems, such as pumped-hydro and compressed-air, are the most widely adopted type of energy storage system, accounting for 99% of the worldwide storage capacity [7]. However, these systems have strict locational requirements, which hinder their widespread development. Battery-based energy storage technologies have emerged as the most promising technologies for grid-scale storage with the increasing penetration of renewable energy [8,9]. It can help to mitigate system uncertainties and ensure the stable and reliable operation of power grids with a high share of renewable energy in the electricity generation portfolio. However, an intelligent operation strategy is required to maximize the benefits offered by battery energy storage systems (BESSs), as such devices are expensive and have limited energy resources. Different operation strategies perform the scheduling of different objective functions (e.g., maximizing profit and system reliability, minimizing power loss and operating costs), subject to the system operation constraints (e.g., system constraints, charging/discharging limit, energy limit, and power rating) [10,11,12,13,14].
In recent years, the application of battery-based energy storage for transportation in power systems has been introduced and studied extensively. Mobile energy storage systems (MESSs) are a mobile and transportable storage technology, consisting of battery cells and a power converter carried on a truck [15]. This resource is flexible both spatially and temporally, being free from spatial constraints unlikely in traditional energy storage systems. It is a powerful tool that can enhance system reliability and respond flexibly and rapidly to digesters or system uncertainties. MESSs can be positioned prior to a disaster for emergency power supply and can be re-positioned after the disaster to maximize the system restoration time [16]. The researchers in [17] and [18] used the MESSs to realize optimal energy allocation in emergency situations. The distribution system is reconfigured to change the network topology using MESS. In [7], system restoration was further considered along with the routing and scheduling of MESSs. MESS investment and relocating strategies were proposed in [19] to minimize the load shedding under emergency conditions. The critical load restoration method was proposed in [20] to select the optimal position of MESSs along with a network topology and a load switching sequence for power grids. The researcher in [21] used the mobile energy resource to perform energy management in the island group.
The spatial and temporal operation of MESSs can also offer various benefits for grid operation, such as congestion management, grid security enhancement, profit improvement, expansion deferral, and uncertainty mitigation of RES. System operators have sought to directly own and operate MESS under various operational conditions within distribution and transportation systems. In [22], MESSs were treated as the alternative to reduce transmission congestion in power systems with high renewable penetration, proposing a transmission planning using both mobile and stationary storage resources. The reliability assessment of distribution system with MESSs was developed using an analytic approach based on Markov models [23]. In [24], MESSs were used to alleviate the impact of photovoltaic fluctuations on distribution networks and to postpone equipment upgrades. An optimization framework that can be performed under the realistic operation conditions of distribution system was proposed in [25]. This framework proposes an optimal scheduling algorithm for MESS to minimize the EV waiting at a charging station. A day-ahead optimization method for MESS operation was introduced in [26] to improve the profit of the DSO while maintaining a normal voltage profile along the distribution feeder. Stochastic scheduling of power systems with wind farms was proposed in [27], which can alleviate wind energy curtailment and reduce operating costs. The author in [28] focused on the MESS optimal scheduling in a distribution grid with wind and PV units to mitigate renewable energy curtailment.
The curtailment of RES in the distribution grid is expected to worsen as reinforcement and investment in the distribution network are delayed. In particular, offline-controlled PVs can be easily tripped to solve overvoltage issues due to the uncertain production from RESs because these resources are not equipped with online communication and remote control systems. The MESS is an effective energy storage technology that can contribute to solving the energy curtailment problems of RESs caused by voltage rises during different periods at different locations. In many previous research works, MESS-based operation strategies have been studied to minimize RES curtailment in distribution grids. However, based on the current literature, optimal scheduling and energy management approaches that can minimize RES curtailment in distribution grids with high penetration offline control PVs have not yet been developed. This paper presents a day-ahead operation strategy using MESS and offline control PVs to minimize PV energy curtailment in distribution grids with a high penetration of offline control units. The spatial and temporal operation model for the MESS efficiently accounts for power loss during transportation was developed. This model includes various operating modes, such as the charging, discharging, idle, and moving mode. The reactive power of the MESS was linearized using the circular constraint linearization method. Day-ahead offline control for PVs was performed considering forecasting errors. The proposed operation strategy was integrated into the linearized DistFlow algorithm to minimize curtailment and was solved using the MILP optimization model. The contributions of this paper can be summarized as below:
- Day-ahead offline control for PVs is implemented to mitigate the PV trips resulting from uncertainties in renewable energy. This day-ahead offline control is pre-determined based on a probabilistic approach to respond to unexpected voltage rises because offline control units cannot adjust the upper limit in real-time.
- CC-OPF is used to minimize energy curtailment considering soft chance constraints related to voltage, which can ensure that the system conditions are not below the confidence level. This can lead to moving the MESS to nodes with overvoltage risk to minimize energy curtailment due to overvoltage.
- The energy and transportation scheduling is performed to minimize total operating costs considering the cooperative operation of MESS and offline control PVs. The proposed method can significantly reduce PV production curtailment in forecasting error scenarios, while hardly increasing the operating costs of DSO in the base case scenario without forecasting errors.
The rest of this paper is organized as follows: Section 2 introduces the mathematical model for offline control PV and MESS. In Section 3, the proposed optimization model is formulated considering spatial and temporal operating conditions. Section 4 presents case studies on the IEEE 33-node distribution system coupled with a 15-node transportation system. Finally, the conclusions are drawn in Section 5.
2. Mathematical Modeling
2.1. Offline Control PV Model
In this study, offline control PVs are defined as solar PVs that cannot adjust their power output in real-time to satisfy the electricity demand or system limits. They are not equipped with an online communication and remote control system; thus they cannot change the upper limit in real-time. Therefore, the system operator should request day-ahead curtailment to adjust offline control PV owners to manually change the upper limit if PV curtailment is expected to be required [29]. Figure 1 shows a day-ahead offline control of PVs to prevent generator trips due to overvoltage. The black dashed line is a day-ahead forecasted output and a red dashed line is the upper limit of PV output to prevent overvoltage due to an oversupply at the node. In a network with high output uncertainty, day-ahead offline control may cause curtailment due to the upper limit of the output, but it can alleviate total energy curtailment because it can prevent PV trips due to voltage rises. If the upper limit is lower than the power output before energy curtailment, the PV output is reduced by the upper limit. On the other hand, if the upper limit is higher than the power output before energy curtailment, the PV output does not curtail. The PV output with the upper limit can be modeled in Equation (1).
where is the power output of PV at node at time , is upper limit offline control PV output at node at time , is the power output of offline PV before energy curtailment at node at time .
If the upper limit is lower than the forecasted output, the energy abandonment can be computed by the forecasted output from the upper limit. Second, energy abandonment due to overvoltage is equal to total energy at a node with overvoltage because offline control PVs cannot adjust their output in real-time.
2.2. The MESS Model
MESSs can be described as the mobilized grid-scale battery systems employed in power systems [4]. They consist of an energy storage system carried on a truck. MESSs can be operated in moving mode, as well as in charging, discharging, or idle mode, which are operating modes of traditional stationary energy storage systems (SESSs) [30,31]. Figure 2 illustrates the characteristics of spatiotemporal MESS mobility in a transportation network. The vertical axis in Figure 2 denotes the MESS station, and the horizon axis represents the time span. S1, S2, S3, and S4 are locations with MESS charging stations, and the MESS can only connect nodes with charging stations. There are four possible mobility states: S1→S1, S1→S2, S1→S3, and S1→S4 during the initial period. The solid lines represent the determined path during each time period, while the dashed lines are the possible mobility paths during each time period.
The spatiotemporal status of the MESS can be described from the binary variables. The binary variables in this paper are classified into four statuses, such as the charging, discharging, idle, and moving modes. The idle mode means that the MESS waits at the connected node before charging, discharging, or moving. The location of the MESS can be can be expressed as Equation (2). It means that MESS can only connect to one position. The MESS initially operates based on a pre-determined spatiotemporal status. It should be relocated to this status at the end of the scheduling period. This paper assumes that the initial and final locations of the MESS should be connected to node 1, as expressed in Equations (3) and (4).
where are the binary variables indicating the connection statues of MESS at node at time , are the initial scheduling period, and is the final period.
The charging and discharging power of MESS can only be provided if MESS is connected to nodes, as expressed in Equation (5).
where and are the binary variables describing the charging and discharging statues of MESS at node at time .
MESS can travel between nodes with a charging station, and the transportation of MESS from node to node can be modeled by Equations (6) and (7). Equation (6) means that the total travel time is required to transport between to node . Equation (7) means that a non-connection time of MESS cannot be longer than the .
The transportation path is modeled by Equations (8) and (9). This means that the MESS is located at node at time and has moved to node at time . The minimum number of moving modes is limited by Equation (10).
where means the transportation path, which MESS departures at node at time to node .
3. Problem Formulation
3.1. Objective Function
The proposed mathematical operation model for MESS is integrated into the energy scheduling of the distribution network [32,33,34]. The problem formulation is described using the DistFlow algorithm and is solved using mixed integer linear programming [19,25]. The objective of the proposed approach is to minimize the total operation costs of the distribution network. The operation costs include the electricity purchase cost from upstream grids, the cost of the energy supplied by PV, and the charging/discharging costs of the MESS, which is stated as:
where is active power purchased from upstream gird at time , is the binary variable indicating PV trip at node at time , is charging power of MESS at node at time , is discharging power of MESS at node at time , and is the electric price at time .
3.2. Charging and Discharging of the MESS
The power of the MESS can be described using two mutually exclusive terms, charging and discharging. This means that the power of the MESS cannot be charged and discharged simultaneously. The active power is limited by Equations (12) and (13), and they are defined using two binary variables such that the two conditions cannot occur at the same time. The reactive power is limited from Equation (14). The net active power injected from the battery same as the difference between its charging and discharging power and is represented in Equation (15). The sum of active and reactive power in both the charge and discharge modes cannot be greater than the rated power of the battery, and this condition is imposed in Equation (16). Equations (17) and (18) are the sum of the charging and discharging power of MESS at time .
where and are maximum and minimum charging active power of MESS , and are maximum and minimum discharging active power of MESS , is maximum charging reactive power of MESS , and are net active and net reactive power of MESS at node at time , and is maximum allowable MESS power rating.
To avoid the non-linearity of the MESS model based on Equation (16), this constraint is substituted by Equations (19) and (20). Two constraints are approximated using the circular constraint linearization method, as shown in Figure 3 [35]. The vertical axis ‘P’ in Figure 3 represents the active power, and the horizontal axis ‘Q’ represents the reactive power. The radius of the circle ‘S’ represents the maximum allowable power rating.
The stored energy in the battery during any period is a function of the previously stored energy and the net energy transacted in the current period. It is equal to the stored energy during the previous period, the energy charge and discharge during the present period, and the energy loss due to movement during the present period. The stored energy should be limited between the upper and lower bounds. Finally, the state of charge (SOC) at the end of the time periods must equal the initial conditions. These constraints are modeled in Equations (21)–(23).
where is the SOC of MESS at time , is maximum energy content of MESS , is minimum energy content of MESS , is charging efficiency of MESS , is discharging efficiency of MESS , is energy loss due to travel of MESS between different nodes.
3.3. The System Constraints
The power flow in a radial distribution network is derived from a set of recursive equations, called the DistFlow method [19,25]. The active power, reactive power, and voltage magnitude at the sending end of the branch are used to represent the same quantities at the receiving end of a branch, as below:
where is active power flow on branch at time , is reactive power flow on branch at time , is reactive power of compensator at node at time , is resistance of branch , is reactance of branch , is voltage at node at time , is active load at node at time , is reactive load at node at time .
Equations (24)–(26) should be approximated to overcome the quadratic terms. Some tolerable assumptions and simplifications are applied in the linearization process. First, the branch losses, which are non-linear terms, can be ignored in the DistFlow equations when the non-linear terms are much smaller than the branch flows. Second, it is assumed that the voltage deviation at each bus is very small and can be neglected. Then, the linearized DistFlow equations are expressed in Equations (27) and (28). The lower and upper voltages are limited in Equation (30). The active and reactive power supplied from the upstream grid is represented by Equations (31) and (32), respectively. The voltage magnitude of the substation bus is always valued as 1.0 p.u. according to Equation (33). The active power supplied from PVs can be modeled as Equation (34) and can be tripped to prevent overvoltage at the node by a binary variable.
where is the maximum voltage limit at node , is the minimum voltage limit at node , is the maximum active power supplied from upstream grid, is the minimum active power purchased from upstream grid, is the maximum reactive power supplied from upstream grid, is the minimum reactive power supplied from upstream grid, is a voltage of substation node at time .
3.4. Chance-Constraints
Chance-constrained optimal power flow (CC-OPF) is used to deal with the uncertainties of power injections [36,37]. Chance constraints are used to ensure that the system risks are not below the confidence level. This paper only considers soft constraints related to voltage, and the remaining constraints are reflected as deterministic constraints. The confidence level can be determined using analysis to minimize total energy curtailment. Then, the voltage constraints in Equations (35) and (36) can be rewritten using acceptable violation probability of voltage as:
4. Proposed Algorithm
In distribution networks with a high penetration of offline control PVs, the optimal operation must be performed considering the day-ahead curtailment request, as offline control PVs cannot adjust the upper limit in real-time. The PV output can be excessively curtailed if a strict upper limit of the output is applied, while the generator can be tripped due to overvoltage if the upper limit of the output is relaxed. This paper computes an upper limit determined by the probabilistic method that considers output uncertainty. First, the state of the MESS is pre-determined by the optimization problem based on forecasting data. Second, Monte Carlo simulation (MCS) is used to generate a large number of scenarios [38]. Third, optimal power flow (OPF) without voltage constraints in each scenario is performed to determine the voltage distribution. If there is a node with a voltage violation in each scenario, MESS charge to manage voltage rising using the voltage sensitivity in Equation (37). After this, if overvoltage still occurs, the PV is curtailed to bring the voltage back down to the reference voltage level, as outlined in Equation (38). Fourth, the day-ahead curtailment requirement of offline control PVs is computed using the forecasted output and curtailment to alleviate voltage to the reference level in each scenario, and it is expressed as in Equation (39). Finally, optimal operation with day-ahead curtailment is implemented to consider renewable energy uncertainty [39]. Figure 4 summarizes the overall process of the proposed scheduling strategy, taking into account the MESS and offline control PVs.
where is an initial voltage at node at time in scenario , is PV energy curtailment to alleviate the voltage to the reference voltage level at node at time in scenario , is the time when curtailment occurs most frequently, is the scenario where overvoltage occurs. and are the number of scenarios and nodes, respectively.
5. Case Study
Simulation was performed on an IEEE 33-bus distribution system and a 15-node transportation system, as shown in Figure 5 [25]. These coupled systems include 33 nodes, 6 offline control PVs, 34 lines, 4 reactive power compensators, 32 loads, and 6 charging stations. The line, load, and system data can be found in [40]. The offline control PVs were located at buses 8, 10, 18, 25, 30, and 33. The hourly profile of the offline control PVs is shown in Figure 6. The details of the reactive power compensator are presented in Table 1. The system was equipped with 500 kW and 1000 kWh MESS with charging stations at buses 1, 3, 6, 12, 20, 24, and 31 [26]. The battery charging and discharging efficiencies were equal to 0.95 and the initial location was bus 1. The initial, minimum, and maximum SOCs were 0.5, 0.2, and 0.8, respectively. The traveling efficiency was set to and the traveling time was assumed to be 3 min/km. MCS was used to generate 1000 random scenarios to compute the day-ahead curtailment. The simulations were implemented on an Intel(R) Core(TM) I7-970 CPU with 8 GB memory. The optimization problem was solved using the MILP solver within MATLAB R2020b. This study considers four cases to compare the results of the operating costs and expected curtailment:
- Case 1: OPF without day-ahead curtailment;
- Case 2: OPF with day-ahead curtailment;
- Case 3: CC-OPF without day-ahead curtailment;
- Case 4: CC-OPF with day-ahead curtailment.
The main results for the transportation schedule of the MESS are presented in Figure 7. The initial and final positions of the MESS were located on bus 1 in all four cases. The MESS in Case 1 moved to station 3 at hour 6, station 2 at hour 16, and station 1 at hour 21. In Case 2, the MESS moved to station 3 at hour 11, station 2 at hour 16, station 1 at hour 22. The MESS in these cases was mainly placed around bus 1 to minimize the power loss due to movement of the MESS because they did not consider the overvoltage risk due to output uncertainty. On the other hand, in Cases 3 and 4, it can be confirmed that MESS was located at station 4, near the node at the overvoltage risk due to high PV output between hours 12 and 15. The MESS in Case 3 moved to station 2 at hour 2, station 3 at hour 9, station 4 at hour 22, and station 1 at hour 14. The MESS in Case 4 moved to station 4 at hour 12, station 3 at hour 16, station 2 at hour 21, and station 1 at hour 23. They used CC-OPF for distribution network scheduling and set strict voltage limits to keep the overvoltage risk below a certain probability. Therefore, the MESS was located at station 4, which has high voltage sensitivity for voltage management during high PV output periods. Table 2 shows the hourly operating mode of the MESS. The operating mode of the MESS was classified into charging, discharging, idle, and moving modes. The operating mode pattern in all four cases is similar because the MESS operated to obtain revenue from SMP arbitrage. This means that the two optimization problems had a greater impact on the MESS’s travel paths rather than the operating mode.
Detailed results of the MESS operating schedule, such as the charge, discharge, and SOC, are given in Figure 8. It can be seen that the SOC of the MESS increased as the MESS charged power, and decreased as the MESS discharged power and movement loss. The initial and final SOCs of the MESS were fixed at 50% by the SOC constraints. The optimization problem was solved to minimize the operating costs of the distribution network. In all four cases, the active power was mainly charged at hours 4–5 and 13–15, which were low SMP periods, and discharged at hours 1, 8, 10, and 20, which were high SMP periods. The reactive power was mainly charged and discharged to maintain the voltage. The MESS mainly charged reactive power during daytime hours when the voltage was high due to the PV output, and discharged reactive power mainly during dawn hours when the voltage was low owing to demand. However, Cases 3 and 4 tended to charge more reactive power than Cases 1 and 2 from hours 13 to 15 when overvoltage was expected. This was the result of strict voltage constraints in the optimization problems using CC-OPF.
To analyze the impact of renewable energy uncertainty on the distribution network, the results of the voltage profile in the four cases were compared. The base scenario was forecasting data without forecasting error. The other scenarios were analyzed with a range of forecast errors from +0.5 to +2.0 in 0.5 increments. Figure 9 shows the voltage profiles at hour 14 in the four cases and five scenarios. As shown in Figure 9a, it can be confirmed that overvoltage occurred in all scenarios except the base scenario. The most vulnerable node to overvoltage was node 18, and the voltages in each scenario were 1.050, 1.052, 1.054, 1.056, and 1.058, respectively. The MESS in Case 1 was located at station 2, which had low voltage sensitivity to node 18, and did not help mitigate overvoltage. Case 2 with day-ahead curtailment had a slightly lower overvoltage than Case 1, but it has been confirmed that there was still a overvoltage risk. The voltage of node 18 represents 1.050, 1.051, 1.052, 1.053, and 1.054 in the Case 2. On the other hand, in Case 3 and 4, MESS was located at station 4, which had high voltage sensitivity for nodes 18 and 33. As shown in Figure 9c, it can be seen that overvoltage occurred only at node 33. The voltage at node 33 represents 1.044, 1.046, 1.048, 1.050, and 1.052, respectively. This means that the travel schedule of the MESS can have a great impact on overvoltage relaxation. Finally, Figure 9d shows that overvoltage did not occur in all scenarios at hour 14. As a result, it means that appropriate day-ahead curtailment and MESS operation can help ensure stable network operation against renewable energy uncertainty.
Table 3 shows the operating costs of the distribution network in the four cases. It is based on forecast data, assuming that there was no forecast error. The operating costs in each case were KRW15,811,261, KRW15,815,593, KRW15,813,446, and KRW15,817,811, respectively. In Case 2, the solar output was lower than in Case 1 owing to the tight upper limit of PVs, and the operating cost was more than KRW4332. Case 3 had a KRW2185 higher operating cost than Case 1, which was mainly caused by the movement loss of the MESS. Finally, Case 4 had a KRW6550 higher operating cost compared to Case 1, which was related to the upper limit of the PVs and the movement loss of the MESS.
This paper also conducted simulations to quantify the curtailment by forecasting error. The curtailment was divided into power generation tripping to remove the overvoltage caused by the forecasting error and the output reduction caused by the upper limit of offline control PVs. Table 4 shows the results of the curtailment and operating costs in the four cases and five forecasting error scenarios. Case 1, which applied OPF without day-ahead curtailment, had no curtailment due to the upper limit. However, this case did not help resolve the overvoltage due to forecasting error as MESS was far from the bus, which was vulnerable to overvoltage. The total curtailments represent 0, 1186, 1236, 1262, and 2000 kW, respectively. Case 2 was eased more than Case 1 because the upper limit was applied to the offline control PVs. The total curtailments were 22, 828, 1290, 1406, and 2212 kW, respectively. The total curtailment in Case 3 only occurred for forecasting errors of +1.5 and +2.0 and the amount of curtailment was 1201 and 2000 kW, respectively. Finally, the total curtailments of Case 4 were 22, 51, 79, 149, and 1339 kW, respectively. The curtailment caused by PV tripping only occurred in the forecasting error +2.0 scenario, and the value was 1110 kW. In Cases 3 and 4 using CC-OPF, the MESS was located at station 4 during periods of high PV output to alleviate overvoltage, which greatly reduced curtailment due to PV tripping compared to Cases 1 and 2. In particular, Case 4, which is the proposed method, sets the upper limit of offline control PV output to cope with overvoltage due to renewable energy uncertainty and can significantly reduce the overvoltage risk. As shown in Table 4, it reduced the curtailment due to overvoltage to 0 kW in the forecasting error +1.5 scenario, which was reduced by approximately 1262, 1258, and 1201 kW compared to Cases 1, 2, and 3, respectively. Therefore, the proposed method can greatly reduce the total curtailment in scenarios with forecasting error while the operating costs in the base scenario hardly increase compared to other methods.
6. Conclusions
This paper presented an optimal scheduling strategy for distribution networks saturated with offline control units. Offline control PVs are not equipped with online communication and remote control systems, as they were mainly included into the grid before facility obligation regulation were enacted. This means that offline-controlled PVs can be easily tripped in distribution networks because it is difficult to respond in real time to overvoltage caused by renewable energy uncertainty. Therefore, DSOs must operate the distribution network considering renewable energy uncertainty to minimize PV power curtailment due to overvoltage. The proposed method uses CC-OPF with upper limits for offline control PVs to maintain the overvoltage risk below a certain probability. In addition, the proposed method can prevent PV tripping due to overvoltage by moving and charging the MESS to nodes with high voltage sensitivity. Several case studies were performed on IEEE 33-bus distribution test system and 15-bus transportation system to verify the performance of the proposed method. The results show that the proposed operation scheduling strategy can reduce curtailment for PVs due to renewable energy uncertainty.
In future work, we plan to verify the performance of the proposed operation scheduling strategy in distribution grids equipped with various DERs, such as wind farms, ESSs, and demand response resources. In addition, the proposed method can be expanded to operation strategies in distribution networks with system problems such as line congestion and overvoltage.
Author Contributions
Conceptualization, S.K. and J.L.; formal analysis, S.K.; funding acquisition, J.L.; methodology, S.K.; supervision, J.L.; visualization, S.K.; writing—original draft, S.K.; writing—review and editing, J.L. All authors have read and agreed to the published version of the manuscript.
Funding
This research received no external funding.
Data Availability Statement
The original contribution presented in the study are included in the article, further inquiries can be directed to the corresponding author.
Acknowledgments
This research was supported by Korea Electrotechnology Research Institute (KERI) Primary research program through the National Research Council of Science & Technology (NST) funded by the Ministry of Science and ICT (MSIT) (No. 24A01044).
Conflicts of Interest
The authors declare no conflicts of interest.
References
- Sexauer, J.M.; Mohagheghi, S. Voltage quality assessment in a distribution system with distributed generation—A probabilistic load flow approach. IEEE Trans. Power Deliv. 2013, 28, 1652–1662. [Google Scholar] [CrossRef]
- Kim, D.; Kim, J.-C.; Su, Q.; Joo, S.-K. Electricity blackout and its ripple effects: Examining liquidity and information asymmetry in U.S. financial markets. Energies 2023, 16, 4939. [Google Scholar] [CrossRef]
- Lee, D.; Lee, D.; Jang, H.; Joo, S.-K. Backup capacity planning considering short-term variability of renewable energy resources in a power system. Electronics 2021, 10, 709. [Google Scholar] [CrossRef]
- Kim, S.; Joo, S.K. Transmission pricing incorporating the impact of system fault and renewable energy uncertainty on the transmission margin. IEEE Access 2023, 11, 103779–103789. [Google Scholar] [CrossRef]
- Chen, H.; Cong, T.N.; Yang, W.; Tan, C.; Li, Y.; Ding, Y. Progress in electrical energy storage system: A critical review. Prog. Nat. Sci. 2009, 19, 291–312. [Google Scholar] [CrossRef]
- Cha, J.-W.; Joo, S.-K. Probabilistic short-term load forecasting incorporating behind-the-meter (BTM) photovoltaic (PV) generation and battery energy storage systems (BESSs). Energies 2021, 14, 7067. [Google Scholar] [CrossRef]
- Sun, Y.; Li, Z.; Shahidehpour, M.; Ai, B. Battery-based Energy Storage Transportation for Enhancing Power System Economics and Security Country. IEEE Trans. Smart Grid 2009, 19, 291–312. [Google Scholar]
- Divya, K.C.; Østergaard, J. Battery energy storage technology for power systems—An overview. Electr. Power Syst. Res. 2009, 19, 511–520. [Google Scholar] [CrossRef]
- Zhao, H.; Wu, Q.; Hu, S.; Xu, H.; Rasmussen, C.N. Review of energy storage system for wind power integration support. Appl. Energy 2015, 137, 545–553. [Google Scholar] [CrossRef]
- Ding, H.; Hu, Z.; Song, Y. Value of the energy storage system in an electric bus fast charging station. Appl. Energy 2015, 157, 630–639. [Google Scholar] [CrossRef]
- Li, C.; Yang, H.; Shahidehpour, M.; Xu, Z.; Zhou, B.; Cao, Y.; Zeng, L. Optimal planning of islanded integrated energy system with solar-biogas energy supply. IEEE Trans. Sustain. Energy 2020, 11, 2437–2448. [Google Scholar] [CrossRef]
- Jian, L.; Hu, Z.; David, B.; Zhao, Y.; Wang, Z. The future of energy storage shaped by electric vehicles: A perspective from China. Energy 2018, 154, 249–257. [Google Scholar] [CrossRef]
- Mohammad, J.; Behnam, M.-I.; Mousa, M.; Pierluigi, S. Short-term self-scheduling of virtual energy hub plant within thermal energy market. IEEE Trans. Ind. Electron. 2021, 68, 3124–3136. [Google Scholar]
- Xu, D.; Zhou, B.; Wu, Q.; Chung, C.Y.; Li, C.; Huang, S.; Chen, S. Integrated modelling and enhanced utilization of power-to-ammonia for high renewable penetrated multi-energy systems. IEEE Trans. Power Syst. 2020, 35, 4769–4780. [Google Scholar] [CrossRef]
- Abdeltawab, H.H.; Mohamed, Y.A.R.I. Mobile energy storage scheduling and operation in active distribution systems. IEEE Trans. Ind. Electron. 2017, 64, 6828–6840. [Google Scholar] [CrossRef]
- Lei, S.; Wang, J.; Chen, C.; Hou, Y. Mobile emergency generator prepositioning and real-time allocation for resilient response to natural disaster. IEEE Trans. Smart Grid 2018, 9, 2030–2041. [Google Scholar]
- Prabawa, P.; Choi, D.H. Multi-agent framework for service restoration in distribution systems with distributed generators and static/mobile energy storage systems. IEEE Access 2020, 8, 51736–51752. [Google Scholar] [CrossRef]
- Yao, S.; Wang, P.; Zhao, T. Transportable energy storage for more resilient distribution systems with multiple microgrids. IEEE Trans. Smart Grid 2019, 10, 3331–3341. [Google Scholar] [CrossRef]
- Gao, H.; Chen, Y.; Mei, S.; Huang, S.; Xu, Y. Resilience oriented pre-hurricane resource allocation in distribution systems considering electric buses. Proc. IEEE 2017, 105, 1214–1233. [Google Scholar] [CrossRef]
- Lei, S.; Chen, C.; Zhou, H.; Hou, Y. Routing and scheduling of mobile power sources for distribution system resilience enhancement. IEEE Trans. Smart Grid 2019, 10, 5650–5662. [Google Scholar] [CrossRef]
- Yang, L.; Li, X.; Sun, M.; Sun, C. Hybrid policy-based reinforcement learning of adaptive energy management for the energy transmission-constrained island group. IEEE Trans. Ind. Inform. 2020, 16, 6423–6432. [Google Scholar] [CrossRef]
- Pulazza, G.; Zhang, N.; Kang, C.; Nucci, C.A. Transmission planning with battery-based energy storage transportation for power systems with high penetration of renewable energy. IEEE Trans. Power Syst. 2021, 36, 4928–4940. [Google Scholar] [CrossRef]
- Chen, Y.; Zheng, Y.; Luo, F.; Wen, J.; Xu, Z. Reliability evaluation of distribution systems with mobile energy storage systems. IET Renew. Power Gener. 2009, 3, 783–791. [Google Scholar] [CrossRef]
- Kim, J.; Dvorkin, Y. Enhancing distribution resilience with mobile energy storage: A progressive hedging approach. In Proceedings of the Power & Energy Society General Meeting 2018 IEEE, Portland, OR, USA, 5–10 August 2018. [Google Scholar]
- Jeon, S.; Choi, D.H. Optimal energy management framework for truck-mounted mobile charging stations considering power distribution system operating conditions. Sensors 2021, 21, 2798. [Google Scholar] [CrossRef] [PubMed]
- Saboori, H.; Jadid, S.; Savaghebi, M. Spatio-temporal and power–energy scheduling of mobile battery storage for mitigating wind and solar energy curtailment in distribution networks. Energies 2021, 14, 4853. [Google Scholar] [CrossRef]
- Yang, S.N.; Wang, H.W.; Gan, C.H.; Lin, Y.B. Mobile charging station service in smart grid networks. In Proceedings of the International Conference on Smart Grid Communications 2018 IEEE, Tainan, Taiwan, 5–8 November 2012. [Google Scholar]
- Sun, Y.; Zhong, J.; Li, Z.; Tian, W.; Shahidehpour, M. Stochastic scheduling of battery-based energy storage transportation system with the penetration of wind power. IEEE Trans. Sustain. Energy 2017, 8, 135–144. [Google Scholar] [CrossRef]
- Ogimoto, K.; Wani, H. Making renewables work: Operational practices and future challenges for renewable energy as a major power source in Japan. IEEE Power Energy Mag. 2020, 18, 47–63. [Google Scholar] [CrossRef]
- Chen, T.; Xu, X.; Wang, H.; Yan, Z. Routing and scheduling of mobile energy storage system for electricity arbitrage based on two-layer deep reinforcement learning. IEEE Trans. Transp. Electrif. 2023, 9, 1087–1102. [Google Scholar] [CrossRef]
- Tao, Y.; Qiu, J.; Lai, S. A learning and operation planning method for uber energy storage system: Order dispatch. IEEE Trans. Intell. Transp. Syst. 2022, 12, 23070–23083. [Google Scholar] [CrossRef]
- Sun, W.; Qiao, Y.; Liu, W. Economic scheduling of mobile energy storage in distribution networks based on equivalent reconfiguration method. Sustain. Energy Grids Netw. 2022, 32, 100879. [Google Scholar] [CrossRef]
- Samara, S.; Shaaban, M.F.; Osman, A.H. Optimal management of mobile energy generation and storage systems. IEEE Access 2020, 8, 203890–203900. [Google Scholar] [CrossRef]
- Abdeltawab, H.; Mohamed, Y.A.R.I. Mobile energy storage sizing and allocation for multi-services in power distribution systems. IEEE Access 2019, 7, 176613–176623. [Google Scholar] [CrossRef]
- Chen, X.; Wu, W.; Zhang, B. Robust restoration method for active distribution networks. IEEE Trans. Power Syst. 2016, 31, 4005–4015. [Google Scholar] [CrossRef]
- Li, H.; Zhang, Z.; Yin, X.; Zhang, B. Preventive security-constrained optimal power flow with probabilistic guarantees. Energies 2020, 13, 2344. [Google Scholar] [CrossRef]
- Schmidli, J.; Roald, L.; Chatzivasileiadis, S.; Andersson, G. Stochastic AC optimal power flow with approximate chance-constraints. In Proceedings of the Power & Energy Society General Meeting 2016 IEEE, Boston, MA, USA, 17–21 July 2016. [Google Scholar]
- An, J.; Kim, D.-K.; Lee, J.; Joo, S.-K. Least squares monte carlo simulation-based decision-making method for photovoltaic investment in Korea. Sustainability 2021, 13, 10613. [Google Scholar] [CrossRef]
- Lee, J.; Lee, J.; Wi, Y.-M.I. Impact of revised time of use tariff on variable renewable energy curtailment on Jeju island. Electronics 2021, 10, 135. [Google Scholar] [CrossRef]
- Dolatabadi, S.H.; Ghorbanian, M.; Siano, P.; Hatziargyriou, N.D. An enhanced IEEE 33 bus benchmark test system for distribution system studies. IEEE Trans. Power Syst. 2021, 36, 2565–2572. [Google Scholar] [CrossRef]
Figure 1.
Spatial–temporal movement of MESS.
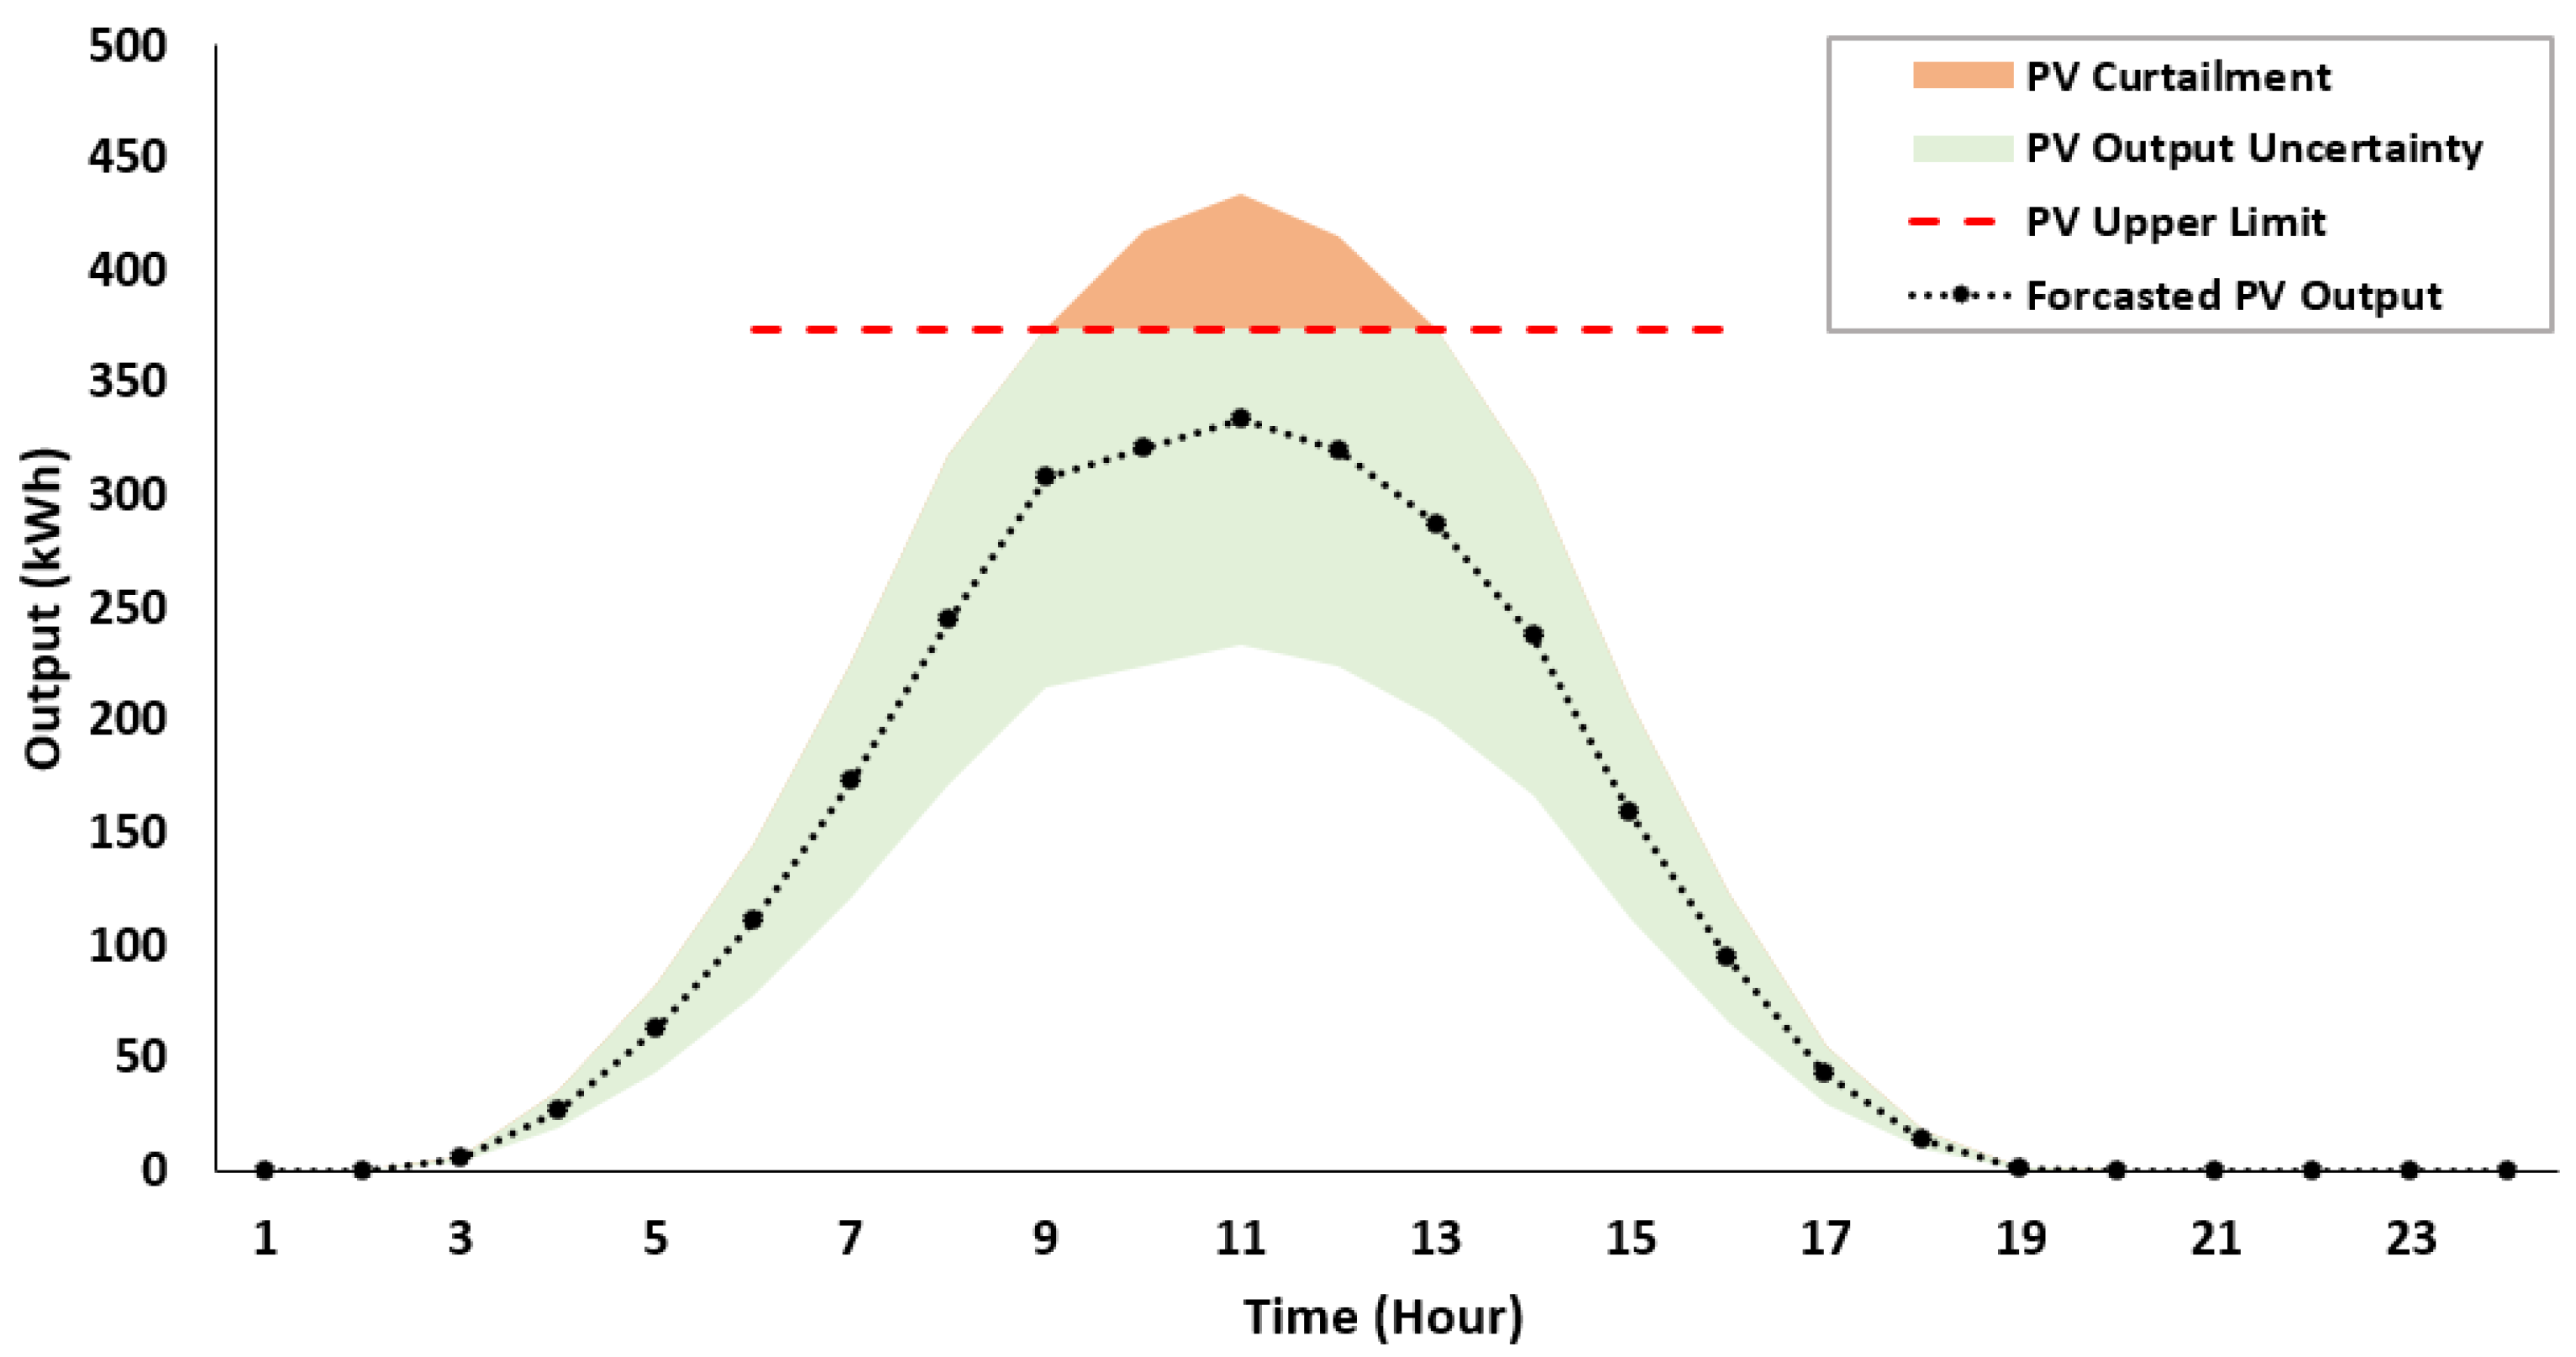
Figure 2.
Spatial–temporal movement of MESSs.

Figure 3.
Circular constraint linearization method.

Figure 4.
The overall process of proposed scheduling strategy.

Figure 5.
Distribution and transportation network for the case studies.
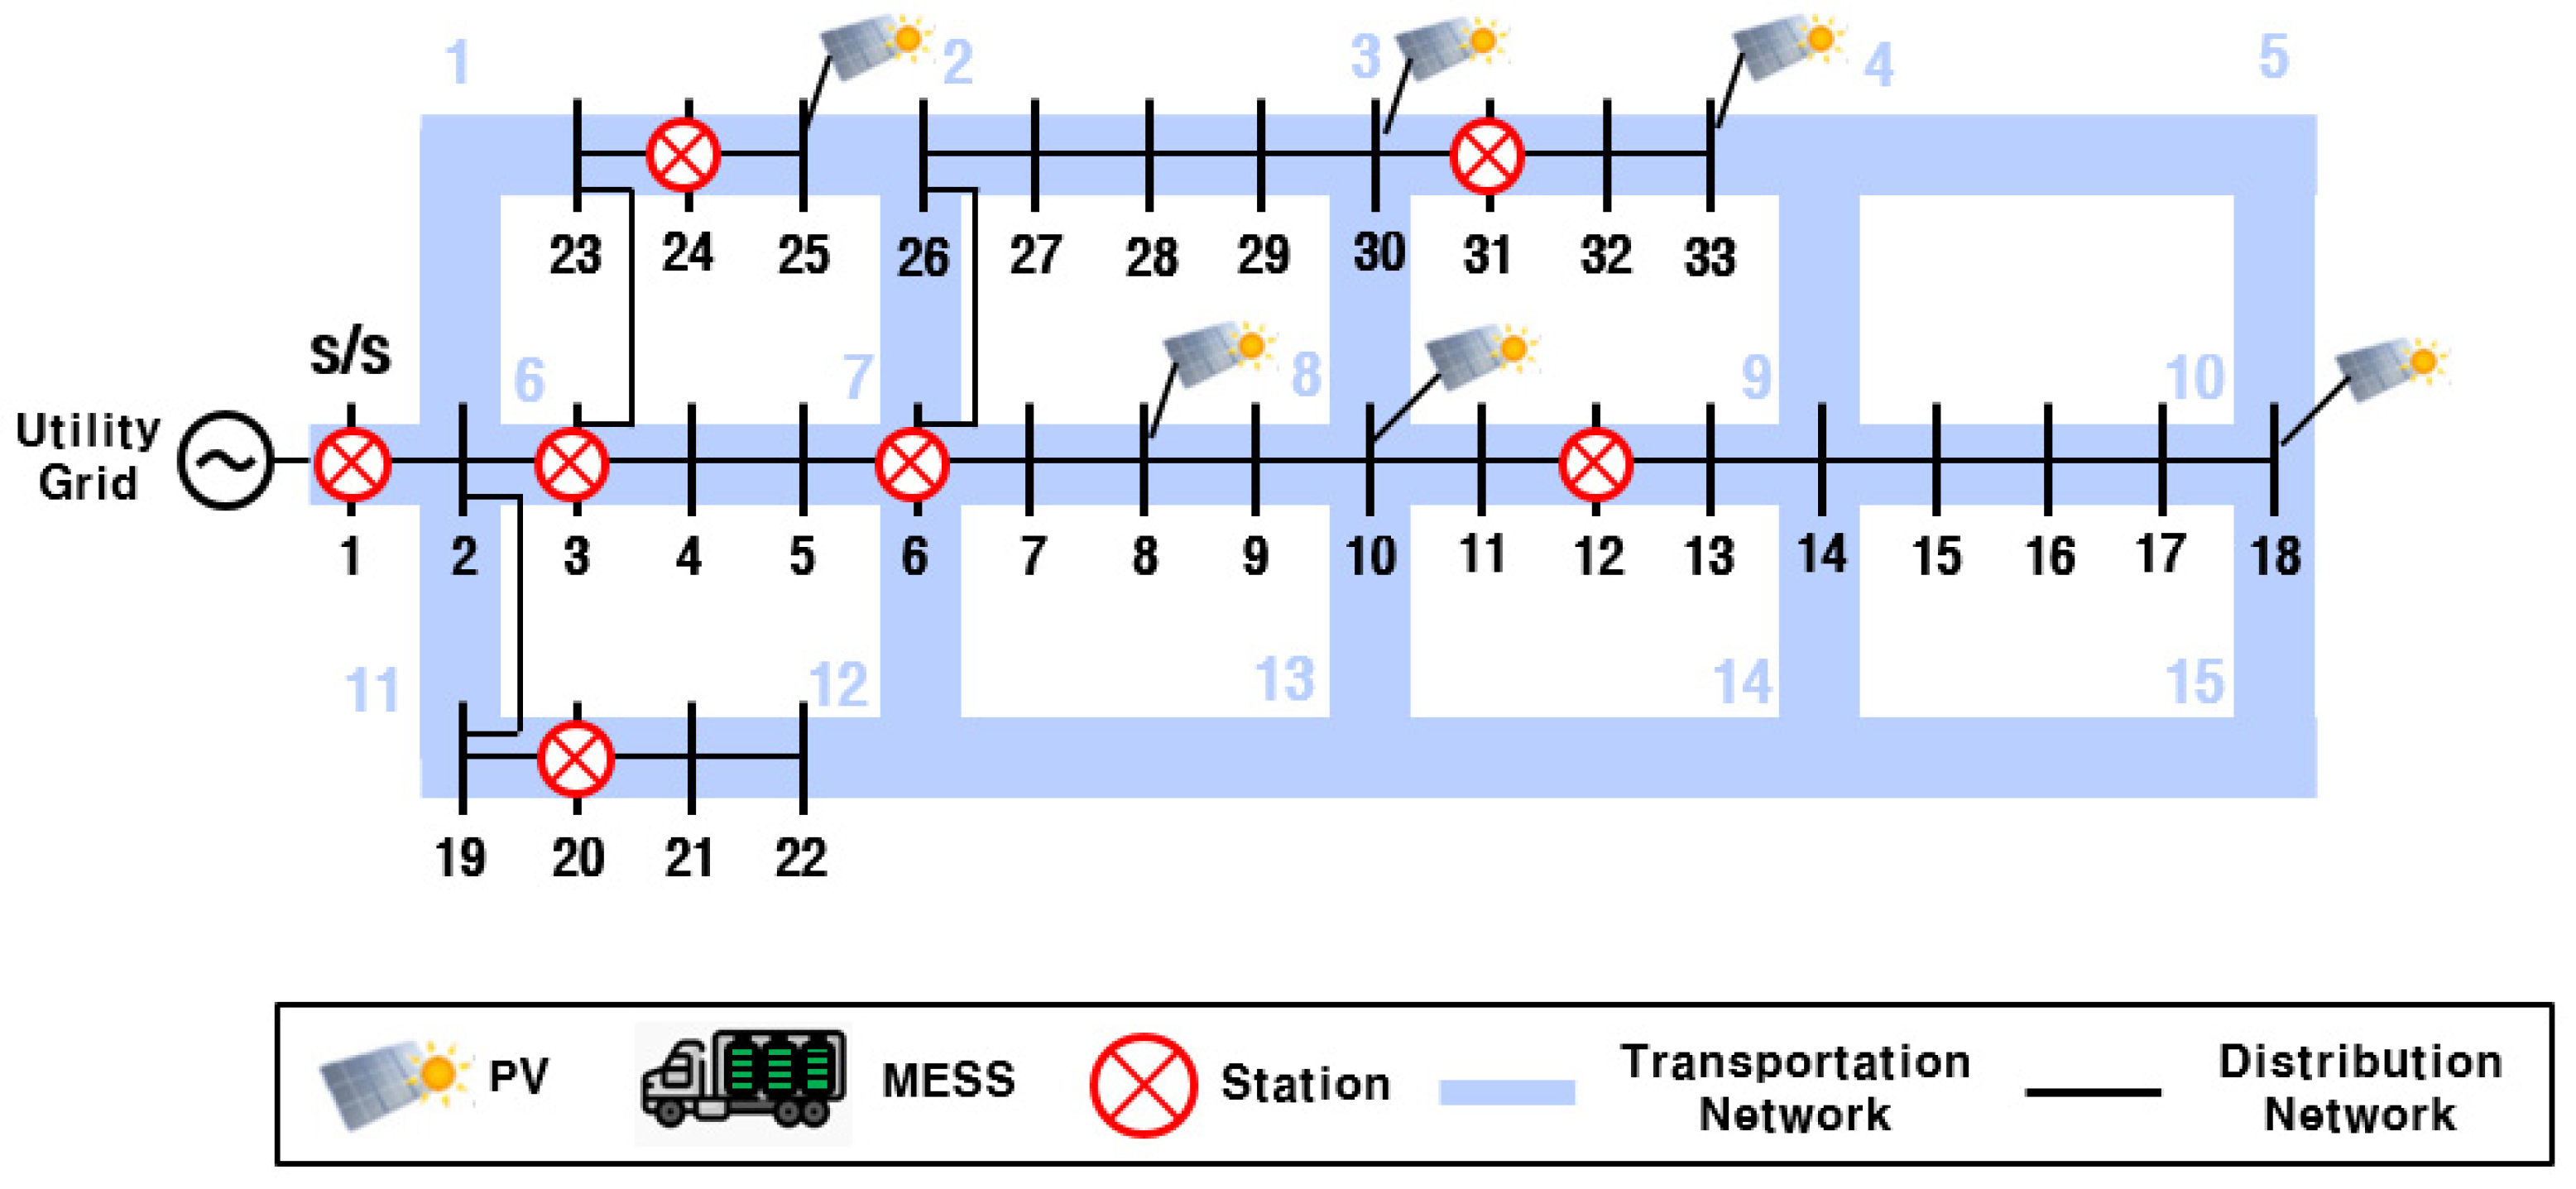
Figure 6.
Hourly PV generation forecasting profiles in the distribution network.

Figure 7.
The results of the transportation schedule of the MESS.

Figure 8.
Results of charging and discharging schedule of the MESS. (a) Case 1, (b) Case 2, (c) Case 3, and (d) Case 4.
Figure 8.
Results of charging and discharging schedule of the MESS. (a) Case 1, (b) Case 2, (c) Case 3, and (d) Case 4.

Figure 9.
Results of the voltage profile at hour 14. (a) Case 1, (b) Case 2, (c) Case 3, and (d) Case 4.
Figure 9.
Results of the voltage profile at hour 14. (a) Case 1, (b) Case 2, (c) Case 3, and (d) Case 4.


Table 1.
Reactive power compensators data.
| Case | Reactive Power (MVAR) |
|---|---|
| 6 | 0.3 |
| 14 | 0.3 |
| 18 | 0.4 |
| 33 | 0.6 |
Table 2.
The hourly operating mode of the MESS for the four cases.
| Hour | Case 1 | Case 2 | Case 3 | Case 4 |
|---|---|---|---|---|
| 1 | Discharging | Discharging | Discharging | Discharging |
| 2 | Idle | Idle | Moving | Idle |
| 3 | Idle | Idle | Idle | Idle |
| 4 | Charging | Charging | Charging | Charging |
| 5 | Charging | Charging | Charging | Charging |
| 6 | Moving | Idle | Idle | Idle |
| 7 | Discharging | Idle | Idle | Moving |
| 8 | Discharging | Discharging | Discharging | Discharging |
| 9 | Idle | Idle | Moving | Idle |
| 10 | Discharging | Discharging | Discharging | Discharging |
| 11 | Idle | Moving | Idle | Idle |
| 12 | Idle | Idle | Moving | Idle |
| 13 | Charging | Charging | Charging | Charging |
| 14 | Charging | Charging | Charging | Charging |
| 15 | Charging | Charging | Charging | Charging |
| 16 | Moving | Moving | Idle | Idle |
| 17 | Charging | Idle | Idle | Idle |
| 18 | Idle | Discharging | Idle | Idle |
| 19 | Idle | Idle | Idle | Discharging |
| 20 | Discharging | Discharging | Discharging | Discharging |
| 21 | Moving | Discharging | Idle | Moving |
| 22 | Charging | Moving | Idle | Idle |
| 23 | Charging | Idle | Idle | Moving |
| 24 | Idle | Idle | Moving | Idle |
Table 3.
The operating cost in each case.
| Case | Operating Cost (KRW) |
|---|---|
| Case 1 | 15,811,261 |
| Case 2 | 15,815,593 |
| Case 3 | 15,813,446 |
| Case 4 | 15,817,811 |
Table 4.
The curtailment in each case and scenario.
| Case | Forecasting Error | Operating Cost (KRW) | Total Curtailment (kW) | Curtailment Due to Upper Limit (kW) | Curtailment Due to Trip (kW) |
|---|---|---|---|---|---|
| Case 1 | 0 σ | 15,811,261 | 0 | 0 | 0 |
| +0.5 σ | 16,044,332 | 1186 | 0 | 1186 | |
| +1.0 σ | 16,054,169 | 1236 | 0 | 1236 | |
| +1.5 σ | 16,059,278 | 1262 | 0 | 1262 | |
| +2.0 σ | 16,213,351 | 2000 | 0 | 2000 | |
| Case 2 | 0 σ | 15,815,593 | 22 | 22 | 0 |
| +0.5 σ | 15,975,341 | 828 | 51 | 778 | |
| +1.0 σ | 16,064,836 | 1290 | 79 | 1211 | |
| +1.5 σ | 16,087,617 | 1406 | 149 | 1258 | |
| +2.0 σ | 16,255,175 | 2212 | 229 | 1983 | |
| Case 3 | 0 σ | 15,813,446 | 0 | 0 | 0 |
| +0.5 σ | 15,813,446 | 0 | 0 | 0 | |
| +1.0 σ | 15,813,446 | 0 | 0 | 0 | |
| +1.5 σ | 16,049,431 | 1201 | 0 | 1201 | |
| +2.0 σ | 16,215,536 | 2000 | 0 | 2000 | |
| Case 4 | 0 σ | 15,817,811 | 22 | 22 | 0 |
| +0.5 σ | 15,823,394 | 51 | 51 | 0 | |
| +1.0 σ | 15,828,976 | 79 | 79 | 0 | |
| +1.5 σ | 15,842,709 | 149 | 149 | 0 | |
| +2.0 σ | 16,084,269 | 1339 | 229 | 1110 |
Disclaimer/Publisher’s Note: The statements, opinions and data contained in all publications are solely those of the individual author(s) and contributor(s) and not of MDPI and/or the editor(s). MDPI and/or the editor(s) disclaim responsibility for any injury to people or property resulting from any ideas, methods, instructions or products referred to in the content. |
© 2024 by the authors. Licensee MDPI, Basel, Switzerland. This article is an open access article distributed under the terms and conditions of the Creative Commons Attribution (CC BY) license (https://creativecommons.org/licenses/by/4.0/).
Share and Cite
MDPI and ACS Style
Kim, S.; Lee, J. Optimal Scheduling Strategy for Distribution Network with Mobile Energy Storage System and Offline Control PVs to Minimize the Solar Energy Curtailment. Energies 2024, 17, 2234. https://doi.org/10.3390/en17092234
AMA Style
Kim S, Lee J. Optimal Scheduling Strategy for Distribution Network with Mobile Energy Storage System and Offline Control PVs to Minimize the Solar Energy Curtailment. Energies. 2024; 17(9):2234. https://doi.org/10.3390/en17092234
Chicago/Turabian StyleKim, San, and Jinyeong Lee. 2024. "Optimal Scheduling Strategy for Distribution Network with Mobile Energy Storage System and Offline Control PVs to Minimize the Solar Energy Curtailment" Energies 17, no. 9: 2234. https://doi.org/10.3390/en17092234
Note that from the first issue of 2016, this journal uses article numbers instead of page numbers. See further details here.