Article

Altitudinal Variation in Species Diversity, Distribution, and Regeneration Status of a Secondary Picea Forest in Guandi Mountain, Northern China

1
College of Forestry, Shanxi Agriculture University, Jinzhong 030801, China
2
National Engineering Laboratory for Satellite Remote Sensing Applications, Aerospace Information Research Institute, Chinese Academy of Sciences, Beijing 100094, China
*
Author to whom correspondence should be addressed.
These authors contributed equally to this work.
Forests 2024, 15(5), 771; https://doi.org/10.3390/f15050771
Submission received: 12 March 2024 / Revised: 24 April 2024 / Accepted: 25 April 2024 / Published: 27 April 2024

Abstract

:
Altitude plays a crucial role in shaping the diversity and distribution of species in forest landscapes in mountainous regions. However, existing studies often lack comprehensive analysis of the intricate relationships among environmental factors, disturbances, and species diversity. This study aims to address this gap by thoroughly analyzing major species’ diversity, distribution, and regeneration status, along with their influencing factors, across different altitudinal gradients (1850 to 2350 m). Field surveys were conducted to examine the major species in different vegetation layers of the secondary Picea forest in Guandi Mountain. The key findings from the study include the following: (1) the study area recorded a total of nine species of adult trees, belonging to eight genera in five families, fourteen species of shrubs from eight genera in five families, and fifty-two herb species representing forty-eight genera in twenty-six families. Dominant species varied across layers, with Picea asperata Mast. and Larix principis-rupprechtii Mayr. dominating the arborous layer, Lonicera ferdinandii Franch. and Cotoneaster acutifolius Turcz. in the shrub layer, and Poa pratensis L. and Duchesnea indica (Andrews.) Focke in the herb layer. (2) Altitude significantly influenced species diversity, with the most pronounced effects observed in the shrub and herb layers. (3) Tree species regeneration varied with altitude, with Picea asperata exhibiting the highest regeneration performance, particularly in the high-altitude zone (2250–2350 m). Regeneration parameters were significantly correlated with species diversity indices in both tree and shrub layers. (4) Redundancy analysis revealed that, apart from altitude, cutting (p = 0.015) influenced the species diversity of the tree layer, while annual precipitation (p = 0.006) and temperature (p = 0.01) determined the diversity of the shrub layer. Grazing (p = 0.042) was identified as a determining factor for species diversity in the herb layer. Overall, these findings provide valuable insights into the sustainable management of forest ecosystems in the study area and offer practical guidance for forest management in similar mountainous landscapes worldwide.

1. Introduction

The health and ecological benefits of forest ecosystems hinge on the critical aspects of biodiversity, distribution, and regeneration status. These factors play vital roles in predicting future forest dynamics and enhancing ecological advantages [1,2,3,4]. Different vegetation layers, including herbs, shrubs, and trees, contribute significantly to the biodiversity of forest ecosystems [5,6,7]. Understanding the diversity and distribution patterns across these layers forms a rational basis for devising effective biodiversity protection strategies.
Regeneration stands out as a pivotal process influencing the survival and persistence of species within communities [8]. The maintenance of forest community structure relies heavily on species composition, stand structure, and the regeneration status of tree species in the dry Afromontane forests of Awi Zone, northwestern Ethiopia, and heavily on the regeneration capacity of typical tree species [9,10]. This regeneration capacity is crucial for conserving and preserving forest biodiversity [11]. The successful regeneration of tree species depends on the ability of seedlings and saplings to survive and grow, ensuring the long-term sustainability of forests [12,13,14]. Consequently, effective management and conservation of natural forests necessitate reliable data on regeneration trends [3]. Natural disturbances and environmental factors play pivotal roles in shaping plant diversity patterns in mountainous areas [15,16]. A comprehensive analysis of plant community diversity, distribution, regeneration, environmental impact factors, and related aspects is a valuable tool for effectively managing forest ecosystems.
Species diversity distribution results from prolonged interactions among species and between species and their environments [17]. The relationship between changes in species diversity and environmental factors is closely intertwined. An analysis of vegetation alongside ecological aspects like topography, soil, and climate can reveal the stability of plant communities and the extent of their interaction with these environmental factors [18]. Altitude significantly influences the distribution of plant species, effectively shaping the regional climate and, consequently, the dispersal of flora [19,20]. Therefore, researchers from diverse disciplines contemplate species diversity through the lens of various environmental elements, including elevation, climate, inclination, and direction [21]. Additionally, spatial changes in climatic conditions (such as temperature and rainfall) have been suggested to play a fundamental role in controlling species diversity [22,23,24], impacting species coexistence and persistence. Maintaining species diversity stands as the primary goal of ecological management. Effective ecosystem management requires identifying the factors that influence species distribution and diversity, along with the patterns of species diversification linked to ecological traits [25].
The Guandi Mountain Forest Area, a vital distribution area of forest resources in North China, hosts a predominant secondary cold–temperate Picea forest. Picea asperata Mast. is instrumental in soil stabilization and water conservation and plays a pivotal role in safeguarding biodiversity within North China’s mountainous secondary forests and in rehabilitating degraded ecosystems [26]. Unsustainable cutting and grazing have significantly affected the long-term diversity of local plants. Although some studies discussed the determinants of species diversity and regeneration in the Guandi Mountain complex, few have comprehensively assessed the interconnectedness between biodiversity analysis, ecosystem regeneration, and environmental variables, and results remain scant [27,28,29]. The aim of this investigation is to explore the species diversity across various altitudinal zones within Guandi Mountain’s secondary Picea forests, along with the influencing environmental factors and the regeneration dynamics of arboreal species. The findings offer a theoretical base for the conservation of biodiversity and ecological restoration of forest ecosystems in Guandi Mountain, facilitating sustainable forest management in the study area.

2. Materials and Methods
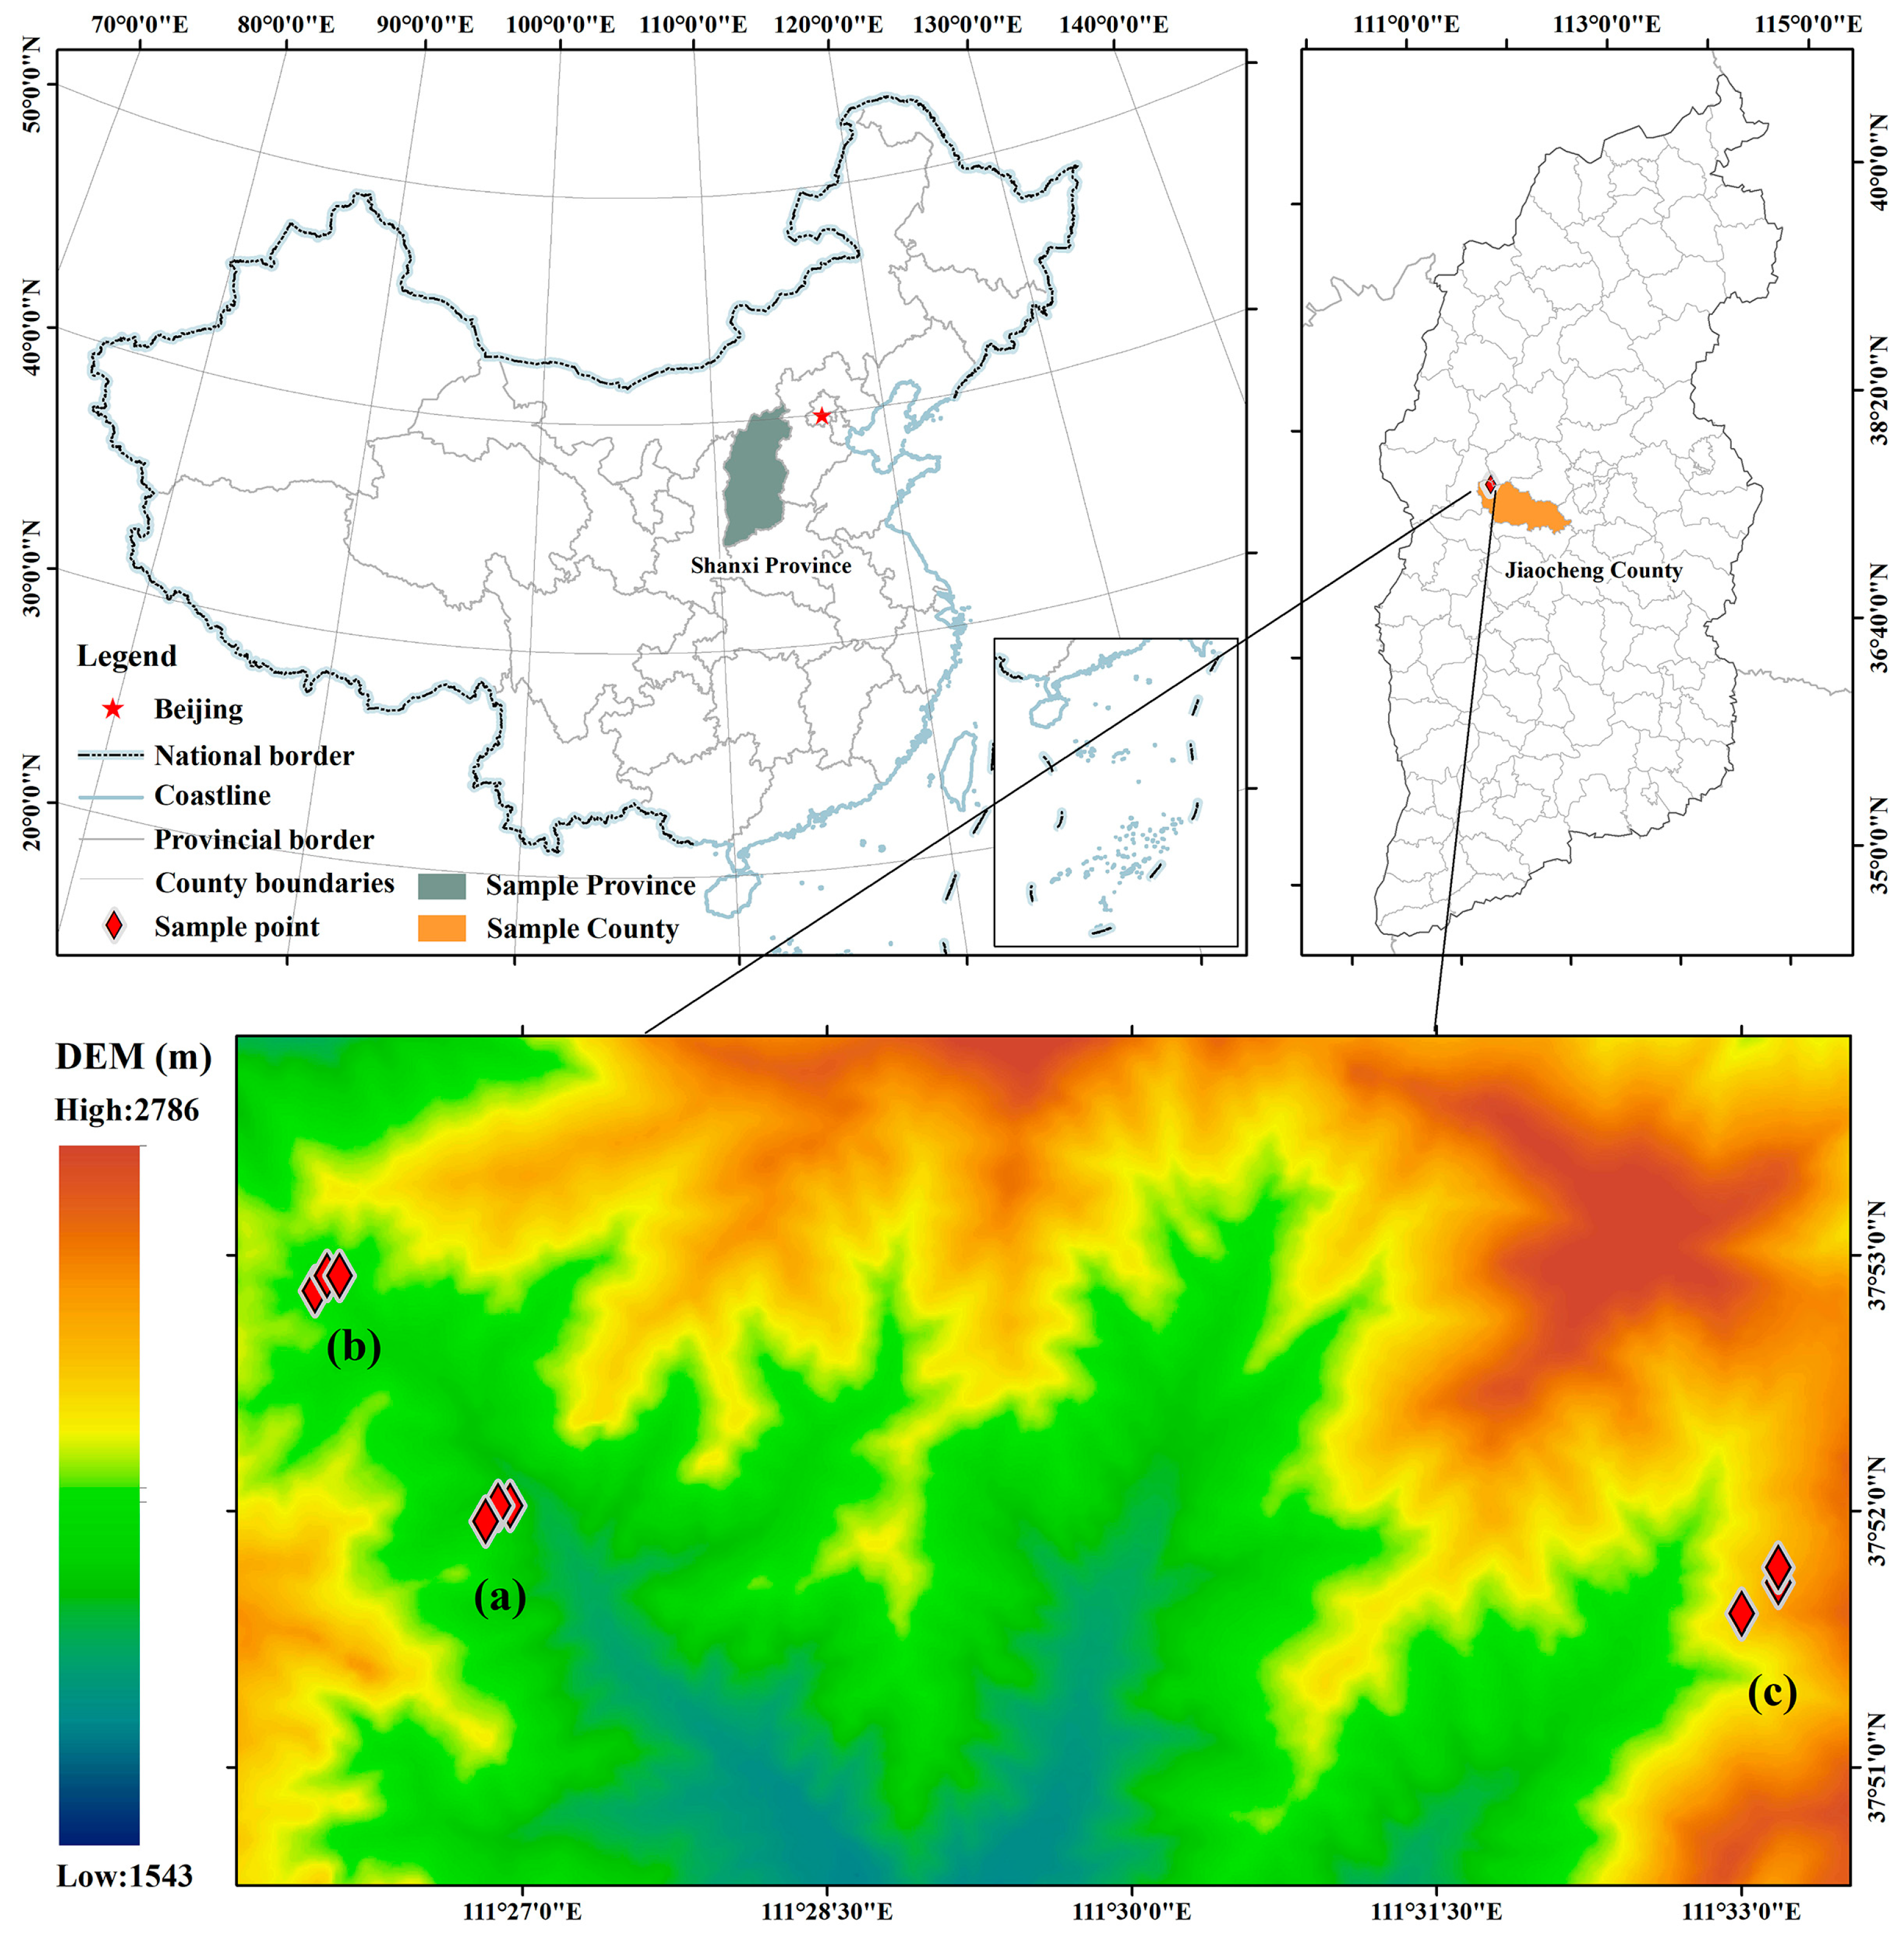
2.1. Study Area

The study area was situated in the Guandi Mountain Forest Area, located in the central part of the Lvliang Mountains in the western region of Shanxi Province (37°50′–38°02′ N, 111°24′–112°37′ E) (Figure 1). The Koppen climate classification in this mountainous region is Dwb, characterized by a monsoon-influenced warm-summer humid continental climate. The annual average temperature is 3–4 °C, with an average frost-free period of 115 days and an annual precipitation of 600–800 mm [30]. Rainfall generally decreases from the high to low mountain areas, accompanied by an annual evaporation of 1100–1500 mm. The soil types in the area follow a vertical distribution pattern from low to high, including yellow moorland soil, mountain cinnamon soil, mountain eluviated brown soil, brown mountain soil, and sub-alpine meadow soil [31]. The dominant tree species in the sample plot was Picea asperata, a cold–temperate conifer native to western China with several varieties. Other common trees included Larix principis-rupprechtii Mayr., Betula albosinensis Burk., and Betula platyphylla Suk., etc. Shrubs beneath the canopy mainly consisted of Lonicera ferdinandii Franch., Cotoneaster acutifolius Turcz., and Rosa bella Rehd.et Wils., etc. The herbaceous layer mainly included Poa pratensis L., Duchesnea indica(Andrews.) Focke, and Chimaphila japonica Miq., etc.

2.2. Field Sampling and Measurements

In July 2022, we established three altitude gradients in both intact and lightly disturbed areas of secondary Picea forests in the Guandi Mountain Forest Area, ranging from 1850 to 2350 m. These altitude zones included the low-altitude zone (1850–1950 m), middle-altitude zone (2050–2150 m), and high-altitude zone (2250–2350 m). For each altitude gradient, three plots measuring 50 m × 50 m were established at the center and at the four corners. Additionally, five 5 m × 5 m shrub-layer survey plots and 10 1 m × 1 m herb-layer survey plots were set up in each sample plot using the diagonal method. In total, we surveyed 9 tree plots, 45 shrub-layer plots, and 90 herb-layer plots.
All living trees with a diameter at breast height (DBH) of ≥1 cm were categorized as seedlings (DBH 1–5 cm), saplings (DBH 6–10 cm), and adult trees (DBH > 10 cm) [32]. Measurements were taken for tree species, density, DBH, and height. Simultaneously, species identity, density, height, and coverage (%) were recorded for shrub and herb plots. The number of tree seedlings and saplings reflected the regeneration status, while the ratio of seedlings and saplings to adult trees determined regeneration performance [33]. Environmental factors, including elevation, latitude, longitude, and slope of the sample plots, were also recorded.
Based on on-site plot investigation results, the slope aspect was categorized as follows: 0.2 represented a shady slope (0° to 45° clockwise rotation from true north), 0.4 represented a semi-shady slope (45° to 135°), 0.6 represented a sunny slope (135° to 225°), and 0.8 represented a semi-sunny slope (225° to 315°). We employed a semi-quantitative scale to measure the degree of anthropogenic disturbance, including cutting intensity, grazing intensity, and tourism disturbance intensity. The level of anthropogenic disturbance was recorded through visual assessment near each sample site using a three-point scale (0 = no/low, 1 = moderate, 2 = high) [34] (Table 1).
The relative stand density and relative crown density of the stand factors were calculated according to the relative impact method [35]. Relative stand density is the ratio of the stand density of each sample site to the sum of the stand densities of all sample sites, and relative crown density is the ratio of the crown density of each sample site to the sum of the crown density of all sample sites. Cutting intensity was determined based on relative stump density, grazing intensity based on the number of cattle, sheep, and horses per hectare per unit time [36], and tourism disturbance intensity based on the density of trampling marks, bare patches, and the quantity of tourist litter [37]. Characteristics of the sample plots and the degree of disturbance are detailed in Table 2.

2.3. Data Collection and Analysis

The Importance Value Index (IVI) serves as a comprehensive indicator to depict the status and role of a species within a community. Due to its straightforward calculation and inherent capability of elucidating a species’ dominance in a community, IVI has found broad applications across various ecological fields [38]. Our calculation of IVI for each tree species involved considering relative density, relative dominance, and relative frequency, and a parallel calculation was conducted for the shrub and herb layers [39]. Dominant species were selected based on IVI and frequency; refer to Supplementary File S1. The formulae are the following:
(1)
IVI of tree layer = (relative density + relative dominance + relative frequency)/3;
(2)
IVI of shrub and herb layer = (relative density + relative dominance + relative coverage)/3.
Distinct diversity indices were found to be sensitive to spatial scale and other factors. Therefore, we used the following diversity indices to contrast the research results.
(1)
The Shannon diversity index: H = i = 1 S P i ( l n P i )
(2)
Simpson’s dominance index: D = 1 i = 1 S P i 2
(3)
Pielou’s evenness index: J = H / l n S
(4)
The Margalef richness index: R = ( S 1 ) / l n N
(5)
Fisher’s alpha: S = a × l n ( 1 + n / a )
Where Pi is the proportion of the number of individuals of the species divided by the total number of individuals in the plot; S is the number of species present in the sample plot; N is the total number of species in the plot, and α represents Fisher’s alpha. Diversity survey data refer to Supplementary File S2.
This study mainly employed several analytical approaches: (1) data organization and calculation of species importance values were performed using Microsoft Excel 2019, while diversity indices were computed using Past 4.07b [40]. (2) One-way ANOVA [41] was utilized to assess differences in various diversity indices across distinct gradients. (3) The Pearson correlation analysis was conducted to evaluate the relationship between species diversity indices and regeneration parameters. (4) Correlation coefficients between environmental factors and different vegetation layers were computed using the ‘Hmisc’ and ‘corrplot’ packages in R 4.2.2 [42]. Subsequently, by selecting relevant environmental factors and using those with a significant impact, redundant analysis (RDA) [43] was conducted with the species diversity index as the response variable and environmental and disturbance factors as explanatory variables, using the ‘Vegan’ package in R 4.2.2. The plots were generated using R 4.2.2 and Origin 2022 “https://www.originlab.com/ (accessed on 10 April 2023)”.

3. Results

3.1. Distribution of Species along Altitudes

The survey identified ten tree species belonging to five families and nine genera, fourteen shrub species from five families and eight genera, and fifty-two herb species spanning twenty-six families and forty-eight genera across the sample plots.
Dominant species were determined based on their IVIs and frequencies (Supplementary File S1). In the tree layer, Picea asperata, Larix principis-rupprechtii, Betula albosinensis, and Betula platyphylla were identified as dominant. The shrub layer was dominated by Lonicera ferdinandii, Cotoneaster acutifolius, and Rosa bella, while the herb layer was dominated by Poa pratensis, Duchesnea indica, and Chimaphila japonica.
The IVI of species exhibited notable variations across different altitudinal zones (Figure 2). Larix principis-rupprechtii and Betula platyphylla showed increased dominance in the tree layer at higher altitudes. In the shrub layer, Cotoneaster acutifolius, Rosa bella, and Spiraea trilobata L. displayed increased dominance at higher altitudes. Conversely, Corylus mandshurica Maxim. and Cotoneaster multiflorus Bge. were dominant shrubs at lower altitudes. In the herb layer, Poa pratensis, Chimaphila japonica, and Myosotis alpestris were most dominant at lower altitudes, Adoxa moschatellina, Duchesnea indica, and Allium ramosum L. were most dominant in the middle-altitude zones, and Anthriscus sylvestris (L.) Hoffm. and Ligusticum jeholense Nakai et Kitag. appeared only in the higher-altitude zones. Species such as Larix principis-rupprechtii, Lonicera ferdinandii, Cotoneaster acutifolius, Poa pratensis, and Duchesnea indica exhibited a wide altitudinal range, with more shrub species in the middle-altitude zones and herb species in both middle- and high-altitude zones.

3.2. Analysis of Species Diversity along Altitudes

The species diversity across different vegetation layers exhibited notable variations along altitudinal gradients. In the arborous layer, the Margalef index and Fisher’s alpha displayed a trend of low-altitude zone > middle-altitude zone > high-altitude zone, with a significant difference observed in the Margalef index. The Shannon diversity index and Simpson’s dominance index showed a single-peaked trend, with the highest values recorded in the middle-altitude zone. Additionally, Pielou’s evenness index demonstrated a pattern of high-altitude zone > middle-altitude zone > low-altitude zone.
For the shrub layer, the Shannon diversity index, Simpson’s dominance index, the Margalef index, and Fisher’s alpha at different elevations exhibited a trend of low-altitude zone > middle-altitude zone > high-altitude zone, with significant differences.
Similarly, the herb layer displayed a pattern of low-altitude zone > middle-altitude zone > high-altitude zone for the Shannon diversity index and Simpson’s dominance index. However, no statistical significance was observed for the Margalef index and Fisher’s alpha (Figure 3).

3.3. Forest Tree Regeneration Status along Altitudes

Across all sample plots, the average tree density was 522 trees/ha, ranging from 844 trees/ha at low altitudes to a minimum of 348 trees/ha at high altitudes. The average total basal cover was 24.04 m2/ha, varying from 33.13 m2/ha at low altitudes to a minimum of 16.86 m2/ha at high altitudes (Table 3).
In the seedling layer of the secondary Picea forest, the highest density was 240 trees/ha in the high-altitude area, while the minimum density was 12 trees/ha in the low-altitude area. The maximum and minimum densities of the sapling layer occurred in the middle- and high-altitude zones, with 104 trees/ha and 32 trees/ha, respectively. The regeneration performance of tree species differed under different altitude gradients (Table 3). The average value of Se/At was 0.19, ranging from a maximum of 0.69 in the high-altitude zone to a minimum of 0.02 in the low-altitude zone. Compared to Se/At, the Sa/At values were higher in the high-altitude zone, while the Sa/At values were lower in the middle- and low-altitude zones (Table 3).
Picea asperata in the high-altitude zone, Betula albosinensis in the middle-altitude zone, and Quercus wutaishansea Mayr. in the low-altitude zone exhibited high regeneration performance, with Picea asperata showing the relatively greatest regeneration performance. Larix principis-rupprechtii displayed lower regeneration performance along all three altitudinal gradients (Table 4).

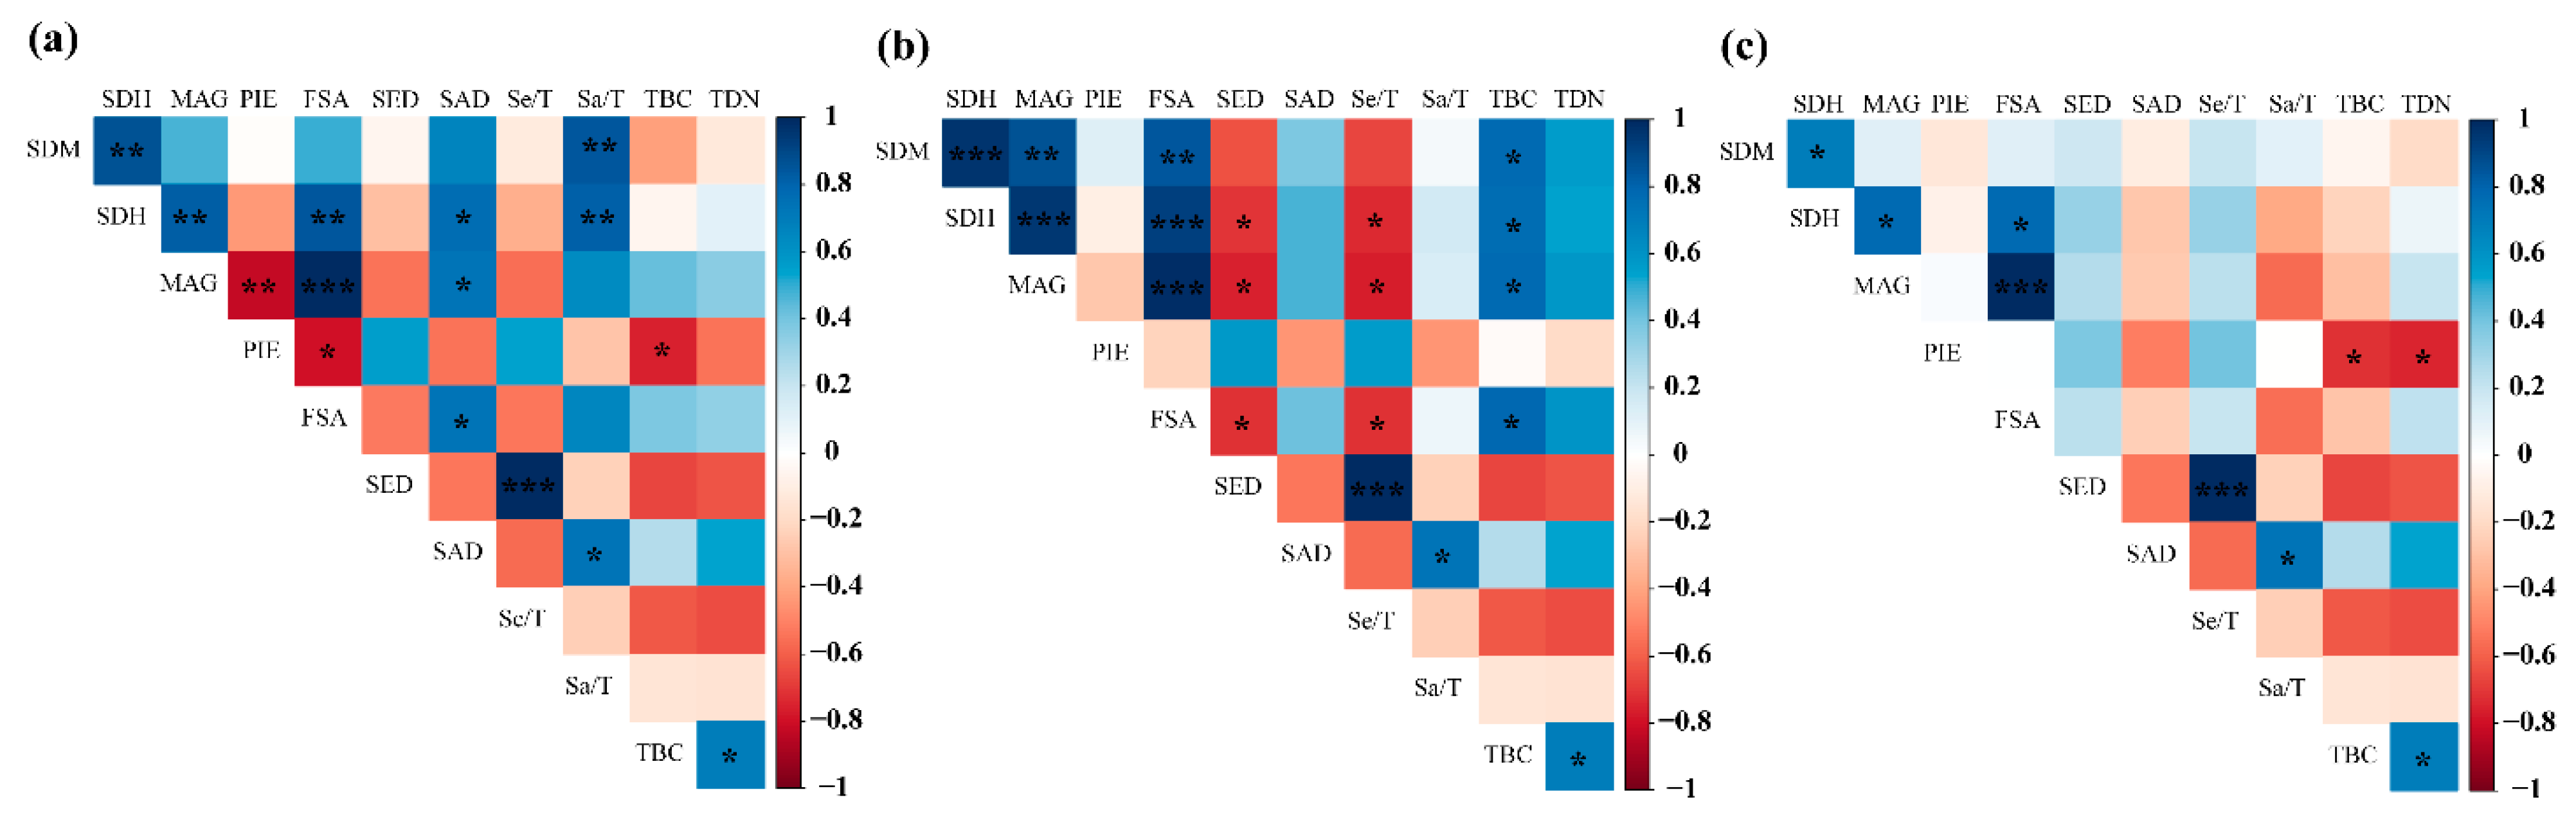
3.4. Pearson Correlation Analysis of Species Diversity Indices and Regeneration Parameters

The Pearson correlation results between the species diversity index and the regeneration parameters of the secondary Picea forest revealed that the correlation was primarily observed in the tree layer and the shrub layer, with the relationship between the regeneration parameters and the species diversity of the understory herbs not reaching a significant level (Figure 4).
In the tree layer, the total basal coverage (TBC) was significantly negatively correlated with Pielou’s evenness index (PIE). The value of Sa/At positively correlated with Simpson’s dominance index (SDM) and the Shannon diversity index (SDH). Sapling density significantly and positively correlated with the Shannon diversity index, the Margalef richness index (MAG), and Fisher’s alpha (FSA). The greater the regenerative performance, the more complex the species diversity of the trees (Figure 4a).
In the shrub layer, the total basal cover (TBC) exhibited substantial positive correlations with Simpson’s dominance index (SDM), the Shannon diversity index (SDH), the Margalef richness index (MAG), and Fisher’s alpha (FSA). The seedling density was significantly negatively correlated with the Shannon diversity index, the Margalef richness index, and Fisher’s alpha. The greater the regeneration performance, the more monotonous the species diversity of the shrubs (Figure 4b).

3.5. Role of Disturbance and Environmental Variables

The redundancy analysis (RDA) findings highlight the first principal component’s superior explanatory power for the diversity indices of the three vegetation layers. In the tree layer, the Shannon diversity index, the Margalef index, Fisher’s alpha, and Simpson’s dominance index exhibit positive correlations with the first principal component, while Pielou’s evenness is negatively correlated. Fisher’s alpha shows the highest correlation with the first principal component, followed by the Margalef index. Moving to the shrub layer, Simpson’s dominance index, the Shannon diversity, the Margalef richness index, and Fisher’s alpha all correlate negatively with the first principal component, with Pielou’s evenness exhibiting a similar negative correlation. The Margalef index demonstrates the highest correlation with the first principal component in the shrub layer. As for the herb layer, Simpson’s dominance index, the Shannon diversity index, the Margalef index, Fisher’s alpha, and Pielou’s evenness all show positive correlations with the first principal component. The Margalef index and Fisher’s alpha particularly stand out, with higher correlations.
Comprehensively interpreting the heatmap and RDA results, altitude (p = 0.041) and cutting (p = 0.015) emerge as significant factors influencing the species diversity of the tree layer. Altitude and cutting factors exhibit negative correlations with the Margalef index and Fisher’s alpha, while demonstrating positive correlations with Pielou’s evenness. In the shrub layer, annual precipitation (p = 0.006), annual temperature (p = 0.01), elevation (p = 0.012), and average tree height (p = 0.033) significantly impact species diversity. The Shannon diversity index, the Margalef index, Fisher’s alpha, and Simpson’s dominance index negatively correlate with average tree height and annual precipitation, while positively correlating with elevation and annual temperature. For the herbaceous layer, elevation (p = 0.018) and grazing (p = 0.042) are significant influencers of species diversity. The Margalef index and Fisher’s alpha correlate positively with grazing and elevation factors (Figure 5).

4. Discussion

4.1. Composition Characteristics, Diversity, and Distribution of Species along Altitudes

This study underscores significant disparities in species composition across distinct vegetation layers at various altitudes. These differences are likely shaped by site-specific conditions [44], interlinked with geographical location, climate nuances, and human-induced disturbances [45,46,47,48].
The importance value index serves as a reflective measure of variation and distribution characteristics within plant communities along altitude gradients [49,50]. Notably, dominant species diverged among elevations within different vegetation layers, and the importance values of identical species exhibited altitude-dependent variations that were not the same at different elevations. Species such as Lonicera ferdinandii, Cotoneaster acutifolius, and Rosa bella in the shrub layer, and Poa pratensis and Chimaphila japonica in the herb layer demonstrated wider distribution altitudes, indicative of broader ecological niches and enhanced resistance to biotic pressures. This adaptability might be attributed to the ecological and physiological traits of vegetation, enabling species to endure extreme environmental conditions and acclimate to challenging climates. Altitude-induced microclimatic variations influenced plant microhabitats, aligning with Wang et al. [51].
Species diversity, intricately linked with forest structure and species composition [52], displayed significant altitude-driven differences across distinct vegetation layers. Tree- and shrub-layer diversities diminished markedly with increasing altitudes, while herb-layer diversity exhibited a conspicuous rise. The consistent Pielou’s evenness index across altitude gradients suggests an equitable distribution of individuals within each vegetation layer. The heightened richness of herbaceous vegetation at high altitudes can be attributed to a more favorable and predictable environment for herbaceous species [53,54], aligning with several other studies by [55,56,57].
In the tree layer, a limited number of tree species dominate high-altitude forest vegetation as elevation increases, potentially linked to slower evolution and diversification rates, aligning with findings by Chen [58]. This contrasts with Gao et al.’s research suggesting peak species richness and diversity at intermediate altitudes, declining at lower and higher altitudes [30]. This discrepancy may be attributed to the pronounced influence of climate change associated with altitude rise on species diversity. McCain [59] proposed a climate model that suggests that moderate temperature and precipitation at middle altitudes foster higher plant diversity. In sum, the marked shifts in geographical and climatic conditions with altitude elevation contribute to species diversity and distribution variations influenced by topography, climate, soil, and biotic interactions [60,61].

4.2. Regeneration Status of the Secondary Picea Forest along Altitudes

Regeneration stands as a pivotal process in shaping the floristic components of communities. For the enduring management of forest biodiversity, the natural regeneration of tree species within forest ecosystems assumes paramount importance [62]. The regeneration performance of trees in forest ecosystems hinges on the population structure, with the emergence of sufficient seedlings and saplings serving as crucial indicators of a forest’s regeneration potential [63]. Simultaneously, tree density and basal area constitute vital factors influencing forest structure [64].
In this study, seedling densities ranged from 12 to 240 trees/ha, while sapling densities ranged from 32 to 104 trees/ha across different altitudes. These variations in densities may be attributed to factors such as altitude and anthropogenic disturbances [30]. The relatively lower average values of total basal cover (TBC) observed at low altitudes could be linked to the more mature stands prevalent in these areas.
Moreover, the seedlings/adult trees (Se/At) ratio at lower altitudes was notably low compared to other altitude zones, potentially indicating more pronounced disturbance conditions. Picea asperata exhibited a high regeneration rate at high altitudes while facing impediments at lower and middle altitudes. This hindrance might be attributable to disturbances rendering microhabitat conditions unfavorable for Picea asperata survival, consequently offering ecological niches for the establishment of broad-leaved tree species like Quercus wutaishansea and Betula albosinensis. This observation aligns with the Janzen–Connell theory, suggesting elevated mortality rates in proximity to mature trees [65,66]. Additionally, prevalent anthropogenic disturbances such as tourism, cutting, and grazing in the study area likely contribute to the overall low density of seedlings [32].

4.3. Relationship between Species Diversity Index and Regeneration Parameters

The natural regeneration process is paramount in safeguarding and perpetuating biodiversity [11]. Consequently, assessments of forest vegetation offer valuable insights into tree population status, regeneration dynamics, and overall diversity, aiding in the pursuit of effective conservation goals [67].
In this study, the regeneration performance of tree species exhibited a positive correlation with tree species diversity. This suggests that the intricate diversity of tree species enhances the regenerative potential of forests, potentially attributed to distinct nutrient and resource requirements among various tree species. Increased diversity, therefore, augments the survival prospects of forest communities. Different tree species find suitable ecological niche spaces in undisturbed natural forests, contributing to enhanced regeneration [68]. The relationship between shrub species diversity and tree regeneration performance revealed a contrasting pattern, indicating that higher regeneration performance in tree species is associated with lower shrub diversity. This may stem from the inhibitory effects of many shrubs on the growth of tree seedlings and saplings [69]. Studies suggest juvenile trees often compete with shrubs and herbaceous plants beneath the canopy, intensifying competition for resources and space [70].
While a substantial and direct correlation between seedling and sapling density is typically anticipated [71], the lack of significance in this study could be attributed to the reduced canopy cover resulting from human disturbance. This alteration may impact the regeneration performance of tree species [72], leading to a relatively lower success rate of seedling recruitment into saplings. Conversely, in areas with favorable regeneration conditions, Picea asperata in high-altitude zones may be in the early regeneration stage, resulting in a relatively lower density of saplings compared to seedlings [73].

4.4. Role of Anthropogenic and Environmental Factors on Species Diversity

Anthropogenic disturbance, environmental factors, and biological interactions collectively shape the diversity and distribution patterns of species [74,75]. This study underscores the prominent influence of elevation on species diversity across diverse vegetation layers (Figure 5). As altitude increases, there is a marked decline in tree diversity, consistent with the findings of Pausas et al. [76], which could be attributed to the significant impact of temperature on the physiology of woody plants. Qin et al. [77] reported a consistent decline in the species richness index of the herb layer in Guan Di Mountain, concomitant with rising altitude. Despite these trends, our analysis revealed that the Margalef richness index for the herb layer peaked within the high-altitude zones. Various factors, including temperature, moisture, and soil conditions, likely contribute to the observed variations in species diversity within the herbaceous layer across different altitudes [78].
Furthermore, factors such as altitude, slope, and latitude play crucial roles in shaping vegetation and community types [79,80]. Plant growth is intricately linked to biological, climatic, and various environmental factors, with climate itself being influenced by topographical features like altitude, slope, and aspect [81].
In recent years, the forest vegetation within the study area has experienced varied forms of disturbance, significantly impacting the stability of the local forest ecosystem. Existing research suggests that human-induced disturbance strongly affects plant communities’ species composition and diversity, while natural disturbance is often associated with specific natural conditions [82,83,84].
In addition to altitude, human-induced cutting activities emerge as a significant factor influencing species diversity within the tree layer. Cutting practices alter the spatial structure and density distribution of trees, leading to shifts in plant competition dynamics [85]. Weaker tree species may struggle to coexist with more competitive counterparts, thereby impacting overall tree species diversity [86]. Different tree species exhibit varying water requirements, and temperature also affects species’ tolerance and adaptability. Alterations in altitude and terrain result in changes in temperature and precipitation. Consequently, under distinct annual temperature and precipitation conditions, variations in shrub species diversity are observed [87]. Grazing activities in the study concurrently contribute to the increased richness of herbaceous plants. This phenomenon may be attributed to grazing activities balancing the species composition of herbaceous plant communities, thereby fostering greater diversity [88].

5. Conclusions

Based on data from the secondary Picea forest along three consecutive altitudinal gradients in Guandi Mountain, we analyzed the species distribution of the secondary Picea forest, evaluated tree species’ regeneration, and identified environmental conditions impacting species diversity. The main conclusions can be summarized as follows: elevation influences the dominance of species across the various vegetation layers in secondary Picea forests. Variations in species diversity with elevation are primarily observed in the shrub and herb layers. In the shrub layer, species diversity declines as elevation rises, whereas in the herb layer it peaks at higher elevations. The study highlights that, aside from elevation, cutting as a disturbance factor primarily affects species diversity within the tree layer, with grazing chiefly influencing the diversity of the herb layer. Climatic factors exert the greatest impact on the shrub layer, with stand dynamics being the secondary influence. Simultaneously, the study identifies the variability in the regeneration potential of dominant tree species with changing altitudes. Notably, Picea asperata and certain broad-leaved tree species, such as Betula albosinensis and Quercus wutaishanica, exhibit promising regeneration potential. Therefore, Picea asperata can be regarded as an essential species for forest restoration in the elevated regions of Guandi Mountain. The study proposes a scientific approach to planning and the judicious allocation of saplings and seedlings of tree species with higher regeneration potential. This serves as a crucial foundation for restoring forest vegetation in the region, contributing significantly to the exploration of sustainable forest management practices.

Supplementary Materials

The following supporting information can be downloaded at: https://www.mdpi.com/article/10.3390/f15050771/s1. File S1. Species composition and quantitative characteristics of main species in different forest layers. File S2. Species diversity indices of different vegetation layers at three altitude gradients.

Author Contributions

Z.L. and M.Z.: design of experiments, writing—original draft, data curation, writing—review and editing; Z.L., Z.Y. and H.S.: methodology, investigation; M.Z., J.W. and X.W.: resources, supervision, project administration. All authors contributed to the article, approved the submitted version, revised the manuscript, and provided assistance with review and editing. All authors have read and agreed to the published version of the manuscript.

Funding

This research was funded by the Youth Program of the National Natural Science Foundation of China (31901308) and Shanxi Province Key Research and Development Program (202102090301007).

Data Availability Statement

Data will be made available on request.

Conflicts of Interest

The authors declare that the research was conducted in the absence of any commercial or financial relationships that could be construed as a potential conflict of interest.

References

  1. Clark, J.S.; McLachlan, J.S. Stability of forest biodiversity. Nature 2003, 423, 635–638. [Google Scholar] [CrossRef] [PubMed]
  2. Negi, V.S.; Pathak, R.; Rawal, R.S.; Bhatt, I.D.; Sharma, S. Long-term ecological monitoring on forest ecosystems in Indian Himalayan Region: Criteria and indicator approach. Ecol. Indic. 2019, 102, 374–381. [Google Scholar] [CrossRef]
  3. Lohbeck, M.; Albers, P.; Boels, L.E.; Bongers, F.; Morel, S.; Sinclair, F.; Smith-Dumont, E. Drivers of farmer-managed natural regeneration in the Sahel. Lessons for restoration. Sci. Rep. 2020, 10, 15038. [Google Scholar] [CrossRef]
  4. Paul, C.; Hanley, N.; Meyer, S.T.; Fürst, C.; Weisser, W.W.; Knoke, T. On the functional relationship between biodiversity and economic value. Sci. Adv. 2020, 6, eaax7712. [Google Scholar] [CrossRef]
  5. Guo, X.; Coops, N.C.; Tompalski, P. Regional mapping of vegetation structure for biodiversity monitoring using airborne lidar data. Ecol. Inform. 2017, 38, 50–61. [Google Scholar] [CrossRef]
  6. Guo, Y.; Schöb, C.; Ma, W. Increasing water availability and facilitation weaken biodiversity–biomass relationships in shrublands. Ecology 2019, 100, e02624. [Google Scholar] [CrossRef] [PubMed]
  7. Depauw, L.; Perring, M.P.; Landuyt, D. Light availability and land-use history drive biodiversity and functional changes in forest herb layer communities. J. Ecol. 2020, 108, 1411–1425. [Google Scholar] [CrossRef]
  8. Kharkwal, G.; Mehrotra, P.; Rawat, Y.S.; Pangtey, Y.P.S. Phytodiversity and growth form in relation to altitudinal gradient in the Central Himalayan (Kumaun) region of India. Curr. Sci. 2005, 89, 873–878. [Google Scholar] [CrossRef]
  9. Sansevero, J.B.B.; Prieto, P.V.; de Moraes, L.F.D.; Rodrigues, P.J.P. Natural regeneration in plantations of native trees in Lowland Brazilian Atlantic Forest: Community structure, diversity, and dispersal syndromes. Restor. Ecol. 2011, 19, 379–389. [Google Scholar] [CrossRef]
  10. Montfort, F.; Nourtier, M.; Grinand, C. Regeneration capacities of woody species biodiversity and soil properties in Miombo woodland after slash-and-burn agriculture in Mozambique. For. Ecol. Manag. 2021, 488, 119039. [Google Scholar] [CrossRef]
  11. Rahman, M.; Khan, M.; Roy, B.; Fardusi, M. Assessment of natural regeneration status and diversity of tree species in the biodiversity conservation areas of Northeastern Bangladesh. J. For. Res. 2011, 22, 551–559. [Google Scholar] [CrossRef]
  12. Good, N.F.; Good, R.E. Population dynamics of tree seedlings and saplings in a Mature Eastern Hardwood. Forest 1972, 99, 172–178. [Google Scholar] [CrossRef]
  13. Deb, P.; Sundriyal, R.C. Tree regeneration and seedling survival patterns in old-growth lowland tropical rainforest in Namdapha National Park, north-east India. For. Ecol. Manag. 2008, 255, 3995–4006. [Google Scholar] [CrossRef]
  14. Trevor Caughlin, T.; Peña-Domene, M.; Martínez-Garza, C. Demographic costs and benefits of natural regeneration during tropical forest restoration. Ecol. Lett. 2019, 22, 34–44. [Google Scholar] [CrossRef] [PubMed]
  15. Lee, C.B.; Chun, J.H.; Song, H.K.; Cho, H.J. Altitudinal patterns of plant species richness on the Baekdudaegan Mountains, South Korea: Mid-domain effect, area, climate, and Rapoport’s rule. Ecol. Res. 2013, 28, 67–79. [Google Scholar] [CrossRef]
  16. Jactel, H.; Bauhus, J.; Boberg, J. Tree diversity drives forest stand resistance to natural disturbances. Curr. For. Rep. 2017, 3, 223–243. [Google Scholar] [CrossRef]
  17. Sterner, R.W.; Ribic, C.A.; Schatz, G.E. Testing for life historical changes in spatial patterns of four tropical tree species. J. Ecol. 1986, 3, 621–633. [Google Scholar] [CrossRef]
  18. Bennett, N.J.; Roth, R.; Klain, S.C.; Chan, K.; Christie, P.; Clark, D.A.; Cullman, G.; Curran, D.; Durbin, T.J.; Epstein, G.; et al. Conservation social science: Understanding and integrating human dimensions to improve conservation. Biol. Conserv. 2017, 205, 93–108. [Google Scholar] [CrossRef]
  19. Jiang, Y.; Kang, M.; Zhu, Y.; Xu, G. Plant biodiversity patterns on Helan mountain, China. Acta Oecologica 2007, 32, 125–133. [Google Scholar] [CrossRef]
  20. Wang, W.; He, Z.; Du, J.; Ma, D.; Zhao, P. Altitudinal patterns of species richness and flowering phenology in herbaceous community in Qilian Mountains of China. Int. J. Biometeorol. 2022, 66, 741–751. [Google Scholar] [CrossRef]
  21. Jiang, Z.; Ma, K.; Liu, H.; Tang, Z. A trait-based approach reveals the importance of biotic filter for elevational herb richness pattern. J. Biogeogr. 2018, 45, 2288–2298. [Google Scholar] [CrossRef]
  22. O’Brien, E. Water-energy dynamics, climate, and prediction of woody plant species richness: An interim general model. J. Biogeogr. 1998, 25, 379–398. [Google Scholar] [CrossRef]
  23. Currie, D.J.; Mittelbach, G.G.; Cornell, H.V. Predictions and tests of climate-based hypotheses of broad-scale variation in taxonomic richness. Ecol. Lett. 2004, 7, 1121–1134. [Google Scholar] [CrossRef]
  24. Letten, A.D.; Ashcroft, M.B.; Keith, D.A. The importance of temporal climate variability for spatial patterns in plant diversity. Ecography 2013, 36, 1341–1349. [Google Scholar] [CrossRef]
  25. Tang, R.; Li, S.; Lang, X.; Huang, X.; Su, J. Rare species contribute greater to ecosystem multifunctionality in a subtropical forest than common species due to their functional diversity. For. Ecol. Manag. 2023, 538, 120981. [Google Scholar] [CrossRef]
  26. Huang, X.; Sun, X.; Jiang, Y.; Xue, F.; Cui, M.; Zhao, S.; Kang, M. The Radial Growth of Picea wilsonii Was More Restricted by Precipitation Due to Climate Warming on Mt. Guandi, China. Forests 2021, 12, 1602. [Google Scholar] [CrossRef]
  27. Zhang, J.T.; Song, N.; Fan, L. Evaluation of nine distance-based measures of functional diversity applied to forest communities. Ann. For. Res. 2013, 56, 43–52. [Google Scholar] [CrossRef]
  28. Xu, M.; Ma, L.; Jia, Y.; Liu, M. Integrating the effects of latitude and altitude on the spatial differentiation of plant community diversity in a mountainous ecosystem in China. PLoS ONE 2017, 12, e0174231. [Google Scholar] [CrossRef]
  29. Wang, H.; Zhang, M.; Nan, H. Abiotic and biotic drivers of species diversity in understory layers of cold temperate coniferous forests in North China. J. For. Res. 2019, 30, 2213–2225. [Google Scholar] [CrossRef]
  30. Gao, J.; Zhang, Y. Distributional patterns of species diversity of main plant communities along altitudinal gradient in secondary forest region, Guandi Mountain, China. J. For. Res. 2006, 17, 111–115. [Google Scholar] [CrossRef]
  31. Zhou, X.; Fu, L.; Sharma, R.P. Generalized or general mixed-effect modelling of tree morality of Larix gmelinii subsp. principis-rupprechtii in Northern China. J. For. Res. 2021, 32, 2447–2458. (In Chinese) [Google Scholar] [CrossRef]
  32. Haq, S.M.; Calixto, E.S.; Rashid, I.; Srivastava, G.; Khuroo, A.A. Tree diversity, distribution and regeneration in major forest types along an extensive elevational gradient in Indian Himalaya: Implications for sustainable forest management. For. Ecol. Manag. 2022, 506, 119968. [Google Scholar] [CrossRef]
  33. Gairola, S.; Sharma, C.M.; Ghildiyal, S.K.; Suyal, S. Regeneration dynamics of dominant tree species along an altitudinal gradient in moist temperate valley slopes of the Garhwal Himalaya. J. For. Res. 2012, 23, 53–63. [Google Scholar] [CrossRef]
  34. Haq, S.M.; Rashid, I.; Khuroo, A.A. Anthropogenic disturbances alter community structure in the forests of Kashmir Himalaya. Trop. Ecol. 2019, 60, 6–15. [Google Scholar] [CrossRef]
  35. Sagar, R.; Raghubanshi, A.; Singh, S. Tree species composition, dispersion and diversity along a disturbance gradient in a dry tropical forest region of India. For. Ecol. Manag. 2003, 186, 61–71. [Google Scholar] [CrossRef]
  36. Yao, Z.; Shi, L.; He, Y. Grazing intensity, duration, and grassland type determine the relationship between soil microbial diversity and ecosystem multifunctionality in Chinese grasslands: A meta-analysis. Ecol. Indic. 2023, 154, 110801. [Google Scholar] [CrossRef]
  37. Wu, Q.; Zhang, J.; Wu, Y. The Influence of Tourism on the Plant Diversity of the Eight Streams of Guandi Mountain. S. China Agric. 2018, 12, 92–95. (In Chinese) [Google Scholar] [CrossRef]
  38. Zhang, M.; Kang, X.; Meng, J.; Zhang, L. Distribution patterns and associations of dominant tree species in a mixed coniferous-broadleaf forest in the Changbai Mountains. J. Mt. Sci. 2015, 12, 659–670. [Google Scholar] [CrossRef]
  39. Zhang, M. Spatial association and optimum adjacent distribution of trees in a mixed coniferous-broadleaf forest in northeastern China. Appl. Ecol. Environ. Res. 2017, 15, 1551–1564. [Google Scholar] [CrossRef]
  40. Sajad, S.; Haq, S.M.; Yaqoob, U.; Calixto, E.S.; Hassan, M. Tree composition and standing biomass in forests of the northern part of Kashmir Himalaya. Vegetos 2021, 34, 857–866. [Google Scholar] [CrossRef]
  41. Kim, T.K. Understanding one-way ANOVA using conceptual figures. Korean J. Anesthesiol. 2017, 70, 22–26. [Google Scholar] [CrossRef] [PubMed]
  42. R Core Team, R. A Language and Environment for Statistical Computing; R Foundation for Statistical Computing: Vienna, Austria, 2021; Available online: https://www.R-project.org/ (accessed on 20 July 2022).
  43. Van Den Wollenberg, A.L. Redundancy analysis an alternative for canonical correlation analysis. Psychometrika 1977, 42, 207–219. [Google Scholar] [CrossRef]
  44. Ewald, J. The influence of coniferous canopies on understorey vegetation and soils in mountain forests of the northern Calcareous Alps. Appl. Veg. Sci. 2000, 3, 123–134. [Google Scholar] [CrossRef]
  45. Franklin, J.; Andrade, R.; Daniels, M.L. Geographical ecology of dry forest tree communities in the West Indies. J. Biogeogr. 2018, 45, 1168–1181. [Google Scholar] [CrossRef]
  46. Jin, Y.; Li, J.; Liu, C. Precipitation reduction alters herbaceous community structure and composition in a savanna. J. Veg. Sci. 2019, 30, 821–831. [Google Scholar] [CrossRef]
  47. Utaile, Y.U.; Helsen, K.; Aydagnehum, S.G. Typology of the woody plant communities of the Ethiopian Nech Sar National Park and an assessment of vegetation-environment relations and human disturbance impacts. Plant Ecol. Evol. 2020, 153, 33–44. [Google Scholar] [CrossRef]
  48. Ni, X.; Guo, W.; Liu, T. Long-Term effects of altered precipitation patterns on alpine vegetation species composition on the Qinghai-Tibet Plateau. Forests 2022, 14, 47. [Google Scholar] [CrossRef]
  49. Ming, A.; Yang, Y.; Liu, S. A decade of close-to-nature transformation alters species composition and increases plant community diversity in two coniferous plantations. Front. Plant Sci. 2020, 11, 1141. [Google Scholar] [CrossRef]
  50. Muche, M.; Molla, E.; Rewald, B.; Tsegay, B.A. Diversity and composition of farm plantation tree/shrub species along altitudinal gradients in North-eastern Ethiopia: Implication for conservation. Heliyon 2022, 8, e09048. [Google Scholar] [CrossRef] [PubMed]
  51. Wang, M.; Yang, J.; Gao, H.; Xu, W.; Dong, M.; Shen, G.; Zhou, X. Interspecific plant competition increases soil labile organic carbon and nitrogen contents. For. Ecol. Manag. 2020, 462, 117991. [Google Scholar] [CrossRef]
  52. Huang, W.; Pohjonen, V.; Johansson, S.; Nashanda, M.; Katigula, M.I.L.; Luukkanen, O. Species diversity, forest structure and species composition in Tanzanian tropical forests. For. Ecol. Manag. 2003, 173, 11–24. [Google Scholar] [CrossRef]
  53. Wang, Y.; Bao, W.; Wu, N. Shrub island effects on a high-altitude forest cutover in the eastern Tibetan Plateau. Ann. For. Sci. 2011, 68, 1127. [Google Scholar] [CrossRef]
  54. Liu, B. Vertical patterns in plant diversity and their relations with environmental factors on the southern slope of the Tianshan Mountains (middle section) in Xinjiang (China). J. Mt. Sci. 2017, 14, 742–757. [Google Scholar] [CrossRef]
  55. Wen, B.; Zhang, X.; Yang, Z. Influence of tourist disturbance on soil properties, plant communities, and surface water quality in the Tianchi scenic area of Xinjiang, China. J. Arid Land 2016, 8, 304–313. [Google Scholar] [CrossRef]
  56. Cui, W.; Zheng, X.X. Spatial heterogeneity in tree diversity and forest structure of evergreen broadleaf forests in Southern China along an altitudinal gradient. Forests 2016, 7, 216. [Google Scholar] [CrossRef]
  57. Zhao, J.; Yang, H.; Qu, M.; Yang, S.; Wang, W.; Zhao, W. The interactions among herbaceous diversity, edaphic factors, and topography under typical afforestation in the transition zone between the Qinghai–Tibet Plateau and Loess Plateau. J. Plant Interact. 2021, 16, 75–82. [Google Scholar] [CrossRef]
  58. Chen, T.G.; Zhang, J.T.; Shangguan, T.L.; Zhang, F.; Wang, Q.X. The study of diversity in Shenweigou of Guandi Mountain, Shanxi Province. Acta Bot. Boreali-Occident. Sin. 2000, 20, 638–646. (In Chinese) [Google Scholar] [CrossRef]
  59. McCain, C.M. Could temperature and water availability drive elevational species richness patterns? A global case study for bats. Glob. Ecol. Biogeogr. 2007, 16, 1–13. [Google Scholar] [CrossRef]
  60. Khumbongmayum, A.D.; Khan, M.L.; Tripathi, R.S. Survival and growth of seedlings of a few tree species in the four sacred groves of Manipur, Northeast India. Curr. Sci. 2005, 88, 1781–1788. [Google Scholar] [CrossRef]
  61. Rahman, I.U.; Afzal, A.; Iqbal, Z.; Bussmann, R.W.; Alsamadany, H.; Calixto, E.S.; Ijaz, F. Ecological gradients hosting plant communities in Himalayan subalpine pastures: Application of multivariate approaches to identify indicator species. Ecol. Inform. 2020, 60, 101162. [Google Scholar] [CrossRef]
  62. Jantz, P.; Goetz, S.; Laporte, N. Carbon stock corridors to mitigate climate change and promote biodiversity in the tropics. Nature Clim. Chang. 2014, 4, 138–142. [Google Scholar] [CrossRef]
  63. Rawat, D.S.; Dash, S.S.; Sinha, B.K.; Kumar, V.; Banerjee, A.; Singh, P. Community structure and regeneration status of tree species in Eastern Himalaya: A case study from Neora Valley National Park, West Bengal, India. Taiwania 2018, 63, 16–24. [Google Scholar] [CrossRef]
  64. Gebeyehu, G.; Soromessa, T.; Bekele, T.; Teketay, D. Species composition, stand structure, and regeneration status of tree species in dry Afromontane forests of Awi Zone, northwestern Ethiopia. Ecosyst. Health Sustain. 2019, 5, 199–215. [Google Scholar] [CrossRef]
  65. Wang, X.; Ye, J.; Li, B.; Zhang, J.; Lin, F.; Hao, Z. Spatial distributions of species in an old-growth temperate forest, northeastern China. Can. J. For. Res. 2010, 40, 1011–1019. [Google Scholar] [CrossRef]
  66. Kang, X.; Yang, H.; Guo, Z.; Xu, M.; Zhao, H. Species interactions in spruce–fir mixed stands and implications for enrichment planting in the Changbai Mountains, China. Mt. Res. Dev. 2012, 32, 187–196. [Google Scholar] [CrossRef]
  67. Bharathi, S.; Devi Prasad, A.G. Diversity, population structure and regeneration status of arboreal species in the four sacred groves of Kushalnagar, Karnataka. J. For. Res. 2017, 28, 357–370. [Google Scholar] [CrossRef]
  68. Malik, Z.A.; Bhatt, A.B. Regeneration status of tree species and survival of their seedlings in Kedarnath Wildlife Sanctuary and its adjoining areas in Western Himalaya, India. Trop. Ecol. 2016, 57, 677–690. [Google Scholar]
  69. Moktan, M.R.; Gratzer, G.; Richards, W.H. Regeneration of mixed conifer forests under group tree selection harvest management in western Bhutan Himalayas. For. Ecol. Manag. 2009, 257, 2121–2132. [Google Scholar] [CrossRef]
  70. Lorimer, C.G.; Chapman, J.W.; Lambert, W.D. Tall understorey vegetation as a factor in the poor development of oak seedlings beneath mature stands. J. Ecol. 1994, 82, 227. [Google Scholar] [CrossRef]
  71. Sagar, R.; Singh, J.S. Structure, diversity, and regeneration of tropical dry deciduous forest of northern India. Biodivers. Conserv. 2005, 14, 935–959. [Google Scholar] [CrossRef]
  72. Vetaas, O.R. The effect of environmental factors on the regeneration of Quercus semecarpifolia Sm. in central Himalaya, Nepal. Plant Ecol. 2000, 146, 137–144. [Google Scholar] [CrossRef]
  73. Belden, A.C.; Pallardy, S.G. Successional trends and apparent Acer saccharum regeneration failure in an oak-hickory forest in central Missouri, USA. Plant Ecol. 2009, 204, 305–322. [Google Scholar] [CrossRef]
  74. Schipper, A.M.; Posthuma, L.; de Zwart, D.; Huijbregts, M.A.J. Deriving field-based species sensitivity distributions (f-SSDs) from stacked species distribution models (S-SDMs). Environ. Sci. Technol. 2014, 48, 14464–14471. [Google Scholar] [CrossRef] [PubMed]
  75. Gotore, T.; Ndagurwa, H.G.T.; Kativu, S. Woody plant assemblage and the structure of miombo woodland along a disturbance gradient in Hurungwe, Zambezi Valley, Zimbabwe. J. For. Res. 2021, 32, 1867–1877. [Google Scholar] [CrossRef]
  76. Pausas, J.G.; Austin, M.P. Patterns of plant species richness in relation to different environments: An appraisal. J. Veg. Sci. 2001, 12, 153–166. [Google Scholar] [CrossRef]
  77. Qin, H.; Zhang, Y.H.; Dong, G. Altitudinal patterns of taxonomic, phylogenetic and functional diversity of forest communities in Mount Guandi, Shanxi, China. Chin. J. Plant Ecol. 2019, 43, 762–773. Available online: http://www.plant-ecology.com (accessed on 1 July 2023). (In Chinese).
  78. Qian, H.; Hao, Z.; Zhang, J. Phylogenetic structure and phylogenetic diversity of angiosperm assemblages in forests along an elevational gradient in Changbaishan, China. J. Plant Ecol. 2014, 7, 154–165. [Google Scholar] [CrossRef]
  79. Sanchez, M.; Pedroni, F.; Eisenlohr, P.V.; Oliveira-Filho, A.T. Changes in tree community composition and structure of Atlantic rain forest on a slope of the Serra do Mar range, southeastern Brazil, from near sea level to 1000 m of altitude. Flora 2013, 208, 184–196. [Google Scholar] [CrossRef]
  80. Myers-Smith, I.H.; Hik, D.S. Climate warming as a driver of tundra shrubline advance. J. Ecol. 2018, 106, 547–560. [Google Scholar] [CrossRef]
  81. Khan, M.; Khan, S.M.; Ilyas, M.; Alqarawi, A.A.; Ahmad, Z.; Abd_Allah, E.F. Plant species and communities assessment in interaction with edaphic and topographic factors; an ecological study of the mount Eelum District Swat, Pakistan. Saudi J. Biol. Sci. 2017, 24, 778–786. [Google Scholar] [CrossRef]
  82. Silva Pedro, M.; Rammer, W.; Seidl, R. A disturbance-induced increase in tree species diversity facilitates forest productivity. Landsc. Ecol. 2016, 31, 989–1004. [Google Scholar] [CrossRef]
  83. Oldfield, C.; Peterson, C. Woody species composition, diversity, and recovery six years after wind disturbance and salvage logging of a southern Appalachian forest. Forests 2019, 10, 129. [Google Scholar] [CrossRef]
  84. Viljur, M.; Abella, S.R.; Adámek, M. The effect of natural disturbances on forest biodiversity: An ecological synthesis. Biol. Rev. 2022, 97, 1930–1947. [Google Scholar] [CrossRef] [PubMed]
  85. Qi, L.; Zhao, F.Q. Impact of logging intensity on the spatial distribution and association of dominant tree species in a broadleaved Korean pine mixed forest. Acta Ecol. Sin. 2015, 35, 0046–0055. (In Chinese) [Google Scholar] [CrossRef]
  86. Ding, Y.; Zang, R.; Lu, X.; Huang, J. The Impacts of selective logging and clear-cutting on woody plant diversity after years of natural recovery in a tropical montane rain forest, South China. Sci. Total Environ. 2017, 579, 1683–1691. [Google Scholar] [CrossRef]
  87. Xue, Y.; Cheng, A.; Li, S. The influence of environmental and species diversity on the survival of shrubs within subtropical forests. Biodiversity 2023, 31, 23–33. (In Chinese) [Google Scholar] [CrossRef]
  88. Zhang, Y.; Jin, B.; Zhang, X. Grazing alters the relationships between species diversity and biomass during community succession in a semiarid grassland. Sci. Total Environ. 2023, 887, 164155. [Google Scholar] [CrossRef]
Figure 1. Map of the Guandi Mountain Forest Area indicating the sampling sites along the altitudinal gradient in the study area. Note: (a) represents low-altitude sample sites, (b) indicates middle-altitude sample sites, and (c) denotes high-altitude sample sites.
Forests 15 00771 g001
Figure 2. Major species distributed across various altitudes of the secondary Picea forest in the study area. (The direction of the lines illustrates the dominant species presented along altitudes in these samples, and the thickness of each bar denotes the importance value of the dominant species in each sample. Three-letter codes were utilized to denote each species.).
Forests 15 00771 g002
Figure 3. Diversity indices of various vegetation layers along altitudes. Note: different capital letters (A, B) indicate significant differences in species diversity in the same vegetation layers at different altitudes, with a significance level of α = 0.05. (a): Shannon diversity index, (b): Simpson’s dominance index, (c): Pielou evenness index, (d): Margalef index, (e): Fisher’s alpha.
Forests 15 00771 g003
Figure 4. Heatmap results of correlations between diversity index and regeneration parameters of various vegetation layers in a secondary Picea forest throughout the study area. Note: (a) denotes the tree layer, (b) indicates the shrub layer, and (c) indicates the herb layer; SDH = Shannon diversity index, SDM = Simpson’s dominance index, PIE = Pielou’s evenness index, MAG = Margalef index, FSA = Fisher’s alpha; SED = Seedling Density, SAD = Sapling Density, Se/At = Seedling/Adult tree ratio, Sa/At = Sapling/Adult tree ratio, TBC = Total Basal Cover, TDN = Tree Density, * p ≤ 0.05, ** p ≤ 0.01, *** p ≤ 0.001.
Forests 15 00771 g004
Figure 5. Correlation heatmap and redundancy analysis of species diversity characterized by the disturbance and environmental variables in the secondary Picea forest vegetation layers. Note: (a) denotes the tree layer, (b) indicates the shrub layer, and (c) indicates the herb layer; SDH = Shannon Diversity Index, SDM = Simpson’s dominance index, PIE = Pielou’s evenness index, MAG = Margalef index, FSA = Fisher’s alpha, ATH = average tree height. * p ≤ 0.05, ** p ≤ 0.01, *** p ≤ 0.001.
Forests 15 00771 g005
Table 1. Disturbance Status of Sample Plots.
Interference IntensityInterference LevelInterference Category
CuttingGrazingTraveling
No/Low0Relative pile density < 0.1Livestock carrying capacity 0.5 to 1.5 sheep·ha−1·a−1Traces of plant loss are identified after trampling by tourists; there are dense bare patches within the transect, with widespread livestock feces visible; there are many types and quantities of garbage.
Moderate10.1 ≤ Relative pile density ≤ 0.2Livestock carrying capacity 1.5 to 2.5 sheep·ha−1·a−1The density of trampling marks decreases and is nearly nonexistent; scattered bare spots within the sample strip are not very noticeable, with occasional occurrences of livestock feces; there is a relatively small amount of garbage.
High2Relative pile density > 0.2Livestock carrying capacity 2.5 to 4.5 sheep·ha−1·a−1No obvious bare spots, livestock feces are hardly visible, no tourist garbage.
Table 2. Features and degree of disturbance across each sample plot. LA indicates low altitude, MA indicates middle altitude, and HA indicates high altitude. MAT indicates mean annual temperature. MAP indicates mean annual precipitation.
Altitude Gradient/mPlot /NO.Forest Stand FactorTerrain FactorClimate FactorInterference Factor
Relative Stand DensityRelative Canopy DensityAverage Height/mAverage DBH/cmAspect/°SlopeMAT/°CMAP/mmCuttingGrazingTraveling
LA
(1850–1950)
L10.160.1124.1124.631800.234.1674110
L20.130.1225.3127.051800.244.1674111
L30.140.1119.5623.441810.244.2674010
MA
(2050–2150)
M40.100.1121.7926.412980.354.1670201
M50.080.1224.0229.492260.354.1669101
M60.110.1118.0425.073120.354.1669101
HA
(2250–2350)
H70.090.1115.2424.312300.265.6662211
H80.100.1017.8223.14900.305.5659212
H90.100.1015.6020.363000.265.5660212
Table 3. Regeneration attributes of secondary Picea forest in the study area across distinct altitudinal gradients. SED = Seedling Density, SAD = Sapling Density, Se/At = Seedling/Adult tree ratio, Sa/At = Sapling/Adult tree ratio, TBC = Total Basal Cover, TDN = Tree Density.
Altitude Gradient/mPlot/NO.SED/
(Plant·ha)
SAD/
(Plant·ha)
Se/AtSa/AtTBC/
(m2·ha)
TDN/
(Plant·ha)
LA
(1850–1950)
L120880.020.1030.13844
L212480.020.0733.13732
L356920.090.1424.58656
MA
(2050–2150)
M492440.200.1025.15460
M528520.080.1428.40368
M6521040.110.2220.73472
HA
(2250–2350)
H7116360.320.1016.86364
H896360.210.0817.51456
H9240320.690.0919.90348
Table 4. Regeneration attributes of primary species found in secondary Picea forest across the study area under distinct altitudinal gradients.
Altitude Gradient/mSpeciesSED/
(Plant·ha)
SAD/
(Plant·ha)
TDN/
(Plant·ha)
Se/AtSa/At
LA
(1850–1950)
Picea asperata813217960.0040.07
Larix principis-rupprechtii484000.010.02
Betula platyphylla416200.200.80
Quercus wutaishansea2432834
MA
(2050–2150)
Picea asperata483210800.040.03
Larix principis-rupprechtii881160.070.07
Betula albosinensis116156522.233
HA
(2250–2350)
Picea asperata4361007360.590.136
Larix principis-rupprechtii1644080.040.01
Disclaimer/Publisher’s Note: The statements, opinions and data contained in all publications are solely those of the individual author(s) and contributor(s) and not of MDPI and/or the editor(s). MDPI and/or the editor(s) disclaim responsibility for any injury to people or property resulting from any ideas, methods, instructions or products referred to in the content.

