
Prediction of the Potential Distribution of Teinopalpus aureus Mell, 1923 (Lepidoptera, Papilionidae) in China Using Habitat Suitability Models

1
Beijing Key Laboratory for Forest Pest Control, Beijing Forestry University, Beijing 100083, China
2
State Key Laboratory to Efficient Production of Forest Resources, Beijing Forestry University, Beijing 100083, China
3
College of Forestry, Shenyang Agricultural University, Shenyang 110866, China
*
Author to whom correspondence should be addressed.
Forests 2024, 15(5), 828; https://doi.org/10.3390/f15050828
Submission received: 23 February 2024
/
Revised: 24 April 2024
/
Accepted: 4 May 2024
/
Published: 8 May 2024
(This article belongs to the Special Issue Forest/Urban Forest Systems under Climate Change: Carbon Dynamics, Ecological Functions, and Sustainable Management)
Abstract
:The Golden Kaiser-I-Hind (Teinopalpus aureus Mell, 1923) is the only butterfly among Class I national protected animals in China and is known as the national butterfly. In this study, by accurately predicting the suitable habitat in China under current and future climate scenarios, the potential distribution area of T. aureus was defined, providing a theoretical basis for conservation and management. Based on species distribution records, we utilized the Biomod2 platform to combine climate data from the BCC-CSM2-MR climate model, future shared socio-economic pathways, and altitude data. The potential distribution areas of T. aureus in the current (1970–2000s) and future SSP1_2.6 and SSP5_8.5 climate scenarios in China in 2041–2060 (2050s), 2061–2080 (2070s), and 2081–2100 (2090s) were predicted. The AUC and TSS values of the combined model based on five algorithms were greater than those of the single models, and the AUC value of the receiver operating characteristic curve was 0.990, indicating that the model had high reliability and accuracy. The screening of environmental variables showed that the habitat area of T. aureus in China was mainly affected by annual precipitation, precipitation in the driest month, the lowest temperature in the coldest month, temperature seasonality, elevation, and other factors. Under the current circumstances, the habitat area of T. aureus was mainly located in southern China, including Fujian, Guangdong, Guangxi, Hainan, Zhejiang, Yunnan, Guizhou, Hunan, Taiwan, and other provinces. The suitable area is approximately 138.95 × 10⁴ km2; among them, the highly suitable area of 34.43 × 10⁴ km2 is a priority area in urgent need of protection. Under both SSP1_2.6 and SSP5_8.5, the population centroid tended to shift southward in the 2050s and 2070s, and began to migrate northeast in the 2090s. Temperature, rainfall, and altitude influenced the distribution of T. aureus. In the two climate scenarios, the habitat area of T. aureus declined to different degrees, and the reduction was most obvious in the SSP5_8.5 scenario; climate was the most likely environmental variable to cause a change in the geographical distribution. Climate change will significantly affect the evolution and potential distribution of T. aureus in China and will increase the risk of extinction. Accordingly, it is necessary to strengthen protection and to implement active and effective measures to reduce the negative impact of climate change on T. aureus.
1. Introduction
Global climate change has significantly impacted species distributions, and analyzing the impact of climate change has become a major topic of research in various fields, including ecology [1,2]. According to the Sixth Assessment Report released by the Intergovernmental Panel on Climate Change (IPCC) in Interlaken, Switzerland, over the past century, the combustion of fossil fuels and unequal, unsustainable use of energy and land have led to a continuous rise in global temperatures, which are now 1.1 °C higher than pre-industrial levels [3]. This has led to more frequent and more intense extreme weather events, posing an increasingly serious threat to nature and humanity in every region of the world [4]. For insects, climate change can affect the overwintering survival rate, increase effective accumulated temperatures and the number of generations, and affect migration, dispersal, and distribution [5], while also reducing regional species diversity and further increasing the risk of species extinction [6].
To understand the specific environmental requirements of target species, species distribution models (SDMs) or ecological niche models are widely used. These models utilize statistical algorithms to simulate ranges in multidimensional environmental spaces, abstract ecological niches, or ranges into statistical rules, and simulate the potential distribution of suitable habitats for species in different spatial and temporal environments [6,7]. In recent years, with the development of statistical algorithms and niche species distribution models, dozens of distribution prediction models have been proposed in many studies, but their scope of application and theoretical algorithms vary. Since R released the biomod package in 2003, it has been widely recognized and used by biologists, and the combined model established based on R has a higher prediction accuracy for species distribution than that of a single model [8,9]. The updated biomod2 package has a good fit even with a small sample size (population) (<20) [10].
The Golden Kaiser-i-Hind (Teinopalpus aureus Mell, 1923) is a typical mountain butterfly species from the family Papilionidae [11]. It is distributed in subtropical and tropical regions of China, Vietnam, and Laos, limited to mountains with steep terrain and high forest coverage rate [12,13,14]. Owing to its rarity in the wild, the species has garnered significant attention from entomologists and conservation researchers worldwide. T. aureus is adapted to evergreen broad-leaved forests and is considered a habitat-specialized species. The confirmed host plants include a few species of magnolia trees, making it a relatively oligophagous insect. The egg and larval stages often live in the canopy of trees [15]. In the tropical rain forest of Hainan, this butterfly, like most lepidoptera insects, has the characteristics of year-round occurrence and overlapping generations [16]. Studies in Guangxi have shown that female butterflies mostly choose to lay eggs in the canopy of host plants that can be irradiated by sunlight. There are two generations per year and each female generally only lays one or two eggs on each host plant [15,17]. Due to the influence of habitat selection and human activities, the geographical population of the butterfly is limited to a few mountainous areas, and the habitat is distributed in an “island” shape [18]. In 1989, China included this butterfly in the national key protected wildlife list, making it the only butterfly species in China’s first-level protected wildlife category [19]. In 2021, China included it in the “14th Five-Year Plan” for the development of forestry and grassland protection, making it the only insect species among the 48 wild animals in urgent need of rescue protection [20]. Although the conservation work of T. aureus has received high attention, the related research is still at a relatively basic stage, and no literature can provide information on the species richness of butterfly. As a result, it is difficult to obtain population occurrence data, and comprehensive information is lacking. To this day, the International Union for Conservation of Nature (IUCN) has listed this butterfly as “Data Deficient” [21].
Due to the limited historical occurrence data of the T. aureus and the need to improve the accuracy of models constructed based on a single algorithm [13], this study utilized the BCC-CSM2-MR climate model and future shared socio-economic pathways (SSPs) as climate data. By combining the geographical distribution and biological data of the T. aureus, the ensemble model (ESMs) by biomod2 [22] approach was employed to simulate the potential suitable habitat distribution of the butterfly in China. The aim was to predict the potential geographical distribution of the species with limited data in China with the ultimate goal of providing a theoretical basis for the conservation and management of the T. aureus. Therefore, the determination of the potential distribution changes under different climatic backgrounds in China can provide references for the future conservation of Papilio aureus in China.
2. Materials and Methods
A flow diagram showing the external data, analysis process, and derived data in the study is provided in Figure 1.
2.1. Species Location Data
The geographical distribution data for T. aureus in China were mainly obtained from geographical coordinate records in the published literature (Table 1) and websites that record biological coordinate information, including the Global Biodiversity Information Network (GBIF, https://www.gbif.org/, accessed on 16 June 2023; T. aureus: https://doi.org/10.15468/dl.asuzc7, downloaded 19 July 2023), National Animal Specimens Repository (NACRC, http://museum.ioz.ac.cn/index.html/; accessed on 16 June 2023; T. aureus: http://museum.ioz.ac.cn/species_detail.aspx?id=22471; accessed on 16 June 2023). After removing some data with uncertain information or ambiguous names, as well as non-terrestrial and duplicate records, 57 valid distribution point coordinates were collected. To reduce the impact of spatial autocorrelation and sampling bias on the final prediction results, SDM Toolbox (version 2.5) was used for sparse data processing [10] to ensure that only one distribution point was retained in each 10 km × 10 km grid [23]; 42 occurrences were eventually retained.
2.2. Acquisition and Selection of Bioclimate Variables
SSPs, as a new generation of socio-economic scenarios for climate change research, unify socio-economic assumptions used by various research communities, can serve as climate change projections, and facilitate integrated analyses of climate change impacts, vulnerability, adaptation, and mitigation. They also provide a basis for the assessment of climate policies and play an increasingly important role in predicting climate change and in related research and climate policy decisions [38,39].
In this study, future SSPs were used as climate data, and the new-generation climate system model BCC-CSM2-MR, developed by Beijing Climate Center (BCC) of China Meteorological Administration, was used as it can reasonably reproduce climate distribution characteristics. The correlation coefficient between the simulated results using this climate data and the observed values is 0.86, indicating that the model can well reproduce the climate distribution characteristics of China [40]. The SSP1_2.6 and SSP5_8.5 climate scenarios were used to predict the distribution of species under low radiative forcing and high radiative forcing. SSP1_2.6 assumes that the intensity of dependence on resources and fossil energy is artificially reduced, greenhouse gas emissions will be reduced to net zero around 2070, and the global average temperature increase will be 1.8 °C (1.3–2.4 °C) in 2081–2100 compared with that in 1850–1900. SSP5_8.5 emphasizes the traditional economic development orientation, with an energy system dominated by fossil fuels, resulting in substantial greenhouse gas emissions, and the global average temperature rise will be 4.4 °C (range: 3.3–5.7 °C) in 2081–2100 compared with that in 1850–1900 [3].
In order to improve the accuracy of prediction, this study combined the living habits of mountain butterflies and topographic data, and initially selected 19 bioclimatic variables (bio1–boi19) and elevation data (elev) with a spatial resolution of 2.5min. All the above environmental variables were obtained from WorldClim (http://www.worldclim.org; bioclimatic variables: accessed on 16 December 2023; https://www.worldclim.org/data/cmip6/cmip6_clim2.5m.html, downloaded 16 December 2023; elevation variables: accessed on 16 December 2023; https://www.worldclim.org/data/worldclim21.html, downloaded 16 December 2023).
Using the Extract Multi-values to Point function of ArcGIS (version 10.8), data for environment variables at 42 occurrences were extracted. To avoid the effects of correlated variables on prediction results and improve estimates of the direct or indirect impacts of environmental parameters on target species [41], ENMtools was used to screen 20 environmental variables before modeling, and Spearman correlation coefficient coefficients were evaluated. When the correlation coefficient was greater than 0.8, one of the representative environmental factors was retained [42]. The filter environment variables were used for model construction (Table 2).
2.3. Model Building and Testing
For high computational efficiency, the Biomod2 package was run with R4.2.4 in the study. Eleven models in the Biomod2 platform were used for modeling, including a generalized linear model (GLM), gradient boosted machine (GBM), classification and regression tree model (CTA), artificial neural network (ANN), surface distribution differentiation chamber model (SRE), flexible discriminant analysis (FDA), random forest (RF), maximum entropy model (MaxEnt), multivariate adaptive regression splines (MARS), extreme gradient boosting (XGBOOST), and generalized additive model (GAM). These algorithms have been applied for modelling environmental relationships for a wide range of species [43,44,45,46,47,48,49]. In addition to the MaxEnt model, the parameters optimized by the ENMeval package (regulated frequency multiplier RM = 0.5, feature combination LQ) were modeled, and the other models adopted the default settings recommended by Thuiller et al. [45]. To meet the modeling requirements of Biomod2 and better simulate the actual distribution, 1000 pseudo-missing data were randomly selected for modeling outside the suitable range predicted by the model [50]. To evaluate the performance of the species distribution model, the species distribution data were randomly divided into two parts: 75% as the training data set and 25% as the test data set [51]. To avoid the error caused by single modeling approaches, the above process was repeated 10 times for each model, resulting in 110 single total modeling results.
The area under the curve (AUC) and true skill statistics (TSS) were used to evaluate model performance; both parameters take values of [0,1]. The larger the value, the stronger the correlation between the distribution model and environmental variables, and the higher the accuracy of its prediction results [52,53]. When the AUC value ranges from 0.5 to 0.8, the prediction results of the model can be considered general. When the AUC value is greater than 0.8, the model has good or very good prediction performance [54]. TSS shares the advantages of Kappa in predicting species distributions in terms of the incidence, sensitivity, and specificity of occurrences but avoids the unimodal dependence on the incidence of distribution records [55]. When the TSS value is greater than 0.7, the prediction accuracy of the model is high [56]. After the model prediction results were derived for the single models, the five models with the highest TSS and AUC values were selected to construct a combined model.
2.4. Data Processing
After the selected environmental and distribution data for T. aureus were input into the combined model, the data generated from the model were visualized using ArcGIS 10.8. Jenks method for grading was used to divide the threshold of suitable area of T. aureus. According to Zhang’s study [28], the threshold was set and T. aureus was divided into four levels: non-suitable areas (0–0.1), low suitability areas (0.1–0.3), medium suitability areas (0.3–0.6), and high suitability areas (0.6–1). The area of the reclassified layer was tabulated by grid calculation, and the weight of each partition was obtained. Then, the area of each level was converted according to the actual area of the land cut out. The SDMtoolbox (version 2.5) toolkit was used to calculate the centroid position and migration direction of the habitat area of T. aureus in three periods under different climate scenarios.
3. Results
3.1. Evaluation of Model Prediction Accuracy
Based on AUC and TSS values, the prediction accuracies of single models and the combined model were evaluated (Table 3). The SRE had the worst prediction accuracy, with AUC and TSS values of 0.735 and 0.470, respectively, which could not simulate the distribution of suitable areas correctly. Except for the model constructed using the SRE algorithm, AUC values of all models were greater than 0.8 and TSS values were greater than 0.7, indicating that the models constructed based on a single algorithm could effectively predict the suitable areas of T. aureus. In particular, ANN, MARS, GLM, RF, and CTA yielded good simulation results for the suitable areas of T. aureus. Therefore, these five models were selected to build a combined model, and the prediction accuracy of the model was evaluated again. AUC and TSS values of the combined model were 0.990 and 0.972, respectively, both of which were greater than those of each of the single models and the prediction accuracy was higher, indicating that the prediction results of the suitable areas of T. aureus were excellent.
3.2. Importance Assessment of Bioclimatic Variables
An analysis of the importance of bioclimatic variables (Figure 2) revealed that annual precipitation (bio12), the precipitation of the driest month (bio14), and the minimum temperature of the coldest month (bio6) had the greatest impact on the habitat area of T. aureus. In addition, there was seasonal variation in temperature (bio4), elevation (elev), warmest quarterly precipitation (bio18), wettest quarterly average temperature (bio8), and coldest quarterly precipitation (bio19). In general, temperature, precipitation, and altitude had important effects on the habitat range of T. aureus.
According to the response curves of major environmental factors (Figure 3), the habitat suitability of T. aureus species increases significantly when the annual precipitation reaches about 1700 mm and the lowest temperature in the coldest month reaches about 3 degrees. The habitat suitability of T. aureus species first increases and then decreases in the driest month precipitation, indicating that it is more suitable for T. aureus to distribute in warm and humid areas with abundant rainfall.
3.3. Prediction of the Suitable Zone of T. aureus
As determined from the combined model (Figure 4), the current habitat area was mainly located in southern China, and the habitat range was 92° E–122° E, 31° N–18° N. At present, the total habitat area of T. aureus was 138.95 × 10⁴ km2, of which the highly suitable habitat area was 344,300 km2, mainly concentrated in Fujian, northern Guangdong, northeastern Guangxi, southern Jiangxi, southern Zhejiang, southern Hainan, and other areas. The moderately suitable area covered 41.47 × 10⁴ km2, mainly located in northern Hainan, northern Taiwan, and Guangxi, and scattered in southern Yunnan, Guangdong, Guizhou, Hunan, Zhejiang, Jiangxi, and other places. The low suitability area covered 63.05 × 10⁴ km2, mainly located in central Zhejiang, western Hunan, southern Chongqing, southern Guizhou, southern Yunnan, southwest Guangxi, and southwest Taiwan, and scattered in Sichuan, Anhui, Hubei, Xizang, and other places. Comparing the actual records of T. aureus with the map of habitat suitability based on the combination model, T. aureus had a large area of suitable habitat outside of known occurrences, including high suitability values in some areas of Taiwan (i.e., >0.3).
The combined model was used to simulate the future suitable habitat of T. aureus under the influence of climate change (Table 4, Figure 5, Figure 6 and Figure 7). Comparing the predicted suitable habitat areas in different periods revealed different responses of T. aureus to climate change. The habitat range in the three periods in China was predicted to decrease to a large extent. The two climate emission scenarios revealed that T. aureus will shrink in the Yunnan, Guizhou Guangdong, Guangxi, and other provinces, in addition to its original distribution (Figure 8). T. aureus was the most sensitive to climate change under SSP5_8.5. Compared with the current climate conditions, when 2050s (SSP1_2.6) was adopted, the suitable area of T. aureus decreased by 32.43 × 10⁴ km2, which is 23.34% less than the current suitable area. When the scenario SSP1_2.6(2070s) was adopted, the suitable area of T. aureus decreased by 54.42 × 10⁴ km2, which is 39.17% less than the current suitable area. When the scenario SSP1_2.6 (2090s) was adopted, the suitable area of T. aureus decreased by 62.02 × 10⁴ km2, which is 44.63% less than the current suitable area. When the scenario SSP5_8.5 (2050s) was adopted, the suitable habitat area of T. aureus decreased by 53.27 × 10⁴ km2, which is 37.75% less than the current suitable area. When the scenario SSP5_8.5 (2070s) was adopted, the suitable habitat area of T. aureus decreased by 57.88 × 10⁴ km2, which is 41.20% less than the current suitable area. When the scenario SSP5_8.5 (2090s) was adopted, the suitable habitat area of T. aureus decreased by and 77.92 × 10⁴ km2, which is 56.07% less than the current suitable area. In the 2070s, compared with the 2050s, the area of high suitability area increased by 3.72 × 10⁴ km2 and 3.04 × 10⁴ km2, respectively, under SSP1_2.6 and SSP5_8.5; however, the total suitable area still decreased. By the 2090s, under the two climate scenarios, the area of suitable habitat decreased by 44.6% and 56.1%, respectively, compared with the current suitable habitat, and Sichuan and Tibet were no longer suitable under the two climate scenarios.
3.4. Migration Route of the Centroid in Future Suitable Areas
In terms of spatial patterns, there were differences in the migration of T. aureus under different climate scenarios (Figure 9). At present, the population centroid of T. aureus was located in Xinning County, Shaoyang City, Hunan Province (111.26° E, 26.53° N). Under SSP1_2.6 in the 2050s and 2070s, the centroid of the suitable area of T. aureus migrated to the south. In the 2050s, the centroid of the suitable area of T. aureus was located in Changning City, Hengyang City, Hunan Province (112.58° E, 26.30° N), travel distance 133.58 km. The 2070s, the centroid was located in Guiyang County, Chenzhou City, Hunan Province (112.62° E, 25.87° N), travel distance 47.24 km again. In the 2090s, the center of mass shifted northward and was located in Yongxing County, Chenzhou City, Hunan Province (112.79° E, 26.17° N), having moved 32.26km to the northeast from 2070s. When the climate scenario was set to SSP5_8.5, the center of mass migrated southeast to Guiyang County, Chenzhou City, Hunan Province (112.53° E, 26.06° N) in the 2050s, travel distance 133.58 km; and southwest to Shuangpui County, Yongzhou City, Hunan Province (111.51° E, 25.88° N) in the 2070s, travel distance 104.72 km. By the 2090s, the centroid of T. aureus moved northwest to Chaling County, Zhuzhou City, Hunan Province (113.79° E, 26.73° N). It moved 246.4 km to the northeast from 2070s. Under the future climate change scenarios, global warming and increasing humidity will have migrated to the south slightly, on the centroid of the suitable habitat area of T. aureus in China; however, with the further change of climate, the centroid of T. aureus shifted to the northeast.
4. Discussion
4.1. Reliability of Habitat Suitability Prediction Results
In the process of simulating the appropriate distribution of T. aureus and future changes in resources using the Biomod2 package, the accuracies of the ANN, MARS, GLM, RF, and CTA models were high, and the accuracy of the integrated model was higher than those of the single models. It indicates that the ensemble model can better predict the distribution and change of T. aureus than the single model. The prediction results showed that the habitat area of T. aureus is mainly distributed in Fujian, Guangxi, Guangdong, Hainan, and other tropical and subtropical areas in China. It is basically consistent with the known distribution results at present. Compared with the prediction results obtained by Zhang [28], the predictions in this study showed a wider range in southern Yunnan and southern Tibet. Compared with the prediction results of Xing et al. and Wang, the results of this study showed a wider range in China. In addition to the slight differences in distribution records (this study included more distribution records in China), differences in the selection of environmental variables, variable screening methods, and parameter settings can explain the deviations in the final prediction results. It is very important to select the least correlated and biologically reasonable predictors to improve model accuracy [39].
4.2. Effects of Future Climate Scenarios on the Distribution of T. aureus
The distribution of T. aureus is restricted by various environmental conditions. In the screening of environmental variables, temperature and precipitation determined the potential geographical distribution of T. aureus to a certain extent. Bio12, bio14, and bio6 are the main environmental factors affecting the distribution of T. aureus. This is consistent with the actual survey results [16]. Hydrothermal conditions play a major role in the potential distribution of T. aureus in addition to topographic factors [56]. Overall, changes in temperature and precipitation may be the primary explanations for the loss of suitable northern areas.
The migration path of the centroid of suitable area for T. aureus differed among scenarios. The directions of migration were south and north, respectively, under SSP1_2.6 and SSP5_8.5. Many butterfly species tend to expand northward or to higher elevations due to environmental changes or retreat to areas with favorable terrain and microclimate conditions [57]. However, mountain species usually occupy specific climatic niches and are highly sensitive to environmental changes. For example, Habel et al.’s study [58] on Lycaena helle, Rodder et al.’s study [57] on the distribution of butterflies in alpine mountains, Filazzola et al. [59]’s study on the host plants of mountain butterflies, and Grabherr et al.’s study [60] on alpine flora and vegetation all proved this point; these species can generally only migrate to higher altitudes in the context of climate change [58]. In this study, in the 2050s and 2070s, the centroid moved southward under the two climate scenarios, which may indicate a shift to high altitudes, and the northern suitable area was lost first. After the 2090s, the centroid shifted to the north under both climate scenarios, and the southern suitable area was gradually lost.
There are no records of capture of T. aureus in Taiwan, Tibet, and other suitable areas in the prediction results. This may be due to the biological characteristics (for example, the migration ability is poor, the parasitic plant is single, and the flying ability is weak [61]) of T. aureus and its specific habitat requirements, which limits the distribution of the species. Once the original habitat is lost, it is difficult for the species to spread to other suitable habitats, creating an extinction risk. In addition, in the predicted range of suitable areas, due to the influence of human activities, the original forests in the current habitat of T. aureus have been largely reduced, most of which are young forests, and the stand structure has changed [62]. This decreased the available habitat of T. aureus and may be one of the reasons for the discrepancy between the butterfly’s habitat area and its distribution area. This limits gene exchange, thereby reducing genetic diversity and environmental adaptability and increasing the extinction risk [63].
According to the prediction results obtained using Biomod2, the habitat area of T. aureus showed a trend of first drastic reduction and then slight reduction with the warming and humidification of the climate. In particular, in the SSP5_8.5 scenario, climate change was predicted to have a serious negative impact on the distribution of T. aureus. In the 2090s, the overall habitat area of highly suitable area decreased by 51.12% and 64.65%, respectively, compared with the current situation. The biomod2 platform is used to evaluate the species niche and project it into the landscape, which can intuitively present the species occurrence probability, habitat suitability, or species richness, etc., and provide important decision-making basis for wildlife protection, nature reserve optimization, and nature reserve system construction in China.
In this study, we screened bioclimatic variables according to their correlation, ensuring maximum retention of species biological information while avoiding collinearity and redundant information. In order to understand the specific environmental requirements of T. aureus, this study established a combination model with small samples and more accurate biomod2 package, which has been widely used in Paeonia lactiflora, Populus davidiana, and other species. Understanding the habitat distribution of T. aureus and the impact of future climate change on its potential geographic distribution will be of great significance to the development of conservation planning and the enhancement of species protection. However, this study has some limitations because it does not use continuous climate change parameters and only climate and elevation were considered, and host plants, biological factors, and human interference were not superimposed. Therefore, multiple environmental factors, such as host plants, will be introduced in future studies to further improve the prediction accuracy; the response interval and its numerical range of climate change are needed in the future. In summary, a combined model was used to predict the potential distribution under the current and future climate scenarios in China, clearly revealing that climate change would lead to a significant reduction in the suitable habitat of this insect, which may lead to an extinction risk.
5. Conclusions
In this study, we evaluated the distribution of T. aureus in China. We also predicted the main potential distribution areas of T. aureus under current and future climate conditions. Through modeling and prediction, the potential distribution of T. aureus under the current climate in China is mainly concentrated in south China. With the changing climate, the suitable area for T. aureus will gradually move southward, then move northeast. The potential distribution of the natural enemies of T. aureus will reduce under climate change. The prediction results revealed that future climate change will decrease the potential distribution of T. aureus. This prediction has high reliability, accurately predicts the suitable range and degree of T. aureus, and has important significance for the protection of T. aureus in the future. At the same time, we should also vigorously promote energy conservation and emission reduction, strengthen habitat protection and restoration, carry out research on artificial breeding technology, strengthen public protection publicity, and jointly help T. aureus out of the threat of extinction.
Author Contributions
Conceptualization, Y.L.; methodology, Y.L.; software, Y.L. and X.Z.; validation, Y.L. and X.Z.; formal analysis, Y.L.; investigation, Y.L.; resources, X.Z.; data curation, Y.L.; writing—original draft preparation, Y.L.; writing—review and editing, Y.L.; visualization, Y.L.; supervision, S.Z.; project administration, S.Z.; funding acquisition, S.Z. All authors have read and agreed to the published version of the manuscript.
Funding
This research was supported by the Commissioned business item of National Forestry and Grassland Administration (DZW2023080007, DZW2023120049).
Data Availability Statement
Data are contained within the article.
Acknowledgments
We thank Yuting Zhou (Beijing Forestry University) for help with the logical structure and language of this paper. We also thank the reviewers and editor for their suggestions and help for the manuscript.
Conflicts of Interest
The authors declare no conflicts of interest.
References
- Bezeng, B.S.; Morales-Castilla, I.; van der Bank, M.; Yessoufou, K.; Daru, B.H.; Davies, T.J. Climate change may reduce the spread of non-native species. Ecosphere 2017, 8, 308–309. [Google Scholar] [CrossRef]
- Bellard, C.; Bertelsmeier, C.; Leadley, P.; Thuiller, W.; Courchamp, F. Impacts of climate change on the future of biodiversity. Ecol. Lett. 2012, 15, 365–377. [Google Scholar] [CrossRef] [PubMed]
- Intergovernmental Panel on Climate Change. AR6 Synthesis Report: Climate Change 2023. Available online: https://www.ipcc.ch/report/sixth-assessment-report-cycle/ (accessed on 9 January 2024).
- Shen, X.X.; Cao, S.Y. The Sixth Assessment Report of the Intergovernmental Panel on Climate Change Calls for Urgent Climate Action to Ensure a Sustainable Future (International Perspective). Available online: http://world.people.com.cn/n1/2023/0404/c1002-32657063.html (accessed on 9 January 2024).
- Dong, Z.K.; Ge, F. The fitness of insects in response to climate warming. Chin. J. Appl. Entomol. 2011, 48, 1141–1148. [Google Scholar]
- Robert, P.A. A framework for using niche models to estimate impacts of climate change on species distributions. Ann. N. Y. Acad. Sci. 2013, 1297, 8–28. [Google Scholar]
- Elith, J.; Leathwick, J.R. Species Distribution Models: Ecological Explanation and Prediction Across Space and Time. Annu. Rev. Ecol. Evol. Syst. 2009, 40, 677–697. [Google Scholar] [CrossRef]
- Aguirre-Gutiérrez, J.; Carvalheiro, L.G.; Polce, C.; van Loon, E.E.; Raes, N.; Reemer, M.; Biesmeijer, J.C. Fit-for-purpose: Species distribution model performanced epends onevaluation criteria: Dutch Hoverflie as a case study. PLoS ONE 2013, 8, e63708. [Google Scholar]
- Tang, Q.H.; Zong, D.L.; Zhou, J.; Hu, X.; Wang, T. The potential threat and driving factors of cropland weeds Aegilops tauschii and Ambrosia artemisiifolia under global climate change. Chin. J. Ecol. 2022, 08, 1130. [Google Scholar]
- Liu, T.; Liu, Y.P.; Lu, T.; Liang, R.F.; Liu, F.; Ma, Z.; Zhou, Y.H.; Chen, Z.; Su, X. Potential distribution of Littledalea, an endemic genus from the Qinghai-Tibet plateau, predicted by Biomod2 models. Acta Agrestia Sin. 2020, 28, 1650–1656. [Google Scholar]
- Lin, B.Z.; Zhu, X.F.; Zeng, J.P.; Yuan, J.X. Research on biological characteristics of Teinoplpus aureus in Jiulianshan. For. Res. 2017, 30, 399–408. [Google Scholar]
- Cotton, A.; Racheli, T. A preliminary annotated checklist of the Papilionidae of Laos with notes on taxonomy, phenology, distribution and variation (Lepidoptera, Papilionoidea). Fragm. Entomol. 2006, 38, 279–378. [Google Scholar] [CrossRef]
- Xing, S.; Tsun, F.A.; Dufour, P.C.; Cheng, W.; Yuan, F.L.; Jia, F.; Lien, V.V.; Wang, M.; Bonebrakea, T.C. Conservation of data deficient species under multiple threats: Lessons from an iconic tropical butterfly (Teinopalpus aureus). Biol. Conserv. 2019, 234, 154–164. [Google Scholar] [CrossRef]
- Vu, V.L.; Le, Q.T.; Christoph, L.H. Diversity of swallowtal butterfly species (Ropalocra, Papilionidae) in three protected areas of Thua Thien Hue province. J. For. Sci. Technol. 2019, 07, 82–87. [Google Scholar]
- Zeng, J.; Zhou, S.; Ding, J.; Luo, B.T.; Qin, K. Behavior characteristics and habitat adaptabilities of the endangered butterfly Teinopalpus aureus in Mount Dayao. Acta Ecol. Sin. 2012, 32, 6527–6534. [Google Scholar] [CrossRef]
- Chen, R.L.; Cai, Y.S.; Gong, Y.N.; Gu, M.B. Two new hosts of Teinopalpus aureus Mell found in the Nanling National Nature Reserve. Guangdong For. Technol. 2009, 25, 119–120. [Google Scholar]
- Zeng, J.; Zhou, S.; Luo, B.; Qin, K.; Liang, Y.L. Morphology and bionomics of the endangered butterfly golden kaiserihind‚ Teinopalpus aureus‚ in Dayaoshan of Guangxi. Chin. Bull. Entomol. 2008, 45, 457–464. [Google Scholar]
- Zou, W.; Zeng, J.P.; Jiang, M.N.; Wang, L.; Zhou, S.Y.; Zhang, J.T. Problems of subspecies taxonomy of rare butterflies and their significance in conservation: With Teinopalpus Hope as examples. Acta Entomol. Sin. 2021, 64, 1338–1349. [Google Scholar]
- National Forestry and Grassland Administration; Ministry of Agriculture and Rural Affairs of the People’s Republic of China. (No. 3 of 2021) National List of Wildlife under Special Protection. Available online: http://www.gov.cn/xinwen/2021-02/09/content_5586227.htm (accessed on 9 January 2024).
- National Forestry and Grassland Administration. Outline of the 14th Five-Year Plan for Forestry and Grassland Protection and Development. Available online: https://www.forestry.gov.cn/c/www/lczc/44287.jhtml (accessed on 9 January 2024).
- Gimenez-Dixon, M. Teinopalpus aureus. The IUCN Red List of Threatened Species 1996. Available online: https://www.iucnredlist.org/ (accessed on 9 January 2024).
- Araújo, M.B.; Pearson, R.G.; Thuiller, W.; Erhard, M. Validation of species–climate impact models under climate change. Glob. Change Biol. 2005, 11, 1504–1513. [Google Scholar] [CrossRef]
- Zhang, X.; Zhou, Y.; Xu, T.; Zong, S.X. Impact of Climate Change on the Habitat Suitability of Monochamus saltuarius Gebler (Coleoptera; Cerambycidae) and Its Natural Enemies in China. Forests 2024, 15, 33. [Google Scholar] [CrossRef]
- Zheng, H. The “Queen of Butterflies” Teinopalpus aureus Appeared in Taizhou for the First Time. Taizhou Daily, 16 May 2022. Available online: http://news.taizhou.com.cn/2022-05/16/content_6821334.htm (accessed on 9 January 2024).
- Huang, Y. Study on the Complete Mitochondrial Genomes of Teinopalpus aureus in Four Geographic Populations (Lepidoptera: Papilionidae) and Their Position of Phylogenetic Analysis; Guangxi Normal University: Guilin, China, 2014. [Google Scholar]
- Ye, Y.Z.; Yuan, Y.; Wang, H.X.; Ji, S.J.; Liu, L.H.; Wang, L.W. Description of 8 rare butterflies. China Sci. Technol. Inf. 2006, 20, 83–84+86. [Google Scholar]
- Xu, Q.; Jiang, F.; Lin, Y.; Huang, H.T.; Yao, L.Y. A brief account of the butterflies protected by state in Fujian. J. Fujian For. Sci. Technol. 2003, 30, 93–96. [Google Scholar]
- Zhang, H.F. Prediction of the potential sutable are of the rare and endangered species, Teinoplpus aureus in China. J. Jinggangshan Univ. (Nat. Sci.) 2023, 44, 56–62. [Google Scholar]
- Huang, Q.S. Teinopalpus aureus was discovered for the first time in Mangdangshan Nature Reserve. Fujian For. 2016, 12. [Google Scholar]
- Nie, X. The Distribution, Habitat Quality and Conservation Status of the Endangered Teinopalpus aureus in Jiangxi; Jiangxi Agricultural University: Nanchang, China, 2014. [Google Scholar]
- Zeng, J.; Lin, B.; Zhu, X.; Liu, L.Y. A host plant, Michelia maudiae, widespread–distributed in south China for the endangered butterfly of Teinopalpus aureus. Acta Agric. Univ. Jiangxiensis 2014, 36, 550–555. [Google Scholar]
- Ding, D.S.; Shi, M.; Zeng, Z.J.; Wang, A.Q.; Li, Z.H. Rare wild insects in Jiangxi (II). Jiang Xi Plant Prot. 2000, 23, 22–25. [Google Scholar]
- Chen, R.; Gu, M. The status and prospect of studies on Teinoplus aureus Mell. J. Environ. Entomol. 2009, 31, 80–84. [Google Scholar]
- Meng, L.; Mo, F.Y.; Tu, Z.; Zhou, S.Y.; Xue, Y.G. Discovery of a new distribution point of Teinopalpus aureus Mell in Guangxi, China. J. Guangxi Norm. Univ. (Nat. Sci. Ed.) 2016, 34, 134–136. [Google Scholar]
- He, D.; Jiang, G.; Yan, Z. Observations on copulatory and predatory behaviors of adult of Teinopalpus aureus Mell. Guangxi Sci. 2000, 7, 78–79. [Google Scholar]
- Mell, R. Noch unbeschriebene lepidopterenaus sudchina (II). Dtsch. Entomol. Z. 1923, 153–160. Available online: https://www.zobodat.at/pdf/Deutsche-Ent-Zeitschrift_1923_0153-0160.pdf (accessed on 9 January 2024).
- Zeng, F. Collection and preparation of butterfly specimens in Wuzhi mountain area. New Educ. 2012, 53. Available online: https://kns.cnki.net/kcms2/article/abstract?v=MuKJieOJLT0Cwsln0IEIyOwvErMlY1yJnXOYOXVR8VDUxvk927CVRhiTM0ERAU-8vGG75TWmUjO1HSVjB6_1pgd9xyg4dydWTJrV6NxADsHUlPrB5RKEDc3S6IVHcJ0rOj0mGCsWYVQ=&uniplatform=NZKPT&language=CHS (accessed on 9 January 2024).
- Jiang, T.; Jing, C.; Wang, Y.J.; Zhai, J.Q.; Cao, L.G.; Xu, X.W.; Yu, D.Y.; Su, B.D. Analysis of the possibility of achieving the Global Sustainable Development Goals under the SSPs path. Sci. Sin. Terrae 2020, 50, 1445–1454. [Google Scholar]
- Weng, Y.W.; Cai, W.J.; Wang, C. The application and future directions of the Shared Socioeconomic Pathways (SSPs). Clim. Change Res. 2020, 16, 215–222. [Google Scholar]
- Wu, T.; Lu, Y.; Fang, Y.; Xin, X.G.; Li, L.; Li, W.P.; Jie, W.H.; Zhang, J.; Liu, Y.M.; Zhang, L.; et al. The Beijing Climate Center Climate System Model (BCC-CSM): The main progress from CMIP5 to CMIP6. Geosci. Model Dev. 2019, 12, 1573–1600. [Google Scholar] [CrossRef]
- Merow, C.; Smith, M.J.; Silander, J.A. A practical guide to Maxent for modeling species’ distributions: What it does, and why inputs and settings matter. Ecography 2013, 10, 1058–1069. [Google Scholar] [CrossRef]
- Zhou, Y.T.; Ge, X.Z.; Zou, Y.; Guo, S.W.; Wang, T.; Tao, J.; Zong, S.X. Prediction of the potential geographical distribution of Hylurgus ligniperda at the global scale and in China using the Maxent model. J. Beijing For. Univ. 2022, 44, 90–99. [Google Scholar]
- Franklin, J. Mapping Species Distributions—Spatial Inference and Prediction; Cambridge University Press: Cambridge, UK, 2009. [Google Scholar]
- Peterson, A.; Soberon, J.; Pearson, R.; Robert, P.A.; Martínez-Meyer, E.; Nakamura, M.; Miguel, B.A. Ecological Niches and Geographic Distributions; Princeton University Press: Princeton, NJ, USA, 2011. [Google Scholar]
- Thuiller, W.; Lafourcade, B.; Engler, R.; Araújo, M.B. BIOMOD—A platform for ensemble forecasting of species distributions. Ecography 2009, 32, 369–373. [Google Scholar] [CrossRef]
- Elith, J.; Graham, C.H.; Anderson, P.R.; Dudík, M.; Ferrier, S.; Guisan, A.; Hijmans, R.J.; Huettmann, F.; Leathwick, J.R.; Lehmann, A.; et al. Novel methods improve prediction of species’ distributions from occurrence data. Ecography 2006, 29, 129–151. [Google Scholar] [CrossRef]
- Wisz, M.S.; Hijmans, R.J.; Li, J.; Peterson, A.T.; Graham, C.H.; Guisan, A.; NCEAS Predicting Species Distributions Working Group. Effects of sample size on the performance of species distribution models. Divers. Distrib. 2008, 14, 763–773. [Google Scholar] [CrossRef]
- Phillips, S.J.; Anderson, R.P.; Schapire, R.E. Maximum entropy modeling of species geographic distributions. Ecol. Model. 2006, 190, 231–259. [Google Scholar] [CrossRef]
- Mateo, R.G.; Croat, T.B.; Felicísimo, Á.M.; Muñoz, J. Profile or group discriminative techniques? Generating reliable species distribution models using pseudo-absences and target-group absences from natural history collections. Divers. Distrib. 2010, 16, 84–94. [Google Scholar] [CrossRef]
- Mirza, Č.; Jasmijn, R.; Daniela, R.; Janse, J.H.; Huijbregts, M.A.J.; Schipper, A.M. On the importance of predictor choice, modelling technique, and number of pseudo-absences for bioclimatic envelope model performance. Ecol. Evol. 2020, 10, 12307–12317. [Google Scholar]
- Bi, Y.Q.; Zhang, M.X.; Chen, Y.; Wang, A.X.; Li, M.H. Applying Biomod2 for modeling of species suitable habitats: A case study of Paeonia lactiflora in China. China J. Chin. Mater. Medica 2022, 47, 376–384. [Google Scholar]
- Wang, Y.S.; Xie, B.Y.; Wan, F.H.; Xiao, Q.M.; Dai, L.Y. Application of ROC curve analysis in evaluating the performance of alien species’ potential distribution models. Biodivers. Sci. 2007, 15, 365–372. [Google Scholar]
- Pavlovi, L.; Stojanovic, D.; Mladenovi, E.; Lakicevic, M.; Orlovic, S. Potential elevation shift of the European beech stands (Fagus sylvatica L.) in Serbia. Front. Plant Sci. 2019, 10, 436609. [Google Scholar] [CrossRef] [PubMed]
- Zhu, N. Modelling the suitable habitat distribution of Magnolia officinalis using Ensemble Model. J. Sichuan Agric. Univ. 2019, 37, 481–489. [Google Scholar]
- Allouche, O.; Tsoa, R.A.; Kadmon, R. Assessing the accuracy of species distribution models: Prevalence, kappa and the true skill statistic (TSS). J. Appl. Ecol. 2010, 43, 1223–1232. [Google Scholar] [CrossRef]
- Zhao, G.H.; Cui, X.Y.; Wang, Z.; Jing, H.L.; Fan, B.G. Prediction of potential distribution of Ziziphus jujuba var. spinosa in China under context of climate change. Sci. Silvae Sin. 2021, 57, 158–168. [Google Scholar]
- Rödder, D.; Schmitt, T.; Gros, P.; Ulrich, W.; Habel, J.C. Climate change drives mountain butterflies towards the summits. Sci. Rep. 2021, 11, 14382. [Google Scholar] [CrossRef]
- Habel, J.C.; Rödder, D.; Schmitt, T.; Neve, G. Global warming will affect the genetic diversity and uniqueness of Lycaena helle population. Glob. Change Biol. 2011, 17, 194–205. [Google Scholar] [CrossRef]
- Filazzola, A.; Matter, S.F.; Roland, J. Inclusion of trophic interactions increases the vulnerability of an alpine butterfy species to climate change. Glob. Change Biol. 2020, 26, 2867–2877. [Google Scholar] [CrossRef]
- Grabherr, G.; Gottfried, M.; Pauli, H. Climate change impacts in alpine environments. Geogr. Compass 2010, 4, 1133–1153. [Google Scholar] [CrossRef]
- Chen, C.Q.; Wang, J.Q.; Yang, J.; Liang, Y.; Song, Y.Z.; Liu, T.M. Apreliminary report on the investigation of Tenopalus aureus in Jinggangshan country, Jiangxi province. Anhui Agric. Sci. Bull. 2007, 13, 148–149. [Google Scholar]
- Wang, L. Multi-Scale Habitat Preference Research Based on Hostplant of the Butterfly Teinopalpus aureus; Jiangxi Agricultural University: Nanchang, China, 2023. [Google Scholar]
- Jiang, M. Larval Diet Selection of the Rare Butterfly of Teinopalpus aureus and Genetic Diversity of Two Magnoliaceae Hostplants; Jiangxi Agricultural University: Nanchang, China, 2022. [Google Scholar]
Figure 1.
Schematic overview of the study with external data, derived data, and processes shown within the flow of information, processes shown within the flow of information.
Figure 1.
Schematic overview of the study with external data, derived data, and processes shown within the flow of information, processes shown within the flow of information.

Figure 2.
Relative contributions of environmental variables to the species distribution model for T. aureus. Different letters in the table indicate a statistically significant difference (meantstandard deviation, meantSD) (Kruskal–Wallis p < 0.05).
Figure 2.
Relative contributions of environmental variables to the species distribution model for T. aureus. Different letters in the table indicate a statistically significant difference (meantstandard deviation, meantSD) (Kruskal–Wallis p < 0.05).
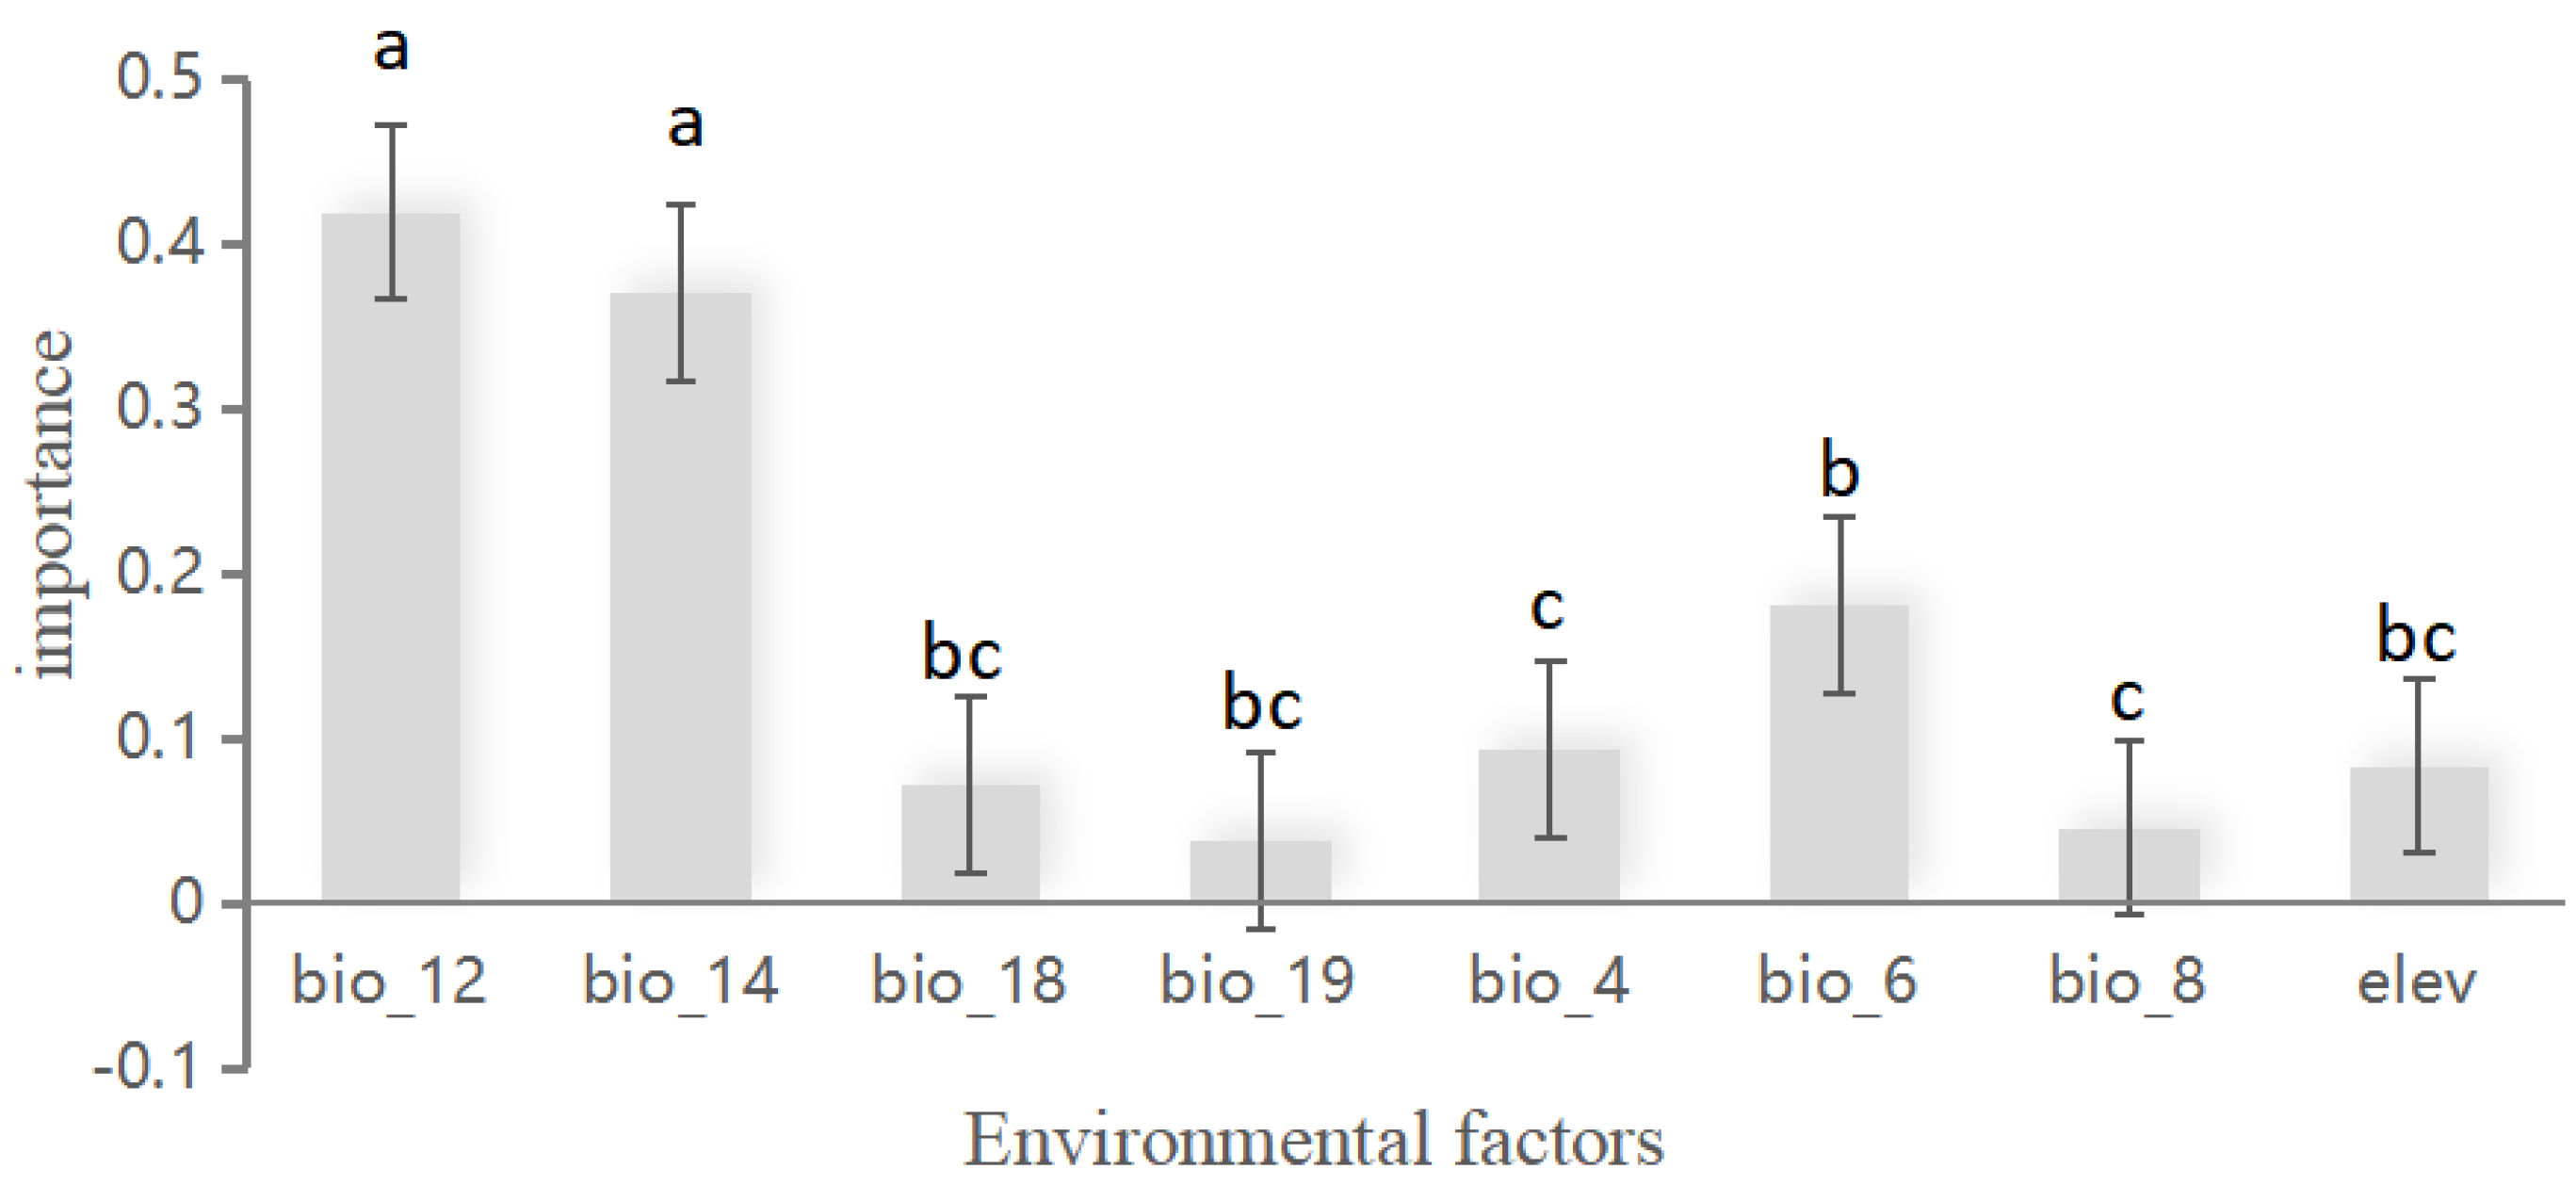
Figure 3.
Response curves for the main environment variables, (a) suggests bio12 (unit: mm); (b) suggests bio14 (unit: mm); (c) suggests bio6 (unit: °C).
Figure 3.
Response curves for the main environment variables, (a) suggests bio12 (unit: mm); (b) suggests bio14 (unit: mm); (c) suggests bio6 (unit: °C).

Figure 4.
Current suitable habitat distribution of T. aureus in China. Red suggests increase in habitat suitability while blue suggests decrease in habitat suitability (A). Gray suggests unsuitable habitats, yellow suggests low-suitable habitats, orange suggests middle-suitable habitats, and red suggests high-suitable habitats (a).

Figure 5.
Suitability and distribution change of T. aureus in the scenarios SSP1_2.6. (A) Suitability in the 2050s; (a) Suitable habitat in the 2050s; (B) Suitability in the 2070s; (b) Suitable habitat in the 2050s; (C) Suitability in the 2090s; (c) Suitable habitat in the 2090s. Red suggests an increase in habitat suitability while blue suggests a decrease in habitat suitability (A,B,C). Gray suggests unsuitable habitats, yellow suggests low-suitable habitats, orange suggests middle-suitable habitats, and red suggests high-suitable habitats (a,b,c).

Figure 6.
Suitability and distribution change of T. aureus in the scenarios SSP5_8.5. (A) Suitability in the 2050s; (a) Suitable habitat in the 2050s; (B) Suitability in the 2070s; (b) Suitable habitat in the 2050s; (C) Suitability in the 2090s; (c)Suitable habitat in the 2090s. Red suggests an increase in habitat suitability while blue suggests a decrease in habitat suitability (A,B,C). Gray suggests Unsuitable habitats, yellow suggests low-suitable habitats, orange suggests middle-suitable habitats, and red suggests high-suitable habitats (a,b,c).
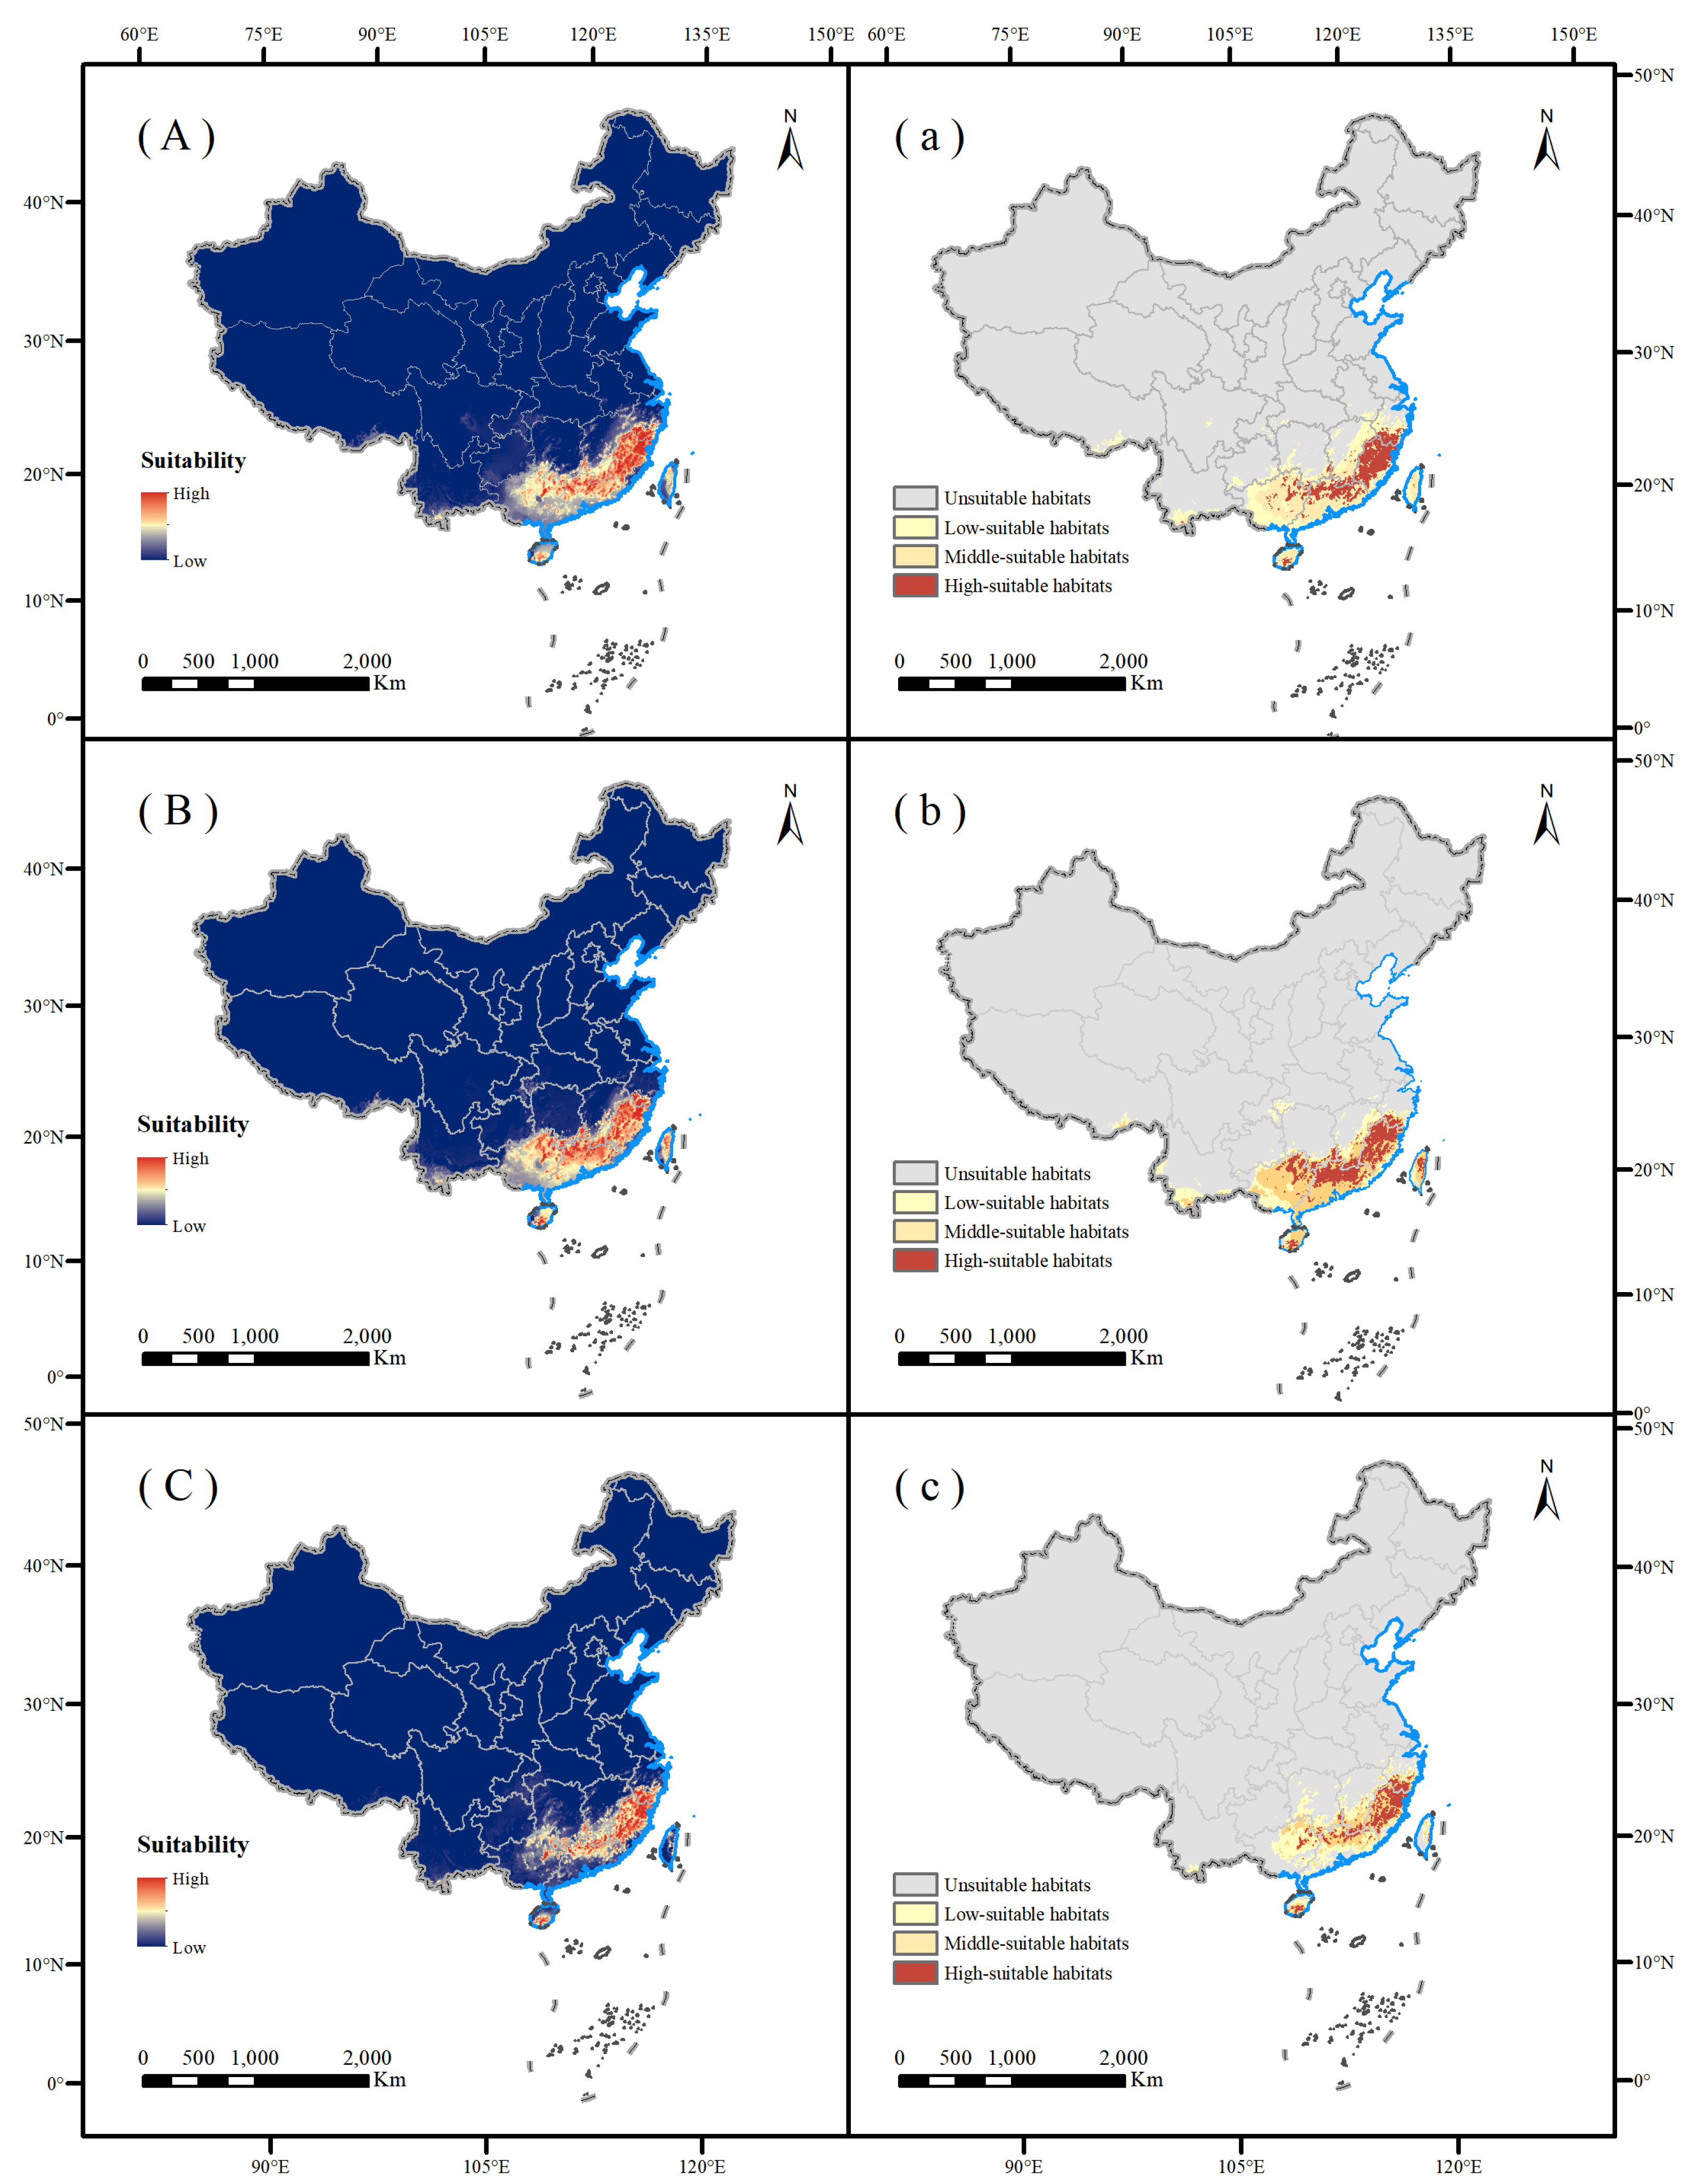
Figure 7.
Change in the area of the suitable habitats of T. aureus in future climate scenarios in China. White suggests the area change of high-suitable habitats, light gray suggests the area change of low-suitable habitats, dark gray suggests the area change of middle-suitable area, and black suggests the area change of unsuitable habitats.

Figure 8.
Potential distribution of T. aureus. Potential distribution in the current climate is depicted in the map below, with yellow indicating a suitable habitat for growth (a). Extrapolating from the current climate to the future (2050s), the scenarios SSP1_2.6 (b); 2070s, SSP1_2.6(c); 2090s, SSP1_2.6 (d); 2050s, SSP5_8.5 (e); 2070s, SSP5_8.5 (f); 2090s, SSP5_8.5 (g) were considered. Blue indicates areas in the potential distribution that will disappear in the future. Green indicates areas where the potential distribution will not change in the future. Red indicates new potential distribution areas.

Figure 9.
Change in centroid of the suitable region of T. aureus in future climate scenarios. The black point suggests the position of the center of mass, the green point suggests the position of the center of mass in the SSP5_8.5 climate scenario, the red point suggests the position of the center of mass in the SSP1_2.6 climate scenario, and the arrow represents the direction of movement of the center of mass.


Table 1.
Sources of location information of T. aureus recorded from the literature. GBIF: Global Biodiversity Information Network (GBIF, https://www.gbif.org/; accessed on 16 June 2023).
Table 1.
Sources of location information of T. aureus recorded from the literature. GBIF: Global Biodiversity Information Network (GBIF, https://www.gbif.org/; accessed on 16 June 2023).
| Province | Location | Longitude (E) | Latitude (N) | Sources |
|---|---|---|---|---|
| Zhejiang | Wuyanling National Nature Reserve | 119.673889 | 27.719722 | [24] |
| Fushan Township, Huangyan District, Taizhou city | 120.887222 | 28.528056 | [24] | |
| Jingning She Nationality Autonomous County | 119.480833 | 27.878056 | [25] | |
| Chimu Mountain of Jingning country | 119.661667 | 27.924722 | [26] | |
| Fujian | Wuyi Mountain national nature reserve | 117.753889 | 27.650278 | [27] |
| Dayun Mountain National Nature Reserve | 118.175556 | 25.673333 | [27] | |
| Meihua Mountatin National Nature Reserve | 116.895795 | 25.294767 | [27] | |
| Wuping County, Longyan City | 116.695833 | 24.978056 | [27] | |
| Liancheng County, Longyan City | 116.878889 | 25.215833 | [27] | |
| Qitai Mountain Provincial Nature Reserve | 117.581944 | 26.948889 | [27] | |
| Jian ’ou city Jiyang town, Nanping City | 118.13741 | 27.13868 | [27] | |
| Yongchun County, Quanzhou City | 118.29424 | 25.32188 | [27] | |
| Teng Mountain Provincial Nature Reserve | 118.93258 | 25.86672 | [28] | |
| Xiyang Village, Giring Town, Yongtai County | 119.012778 | 25.772778 | [28] | |
| Tianbaoyan National Nature Reserve | 117.54574 | 25.93414 | [28] | |
| Niumu Provincial Nature Reserve | 117.468611 | 25.851389 | [27] | |
| Xianyang town, Quanzhou City, Yongchun County | 117.916111 | 25.409339 | [27] | |
| Mandang Mountain National Nature Reserve | 118.105833 | 26.680278 | [29] | |
| Shuiji town, Jianyang district, Nanping city | 118.179056 | 27.375248 | GBIF | |
| Jiangxi | Jinggang Mountain Provincial Nature Reserve | 114.15 | 26.55 | [15] |
| Wuyi Mountain National Nature Reserve | 117.716667 | 27.815278 | [30] | |
| Jiulian Mountain National Nature Reserve | 114.561389 | 24.608611 | [30] | |
| Longnan County, Ganzhou City | 115.429722 | 24.694444 | [31] | |
| Taiyuan She township, Leadshan County, Shangrao city | 117.483056 | 27.950278 | [32] | |
| Tianzhu mountain township, Yanshan County, Shangrao city | 117.731111 | 27.986389 | [32] | |
| Pingshan Scenic spot | 115.439722 | 25.704444 | [25] | |
| Sanqingshan scenic spot | 118.073056 | 28.905833 | [25] | |
| Hunan | Mang Mountain Provincial Nature Reserve | 112.839722 | 24.909167 | [33] |
| Guangdong | Nanling National Nature Reserve | 113.04563 | 24.894098 | [3] |
| Northern mountainous area of Lianping County, Heyuan City | 114.472778 | 24.501667 | [3] | |
| Provincial Nature Reserve Management Office of South China Tiger Protection in Northern Guangdong | 113.629722 | 24.896667 | [33] | |
| Longnan City, Ganzhou City | 114.625833 | 24.925278 | [33] | |
| Guangxi | Tiane town, Tiane County, Hechi City | 107.12 | 24.87 | GBIF |
| Chengzhong district, Liuzhou City | 109.422454 | 24.314681 | GBIF | |
| Liuzhou Rongshui Miao autonomous county | 109.264722 | 25.192222 | [34] | |
| Rongan County, Liuzhou City | 109.756667 | 25.486389 | [33] | |
| Dayaoshan Nature reserve | 110.315833 | 24.025556 | [35] | |
| Dayaoshan Nature reserve | 110.248056 | 24.168056 | [35] | |
| Daming Mountain National Nature Reserve | 108.402222 | 23.501944 | [36] | |
| Hainan | Wuzhi Mountion National Nature Reserve | 109.543889 | 19.004444 | [37] |
| Shuiman township, Wuzhishan city | 109.533313 | 18.785278 | GBIF | |
| Jianfengling Nature Reserve | 108.868611 | 18.724167 | [33] |
Table 2.
Environmental variables retained after screening.
| Variable | Description | Unit |
|---|---|---|
| bio4 | Temperature seasonality | °C |
| bio6 | Min. temperature of coldest month | °C |
| bio8 | Mean temperature of wettest quarter | °C |
| bio12 | Annual precipitation | mm |
| bio14 | Precipitation of driest month | mm |
| bio18 | Precipitation of warmest quarter | mm |
| bio19 | Precipitation of coldest quarter | mm |
| elev | Elevation | m |
Table 3.
AUC and TSS values of ensemble model and single models.
| Item | Algorithm | |||||||||||
|---|---|---|---|---|---|---|---|---|---|---|---|---|
| ANN | CTA | FDA | GAM | GBM | GLM | XGBOOST | MARS | MAXENT | RF | SRE | ESM | |
| AUC | 0.981 | 0.902 | 0.862 | 0.862 | 0.983 | 0.975 | 0.922 | 0.977 | 0.968 | 0.963 | 0.735 | 0.990 |
| TSS | 0.845 | 0.805 | 0.805 | 0.725 | 0.855 | 0.905 | 0.740 | 0.835 | 0.750 | 0.815 | 0.470 | 0.972 |
Table 4.
Ensemble Model predicted potential suitable habitats areas of T. aureus under different scenarios/104 km2.
Table 4.
Ensemble Model predicted potential suitable habitats areas of T. aureus under different scenarios/104 km2.
| High-Suitable Habitats | Middle-Suitable Habitats | Low-Suitable Habitats | Total-Suitable Habitats | |
|---|---|---|---|---|
| current (1970–2000) | 34.43 | 41.47 | 63.05 | 138.95 |
| 2050s SSP1_2.6 | 15.82 | 38.64 | 52.06 | 106.52 |
| 2070s SSP1_2.6 | 19.54 | 26.11 | 38.88 | 84.53 |
| 2090s SSP1_2.6 | 16.83 | 25.60 | 34.49 | 76.93 |
| 2050s SSP5_8.5 | 19.02 | 34.60 | 32.88 | 86.50 |
| 2070s SSP5_8.5 | 21.24 | 34.50 | 25.96 | 81.70 |
| 2090s SSP5_8.5 | 12.17 | 21.20 | 27.66 | 61.04 |
Disclaimer/Publisher’s Note: The statements, opinions and data contained in all publications are solely those of the individual author(s) and contributor(s) and not of MDPI and/or the editor(s). MDPI and/or the editor(s) disclaim responsibility for any injury to people or property resulting from any ideas, methods, instructions or products referred to in the content. |
© 2024 by the authors. Licensee MDPI, Basel, Switzerland. This article is an open access article distributed under the terms and conditions of the Creative Commons Attribution (CC BY) license (https://creativecommons.org/licenses/by/4.0/).
Share and Cite
MDPI and ACS Style
Liu, Y.; Zhang, X.; Zong, S. Prediction of the Potential Distribution of Teinopalpus aureus Mell, 1923 (Lepidoptera, Papilionidae) in China Using Habitat Suitability Models. Forests 2024, 15, 828. https://doi.org/10.3390/f15050828
AMA Style
Liu Y, Zhang X, Zong S. Prediction of the Potential Distribution of Teinopalpus aureus Mell, 1923 (Lepidoptera, Papilionidae) in China Using Habitat Suitability Models. Forests. 2024; 15(5):828. https://doi.org/10.3390/f15050828
Chicago/Turabian StyleLiu, Yinghan, Xuemei Zhang, and Shixiang Zong. 2024. "Prediction of the Potential Distribution of Teinopalpus aureus Mell, 1923 (Lepidoptera, Papilionidae) in China Using Habitat Suitability Models" Forests 15, no. 5: 828. https://doi.org/10.3390/f15050828
Note that from the first issue of 2016, this journal uses article numbers instead of page numbers. See further details here.