Article

Diversity of Bacterial Communities in Sediment in Inland Water Bodies in Relation to Environmental Factors and Human Impacts: A Case Study on Typical Regions in Vietnam

1
Center for Life Science Research (CELIFE), Faculty of Biology, VNU University of Science—Vietnam National University, 334 Nguyen Trai, Thanh Xuan, Hanoi 100000, Vietnam
2
Department of Ecology, Faculty of Biology, VNU University of Science—Vietnam National University, 334 Nguyen Trai, Thanh Xuan, Hanoi 100000, Vietnam
3
Department of Biochemistry and Molecular Biology, Faculty of Biology, VNU University of Science—Vietnam National University, 334 Nguyen Trai, Thanh Xuan, Hanoi 100000, Vietnam
4
Key Laboratory of Enzyme and Protein Technology, VNU University of Science—Vietnam National University, 334 Nguyen Trai, Thanh Xuan, Hanoi 100000, Vietnam
5
Department of Zoology and Conservation, Faculty of Biology, VNU University of Science—Vietnam National University, 334 Nguyen Trai, Thanh Xuan, Hanoi 100000, Vietnam
6
Faculty of Biology, Dalat University, Da Lat, Lam Dong 670000, Vietnam
7
Department of Civil, Environmental and Architectural Engineering, Korea University, Seoul 02841, Republic of Korea
8
Deparment of Applied Zoology, Faculty of Biology, VNU University of Science—Vietnam National University, 334 Nguyen Trai, Thanh Xuan, Hanoi 100000, Vietnam
9
Department of Microbiology, Faculty of Biology, VNU University of Science—Vietnam National University, 334 Nguyen Trai, Thanh Xuan, Hanoi 100000, Vietnam
*
Author to whom correspondence should be addressed.
Microbiol. Res. 2024, 15(2), 864-879; https://doi.org/10.3390/microbiolres15020056
Submission received: 10 April 2024 / Revised: 4 May 2024 / Accepted: 7 May 2024 / Published: 19 May 2024

Abstract

:
Environmental changes and human impact can alter biodiversity in negative manners that affect mankind’s sustainable development. Particularly, such effects on inland waters are even more concerning, as those ecosystems play essential roles in sustaining human life as well as relevant wildlife. Thus, in this study, we investigated such effects on microbial diversity in inland waters in Vietnam using bacterial communities in sediment as indicators. To do this, we collected sediment samples from various locations in three respective regions (Red river in the north, Ba river in the central area, and Mekong delta flood zone in the south) using standard methods, extracted their total DNA, sequenced their V3-V4 16S rRNA gene fragments using an Illumina Miseq platform and analyzed the sequences to infer the diversity of the bacterial communities in the samples. These communities were compared in terms of richness (alpha diversity) and composition (beta diversity), and the correlations between their diversity levels and environmental factors, as well as human activities, were analyzed by using standard statistical tools. Our results showed that the communities were different from each other solely by region, in richness and critically in composition, although there were some communities distinctively different from all the others. Among environmental factors, only water salinity (and conductivity) had negative correlations with alpha-diversity indices of the bacterial communities, and phosphate concentration and turbidity had positive correlations, while the other factors had almost no correlations, which partially explains the region-specific diversity. These results also suggest that climate change incidences, especially sea intrusion, can have significant effects on microbial diversity in inland waters. The impact of human activities did not appear severe, solely affecting bacterial community richness, but not significantly affecting bacterial community composition. However, apparently reduced bacterial diversity in several sites with intense human impacts and distinct environmental conditions should be noted and deserve further investigation.

1. Introduction

In the 21st century, mankind is facing new challenges such as climate change, reduced resources due to a fast-growing population, and environmental issues caused by intense irrational human activities [1]. Among those challenges, climate change and environmental alteration due to human impact are two serious factors not only threatening our sustainable development, but also resulting in irreversible adverse effects on our surrounding environment. One of such adverse effects that is noticeable is the biodiversity alteration (usually in a reductive manner) in the regions that are heavily affected. This situation is more apparent to flora and fauna, but can also be seen through the changes in microbial diversity [2]. Indeed, microbial diversity changes can, in turn, reflect changes in the environmental characteristics, such as soil carbon, greenhouse gas, or any changes due to climate change and human activities [2,3].
Thus far, there have been numerous studies on microbial diversity and its association with environmental factors and human activities [1,3,4]. Most of them focused on soil microbial diversity in different geographical regions, also with analyses of the relations to microbial functions in some cases. For instance, several studies on grassland soil discovered that grassland soil microbial diversity is strongly affected by climate factor changes (such as warming, altered precipitation, etc.), notably in a negative direction, i.e., toward reducing biodiversity when temperature increases, and moisture is reduced [2,5]. Indeed, negative effects of global change factors on soil microbial diversity were reported by Yang et al. (2021) as a general phenomenon, based on analyzing the data from 237 publications [6]. However, not all the studies showed similar responses of soil communities to climate factors, such as temperature, probably due to differences in methods to analyze microbial diversity [7]. Notably, some studies show that climate change, especially global warming, led to increased microbial diversity and thus increased functionality of microorganisms in polar soil [8,9]. Those observations are interesting, but solely with soil environments, while inland aquatic environments seem to have received less attention despite their important ecological roles.
Inland waters only account for around 2% of total water on earth, but they are essential to human life, as they provide drinking and irrigation water and contribute to reducing flood and drought risks, controlling pollution and reducing greenhouse gas emission [10,11,12]. Inland waters are also home to 12% of known living species, of which habit loss can predictively reach 80% due to climate change and human activities such as dam construction, mining, and the uses of pesticides and fertilizers, etc. [13,14,15,16]. In such water ecosystems, microorganisms are key players in biogeochemical processes to cycle essential elements such as carbon, nitrogen, phosphorus, sulfur, etc., to stabilize the systems, and thus they control the water quality, which can be indicated by their diversity [16]. Most studies on inland aquatic environments focus on stream microbial diversity, which appears to be affected the most by organic matter and metal content in surface water [17]. Some others focus more on ground (or subsurface) water, and also proposed that current and future global changes could induce undesired dynamics of microbiomes in nutrient- and energy-poor aquifers [18]. Nevertheless, most studies employed conventional methods, such as microscopy and/or culture-based techniques, for microbial diversity assessment. Furthermore, there is evidence suggesting that we have only been able to culture 1% of the total microorganisms present in the environment. [19]. Therefore, culture-independent methods, i.e., those based on molecular biology, are now strongly recommended to be used in investigating microbial diversity. Particularly, recently with the rapid development of next-generation sequencing (NGS) technologies, metagenomic analysis has been demonstrated to be the most reliable approach to understand microbial diversity in various environments [20].
In this study, we attempt to evaluate the potential effects of environmental factors and human activities on microbial diversity in some inland water bodies in Vietnam, based on analyzing the 16S rRNA gene sequences of the metagenomes of the bacterial communities in their respective sediment samples as indicators. Vietnam is part of the Southeast Asian region, which is well known as a hot spot of biodiversity, owing to diverse climates in different areas and geologic movements in the past [21]. It is therefore highly possible that the effects of environmental changes (possibly from climate change) and the human impact on microbial diversity in different regions in Vietnam may be also different, and such observations may be a good reference to understand those effects on biodiversity in general. In addition, there has been little research attention for microbial diversity in inland waterbodies in Vietnam, except for some individual studies on specific sites, mainly in the Mekong delta area in Vietnam, and mostly using conventional methods [22,23,24,25]. Thus, based on some representative samples from three main geographical regions in Vietnam (the north, the center, and the south) with their typical climate and geological characteristics, our study reveals interesting aspects of biodiversity–environment–human-impact relationships in inland water ecosystems. These findings were even more strongly corroborated with our metagenomic approach. We focused only on prokaryotic DNAs, as it is known that microbial communities in aquatic ecosystems solely consist of bacteria and archaea [26].

2. Materials and Methods

2.1. Sampling

Sediment samples were collected from different locations in each of three regions in Vietnam (Figure 1, Table S1): (i) the Red river in the north, with a long and complex geomorphology, high and varied flow rates (average: 3600 m3 s−1; lowest: 840 m3 s−1; highest: 37,800 m3 s−1), rich alluvium, and more changing weather (samples labeled “SH”); (ii) the Ba river in the central area, with a less complex geomorphology, average flow rates (500–2000 m3 s−1), and typically vigorous flood in short periods (samples labeled “SB”); and (iii) the Mekong delta flood zone in the south, which is typically the downstream area of the Mekong river that is submerged in flood water for almost the whole year [27] (samples labeled “VNL”). The studied locations represent three main geographical regions in Vietnam: (i) the Red river region has a hot and humid monsoon tropical climate of northern Vietnam, with a temperature and precipitation varying in a wide range (from ca. 14–33 °C and from 1400 mm to 2000 mm, respectively) and clearly with seasons [28], and with diverse vegetation and soil types changing with height and along the river length [29]; (ii) the Ba river region has a more typical tropical climate of central Vietnam with less monsoon effects, less fluctuating temperature (from ca. 21–27 °C), but precipitation changing with the seasons (1200–2600 mm, the most during rainy season from June to September) [30], and thus with typical tropical and sub-tropical vegetation and soil types (being also diverse, although less than those of the Red river region) [31]; (iii) the Mekong delta flood zone is a typical inland water body of southern Vietnam, having a monsoon subequatorial tropical climate, with moderate temperatures (26–27 °C on average) that vary among months only by 3 °C, with precipitation ranging from 1200 mm up to 2500 mm (solely in rainy season from May to November) [32], and thus with typical wetland vegetation [33]. The river sediment samples were taken both in the dry season (those having their labels ending with “K”) and the rainy season (those having their labels ending with “M”). The environmental parameters (or physicochemical parameters) of the waters at the locations (Table 1) were determined as described below. The locations are also scored in terms of how they are affected by human activities (based on our assumption that the more a location is affected, the less distant it is to human facilities) (Table 1). The details of the scoring are explained in the Supplementary Materials (Table S2).
Sediment samples were collected following the standard procedures of the US Environmental Protection Agency (URL: https://www.epa.gov, accessed on 9 May 2021) by using a Ponar dredge for deep waters or disinfected spoons for shallow waters. At each sampling site, 3 samples were taken from 3 different positions and equally mixed to obtain a final sample volume of about 200 g. Such an obtained sample was contained in a PE bag and preserved at −20 °C until being further processed.
Before each sampling, physicochemical parameters including temperature, pH, total dissolved oxygen, conductivity, and salinity were measured on-site with a multiparameter probe (model WQC-22A, ToaDkk, Tokyo, Japan). Other variables such as BOD5, Chl.a, NO3 concentration, and PO43− concentration were measured in laboratory using standard protocols [34].

2.2. Sample Processing and DNA Extraction

For analysis, first each sample was subjected to DNA extraction. The sample was washed 3 times with 0.9% NaCl solution and centrifugation (at ca. 4000× g for 10 min). The sample was subsequently homogenized with liquid nitrogen and glass beads. Total DNA of the homogenized sample was then extracted by using DNAeasy PowerSoil Pro Kit (Qiagen, Germantown, MD, USA), following the protocol provided by the manufacturer. The integrity of the extracted DNA was confirmed using agarose gel electrophoresis. The pool of three independent DNA extracts from each collected sample was then combined. The concentration of the extracted DNA was quantified using a UV/Vis spectrophotometer (model 6135, Eppendorf, Hamburg, Germany).

2.3. 16S rRNA Gene Targeted Sequencing

The obtained genomic DNA samples were sent to LOBI (Vietnam) for 16S rRNA amplicon sequencing on a Illumina Miseq platform. 16S rDNA amplicon sequencing includes the library construction using specific primers to amplify the variable region (V3–V4) of prokaryotic 16S rDNA and data analysis of the 16S rDNA variable region sequence to identify the composition and abundance of prokaryotic microorganisms in the environment. The primers used were 341F (forward primer: CCTACGGGNGGCWGCAG) and 806R (reverse primer: GGACTACNNGGGTATCTAAT).
The raw sequences were subsequently supplied to Quantitative Insights Into Microbial Ecology 2 (QIIME2, version 2021.4) for relative abundance analysis based on the workflows described by Trinh et al., 2022 [35]. Briefly, raw amplicons were quality-filtered using Trimmomatic (version 0.39) with the following parameters: LEADING:3, TRAILING:3, MINLEN:36, SLIDINGWINDOW:4:15 [36]; then only the targeted V3-V4 region sequences were analyzed, and their respective operational taxonomic units (OTUs) were classified using SILVA rRNA database (version 138) [37].

2.4. Bacterial Diversity Analyses

The software used for all the diversity analyses and graphics display was R. The detailed analyses were as follows: Based on the above-mentioned results of the taxonomic classification of the OTU representative sequences, the relative abundance (in percent) of each OTU in each sample was calculated. For alpha-diversity analysis, a rarefaction curve was determined for each sample, accompanied by the calculation of Chao1 index, Good’s coverage index, Simpson diversity index, and Shannon diversity index. For beta-analysis, Bray–Curtis distances were calculated by using standard algorithms in R to measure the similarities/differences between the samples. The data were used for plotting a dendrogram and a PCoA (principal coordinates analysis) graph to graphically display such similarities/differences. The taxonomic biomarkers of the samples from a same region, in comparison to those from the other regions, were determined using Linear Discriminant Analysis (LDA) Effect Size (LEfSe).

2.5. Analyses of the Correlations between Bacterial Diversity and Environmental and Anthropogenic Factors

Bacterial diversity vs. environmental factors: The correlation between alpha diversity indices (Shannon’s and Simpson’s indices) of the sediment bacterial communities and water quality parameters across different sites was calculated on log-standardized data using the “prcomp” function in the R program, which performs a principal component analysis of the data (PCA) [38]. The resulting distance matrix between samples were plotted in a PCA graph. We also applied the multi linear regression model (MLR) to find the best explanatory variables (water quality parameters) to predict the outcome of a response variable (diversity indices). The best model was selected using a stepwise approach that optimized the model by considering the Akaike information criterion (AIC), based on the results of AIC, the model was tested to examine the best explanatory variables.
Bacterial diversity vs. human impact: To evaluate this correlation, the Shannon’s indices of the samples were analyzed together with their respective human impact scores (Table 1) by using standard regression tools in Microsoft Excel (version 2403).

3. Results

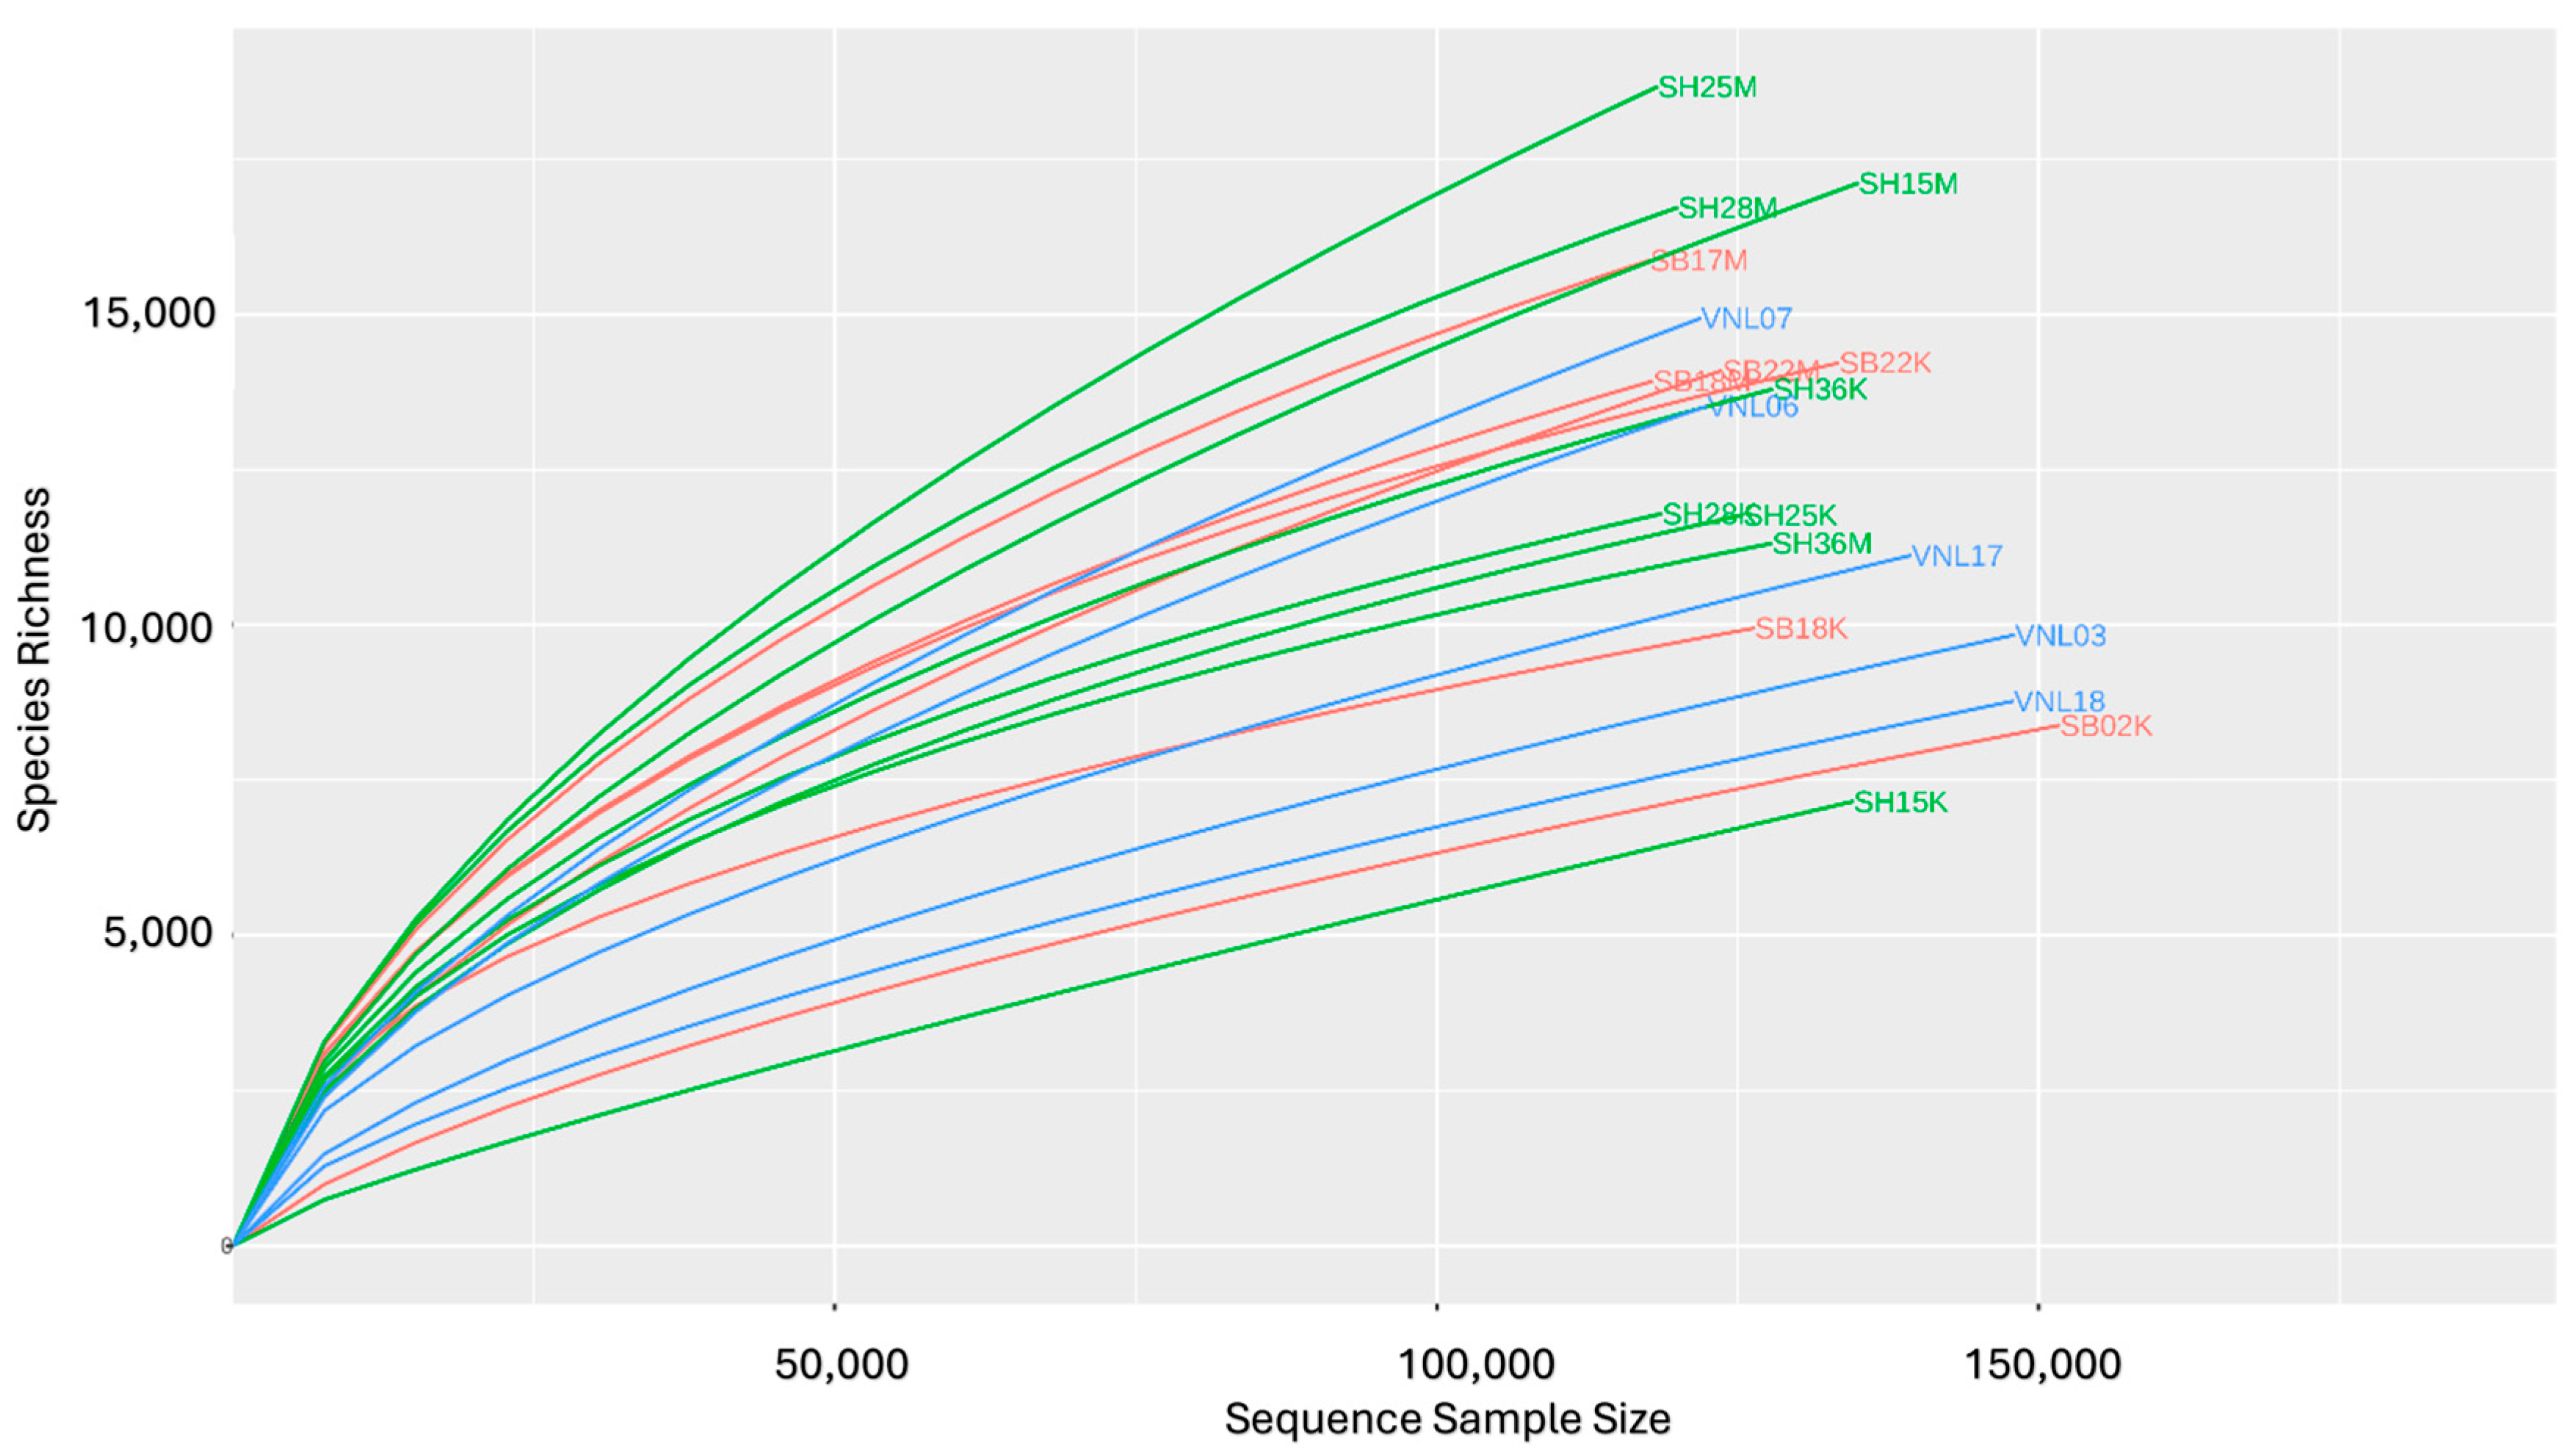
3.1. Sequencing Data Quality

The sequencing quality, as evaluated using the FastQC tool, was satisfactory, with the average quality scores for all the reads reached above 30 (Figure S1). After processing, each sequence had a length ranging from ca. 444–452 bp, which is sufficient to cover the V3–V4 region (~430 bp). The Good’s coverage indices of all samples were all above 90% and mostly around 95%, suggesting that the obtained sequences well covered the real total sequences (of prokaryotes) in the samples. Therefore, the sequencing data are highly reliable for use in diversity analyses.

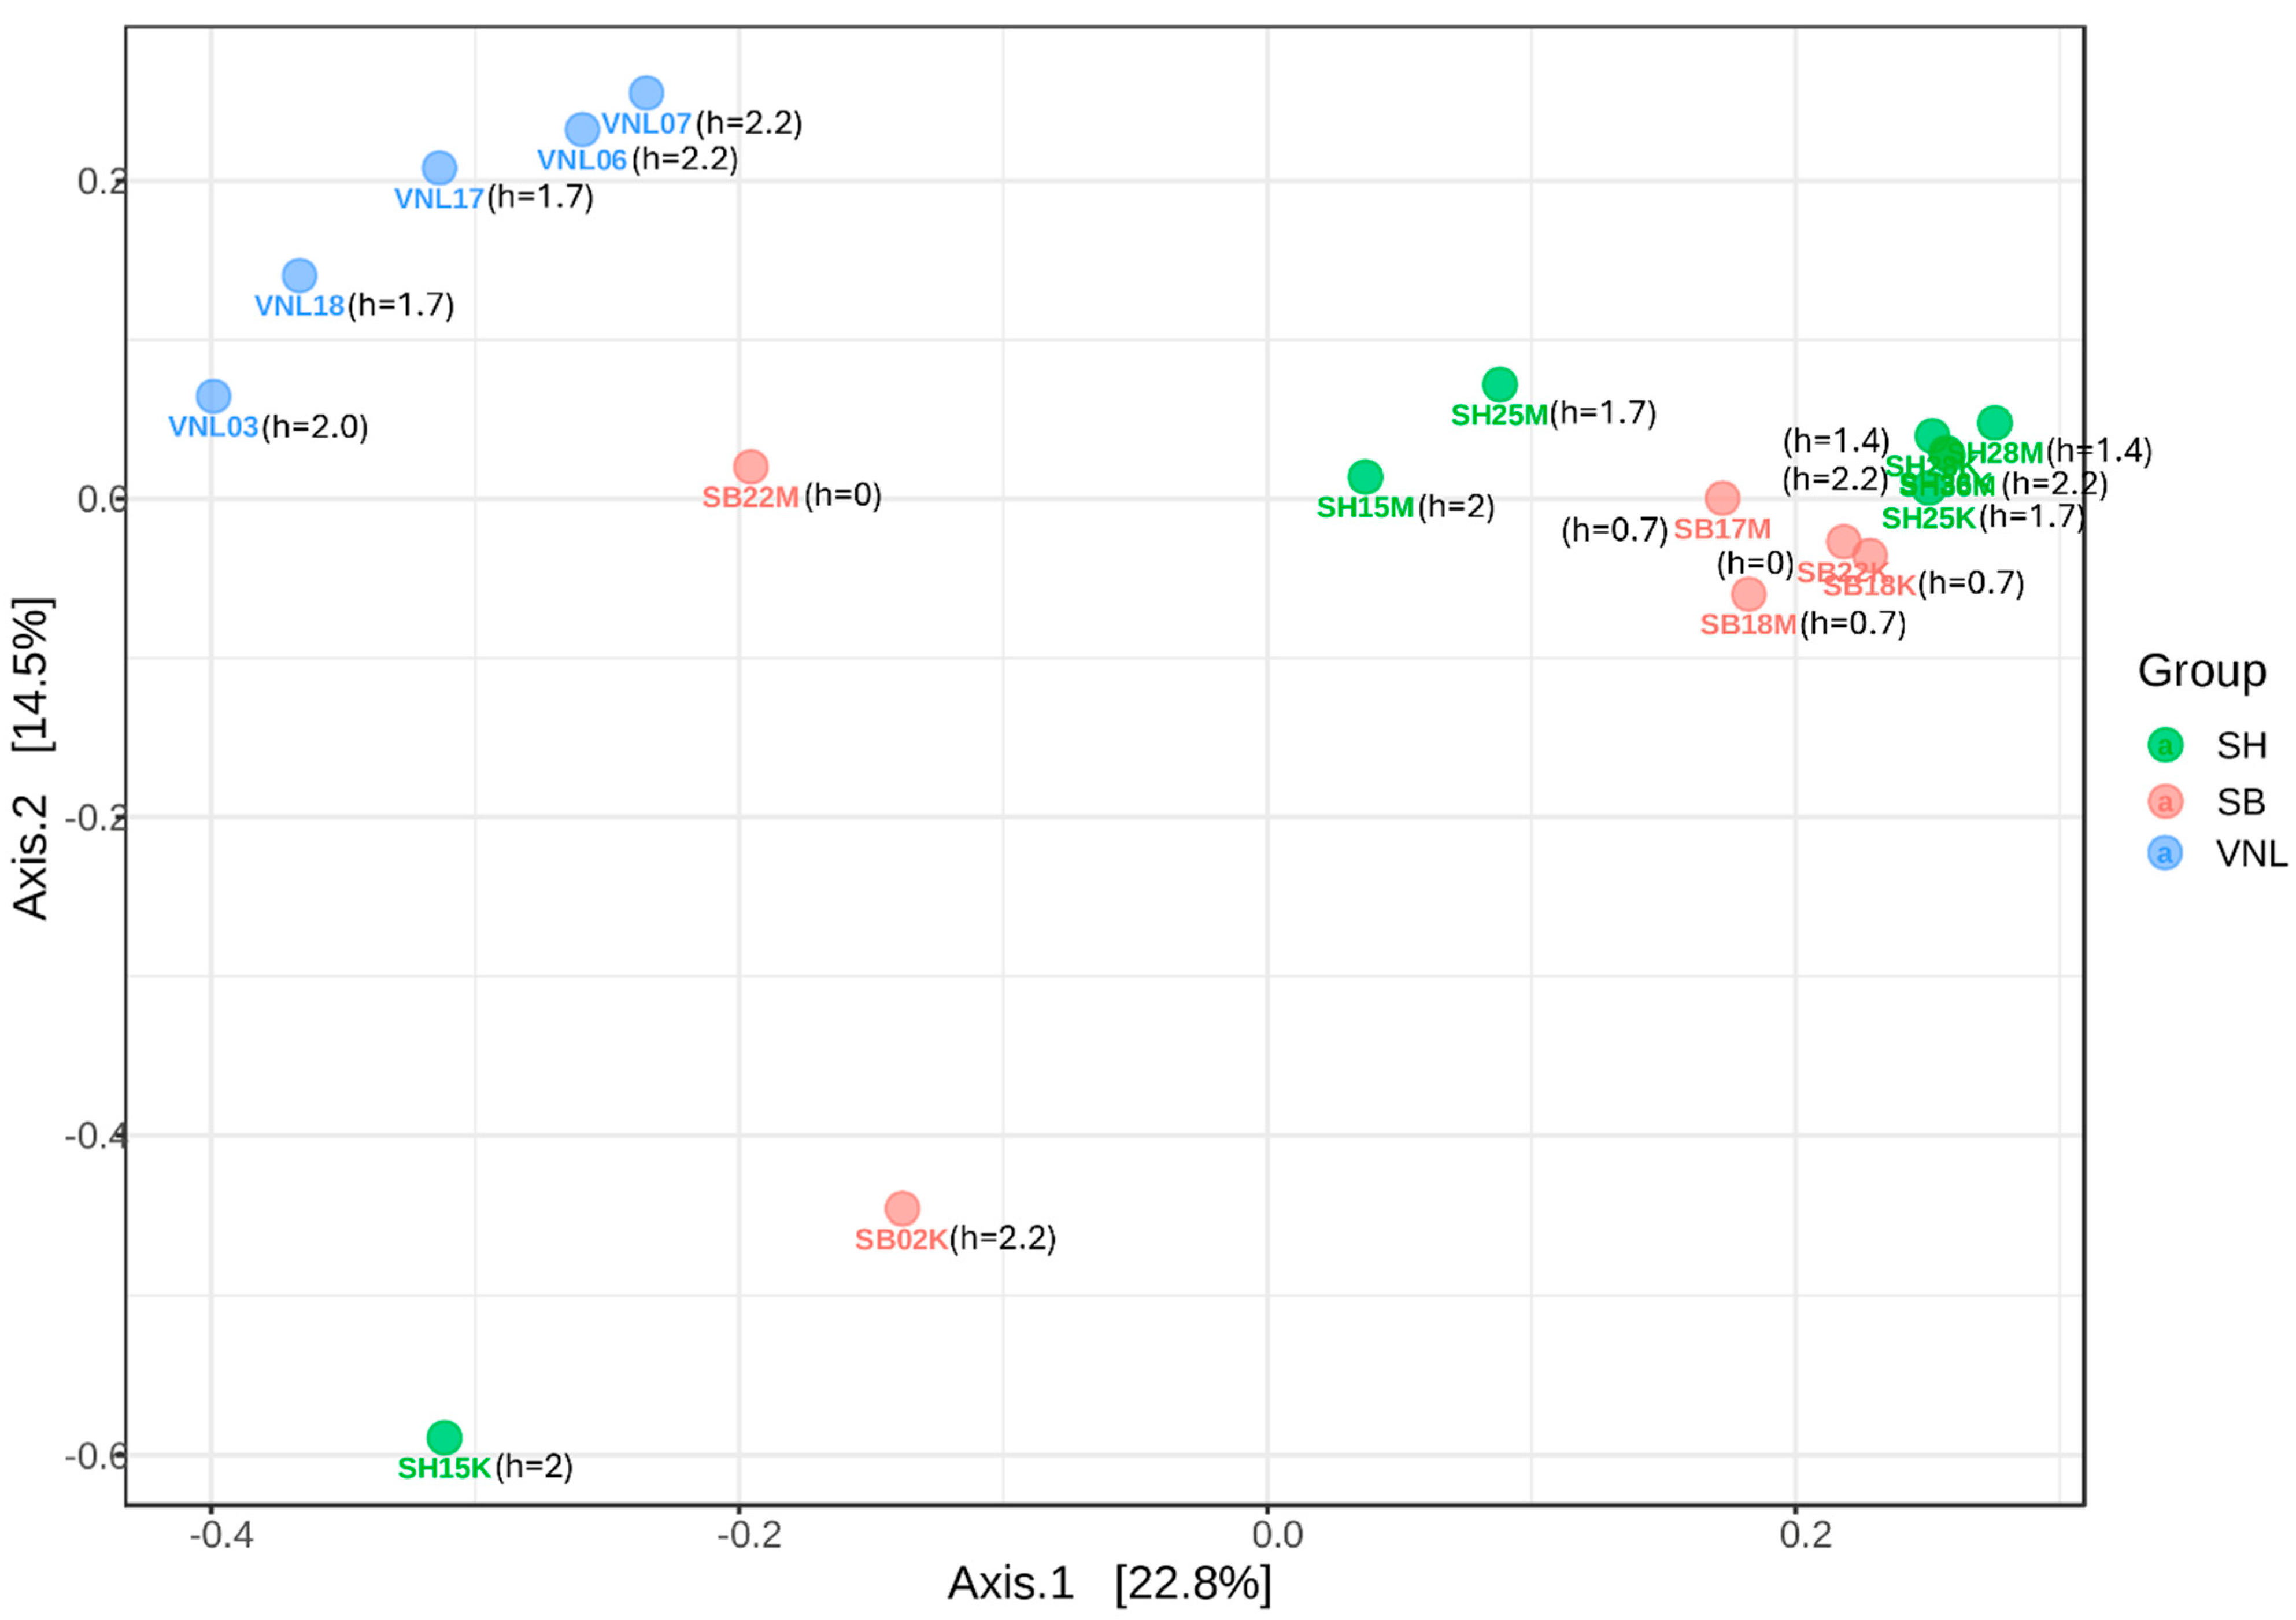
3.2. Bacterial Diversity

To estimate the alpha diversity levels of the samples, the respective rarefaction curves were established (Figure 2). Interestingly, the samples having the highest diversity levels were those taken from the Red river in the rainy season, including SH25M, SH28M, and SH15M, while those having the lowest diversity levels were two river samples taken in the dry season (SH15K, SB02K) and two taken from the Mekong delta flood zone (VNL18, VNL03). Interestingly, SH15K had the highest Chao1 index (rich in species) while, surprisingly, it grouped with SB02K and VNL03 as the three samples having the lowest Shannon indices but the highest Simpson indices (Figure 3, Table S3). These results suggest that the bacterial communities in those three samples are significantly different from the rest. Indeed, this is apparent when comparing the taxonomic compositions of the bacterial communities (Figure 4), which show the distinct compositions of SH15K, SB02K, and VNL03, with typically some genera abundantly dominating these communities. The differences of the bacterial communities of these three samples from the rest were also demonstrated by the results of PCoA (Figure 5) and cluster analysis (Figure S2) based on Bray–Curtis distances.
Except for the three samples (SH15K, SB02K, and SB22M), it can be seen that the alpha-diversity levels of the samples from the three regions are astoundingly not very much different from each other (Figure 3). However, we can see that in terms of bacterial community structure (beta-diversity), in general, the samples of a same region were closer to each other than to the samples from other regions (Figure 5 and Figure S2). That is, the bacterial communities in different regions are distinctively different. This statement is also supported by the different taxonomic biomarkers of the three different regions, as indicated by LefSe (Figure S3). Specifically, the Red river communities were characteristic by the presence of Bacteroides, Phocaeicola, Novosphingobium, etc., the Ba river communities were characteristic by the presence of Exiguibacterium, Gaiella, Neobacillus, Microvirga, etc., while those of the Mekong delta flood zone were characteristic by the presence of Glutamicibacter, some Deltaproteobacteria genera, and particularly Dechloromonas, Ducaniella, and Clostridium, which are the anaerobes. This is reasonable as the region was year-round covered with water, creating anaerobic conditions at its benthic area. We can also note that the samples from the Mekong delta flood zone seemed to have the highest degree of homology, in comparison to those from the Red river and those from the Ba river (Figure 4 and Figure 5). On the other hand, the community compositions of the samples from the two river regions tend to be close to each other while being relatively distant to those from the flood zone, except for the three mentioned samples (SH15K, SB02K, and SB22M). The data points representing these samples were actually “stand-alone” points in the PCA plot, which again suggests their unique properties.
Considering the differences between the rainy season samples and the dry season samples, except for the three samples mentioned above, we can see that the alpha-diversity indices of the rainy season samples tend to be higher than those of the dry season ones (Figure 2 and Figure 3). This is clear with the Chao and Shannon indices of the sample pairs such as SH25K/SH25M, SH28K/SH28M, SB18K/SB18M, and SB22K/SB22M (Figure 3A,B). However, when comparing the compositions of the bacterial communities, we could see that they were not much different from each other, especially for the pairs SH28K/SH28M and SB18K/SB18M (Figure 4 and Figure 5). The differences could anyway be observed in the relative abundances of some genera between the rainy and the dry seasons (Figure S4). Taking the Ba river samples as examples, in SB22, Sphingomonas increased markedly in the rainy season, while in the dry season it seemed to be reduced and Geobacter became abundant. Similar changes of Gaiella were observed for SB18 samples. Regarding the Red river samples, the most apparent changes could be observed, with some genera belonging to Rhizobiales and Lachnospiraceae families for all the samples.

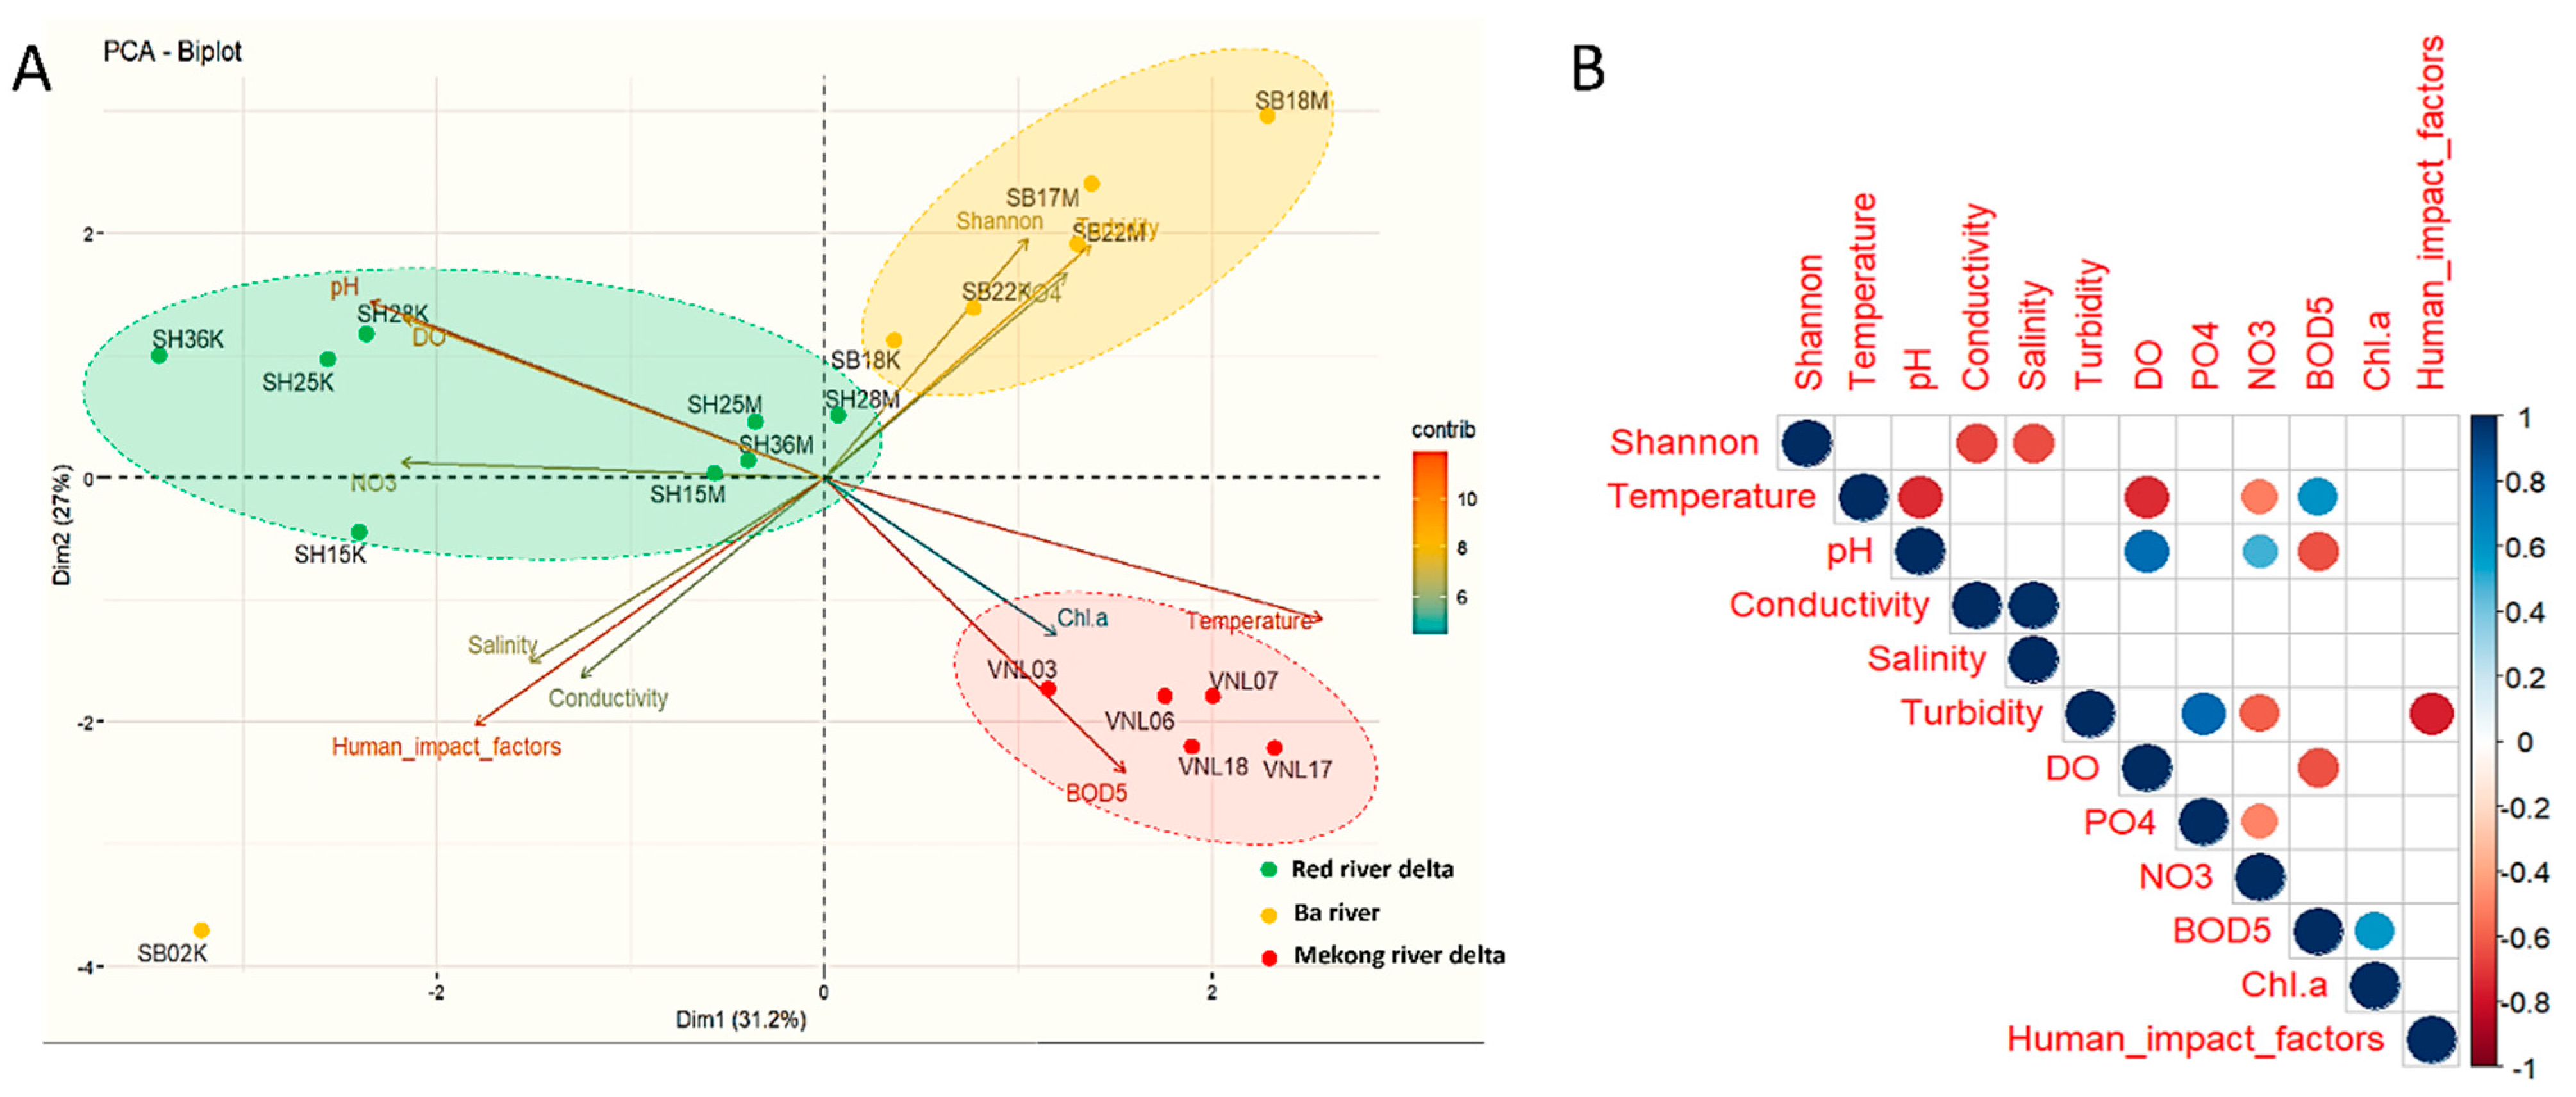
3.3. Bacterial Diversity vs. Environmental Factors

In terms of alpha-diversity in relation to environmental factors, PCA results (Figure 6A) show that bacterial communities of the same region tend to be grouped together, which again suggests their biogeographical characteristics, as stated above. Indeed, it seems that the alpha-diversity indices had little correlation to most water parameters, except turbidity, phosphate concentration, salinity, and conductivity. The alpha diversity appeared to be proportional to turbidity and phosphate concentration, while reversely proportional to the latter parameters. The correlation between the alpha diversity and salinity was further confirmed by a regression analysis (p < 0.02) (Figure S6). Salinity and conductivity can be actually considered similar and reflect the concentration of ions in the water.
In terms of community composition (beta diversity), as already mentioned above, the samples could also be grouped by region, except for SH15K, SB02K, and SB22M (PCoA result, Figure 5). Thus, the impact of environmental factors on community composition might as well be similar to that on community richness (alpha diversity). That is, some region-specific physicochemical parameters such as salinity (conductivity), phosphate concentration and turbidity, rather than global parameters, might decide bacterial diversity in the water samples of interest.

3.4. Bacterial Diversity vs. Human Impact

Regarding the correlations between alpha diversity and human impact of the bacterial communities of the studied sites, no tight links could be observed (after many regression tests were applied) (Figure 6B and Figure 7). However, it is quite clear that several samples having high human impact scores also had significantly low Shannon indices (down to below 6, even to ~4.5 for SH15K and ~3.7 for SB02K). Indeed, the PCA results showed that the Shannon indices of the samples had a negative correlation with human impact (Figure 6A), although the correlation was not very significant (p = 0.075). Nevertheless, the correlations between human impact and the composition of the communities were not clear, as shown by our PCoA (Figure 5), as the community compositions tend to be homologically grouped by region and within one group, the human impact scores varied. Despite that, it should be noticed that SH15K and SB02K were “stand-alone” points in the PCA plot (Figure 6A), i.e., these highly impacted-by-human samples had their bacterial communities distinctively different from the rest.

4. Discussion

From the results, we can see that although the bacterial communities in the samples were different from each other, in terms of both species richness (alpha diversity) and species composition (beta diversity), these differences were solely by region, and not significantly by season or by human impact. As shown by the results above, the underlying reason might be mainly the region-specific environmental factors, particularly the concentration of ions (including phosphate) in water. Indeed, Zeglin, when studying 100 publications on stream microbial diversity, also reported that metal (or ion) concentrations affected microbial diversity the most, while the effect of organic matter and nutrient concentrations were less significant although it was expected to be opposite [17]. Islam et al. (2019), on the other hand, demonstrated that microbial diversity in lakes (static waters) was correlated to many environmental factors, including temperature, conductivity, pH, DO, and nutrient content, etc. [39]. They claim that temperature is the most influential factor, as it determines various biotic and abiotic activities of aquatic systems, but it is salinity that is decisive to bacterial community composition. The results of our study are more consistent with those of the studies on stream microbial diversity, in the aspect that the most affecting factor is the concentration of ions, as expressed by salinity and conductivity. The effect showed a negative correlation between such factor(s) and bacterial diversity, which is reasonable and similar to what was reported by Zeglin (2015) [17]. However, among the ions, phosphate appeared to positively affect bacterial diversity (Figure 6), although it is not clear to what extent phosphate can contribute to salinity or conductivity. Such an effect of phosphate is understandable, as phosphorus is a major nutrient required by microorganisms.
It is interesting to note that the changes in salinity and conductivity can be due to climate change. Indeed, it is known that climate change causes salinity changes in oceans and aquatic ecosystems [40,41]. Particularly, sea level increases, a serious consequence of global warming (climate change), can lead to saltwater intrusion into inland regions. It has been reported that in the last 10 years, salt intrusion affected millions of hectares of land in Mekong delta area in Vietnam [42]. Therefore, if salinity/conductivity is an important factor affecting bacterial diversity in inland waters, then it is implied that climate change will also significantly affect bacterial diversity (and microbial diversity in general) in those systems. However, it seems that most of our studied sites (except SB02) have not yet been affected by sea intrusion, as their salinity levels have not changed, and thus probably neither have their bacterial diversity levels.
It is unknown whether water salinity/conductivity changes could have some links to human activities, but our results also show that human activities do have certain effects on bacterial diversity of the sediment in the studied inland waters. The effect appears to be more pronounced on alpha diversity, i.e., the species richness, but less on beta diversity, i.e., species composition or community structure. Our observations are interesting, as there have been diverse opinions on the effects of anthropogenic activities on bacterial diversity in water ecosystems. The general concept is that human activities affect both alpha diversity and beta diversity, directly or indirectly through causing environmental changes [39,43]. However, there is evidence that bacterial communities (especially in sediment) can be really resistant or resilient to impacts caused by human activities [44]. In our study, the bacterial communities were affected by human activities solely in terms of their species richness, while their structures seem to be determined more by region-specific environmental factors than by anthropogenic impact. Our hypothesis is that due to the spatial distribution of the studied locations and their different climatic and geological characteristics, their bacterial community compositions are solely shaped by environmental factors, as the consequence of a long-term evolution, but their species richness can be more sensitive to recent temporary changes of both natural and anthropogenic origins. Furthermore, the human impact can be indirect through altering environmental conditions. For example, salinity changes can be caused by human activities, particularly increased land use, while climate change may account for only a minor proportion of the changes [41].
Another interesting observation in this study is that the bacterial diversities of the samples also changed with seasons. However, in our opinion, such seasonal effects are generally light, mainly on species richness (alpha diversity) and abundance of some species, and not seriously alter community structure (beta diversity). Furthermore, the dry season samples and the rainy season ones were surprisingly different in temperature and turbidity, rather than in salinity and conductivity (Table 1). Indeed, there have been only a few studies on microbial diversity changes due to seasonality in inland waters. Sun et al. (2017) reported that bacterioplankton communities in a drinking water source rivers varied in both composition and abundance from dry to wet seasons [45]. Ortiz-Vera et al. (2018), when studying fungal communities in a tropical river, found that only 11% of fungi were shared between the rainy and dry seasons [46], i.e., seasonal changes can greatly alter microbial diversity. In our study, the unremarkable changes in bacterial diversity due to seasonality again suggest that the sediment bacterial communities in the studied sites are relatively stable or transilient and are solely shaped by region-specific climatic and geological factors, not sensitively affected by temporary environmental changes. Nevertheless, it should be noted that severe climate change can largely alter seasonal patterns, causing profound environmental changes, which can eventually alter microbial diversity.
Among the samples, some (SH15K, SB02K, SB22M, VNL03) had bacterial communities that were less rich in species and distinctively different from those of not only the other samples of the same regions, but also the rest of the samples. One may notice that the environmental parameters of those samples have nothing in common. Their only common property may be their high human impact scores, but only for SH15K, SB02K, and VNL03, while SB22M (an upstream sample) was not affected much by human activity. Moreover, looking at the sampling map (Figure 1), we can see clearly that the locations of these samples are distinct from the others. SB02K is the only sample in an estuary area, and its physicochemical parameters are exceptionally different from all the others, in that its salinity/conductivity and BOD5 are outstandingly high. Thus, the distinct bacterial community of this site is understandable, as is also reported for bacterial communities in other estuary areas, which have high levels of diversity compared to other communities [47,48]. Particularly, its predominating members belong to some genera known to consist of salt-tolerant bacteria, such as Planococcus and Psychrobacter (Figure 4) [49,50], which corroborates the hypothesis on the important effect of salinity. As for SH15K, its location is right at the densely populated center of the north (Figure 1), although this sample had no distinguishing environmental properties compared to the others. Probably for SB02 and SH15, human impact is more vigorous in the dry season, but this requires further investigation. If human impact is the main reason, then it is in turn difficult to explain the SB22M case, of which human impact was almost zero. However, it is noteworthy that the SB22 site is relatively distant from the other “SB” sites (Figure 1) and tends to be more in a mountainous area where it can be affected by many other factors, particularly in the rainy season. As for VNL03, human impact can also be a reason for consideration to explain the difference in its bacterial community from those of the rest samples from the Mekong delta region, but we should at the same time notice that its DO (5.7 mg/L) was remarkably higher than those of the others (1.65, 1.82 and 3.35 mg/L), which might be another reason. We should also notice that on the map (Figure 1), the location of VNL03 is “off-the-group” among the “VNL” samples.
In summary, in this study, we found that geographically environmental factors are more decisive than anthropogenic factors in determining bacterial diversity in the studied inland waters. Among environmental factors, salinity or conductivity can be the key factor deciding bacterial diversity in inland waters, which could mean that climate change incidences, especially sea intrusion, can have significant effects. Alternatively, we should not exclude the possibility that human activities can alter environmental conditions (including salinity) in such ecosystems and thereby indirectly affect their microbial diversity. In our study, human impacts do not appear severe, solely affecting bacterial community richness but not significantly affecting bacterial community composition. However, apparently reduced bacterial diversity in several sites with intensive human impacts should be noted and deserve further investigation.

Supplementary Materials

The following supporting information can be downloaded at: https://www.mdpi.com/article/10.3390/microbiolres15020056/s1, Table S1. Detailed location information of the samples; Table S2. The detailed explanation of how to score the human impacts at the sampling sites; Table S3. Alpha-diversity indices of the bacterial communities in the studied samples; Figure S1. Quality of the sequencing data, as evaluated by FastQC tool; Figure S2. Dendrogram displaying the similarity/dissimilarity among the samples (based on Bray–Curtis distance); Figure S3. Top 20 genera with the highest LDA scores (the taxonomic biomarkers) when comparing the 3 sample groups from the 3 regions; Figure S4. Comparison of the top 10 genera between the dry season sample groups (K) and the rain season sample groups (M) in Red river (top) and in Ba river (bottom); Figure S5. Taxonomic composition of the bacterial communities in the studied samples at phylum level (higher than 1% in relative abundance); Figure S6. Regression analysis (p < 0.01) of the Shannon indices of the bacterial communities in the studied samples versus their salinity levels.

Author Contributions

Conceptualization: H.T.P. and H.T.B.; Experimental design: H.T.P. and H.T.B.; Experimental conduction and Data analysis: H.T.B., T.T.T.N., T.D.N., T.T.N., C.V.D., H.P.T. and H.T.P.; Technical assistance: T.T.T.N.; Discussion and Manuscript revising: H.T.B., T.T.T.N., H.T.L., H.Q.N., D.T.P., N.T.N. and H.T.P.; Manuscript drafting and finalizing: H.T.P., H.T.B., C.V.D. and H.P.T.; Project administration: H.T.B. All authors have read and agreed to the published version of the manuscript.

Funding

This research was funded by Vietnam National University (Hanoi) under grant number QG 21.07.

Institutional Review Board Statement

Not applicable.

Informed Consent Statement

Not applicable.

Data Availability Statement

Data can be provided upon request.

Acknowledgments

The authors would like to thank Thanh Trung Tran and Phuong Ha Vu (Faculty of Biology, VNU University of Science) for their kind help during the study.

Conflicts of Interest

The authors declare no conflicts of interests.

References

  1. Bandh, S.A.; Parray, J.A.; Shameem, N. Climate Change and Microbial Diversity: Advances and Challenges; CRC Press: Boca Raton, FL, USA, 2022. [Google Scholar]
  2. Zhang, Y.; Dong, S.; Gao, Q.; Liu, S.; Zhou, H.; Ganjurjav, H.; Wang, X. Climate change and human activities altered the diversity and composition of soil microbial community in alpine grasslands of the Qinghai-Tibetan Plateau. Sci. Total. Environ. 2016, 562, 353–363. [Google Scholar] [CrossRef] [PubMed]
  3. Jain, P.K.; Purkayastha, S.D.; De Mandal, S.; Passari, A.K.; Govindarajan, R.K. Effect of climate change on microbial diversity and its functional attributes. In Recent Advancements in Microbial Diversity; Elsevier: Amsterdam, The Netherlands, 2020; pp. 315–331. [Google Scholar]
  4. Jansson, J.K.; Hofmockel, K.S. Soil microbiomes and climate change. Nat. Rev. Microbiol. 2020, 18, 35–46. [Google Scholar] [CrossRef] [PubMed]
  5. Wu, L.; Zhang, Y.; Guo, X.; Ning, D.; Zhou, X.; Feng, J.; Yuan, M.M.; Liu, S.; Guo, J.; Gao, Z.; et al. Reduction of microbial diversity in grassland soil is driven by long-term climate warming. Nat. Microbiol. 2022, 7, 1054–1062. [Google Scholar] [CrossRef] [PubMed]
  6. Yang, Y.; Li, T.; Wang, Y.; Cheng, H.; Chang, S.X.; Liang, C.; An, S. Negative effects of multiple global change factors on soil microbial diversity. Soil Biol. Biochem. 2021, 156, 108229. [Google Scholar] [CrossRef]
  7. Pold, G.; DeAngelis, K.M. Up against the wall: The effects of climate warming on soil microbial diversity and the potential for feedbacks to the carbon cycle. Diversity 2013, 5, 409–425. [Google Scholar] [CrossRef]
  8. Blaud, A.; Lerch, T.Z.; Phoenix, G.K.; Osborn, A.M. Arctic soil microbial diversity in a changing world. Res. Microbiol. 2015, 166, 796–813. [Google Scholar] [CrossRef] [PubMed]
  9. Makhalanyane, T.P.; Van Goethem, M.W.; Cowan, D.A. Microbial diversity and functional capacity in polar soils. Curr. Opin. Biotechnol. 2016, 38, 159–166. [Google Scholar] [CrossRef] [PubMed]
  10. Garcia-Moreno, J.; Harrison, I.J.; Dudgeon, D.; Clausnitzer, V.; Darwall, W.; Farrell, T.; Savy, C.; Tockner, K.; Tubbs, N. Sustaining Freshwater Biodiversity in the Anthropocene; Springer: Berlin/Heidelberg, Germany, 2014; pp. 247–270. [Google Scholar]
  11. Capon, S.J.; Chambers, L.E.; Mac Nally, R.; Naiman, R.J.; Davies, P.; Marshall, N.; Pittock, J.; Reid, M.; Capon, T.; Douglas, M.; et al. Riparian ecosystems in the 21st century: Hotspots for climate change adaptation? Ecosystems 2013, 16, 359–381. [Google Scholar] [CrossRef]
  12. Dinesen, L.; Joosten, H.; Rochefort, L.; Lindsay, R.; Glatzel, S. Ramsar Policy Brief No. 5. Restoring drained peatlands: A necessary step to achieve global climate goals. In Convention on Wetlands; Secretariat of the Convention on Wetlands: Gland, Switzerland, 2021; Available online: https://repository.uel.ac.uk/download/15eac57c406a86031ea0a7545bd4631f8f70921f1f0d1a057b443f5bc7d69c42/1267307/rpb5_restoring_drained_peatlands_e.pdf (accessed on 15 February 2024).
  13. Collen, B.; Whitton, F.; Dyer, E.E.; Baillie, J.E.; Cumberlidge, N.; Darwall, W.R.; Pollock, C.; Richman, N.I.; Soulsby, A.M.; Böhm, M.; et al. Global patterns of freshwater species diversity, threat and endemism. Glob. Ecol. Biogeogr. 2014, 23, 40–51. [Google Scholar] [CrossRef]
  14. Thieme, M.L.; Tickner, D.; Grill, G.; Carvallo, J.P.; Goichot, M.; Hartmann, J.; Higgins, J.; Lehner, B.; Mulligan, M.; Nilsson, C. Navigating trade-offs between dams and river conservation. Glob. Sustain. 2021, 4, e17. [Google Scholar] [CrossRef]
  15. Esdaile, L.J.; Chalker, J.M. The mercury problem in artisanal and small-scale gold mining. Chemistry 2018, 24, 6905–6916. [Google Scholar] [CrossRef] [PubMed]
  16. Chagnon, M.; Kreutzweiser, D.; Mitchell, E.A.; Morrissey, C.A.; Noome, D.A.; Van der Sluijs, J.P. Risks of large-scale use of systemic insecticides to ecosystem functioning and services. Environ. Sci. Pollut. Res. 2015, 22, 119–134. [Google Scholar] [CrossRef] [PubMed]
  17. Zeglin, L.H. Stream microbial diversity in response to environmental changes: Review and synthesis of existing research. Front. Microbiol. 2015, 6, 128252. [Google Scholar] [CrossRef] [PubMed]
  18. Retter, A.; Karwautz, C.; Griebler, C. Groundwater microbial communities in times of climate change. Curr. Issues Mol. Biol. 2021, 41, 509–538. [Google Scholar] [CrossRef] [PubMed]
  19. Muyzer, G. DGGE/TGGE a method for identifying genes from natural ecosystems. Curr. Opin. Microbiol. 1999, 2, 317–322. [Google Scholar] [CrossRef] [PubMed]
  20. Nam, N.N.; Do, H.D.K.; Loan Trinh, K.T.; Lee, N.Y. Metagenomics: An effective approach for exploring microbial diversity and functions. Foods 2023, 12, 2140. [Google Scholar] [CrossRef] [PubMed]
  21. Sodhi, N.S.; Posa, M.R.C.; Lee, T.M.; Bickford, D.; Koh, L.P.; Brook, B.W. The state and conservation of Southeast Asian biodiversity. Biodivers. Conserv. 2010, 19, 317–328. [Google Scholar] [CrossRef]
  22. Nakayama, T.; Hoa, T.T.T.; Harada, K.; Warisaya, M.; Asayama, M.; Hinenoya, A.; Lee, J.W.; Phu, T.M.; Ueda, S.; Sumimura, Y.; et al. Water metagenomic analysis reveals low bacterial diversity and the presence of antimicrobial residues and resistance genes in a river containing wastewater from backyard aquacultures in the Mekong Delta, Vietnam. Environ. Pollut. 2017, 222, 294–306. [Google Scholar] [CrossRef]
  23. Wada, M.; Mori, F.; Yokouchi, K.; Yagi, M.; Takita, T.; Ishimatsu, A.; Iwataki, M.; Takahashi, K.; Van Mai, H.; Vo, T.T. Comparison of planktonic microbial abundance and dissolved oxygen consumption between the aquaculture ponds of mudskippers and shrimps in the Mekong Delta, southern Vietnam. Fish Sci. 2016, 82, 787–797. [Google Scholar] [CrossRef]
  24. Wilbers, G.-J.; Becker, M.; Sebesvari, Z.; Renaud, F.G. Spatial and temporal variability of surface water pollution in the Mekong Delta, Vietnam. Sci. Total. Environ. 2014, 485, 653–665. [Google Scholar] [CrossRef]
  25. Pham, T.-L.; Dao, T.-S.; Tran, N.-D.; Nimptsch, J.; Wiegand, C.; Motoo, U. Influence of environmental factors on cyanobacterial biomass and microcystin concentration in the Dau Tieng Reservoir, a tropical eutrophic water body in Vietnam. Ann. Limnol.-Int. J. Limnol. 2017, 53, 89–100. [Google Scholar] [CrossRef]
  26. Petro, C.; Starnawski, P.; Schramm, A.; Kjeldsen, K.U. Microbial community assembly in marine sediments. Aquat. Microb. Ecol. 2017, 79, 177–195. [Google Scholar] [CrossRef]
  27. Mac, T.M.T. A Review on Stream and River Ecosystems in Vietnam: Common and Specific Characteristics by Their Natural Geographical Conditions (in Vietnamese). 2008. Available online: http://thongtinkhcn.vinhlong.gov.vn:81/kqncvn2012/Bao_ve_moi_truong/Toan_van/7629-3.pdf (accessed on 15 February 2024).
  28. Li, Z.; Saito, Y.; Matsumoto, E.; Wang, Y.; Tanabe, S.; Vu, Q.L. Climate change and human impact on the Song Hong (Red River) Delta, Vietnam, during the Holocene. Quat. Int. 2006, 144, 4–28. [Google Scholar] [CrossRef]
  29. Li, J.; Li, Z.; Dang, X.P.; Eiji, M.; Jiang, H. Characteristics of vegetation types and distributions around the Red River, Vietnam. Guihaia 2009, 29, 744–750. [Google Scholar]
  30. Pham, Q.S. Assessment of the Impacts of the Downstream Flow Rate of Ba River on the Accretion in the Estuary Area of Da Dien River, Phu Yen Province (in Vietnamese). Master’s Thesis, VNU University of Science—Vietnam National University in Hanoi, Hanoi, Vietnam, 2018. [Google Scholar]
  31. Xuan, N.H.; Van, N.K.; Oanh, H.T.K.; Van Vu, V. The creation of bioclimatic vegetation map to develop sustainable agro forestry in ba and kone river basin, vietnam. Ukr. Geogr. J. 2021, N1, 54–62. [Google Scholar] [CrossRef]
  32. Le, T.; Cần, T.; Du, L.; Ngọc, P.; Thường, V.; Toan, T.; Lợi, T. Summary of Several Acts to Cope with Clime Change in Mekong Delta Area (in Vietnamese); Project Report of Sustainable Rural Development Centre and Climate Change Research Institute at Can Tho University: Can Tho, Vietnam, 2013. [Google Scholar]
  33. Dang, A.T.; Kumar, L.; Reid, M.; Anh, L.N. Modelling the susceptibility of wetland plant species under climate change in the Mekong Delta, Vietnam. Ecol. Informatics 2021, 64, 101358. [Google Scholar] [CrossRef]
  34. Greenberg, A.; Clesceri, L.S.; Eaton, A.D. Standard Methods for the Examination of Water and Wastewater, 18th ed.; American Public Health Association: Washington, DC, USA, 1992. [Google Scholar]
  35. Trinh, H.P.; Lee, S.-H.; Kim, N.-K.; Yoon, H.; Jeong, G.; Jung, Y.-J.; Hur, M.; Lee, B.-H.; Park, H.-D. Enrichment of Ca. Jettenia in sequencing batch reactors operated with low nitrogen loading rate and high influent nitrogen concentration. Bioresour. Technol. 2022, 352, 127079. [Google Scholar] [CrossRef] [PubMed]
  36. Bolyen, E.; Rideout, J.R.; Dillon, M.R.; Bokulich, N.A.; Abnet, C.C.; Al-Ghalith, G.A.; Alexander, H.; Alm, E.J.; Arumugam, M.; Asnicar, F.; et al. Reproducible, interactive, scalable and extensible microbiome data science using QIIME 2. Nat. Biotechnol. 2019, 37, 852–857. [Google Scholar] [CrossRef]
  37. Quast, C.; Pruesse, E.; Yilmaz, P.; Gerken, J.; Schweer, T.; Yarza, P.; Peplies, J.; Glöckner, F.O. The SILVA ribosomal RNA gene database project: Improved data processing and web-based tools. Nucleic Acids Res. 2012, 41, D590–D596. [Google Scholar] [CrossRef]
  38. Kassambara, A. Factoextra: Extract and visualize the results of multivariate data analyses [R package factoextra version 1.0. 7]. Comprehensive R Archive Network (CRAN), 2020.
  39. Islam, M.; Shafi, S.; Bandh, S.A.; Shameem, N. Impact of environmental changes and human activities on bacterial diversity of lakes. In Freshwater Microbiology; Elsevier: Amsterdam, The Netherlands, 2019; pp. 105–136. [Google Scholar]
  40. Vineis, P.; Chan, Q.; Khan, A. Climate change impacts on water salinity and health. J. Epidemiol. Glob. Health 2011, 1, 5–10. [Google Scholar] [CrossRef]
  41. Olson, J.R. Predicting combined effects of land use and climate change on river and stream salinity. Philos. Trans. R. Soc. Lond. 2019, 374, 20180005. [Google Scholar] [CrossRef]
  42. Vu, D.T.; Yamada, T.; Ishidaira, H. Assessing the impact of sea level rise due to climate change on seawater intrusion in Mekong Delta, Vietnam. Water Sci. Technol. 2018, 77, 1632–1639. [Google Scholar] [CrossRef]
  43. Huang, L.; Bai, J.; Wen, X.; Zhang, G.; Zhang, C.; Cui, B.; Liu, X. Microbial resistance and resilience in response to environmental changes under the higher intensity of human activities than global average level. Glob. Chang. Biol. 2020, 26, 2377–2389. [Google Scholar] [CrossRef]
  44. Antiqueira, P.A.P.; Petchey, O.L.; Dos Santos, V.P.; de Oliveira, V.M.; Romero, G.Q. Environmental change and predator diversity drive alpha and beta diversity in freshwater macro and microorganisms. Glob. Chang. Biol. 2018, 24, 3715–3728. [Google Scholar] [CrossRef]
  45. Sun, W.; Xia, C.; Xu, M.; Guo, J.; Sun, G. Seasonality affects the diversity and composition of bacterioplankton communities in Dongjiang River, a drinking water source of Hong Kong. Front. Microbiol. 2017, 8, 1644. [Google Scholar] [CrossRef]
  46. Ortiz-Vera, M.P.; Olchanheski, L.R.; da Silva, E.G.; de Lima, F.R.; Martinez, L.R.d.P.R.; Sato, M.I.Z.; Jaffé, R.; Alves, R.; Ichiwaki, S.; Padilla, G.; et al. Influence of water quality on diversity and composition of fungal communities in a tropical river. Sci. Rep. 2018, 8, 14799. [Google Scholar] [CrossRef]
  47. Feng, B.-W.; Li, X.-R.; Wang, J.-H.; Hu, Z.-Y.; Meng, H.; Xiang, L.-Y.; Quan, Z.-X. Bacterial diversity of water and sediment in the Changjiang estuary and coastal area of the East China Sea. FEMS Microbiol. Ecol. 2009, 70, 236–248. [Google Scholar] [CrossRef]
  48. Campbell, B.J.; Kirchman, D.L. Bacterial diversity, community structure and potential growth rates along an estuarine salinity gradient. ISME J. 2013, 7, 210–220. [Google Scholar] [CrossRef]
  49. Wang, Y.; Wang, Q.; Hou, Y. A new cold-adapted and salt-tolerant glutathione reductase from Antarctic psychrophilic bacterium Psychrobacter sp. and its resistance to oxidation. Int. J. Mol. Sci. 2020, 21, 420. [Google Scholar] [CrossRef]
  50. Gan, L.; Li, X.; Tian, Y.; Peng, B. Genomic insights into the salt tolerance and cold adaptation of Planococcus halotolerans SCU63 T. Arch. Microbiol. 2020, 202, 2841–2847. [Google Scholar] [CrossRef] [PubMed]
Figure 1. Sampling locations indicated in the map of Vietnam. Note: samples labeled with “SH” were from the Red river region in northern Vietnam (A), samples labeled with “SB” were from the Ba river region in central Vietnam (B), and those labeled with “VNL” were from Mekong delta flood zone in southern Vietnam (C). The inlets show the relative positions of the respective sampling sites on the map of Vietnam.
Microbiolres 15 00056 g001
Figure 2. The respective rarefaction curves of the samples.
Microbiolres 15 00056 g002
Figure 3. The alpha-diversity indices of the bacterial communities in the samples. Note: (A): Chao 1 index; (B): Shannon index, and (C): Simpson index.
Microbiolres 15 00056 g003
Figure 4. Taxonomic compositions of the bacterial communities in the studied samples at genus level (higher than 3% in relative abundance).
Microbiolres 15 00056 g004
Figure 5. PCoA showing the relationships in bacterial composition between the samples (based on Bray–Curtis distance). Note: next to each sample label is the respective human impact score (h) of the sampling site.
Microbiolres 15 00056 g005
Figure 6. PCA and correlation analysis showing the relationships between alpha–diversity (represented by the Shannon index) of the bacterial communities in the samples and environmental factors, as well as human impact. Notes: (A): the PCA plot; (B): the score matrix showing the correlations between different pairs of factors (only significant values lower than 0.05 were shown).
Microbiolres 15 00056 g006
Figure 7. The correlations between the Shannon indices of the samples with their respective assumptive human impact scores.
Microbiolres 15 00056 g007
Table 1. List of samples and their respective information (including environmental parameters and assumptive human impact (H. impact) scores, calculated as explained in the Supplementary Materials). Note: MD: Mekong delta.
SampleRegionSeasonTemperature
(°C)
pHConductivity
(mS m−1)
Salinity
(%)
Turbidity
(NTU)
[DO]
(mg L−1)
[PO43−]
(mg L−1)
[NO3]
(mg L−1)
BOD5
(mg L−1)
Chl.a
(mg L−1)
H. Impact Score
SH15KRed riverdry23.17.85200.01195.650.0270.7471.50.2182.0
SH15MRed riverrainy28.787.1719.60.0190.44.580.0931.0322.20.1932.0
SH25KRed riverdry21.57.99210.01266.230.0690.9881.10.1551.7
SH25MRed riverrainy30.287.7819.30.0160.14.050.0570.7040.60.0891.7
SH28KRed riverdry20.58.01200.01596.150.050.9231.50.1711.4
SH28MRed riverrainy28.727.0523.50.0184.74.170.0570.7490.50.1331.4
SH36KRed riverdry208.21220.1376.730.1081.070.70.2282.2
SH36MRed riverrainy27.937.0724.10.01705.190.0980.7291.51.9622.2
SB02KBa riverdry24.97.4112000.51035.30.0440.4624.20.4152.2
SB17MBa riverrainy28.927.59120.015246.490.3320.0891.14.2940.7
SB18KBa riverdry25.16.83110.012404.660.0580.4470.050.4720.7
SB18MBa riverrainy27.87.441005814.50.9650.1282.050.20.7
SB22KBa riverdry24.56.83100.012524.520.1040.4020.950.2590
SB22MBa riverrainy27.437.311.10.015223.230.3010.6521.60.120
VNL03MD flood zone 29.67.17160.012435.70.10.46.226.52.0
VNL06MD flood zone 31.46.6330.01411.650.110.564.52.2
VNL07MD flood zone 31.66.68340.01401.650.060.496.86.352.2
VNL17MD flood zone 31.26.6340.01411.820.080.519.48.551.7
VNL18MD flood zone 31.36.3250.01433.350.090.337.94.51.7
Disclaimer/Publisher’s Note: The statements, opinions and data contained in all publications are solely those of the individual author(s) and contributor(s) and not of MDPI and/or the editor(s). MDPI and/or the editor(s) disclaim responsibility for any injury to people or property resulting from any ideas, methods, instructions or products referred to in the content.

