


Investigating the Impact of Various Vegetation Scenarios on Outdoor Thermal Comfort in Low-Density Residential Areas of Hot Arid Regions


Abstract
:1. Introduction
2. Literature Review
3. Case Study
4. Methodology
4.1. ENVI-Met Microclimate Model
4.2. Field Investigation and Model Validation
4.3. The Criteria to Design the Proposed Scenarios
5. Results
5.1. Air Temperature
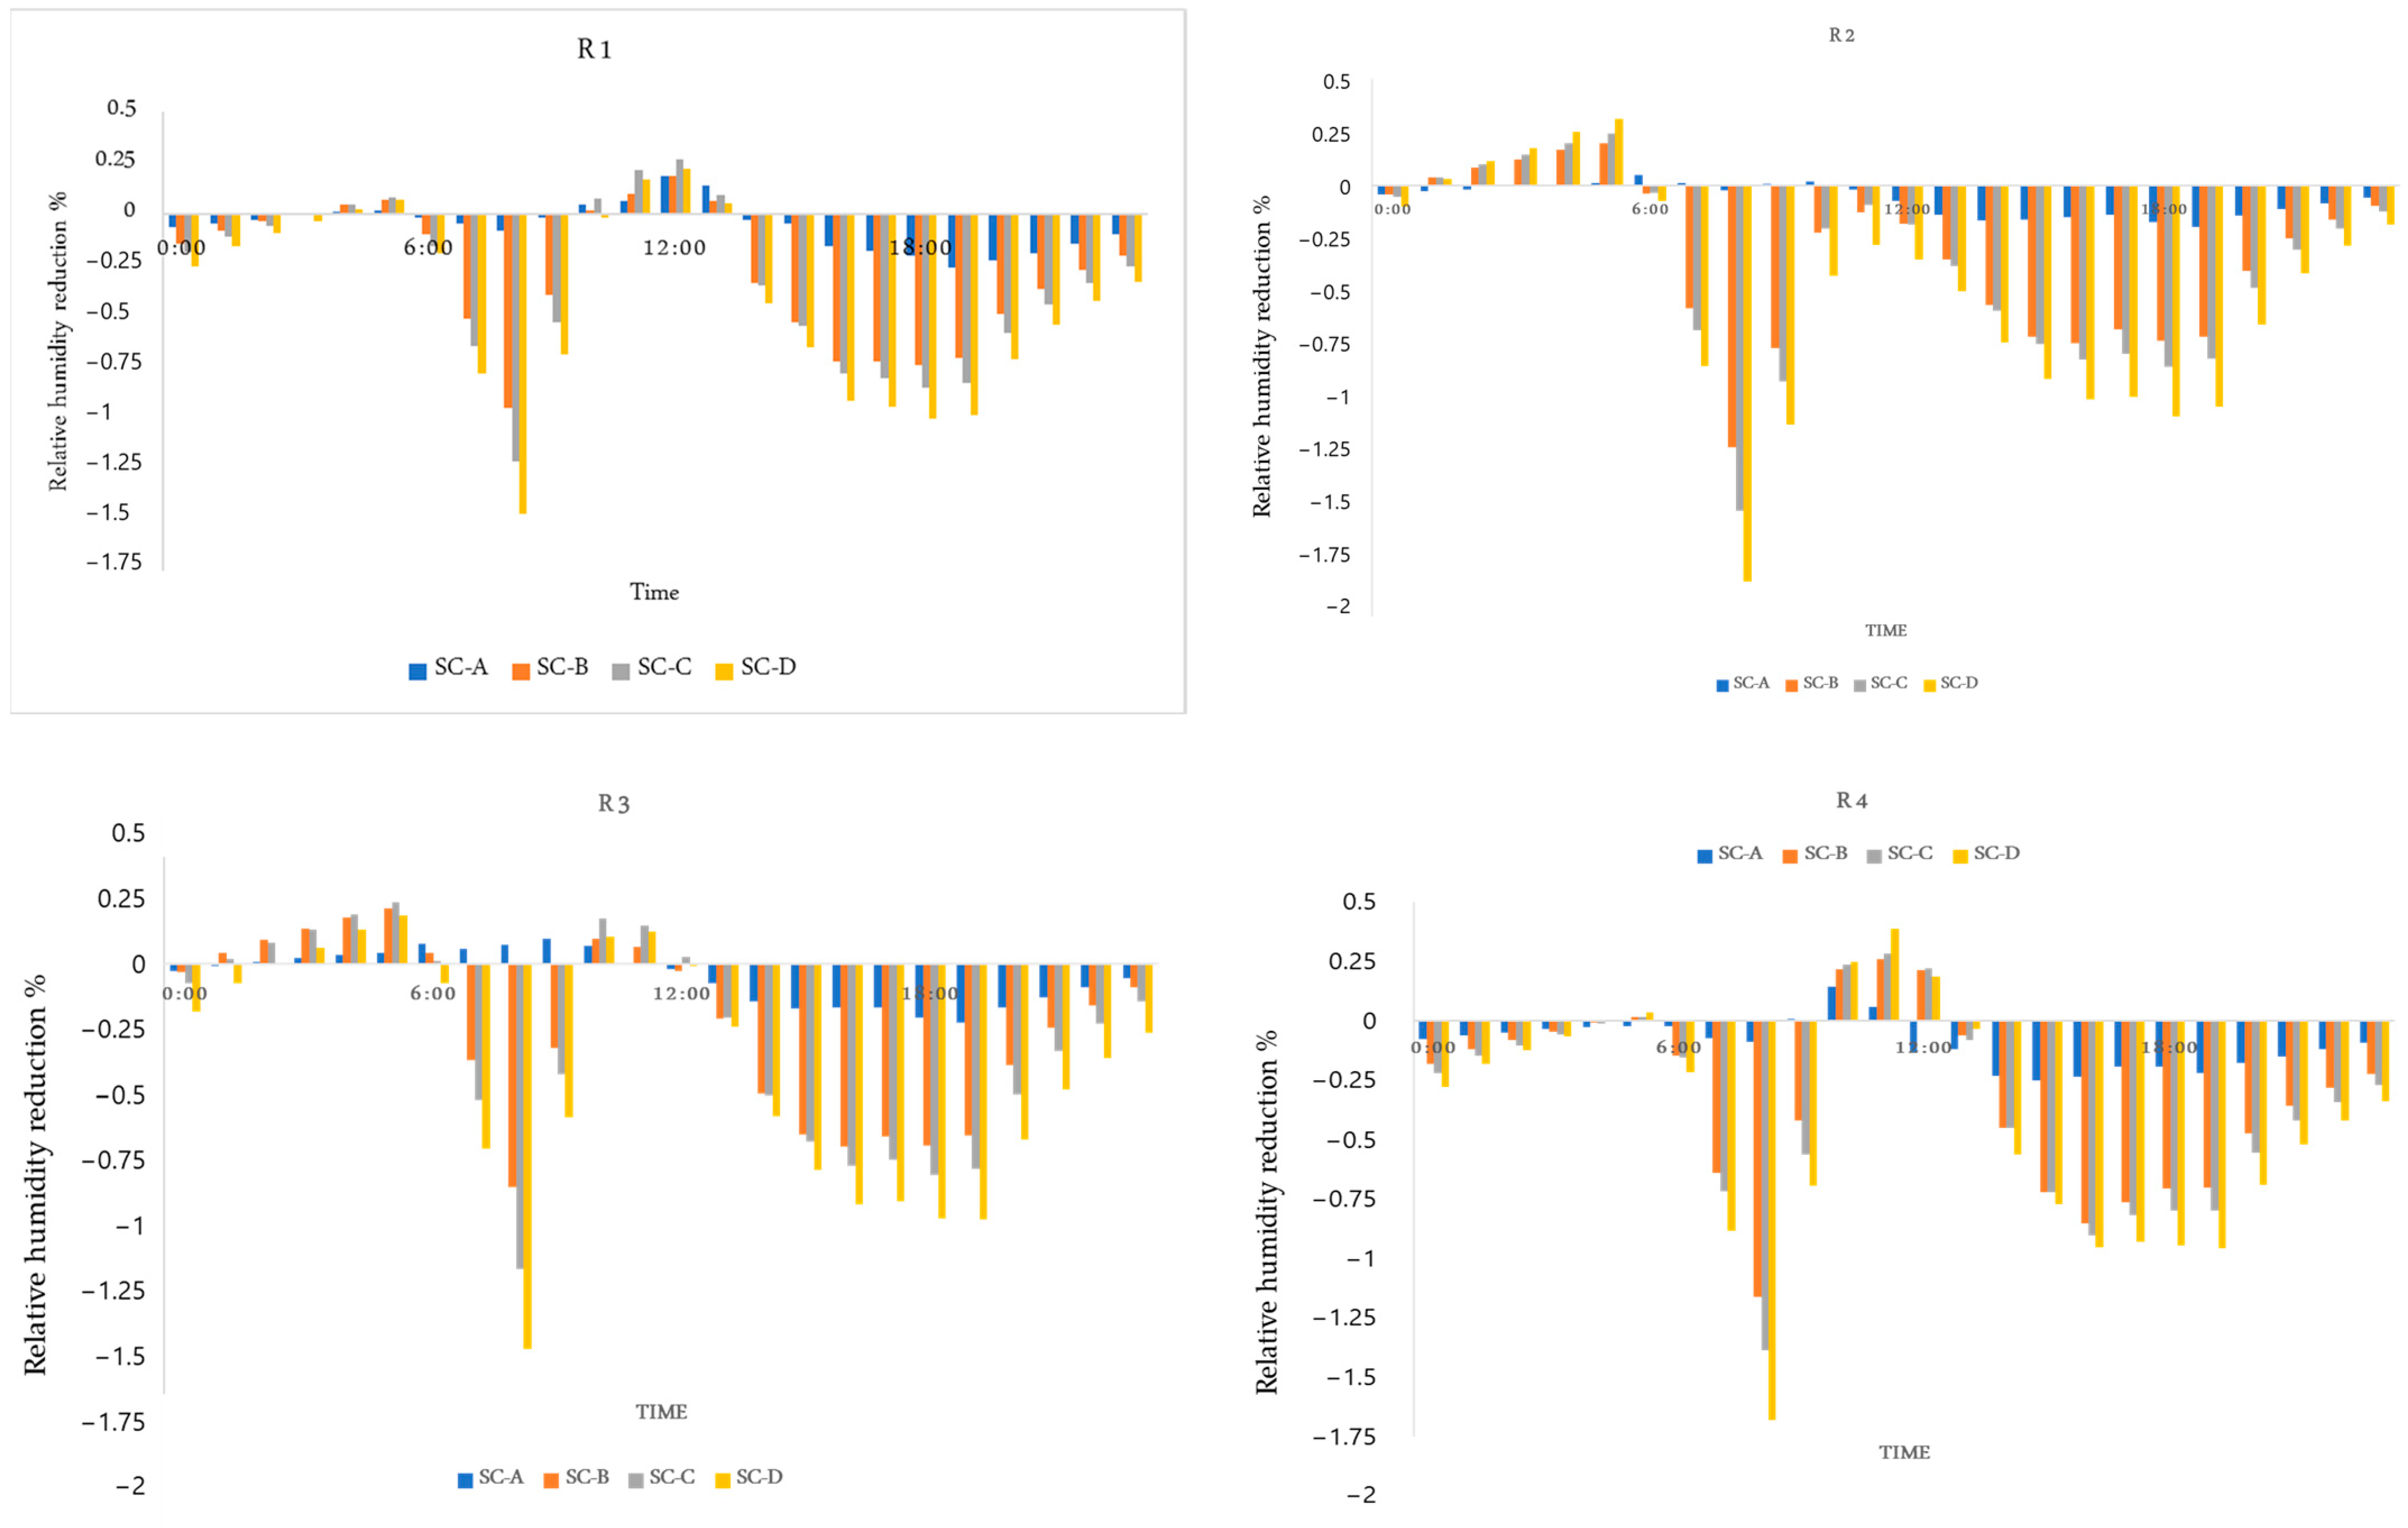
5.2. Relative Humidity
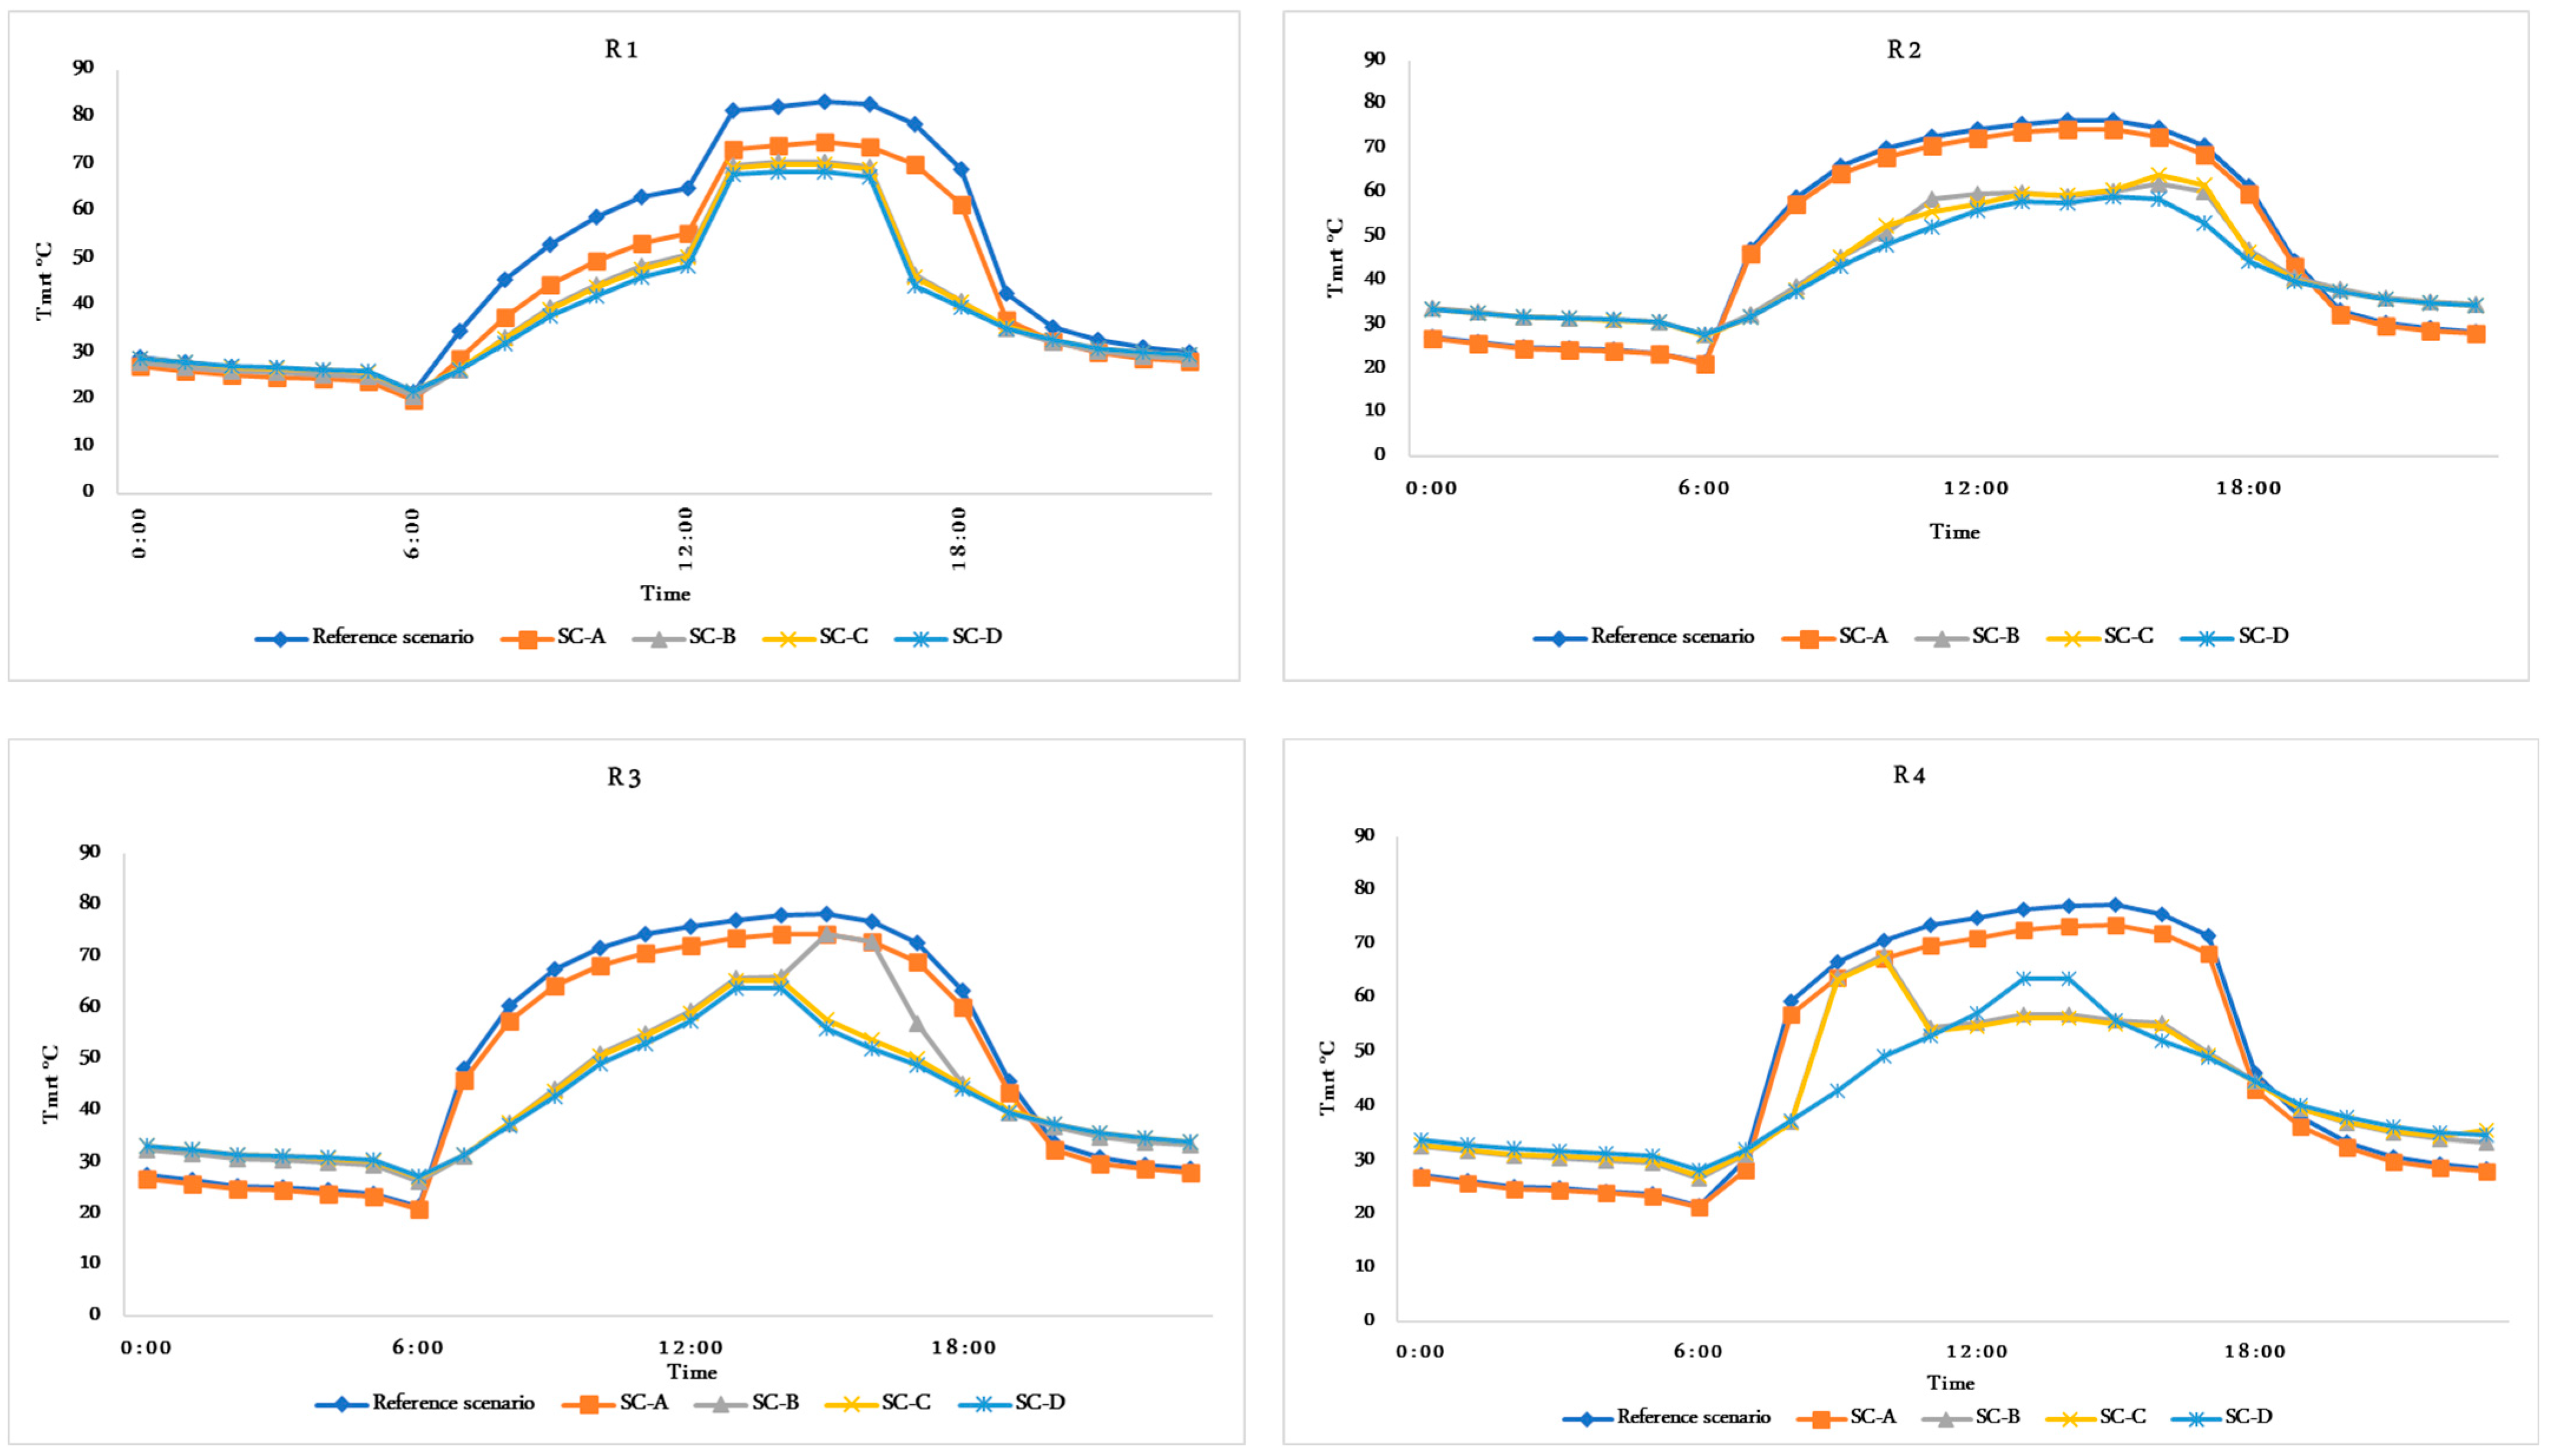
5.3. Mean Radiant Temperature (Tmrt)
5.4. Evaluating of Physiologically Equivalent Temperature (PET)
6. Discussion
7. Conclusions
Author Contributions
Funding
Institutional Review Board Statement
Informed Consent Statement
Data Availability Statement
Conflicts of Interest
References
- Roshan, G.R.; Ranjbar, F.; Orosa, J.A. Simulation of global warming effect on outdoor thermal comfort conditions. Int. J. Environ. Sci. Technol. 2010, 7, 571–580. [Google Scholar] [CrossRef]
- Mahmoud, A.R.A.; Aly, A.M.; Hassan, M.H. Evaluating the thermal performance of urban spaces in aswan city “a case study of saad zaghloul street. J. Eng. Sci. 2015, 43, 766–782. [Google Scholar] [CrossRef]
- Kim, Y.; An, S.M.; Eum, J.-H.; Woo, J.-H. Analysis of thermal environment over a small-scale landscape in a densely built-up Asian megacity. Sustainability 2016, 8, 358. [Google Scholar] [CrossRef]
- Gomaa, M.; Ragab, A. Investigating the Spatial Autocorrelation of Surface-Air Temperature for Different Ground Materials in Hot Desert Climate. Egypt. Int. J. Eng. Sci. Technol. 2022, 39, 49–59. [Google Scholar] [CrossRef]
- Taleghani, M.; Sailor, D.; Ban-Weiss, G.A. Micrometeorological simulations to predict the impacts of heat mitigation strategies on pedestrian thermal comfort in a Los Angeles neighborhood. Environ. Res. Lett. 2016, 11, 024003. [Google Scholar] [CrossRef]
- Patel, S.; Indraganti, M.; Jawarneh, R.N. A comprehensive systematic review: Impact of Land Use/Land Cover (LULC) on Land Surface Temperatures (LST) and outdoor thermal comfort. Build. Environ. 2023, 249, 111130. [Google Scholar] [CrossRef]
- Sharifi, A. Co-benefits and synergies between urban climate change mitigation and adaptation measures: A literature review. Sci. Total Environ. 2021, 750, 141642. [Google Scholar] [CrossRef] [PubMed]
- McEvoy, D.; Lindley, S.; Handley, J. Adaptation and mitigation in urban areas: Synergies and conflicts. Proc. Inst. Civ. Eng. Munic. Eng. 2006, 159, 185–191. [Google Scholar] [CrossRef]
- Mahmoud, H.; Ragab, A. Urban geometry optimization to mitigate climate change: Towards energy-efficient buildings. Sustainability 2020, 13, 27. [Google Scholar] [CrossRef]
- Abdelhafez, M.H.H.; Altaf, F.; Alshenaifi, M.; Hamdy, O.; Ragab, A. Achieving effective thermal performance of street canyons in various climatic zones. Sustainability 2022, 14, 10780. [Google Scholar] [CrossRef]
- Abdallah, A.S.H. Passive design strategies to improve student thermal comfort in Assiut University: A field study in the Faculty of Physical Education in hot season. Sustain. Cities Soc. 2022, 86, 104110. [Google Scholar] [CrossRef]
- Mahmoud, R.M.A.; Abdallah, A.S.H. Assessment of outdoor shading strategies to improve outdoor thermal comfort in school courtyards in hot and arid climates. Sustain. Cities Soc. 2022, 86, 104147. [Google Scholar] [CrossRef]
- Stocco, S.; Cantón, M.A.; Correa, E. Evaluation of design schemes for urban squares in arid climate cities, Mendoza, Argentina. In Building Simulation; Springer: Berlin/Heidelberg, Germany, 2021; Volume 14, pp. 763–777. [Google Scholar]
- Rodríguez-Algeciras, J.; Tablada, A.; Nouri, A.S.; Matzarakis, A. Assessing the influence of street configurations on human thermal conditions in open balconies in the Mediterranean climate. Urban Clim. 2021, 40, 100975. [Google Scholar] [CrossRef]
- Okumus, D.E.; Terzi, F. Evaluating the role of urban fabric on surface urban heat island: The case of Istanbul. Sustain. Cities Soc. 2021, 73, 103128. [Google Scholar] [CrossRef]
- Taleghani, M.; Kleerekoper, L.; Tenpierik, M.; Van Den Dobbelsteen, A. Outdoor thermal comfort within five different urban forms in the Netherlands. Build. Environ. 2015, 83, 65–78. [Google Scholar] [CrossRef]
- Mahmoud, H.; Ragab, A. Impact of urban geometry on cooling loads in Egypt: Case study: A social residential compound in New Aswan city. In Proceedings of the 2020 9th International Conference on Power Science and Engineering (ICPSE), London, UK, 23–25 October 2020; IEEE: Piscataway, NJ, USA; pp. 71–75. [Google Scholar]
- ISO 7730:2005; Ergonomics of the Thermal Environment—Analytical Determination and Interpretation of Thermal Comfort Using Calculation of the PMV and PPD Indices and Local Thermal Comfort Criteria. ISO: Geneva, Switzerland, 1984.
- Ribeiro, K.F.A.; Justi, A.C.A.; Novais, J.W.Z.; de Moura Santos, F.M.; Nogueira, M.C.d.J.A.; Miranda, S.A.; Marques, J.B. Calibration of the Physiological Equivalent Temperature (PET) index range for outside spaces in a tropical climate city. Urban Clim. 2022, 44, 101196. [Google Scholar] [CrossRef]
- Chen, L.; Ng, E. Simulation of the effect of downtown greenery on thermal comfort in subtropical climate using PET index: A case study in Hong Kong. Archit. Sci. Rev. 2013, 56, 297–305. [Google Scholar] [CrossRef]
- Walther, E.; Goestchel, Q. The PET comfort index: Questioning the model. Build. Environ. 2018, 137, 1–10. [Google Scholar] [CrossRef]
- Höppe, P. The physiological equivalent temperature–a universal index for the biometeorological assessment of the thermal environment. Int. J. Biometeorol. 1999, 43, 71–75. [Google Scholar] [CrossRef]
- Brosy, C.; Zaninovic, K.; Matzarakis, A. Quantification of climate tourism potential of Croatia based on measured data and regional modeling. Int. J. Biometeorol. 2014, 58, 1369–1381. [Google Scholar] [CrossRef]
- Deb, C.; Ramachandraiah, A. The significance of physiological equivalent temperature (PET) in outdoor thermal comfort studies. Int. J. Eng. Sci. Technol. 2010, 2, 2825–2828. [Google Scholar]
- Lau, K.K.-L.; Chung, S.C.; Ren, C. Outdoor thermal comfort in different urban settings of sub-tropical high-density cities: An approach of adopting local climate zone (LCZ) classification. Build. Environ. 2019, 154, 227–238. [Google Scholar] [CrossRef]
- Ragab, A.; Abdelrady, A. Impact of green roofs on energy demand for cooling in Egyptian buildings. Sustainability 2020, 12, 5729. [Google Scholar] [CrossRef]
- Akbari, H.; Matthews, H.D. Global cooling updates: Reflective roofs and pavements. Energy Build. 2012, 55, 2–6. [Google Scholar] [CrossRef]
- Rosenfeld, A.H.; Akbari, H.; Bretz, S.; Fishman, B.L.; Kurn, D.M.; Sailor, D.; Taha, H. Mitigation of urban heat islands: Materials, utility programs, updates. Energy Build. 1995, 22, 255–265. [Google Scholar] [CrossRef]
- Onyango, S.A.; Mukundi, J.B.; Ochieng’Adimo, A.; Wesonga, J.M.; Sodoudi, S. Variability of In-Situ Plant Species Effects on Microclimatic Modification in Urban Open Spaces of Nairobi, Kenya. Curr. Urban Stud. 2021, 9, 126. [Google Scholar] [CrossRef]
- Bruse, M. Modelling and strategies for improved urban climates. In Proceedings of the International Conference on Urban Climatology & International Congress of Biometeorology, Sydney, Australia, 8–12 November 1999; Citeseer: Gaithersburg, MD, USA, 1999; pp. 8–12. [Google Scholar]
- Erell, E.; Zhou, B. The effect of increasing surface cover vegetation on urban microclimate and energy demand for building heating and cooling. Build. Environ. 2022, 213, 108867. [Google Scholar] [CrossRef]
- Zhao, J.; Zhao, X.; Liang, S.; Zhou, T.; Du, X.; Xu, P.; Wu, D. Assessing the thermal contributions of urban land cover types. Landsc. Urban Plan. 2020, 204, 103927. [Google Scholar] [CrossRef]
- Chapman, S.; Thatcher, M.; Salazar, A.; Watson, J.E.; McAlpine, C.A. The effect of urban density and vegetation cover on the heat island of a subtropical city. J. Appl. Meteorol. Climatol. 2018, 57, 2531–2550. [Google Scholar] [CrossRef]
- Jim, C.Y. Effect of vegetation biomass structure on thermal performance of tropical green roof. Landsc. Ecol. Eng. 2012, 8, 173–187. [Google Scholar] [CrossRef]
- Weng, Q.; Liu, H.; Lu, D. Assessing the effects of land use and land cover patterns on thermal conditions using landscape metrics in city of Indianapolis, United States. Urban Ecosyst. 2007, 10, 203–219. [Google Scholar] [CrossRef]
- Aboelata, A.; Sodoudi, S. Evaluating the effect of trees on UHI mitigation and reduction of energy usage in different built up areas in Cairo. Build. Environ. 2020, 168, 106490. [Google Scholar] [CrossRef]
- Srivanit, M.; Hokao, K. Evaluating the cooling effects of greening for improving the outdoor thermal environment at an institutional campus in the summer. Build. Environ. 2013, 66, 158–172. [Google Scholar] [CrossRef]
- Rose, A.L. Impact of urbanization on the thermal comfort conditions in the hot humid city of Chennai, India. In Proceedings of the Recent Advances in Space Technology Services and Climate Change 2010 (RSTS & CC-2010), Chennai, India, 13–15 November 2010; pp. 262–267. [Google Scholar]
- Amirtham, L.R.; Horrison, E.; Rajkumar, S. Study on the microclimatic conditions and thermal comfort in an institutional campus in hot humid climate. In Proceedings of the 30th International PLEA Conference, Ahmedabad, India, 16–18 December 2014; pp. 16–18. [Google Scholar]
- Fahmy, M.; Sharples, S. On the development of an urban passive thermal comfort system in Cairo, Egypt. Build. Environ. 2009, 44, 1907–1916. [Google Scholar] [CrossRef]
- Dohsi, K.; Djaghrouri, D.; Benabbas, M. Effect of vegetation on outdoor thermal comfort in hot arid regions, a lesson of sustainability from the traditional Ksar of Ain Madhi, Algeria. Technium Soc. Sci. J. 2022, 38, 794. [Google Scholar] [CrossRef]
- Louafi, S.; Abdou, S.; Reiter, S. Effect of vegetation cover on thermal and visual comfort of pedestrians in urban spaces in hot and dry climate. Nat. Technol. 2017, 17, 30B. [Google Scholar]
- Roberto, B.; Barkmeijer, J.; Palmer, T.N.; David, R. Current Status and Future Developments of the ECMWF Ensemble Prediction System; ECMWF: Reading, UK, 1999. [Google Scholar]
- Onset Computer Corporation. HOBO MX1104 Data Logger Specifications. 2024. Available online: https://www.onsetcomp.com/contact/support (accessed on 14 April 2024).
- Elnabawi, M.H.; Hamza, N.; Raveendran, R. ‘Super cool roofs’: Mitigating the UHI effect and enhancing urban thermal comfort with high albedo-coated roofs. Results Eng. 2023, 19, 101269. [Google Scholar] [CrossRef]
- Kim, J.; Hong, T.; Koo, C.-W. Economic and environmental evaluation model for selecting the optimum design of green roof systems in elementary schools. Environ. Sci. Technol. 2012, 46, 8475–8483. [Google Scholar] [CrossRef] [PubMed]
- Fahmy, M.; El-Hady, H.; Mahdy, M.; Abdelalim, M.F. On the green adaptation of urban developments in Egypt; predicting community future energy efficiency using coupled outdoor-indoor simulations. Energy Build. 2017, 153, 241–261. [Google Scholar] [CrossRef]
- Tan, Z.; Lau, K.K.-L.; Ng, E. Planning strategies for roadside tree planting and outdoor comfort enhancement in subtropical high-density urban areas. Build. Environ. 2017, 120, 93–109. [Google Scholar] [CrossRef]
- Park, M.; Hagishima, A.; Tanimoto, J.; Narita, K.-i. Effect of urban vegetation on outdoor thermal environment: Field measurement at a scale model site. Build. Environ. 2012, 56, 38–46. [Google Scholar] [CrossRef]
- Wang, Y.; Bakker, F.; de Groot, R.; Wortche, H.; Leemans, R. Effects of urban trees on local outdoor microclimate: Synthesizing field measurements by numerical modelling. Urban Ecosyst. 2015, 18, 1305–1331. [Google Scholar] [CrossRef]
- Doick, K.J.; Peace, A.; Hutchings, T.R. The role of one large greenspace in mitigating London’s nocturnal urban heat island. Sci. Total Environ. 2014, 493, 662–671. [Google Scholar] [CrossRef] [PubMed]
- Akbari, H. Shade trees reduce building energy use and CO2 emissions from power plants. Environ. Pollut. 2002, 116, S119–S126. [Google Scholar] [CrossRef] [PubMed]
- Takebayashi, H.; Moriyama, M. Study on the urban heat island mitigation effect achieved by converting to grass-covered parking. Sol. Energy 2009, 83, 1211–1223. [Google Scholar] [CrossRef]
- Ghaffarianhoseini, A.; Berardi, U.; Ghaffarianhoseini, A. Thermal performance characteristics of unshaded courtyards in hot and humid climates. Build. Environ. 2015, 87, 154–168. [Google Scholar] [CrossRef]
- Mahmoud, H.; Ragab, A. Thermal Performance Evaluation of Unshaded Courtyards in Egyptian Arid Regions. Smart Sustain. Plan. Cities Reg. Results SSPCR 2021, 3, 109–121. [Google Scholar]
- Bowler, D.E.; Buyung-Ali, L.; Knight, T.M.; Pullin, A.S. Urban greening to cool towns and cities: A systematic review of the empirical evidence. Landsc. Urban Plan. 2010, 97, 147–155. [Google Scholar] [CrossRef]
- Heisler, G.M.; Grant, R.H. Ultraviolet radiation in urban ecosystems with consideration of effects on human health. Urban Ecosyst. 2000, 4, 193–229. [Google Scholar] [CrossRef]
- Freer-Smith, P.; El-Khatib, A.; Taylor, G. Capture of particulate pollution by trees: A comparison of species typical of semi-arid areas (Ficus nitida and Eucalyptus globulus) with European and North American species. Water Air Soil Pollut. 2004, 155, 173–187. [Google Scholar] [CrossRef]
- Mahdy, M.; Nikolopoulou, M.; Fahmy, M. Climate change scenarios effects on residential buildings shading strategies in Egypt. In Proceedings of the Building Simulation—Towards Sustainable Green Built Environment, Cairo, Egypt, 23–24 June 2013. [Google Scholar]


| Usage | Area | Percentage (%) |
|---|---|---|
| Built up area | 4420 | 13 |
| Streets and pedestrian area | 29,380 | 87 |
| Total areas | 33,800 | 100 |
| Parameter | Value |
|---|---|
| Grid dimension | 100 × 100 × 30 Grids dx = 3.00 m, dy = 3.00 m, Base dz = 3.00 m. |
| Core XY domain size | x = 300, y = 300 |
| Soil profile for all grids | Sandy soil for the neighborhood boundary, Loamy soil and pavement around the buildings, and asphalt for streets. |
| Floor albedo | Albedo values as follows: sandy soil 0.31, loamy soil 0.1, pavement 0.5, asphalt 0.12 |
| Material emissivity | Emissivity values as follows: sandy soil 0.85, loamy soil 0.9, pavement 0.92, asphalt 0.95 |
| Thickness of wall materials (m) | 0.02 Cement plaster, 0.25 Brick wall, and 0.02 Cement plaster |
| Façade albedo | 0.2 |
| Roof materials | Reinforced concretes thickness = 0.3 m. |
| Simulation date | 24 h on 13 August |
| Metabolic rate for persons (met) | 1.48 |
| Clothes (clo) | 0.9 |
| Start wind speed (m/s) | 2 |
| Start wind direction | 315° |
| Initial specific humidity of atmosphere (g/kg) | 8 |
| Specification | Name of Tree | ||
|---|---|---|---|
| Cassia leptophylla | Cassia nodosa | Ficus nitida | |
 |  |  | |
| Total tree height | 12 m | 5 m | 3 m |
| Maximum LAD height | 9 m | 4 m | 2 m |
| Foliage height | 8 m | 3 m | 2 m |
| LAI | 3.185 | 3.499 | 3.986 |
| Albedo | 0.085 | 0.085 | 0.09 |
| Name | Description | Two-Dimensional Site Plan for Simulated Scenarios | Three-Dimensional Site Plan for Simulated Scenarios | |
|---|---|---|---|---|
| Grass Percentage (%) | Trees Percentage (%) | |||
| Reference scenario | 0% | 0% |  |  |
| Sc-A | 50% | 0% |  |  |
| Sc-B | 50% | 25% |  |  |
| Sc-C | 50% | 50% |  |  |
| Sc-D | 50% | 75% |  |  |
| Two-Dimensional Site Plan | Side View |
|---|---|
 |  |
 |  |
 |  |
 | 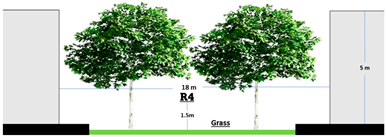 |
| Scenarios | Hours | Key | |||
|---|---|---|---|---|---|
| 11:00 a.m. | 1:00 p.m. | 3:00 p.m. | 5:00 p.m. | ||
Reference Scenario |  |   | |||
| SC-A | |||||
| SC-B | |||||
| SC-C | |||||
| SC-D | |||||
Disclaimer/Publisher’s Note: The statements, opinions and data contained in all publications are solely those of the individual author(s) and contributor(s) and not of MDPI and/or the editor(s). MDPI and/or the editor(s) disclaim responsibility for any injury to people or property resulting from any ideas, methods, instructions or products referred to in the content. |
© 2024 by the authors. Licensee MDPI, Basel, Switzerland. This article is an open access article distributed under the terms and conditions of the Creative Commons Attribution (CC BY) license (https://creativecommons.org/licenses/by/4.0/).
Share and Cite
Gomaa, M.M.; El Menshawy, A.; Nabil, J.; Ragab, A. Investigating the Impact of Various Vegetation Scenarios on Outdoor Thermal Comfort in Low-Density Residential Areas of Hot Arid Regions. Sustainability 2024, 16, 3995. https://doi.org/10.3390/su16103995
Gomaa MM, El Menshawy A, Nabil J, Ragab A. Investigating the Impact of Various Vegetation Scenarios on Outdoor Thermal Comfort in Low-Density Residential Areas of Hot Arid Regions. Sustainability. 2024; 16(10):3995. https://doi.org/10.3390/su16103995
Chicago/Turabian StyleGomaa, Mohammed M., Adel El Menshawy, Jackline Nabil, and Ayman Ragab. 2024. "Investigating the Impact of Various Vegetation Scenarios on Outdoor Thermal Comfort in Low-Density Residential Areas of Hot Arid Regions" Sustainability 16, no. 10: 3995. https://doi.org/10.3390/su16103995