
Effects of Soils on Environmental Stability of Spent Mg-Based and Ca-Based Adsorbents Containing Arsenite

Geological Survey of Japan, National Institute of Advanced Industrial Science and Technology (AIST), Central 7, 1-1-1 Higashi, Tsukuba 305-8567, Japan
*
Author to whom correspondence should be addressed.
Sustainability 2024, 16(10), 4008; https://doi.org/10.3390/su16104008
Submission received: 18 March 2024
/
Revised: 4 May 2024
/
Accepted: 9 May 2024
/
Published: 10 May 2024
(This article belongs to the Section Pollution Prevention, Mitigation and Sustainability)
Abstract
:Spent adsorbents used in As removal treatment may re-leach As. In this study, the effects of soil on spent Mg-based and Ca-based adsorbents were investigated. The spent adsorbents containing arsenite (As(III)) were prepared by adsorbing As(III) on MgO, Mg(OH)2, CaO, and Ca(OH)2 powder reagents. Kuroboku soil (Ku), yellow-brown forest soil (YF), Kanuma soil (Ka), river sand (RS), and mountain sand (MS) were used as soil samples. The As leaching ratio was examined in coexistence with soil via shaking tests, and the results were compared with those of a previous study on adsorbents containing arsenate (As(V)). The environmental stability of the spent adsorbents was found to vary greatly depending on the combination of the As valence, adsorbent type, and soil type. However, regardless of the adsorbent or soil type, the spent adsorbents containing As(III) were more likely to leach As than those containing As(V). Additionally, the As leaching ratio was generally lower in Ku and YF and higher in Ka, RS, and MS. For environmentally friendly and sustainable As removal treatment, disposal, and management, the selection of MgO as the adsorbent and treatment involving the oxidation treatment of As(III) to As(V) before adsorbing As onto adsorbents are recommended.
1. Introduction
Arsenic (As) is generally widely known as an element with extremely high toxicity to the human body. The World Health Organization (WHO) has set a provisional value for As at 0.01 mg/L in its guidelines for drinking water quality [1]. The As contamination of groundwater occurs in many parts of the world, mainly in Asia [2,3,4,5,6,7,8,9,10,11,12,13,14,15,16,17,18,19], Latin America [20,21,22,23,24], and Africa [25,26]. In some areas of these developing areas, many people directly use As-contaminated groundwater (well water) for drinking, resulting in significant health damage. Therefore, the purification of As-contaminated water is essential.
Typical purification methods for As-contaminated water have been introduced by Jadhav et al. [27], Sarkar and Paul [28], Ghosh et al. [29], and Kumar et al. [30], including co-precipitation methods, ion-exchange methods, adsorption methods, microfiltration methods, oxidation methods, and electrocoagulation methods. In developing countries, As treatment methods using inexpensive adsorbents may be recommended owing to economic and operational conditions. Among the adsorbents, Mg-based and Ca-based adsorbents are particularly suitable for arsenic removal [31,32,33,34,35,36,37,38]. Mg and Ca are unlikely to have any negative effects on the human body or the ecosystem. Therefore, both Mg-based and Ca-based adsorbents can be recommended as environmentally friendly and sustainable adsorbents.
However, the spent adsorbents recovered after being used in As-purification processes end up as As-rich waste. Therefore, the spent adsorbents need to be recovered, treated, and managed appropriately. If the spent adsorbents are not appropriately treated or dumped untreated, they could re-leach As, causing secondary environmental contamination. Sugita et al. [39] examined the environmental stability of spent Mg-based and Ca-based adsorbents in coexistence with soil; the spent adsorbents were prepared by adsorbing arsenate, As(V); the effects of soil on As leaching from the spent adsorbents were evaluated via leaching tests. They found that the spent adsorbents based on MgO and Mg(OH)2 exhibited high environmental stability because the As leaching ratios for all soil samples were low. Furthermore, a high risk of secondary environmental pollution was suggested owing to As re-leaching under sandy soil conditions. The aforementioned study focused only on As(V), and no similar study on arsenite, As(III), has been conducted thus far. As(III) is known to be more toxic than As(V); therefore, the leaching of As(III) from the spent adsorbents containing As(III) would cause serious environmental issues.
To bridge this knowledge gap, in this study, spent Mg- and Ca-based adsorbents containing As(III) were studied, and leaching tests with soils were performed. In these tests, the leaching behaviors of As, Mg, and Ca from the spent adsorbents was investigated. Subsequently, the effects of soil on the environmental stability of spent Mg-based and Ca-based adsorbents with As(III) were evaluated. Additionally, by comparing the data for the As(III) obtained in this study and for As(V) presented in a previous study [39], more environmentally friendly adsorbent selection and sustainable processing methods were suggested.
2. Materials and Methods
The reagents used in this study were purchased from FUJIFILM Wako Pure Chemical Corporation (formerly Wako Pure Chemical Industries, Ltd., 3-1-2 Doshomachi, Chuo-ku, Osaka, Japan), unless specified otherwise.
2.1. Adsorbents
In this study, two types of commercially available Mg reagents, MgO and Mg(OH)2, and Ca reagents, CaO and Ca(OH)2, were used as Mg- and Ca-based adsorbents, respectively. The purity (nominal) P (%), median particle size Dp50 (μm), Brunauer–Emmett–Teller (BET) surface area SBET (m2/g), and Mg content αMg (%) or Ca content αCa (%) of these adsorbents are shown in Table 1. The data in Table 1 were taken from Sugita et al. [39].
2.2. Synthetic As-Contaminated Water
A powdered reagent of sodium arsenite (NaAsO2, 90%) was dissolved in ion-exchange water, and a stock solution of As(III) (2000 mg-As/L) was prepared. A portion of each stock solution was diluted with ion-exchange water to prepare a 20 mg As/L solution. These solutions used synthetic As-contaminated water whose pH had been adjusted to near neutral by adding hydrochloric acid (HCl).
2.3. Preparation of Spent Adsorbents
Each unspent adsorbent (1 g) was weighed into a TPX beaker, and synthetic As-contaminated water (0.2 L) was added to the beaker and stirred with a magnetic stirrer at approximately 500 rpm for approximately 24 h. Then, suction filtration was performed using a Teflon filter (pore size of 0.45 μm). The concentrations of As, Mg, and Ca in each filtrate were measured using inductively coupled plasma–mass spectrometry (ICP–MS) (7700X, Agilent Technologies, Inc., Santa Clara, CA, USA, or ICPM-8500, Shimadzu Co., Kyoto, Japan) and ICP–atomic emission spectrometry (ICP–AES) (SII SPS3500DD, Seiko Instruments Inc., Chiba, Japan). The calculation methods applied to determine data pertaining to each filtrate were similar to those employed in previous studies [39,40,41].
Table 2 lists the data in relation to the production of four types of spent adsorbents containing As(III); WAD (g) is the amount of unspent adsorbent added to the synthetic As-contaminated water. V is the liquid volume (L) of the synthetic As-contaminated water. WAD/V is the amount of the unspent adsorbent added per unit volume of As-contaminated water (g/L). pH0 is the pH of the solution immediately before adding the adsorbent, which is referred to as the initial pH. CAS0 is the initial As concentration (mg/L) of the As-contaminated water, CAS is the As concentration of the filtrate, and RAS is the As removal ratio, which was calculated as follows:
RAS = (CAS0 − CAS)/CAS0 × 100.
CMg and CCa in Table 2 refer to the Mg and Ca concentrations in the filtrate (mg/L), respectively, and βMg and βCa are the Mg and Ca leaching ratios (%), respectively, which are defined by the following equation:
where CX is CMg or CCa, αX is αMg or αCa, and βX is βMg or βCa. Note that in Equation (2), WAD/V is multiplied times 1000 to make the units match.
βX = CX/((WAD/V) × 1000 × αX/100) × 100
The adsorbents containing As collected by the solid–liquid separation operation were dried at ~40 °C for approximately half a day in a constant-temperature dryer and then stored in a closed polypropylene bottle. The adsorbents containing As were used as “spent adsorbents” in the leaching tests, as described later. The calculation method of the As content of the spent adsorbents is outlined below.
The residual ratio of adsorbent γ (%) is defined by the following equation:
γ = 100 − βX.
The amount of As adsorbed per unit mass of the adsorbent remaining as solid δAS (mg As/g) was calculated using the following equation:
δAS = (CAS0 − CAS)/(WAD/V × γ/100).
The weighed value of a spent adsorbent was taken as the total value of the adsorbent and As adsorbed onto its surface. Then, the As content was determined per unit mass of the recovered spent adsorbent QAS (mg As/g) was determined using the following equation:
QAS = δAS/(1 + δAS/1000).
In this study, δAS ≈ QAS was assumed, because δAS << 1000. The main reason that the QAS values of the spent Ca-based adsorbents were higher than those of the spent Mg-based adsorbents is the difference in βX. The values of QAS in Table 2 were used to calculate the leaching ratio of As from each spent adsorbent, as described later.
2.4. Soils
The following soils were selected for the leaching tests as representative of the soil characteristics of main Japanese soil types.
- Kuroboku soil (Ku) is Andosols-type distinguished by the chemical properties of aluminum such as aluminum–humus complexes; volcanic ash soils rich in organic components and particularly common in Japan.
- Yellow-brown forest soil (YF) is a slightly acidic and inorganic volcanic ash soil.
- Kanuma soil (Ka) is an acidic soil formed from weathered pumice. It is high in allophane, which is a type of clay mineral made of hydrated aluminosilicate.
- River sand (RS) is a sandy soil with a high silica content and an alkaline pH.
- Mountain sand (MS) is a sandy soil with a high iron content and an alkaline pH.
The chemical compositions of the soils and water content (adsorbed and structured waters) were described in Sugita et al. [39]. Additionally, the experimental condition with no soil is denoted as NS.
The soil samples were sieved to a particle size of 0.5–2 mm for the leaching tests.
2.5. Leaching Tests (Shaking Tests)
Two types of water solvents were prepared with hydrochloric acid to simulate acid rain: ion-exchange water adjusted to approximately pH 7 and pH 4. Next, 0.08 g of spent adsorbent and 4 g of soil were weighed into a 50 mL centrifuge tube, 40 mL of the abovementioned water solvent was added, and the tube was sealed. The tube was shaken in a thermostatic shaker for 24 h (approximately 150–180 rpm, room temperature), followed by centrifugation for solid–liquid separation (4500 rpm, 20 min). The supernatant was filtered using a syringe filter (0.45 μm), and the filtrate (leachate) was collected in a polypropylene bottle. The As, Mg, and Ca concentrations in the leachate were determined using ICP–MS and ICP–AES. Si and Fe were also measured in most of the leachates. Additionally, shaking tests with only-water solvent (without the spent adsorbent and soil) were conducted to check the change in solvent pH due to shaking. Leaching tests with only water solvent and soil (without the spent adsorbent) were also performed to check the pH of the leachate in the presence of only soil.
3. Results
3.1. pH of Leachate
The pH values of the leachate (pHf) obtained from the leaching tests in this study are shown in Figure 1, where “Blank” refers to the leaching tests (or the shaking tests) without the spent adsorbent. As shown in Figure 1, almost no difference in pHf was observed with variation in pH0, except for the Blank in the NS case (the shaking test with only water as a solvent). Therefore, under these test conditions, pHf was influenced by the type of soil and adsorbent more than by pH0. In the leaching tests with only spent adsorbent without soil (NS), the pHf values for the Ca-based adsorbents were higher than those for the Mg-based adsorbents, with pHf following the order of Mg(OH)2 ≤ MgO < CaO ≈ Ca(OH)2. In the leaching tests with only soil without spent adsorbent (Blank), the magnitude order of pHf was Ku < YF < Ka < RS < MS. Moreover, in the leaching tests with both spent adsorbent and soil, pHf followed the order of Ku, YF, Ka < RS, MS, regardless of the type of the spent adsorbent.
3.2. As Concentration in Leachate
The As concentrations in the leachate, CAS (mg/L), obtained from the leaching tests in this study are shown in Figure 2.
In the leachate from only soil without the spent adsorbent, a small amount of As was evident only in the leachate in RS (approximately 0.001 mg/L); no As was detected in the leachates of the other soils. For the spent adsorbents containing As(III), no significant difference in CAS due to pH0 was observed (Figure 2). Focusing on each soil in Figure 2, CAS follows the order MgO << Mg(OH)2 ≈ Ca(OH)2 ≈ CaO in Ku; MgO < Ca(OH)2 ≤ Mg(OH)2, CaO in YF; MgO < Mg(OH)2 << Ca(OH)2 < CaO in NS and Ka; and MgO << Ca(OH)2 < Mg(OH)2 < CaO in RS and MS. Focusing on each spent adsorbent in Figure 2, CAS follows the order YF < Ku ≤ MS < Ka < RS < NS for MgO; YF < Ka < Ku ≤ NS ≤ RS ≤ MS for Mg(OH)2; YF < Ku < RS < MS < Ka < NS for CaO; and YF < RS ≤ Ku ≤ MS < Ka < NS for Ca(OH)2.
3.3. Mg Concentration in Leachate
The Mg concentrations in the leachate, CMg (mg/L), obtained from the leaching tests in this study are shown in Figure 3. The CMg values for the spent Ca-based adsorbents are not included in this figure because they were not measured.
In the leaching tests without spent adsorbent (Blank), the CMg values were approximately 2 mg/L in Ku and less than 1 mg/L in the other soils. These values were significantly lower than those observed for the spent Mg-based adsorbents. Therefore, it could be concluded that most of the Mg ions detected in the leachate were derived from the Mg-based adsorbents. In Figure 3, some differences exist in CMg between pH0 = 4 and 7 in some cases, but no significant difference is apparent for most cases. Therefore, the effects of pH0 on CMg seem to be relatively weak, similar to those of pHf. Furthermore, in Figure 3, comparing the CMg values among the NS cases, Mg(OH)2 < MgO, and this tendency is different from the abovementioned tendency of CAS. Additionally, the CMg values obtained from testing the different soil types follow the order Ka, RS, MS ≤ NS << YF < Ku.
3.4. Ca Concentration in Leachate
The Ca concentrations in the leachate, CCa (mg/L), obtained from the leaching tests in this study are shown in Figure 4. The CCa values for the spent Mg-based adsorbents are not included in this figure because they were not measured.
In the leaching tests without the spent adsorbent (Blank), the CCa values were approximately 9 mg/L in Ku and less than 3 mg/L in the other soils. These values were much lower than those in the leaching tests with the spent Ca-based adsorbents. Therefore, it could be concluded that most of the Ca ions detected in the leachate derived from the Ca-based adsorbents. For the spent adsorbents containing As(III), as shown in Figure 4, a slight difference existed in CCa between pH0 = 7 and 4.
3.5. Si Concentration in Leachate
The Si concentrations in the leachate, CSi (mg/L), obtained from the leaching tests in this study are shown in Figure 5.
No difference in CSi was observed depending on pH0, similar to CAS, CMg, and CCa. Comparing the data in the leaching tests with only soil without the spent adsorbent, CSi followed the order MS < RS < Ku < YF < Ka. In the leaching tests with both spent Mg-based adsorbent and soil, CSi followed the order MgO < Mg(OH)2 among the Mg-based adsorbents and Ku < YF < MS ≤ RS < Ka among the soils. Additionally, in RS and MS, the CSi values were higher when the spent Mg(OH)2 adsorbent and soil coexisted than in the only-soil case. However, the CSi values in all the soils were lower when the Ca-based adsorbent and soil coexisted than in the only-soil case, and CSi followed the order Ku < YF < RS ≈ MS < Ka. Additionally, a slight difference in CSi existed between CaO and Ca(OH)2. Furthermore, comparisons between the different spent adsorbents revealed that CSi followed the order MgO < CaO ≈ Ca(OH)2 < Mg(OH)2.
3.6. Fe Concentration in Leachate
The Fe concentration in the leachate, CFe (mg/L), was measured in all tests. In the leaching tests with only soil without the spent adsorbent, Fe was detected only in RS and MS (0.10–0.24 mg/L). In the leaching tests with both spent adsorbent and soil, most of the CFe values for Ka were slightly over 0.01 mg/L, whereas those for the other soils were significantly below 0.01 mg/L.
4. Discussion
4.1. As Leaching Ratio
In this study, the As leaching ratio, EAS (%), was calculated as follows:
where the additional concentration of the spent adsorbent in the leaching tests was WSP/V (g/L).
EAS = CAS/(QAS × WSP/V) × 100
The EAS values obtained from the above equation are shown in Figure 6 for each spent adsorbent type and initial pH value.
EAS followed various orders depending on the soil type: MgO < Ca(OH)2 ≤ CaO < Mg(OH)2 for Ku and YF; MgO < Mg(OH)2 < Ca(OH)2 < CaO for Ka; MgO < Ca(OH)2 < Mg(OH)2 < CaO for RS and MS. Although the ease of leaching As from the adsorbent differed depending on soil type, Figure 6 demonstrates that the spent MgO adsorbent had the lowest EAS value for all soils.
Additionally, overall, the EAS values shown in Figure 6 are clearly higher than for those containing As(V) reported in a previous study [39]. Therefore, the risk of As leaching in soil is higher for spent adsorbents containing As(III) than for those containing As(V). From the above results, it can be concluded that the environmental stability of spent adsorbents largely depends on the As valence as well as the type of adsorbent and soil.
4.2. Dissolved Forms of As in Leachate
The As(III) in the spent Mg- and Ca-based adsorbents is presumed to be adsorbed (immobilized) on the solid surface as “Solid-Mg-O-As(OH)2” and “Solid-Ca-O-As(OH)2”, respectively [40,41]. In addition, the reactions in which As(III) is desorbed from the adsorbent surface in a neutral or an alkaline solution are expressed by the following equations.
For the Mg-based adsorbents:
Solid-Mg-O-As(OH)2 + H2O → Solid-Mg-OH + As(OH)3
Solid-Mg-O-As(OH)2 + OH− → Solid-Mg-OH + As(OH)2O−.
For the Ca-based adsorbents:
Solid-Ca-O-As(OH)2 + H2O → Solid-Ca-OH + As(OH)3
Solid-Ca-O-As(OH)2 + OH− → Solid-Ca-OH + As(OH)2O−.
The dissolved forms of As(III) leached from the spent adsorbent containing As(III) are represented by the following dissociation reactions for arsenous acid:
where the acid dissociation constants of arsenous acid are pKa1 = 9.1, pKa2 = 12.1, and pKa3 = 13.4 (25 °C) [42], and the abundances of the dissolved arsenous acid species are determined by the following:
H3AsO3 ←→ H2AsO3− + H+
H2AsO3− ←→ HAsO32− + H+
HAsO32− ←→ AsO33− + H+
[H2AsO3−]/[H3AsO3] = 10 exp(pHf − pKa1)
[HAsO32−]/[H2AsO3−] = 10 exp(pHf − pKa2)
[AsO33−]/[HAsO32−] = 10 exp(pHf − pKa3).
The main dissolved forms in each leachate estimated using the above equations are shown in Table 3. No classification based on pH0 is included in Table 3 because a slight difference in pHf was observed between pH0 = 7 and 4, indicating a small difference in the abundance ratio among arsenous acid species based on pHf. In addition, when two forms are listed in a column, the one on the left is dominant.
As shown in Table 3, for Blank, the main dissolved form of arsenite in all leachates is estimated to be H3AsO3. Also, in Ku, the main dissolved form is estimated to be H3AsO3, regardless of the type of the spent adsorbent. In YF, the main dissolved form is H3AsO3 for the spent Mg-based adsorbents; in addition to H3AsO3, H2AsO3− is estimated to be present in non-negligible amounts for the spent Ca-based adsorbents. In Ka, the main dissolved form is estimated to be H3AsO3 for Mg(OH)2, whereas more H2AsO3− than H3AsO3 is present for MgO, CaO, and Ca(OH)2. In both RS and MS, the main dissolved form is estimated to be H2AsO3− for the spent Mg-based adsorbents, and more HAsO32− than H2AsO3− is present for the Ca-based adsorbents.
4.3. Mg and Ca Leaching Ratios
In this study, the Mg and Ca leaching ratios, EMg (%) and ECa (%), were calculated as follows:
where EX is EMg or ECa.
EX = CX/((WSP/V) × 1000 × αX/100) × 100
Equation (17) is essentially the same as Equation (2). The EMg and ECa values obtained from Equation (17) for each adsorbent type and initial pH value are shown in Figure 7a,b, respectively.
The EMg vales in NS were clearly higher than those in Ku and YF, being almost equal to those in RS and MS. In Ka, the EMg values were comparable to those in NS. Moreover, as shown in Figure 7b, the ECa values were slightly lower in RS and MS than in NS but were significantly lower in Ku, YF, and Ka than in NS. Both EMg and ECa were the lowest in YF.
The residual ratio of each spent adsorbent after the leaching test was calculated by subtracting each value of EMg or ECa from 100. In all the soils tested in this study, the residual ratios of the spent Mg-based adsorbents were over 96%. However, although the residual ratios of the Ca-based adsorbents reached over 93% in Ku, YF, and Ka, they were less than ≈ 60% in RS and MS. Therefore, the environmental stability of spent Ca-based adsorbents was significantly reduced in sandy soils.
4.4. Effects of Silicic Acid Leached from Soils
In the only-soil leaching tests without the spent adsorbent (Blank at pH0 = 7), Si components of more than 1.7 mg/L were leached from the soil in all soils, as shown in Figure 5. Although Si was not measured during the leaching test with only soil without the spent adsorbent at pH0 = 4 (Blank at pH0 = 4), Si components were expected to be leached to the same extent as in the Blank at pH0 = 7. Previous studies have reported that the leaching behavior of As from spent Mg- and Ca-based adsorbents can be significantly influenced by the Si components present in a solvent [40,41]. These reports revealed that the presence of silicic acid slightly decreases the As leaching amount for spent Mg-based adsorbents containing As(III) [41]. They also reported that, for spent Ca-based adsorbents, the As leaching amount decreased with increasing initial silicic acid concentration [40].
In this study, to examine the effects of the Si components (silicic acid species) leached from soil, the CSi value for the Blank (without adsorbent) in each soil was defined as the hypothetical initial Si concentration, CSi0. In addition, due to the lack of CSi data for the Blank at pH0 = 4 in this study, only data at pH0 = 7 were considered in this study. CSi0 increased in the order NS < MS ≤ RS < Ku < YF << Ka. The EAS values obtained from each leaching test are plotted in Figure 8 against CSi0 for each soil. Figure 8a,b correspond to the spent Mg- and Ca-based adsorbents, respectively.
As shown in Figure 8a, for As(III)-Mg(OH)2, the EAS values of MS and RS were slightly higher than that of NS, whereas the values in Ku, YF, and Ka were lower than that of NS. In particular, the EAS value of YF was approximately one-fifth of that of NS, which is extremely low. Additionally, for As(III)-MgO, the EAS values in all soils were lower than that in NS. The above findings demonstrate that for the Mg-based adsorbent containing As(III), the presence of silicic acid tended to lower EAS overall, except in the cases of RS and MS for Mg(OH)2. According to the above, for As(III)-MgO and As(III)-Mg(OH)2, the effects of CSi0 on EAS in the presence of soil in this study are in agreement with previous reports using silicic acid solutions [41].
As shown in Figure 8b, for the spent Ca-based adsorbents, EAS tended to decrease as CSi0 increases, except in the plots of Ka. The EAS values in Ka are slightly lower than those in NS for the spent Ca-based adsorbents containing As(III). Therefore, for the spent Ca-based adsorbents containing As(III), except for the Ka data, the effects of CSi0 on EAS in the presence of soil in this study are in agreement with those reported in previous studies [40]. Additionally, Ca(OH)2 evidently has higher environmental stability than CaO, because overall the EAS values were lower for Ca(OH)2 than for CaO. Furthermore, based on the test results, it seems reasonable to assume that the spent Ca-based adsorbents reduced the EAS when coexisting with soil.
The results of this study demonstrate that, with the exception of some data, the As leaching from spent adsorbents is more likely to be reduced when the spent adsorbents coexist with soils than when soils are not present. This result introduces several possibilities, including (i) readsorption of As onto the spent adsorbent, (ii) adsorption of As onto the soil, (iii) incorporation of As in the process in which the Mg or Ca ions leached from the base material of the adsorbents produce magnesium or calcium hydroxide, and (iv) the incorporation of As in the process in which the silicic acid ions react with Mg or Ca ions leached from the base material of the adsorbent to produce magnesium or calcium silicate.
To verify these hypotheses, similar to previous studies [40,41], stoichiometric considerations were made using the values obtained by converting the mass-based concentration CX (mg/L) to the molar-based concentration MX (mmol/L). Thus, CSi in mg/L converted to molar units is denoted as MSi, mmol/L. The value of CSi for the Blank is denoted as MSi0. The difference between MSi0 and MSi, MSi0–MSi, is denoted as ΔMSi. The ΔMSi value is assumed to be the amount consumed for the formation of silicates or the adsorption on the spent adsorbent surface. Similarly, CMg, CCa, and CAS in mg/L converted to molar units are denoted as MMg, MCa, in MAS in mmol/L, respectively. Mg, Ca, and As may be leached from both the spent adsorbent and soil. Therefore, the values of MMg, MCa, and MAS for the Blank are denoted as MMg(Blank), MCa(Blank), and MAS(Blank), respectively, and their values in NS are denoted as MMg(NS), MCa(NS), and MAS(NS), respectively. Furthermore, MMg(NS)+MMg(Blank), MCa(NS)+MCa(Blank), and MAS(NS)+MAS(Blank) are denoted as MMg0, MCa0, and MAS0, respectively. MMg0–MMg and MCa0–MCa are denoted as ΔMMg and ΔMCa, respectively. ΔMMg and ΔMCa are assumed to correspond to the amounts consumed in their silicate formation and directly adsorbed on the soil. Also, ΔMMg and ΔMCa do not to include the amount readsorbed onto the spent adsorbents and the amount consumed due to Mg and Ca hydroxide formation, because ΔMMg and ΔMCa are the values obtained by subtracting MMg(NS) and MCa(NS), respectively. MAS0–MAS is denoted as ΔMAS. ΔMAS is assumed to correspond to the amounts incorporated in the process of forming Mg and Ca silicates and directly adsorbed on the soil. Furthermore, ΔMAS does not to include the amount readsorbed onto the spent adsorbents and the amount incorporated in the process of forming Mg or Ca hydroxides, because ΔMAS is the value obtained by subtracting MAS(NS).
In some cases, the ΔMSi, ΔMMg, and ΔMAS values obtained in this study were negative. A negative value of ΔMSi suggests that the amount of Si leached from the soil increases when it coexists with the spent adsorbent in relation to when only the soil is present. Negative values of ΔMMg and ΔMAS indicate that the amount of Mg and As leached from the spent adsorbent increased when it coexisted with the soil in relation to those when only the spent adsorbent was present. Moreover, ΔMCa never takes a negative value, regardless of the soil type.
Figure 9a,b show the plots of ΔMMg for the spent Mg-based adsorbents and ΔMCa for the spent Ca-based adsorbents against ΔMSi, respectively.
If the decreases in Si, Mg, and Ca in the presence of soil were caused only by the formation of magnesium silicate or calcium silicate species, positive correlations should be observed between ΔMSi and ΔMMg or ΔMCa in Figure 9. As shown in Figure 9a, for Ku and YF, a weak positive correlation appears, but both ΔMSi and ΔMMg have negative values. Thus, the leaching amounts of both Si and Mg increased. For Ka, RS, and MS, no regular trend was observed in the fluctuation in ΔMMg with respect to that in ΔMSi. In Figure 9b, no regular trend exists in the fluctuation in ΔMCa with respect to that in ΔMSi. In both Figure 9a,b, no regular trend can be observed even when focusing on the type of adsorbents. However, focusing on the soil types indicates that data for the same type of soil are plotted in adjacent positions. Even for data corresponding to the same soil type, the relative positions plotted in Figure 9a,b are different. However, in both images, RS is plotted adjacent to MS, and Ku is plotted adjacent to YF, whereas Ka is plotted at a location separate from them. These findings suggest that the soil properties that affect the spent adsorbents were similar for Ku and YF and for RS and MS, whereas those for Ka were quite different from those for the other soils.
The chemical composition of calcium silicate species is CaxSiO(x+2), where x = 0.5–4 [40], indicating that the Ca/Si molar ratio of the average composition of the calcium silicate species produced should be between 0.5 and 4. Similarly, the Mg/Si molar ratio of the average composition of the magnesium silicate species produced should be between 0.5 and 4. Table 4 and Table 5 show the values of ΔMMg/ΔMSi and ΔMCa/ΔMSi determined based on the data in Figure 9. Additionally, if either ΔMSi or ΔMMg or ΔMCa had a negative value, we assumed that neither magnesium nor calcium silicate was produced, and such a result was excluded. Table 4 and Table 5 only present the ratios of the production amounts of silicates to the amounts of Mg and Ca adsorbed on the soil or to the amount of Si components adsorbed on the spent adsorbent; they do not indicate the produced amounts of silicates.
In Table 4 and Table 5, the values exceeding four indicate a reduction in Mg or Ca beyond that consumed in silicate formation, which suggest that Mg and Ca leached from the spent adsorbent were directly adsorbed onto the soil. Conversely, values less than 0.5 indicate a reduction in Si beyond that consumed in the silicate formation, which suggest that silicic acid ions leached from the soil were directly adsorbed onto the spent adsorbent. As shown in Table 4 and Table 5, the above analysis indicates that in Ku and YF, magnesium silicate was not produced for all Mg-based adsorbents. Additionally, for As(III)-MgO, magnesium silicate was not produced even in MS. Moreover, for the Ca-based adsorbents, calcium silicates could have been produced in all soils.
Subsequently, assuming that silicate was formed, the incorporation of As into the silicate was examined. The extreme (Mg or Ca)/Si composition molar ratios of the silicate species that can be produced are 0.5 and 4, as described above. Assuming the (Mg or Ca)/Si composition molar ratio of the generated silicate species is 0.5, if the value of ΔMSi–(ΔMMg or ΔMCa) × 2 is positive, the amount of (Mg or Ca)0.5SiO2.5 produced is equal to (ΔMMg or ΔMCa) × 2, and, if negative, it is equal to ΔMSi. Assuming that the (Mg or Ca)/Si composition molar ratio of the generated silicate species is four, if the value of ΔMSi–(ΔMMg or ΔMCa) × 1/4 is positive, the amount of (Mg or Ca)4SiO6 produced is equal to (ΔMMg or ΔMCa) × 1/4, and if negative, it is equal to ΔMSi.
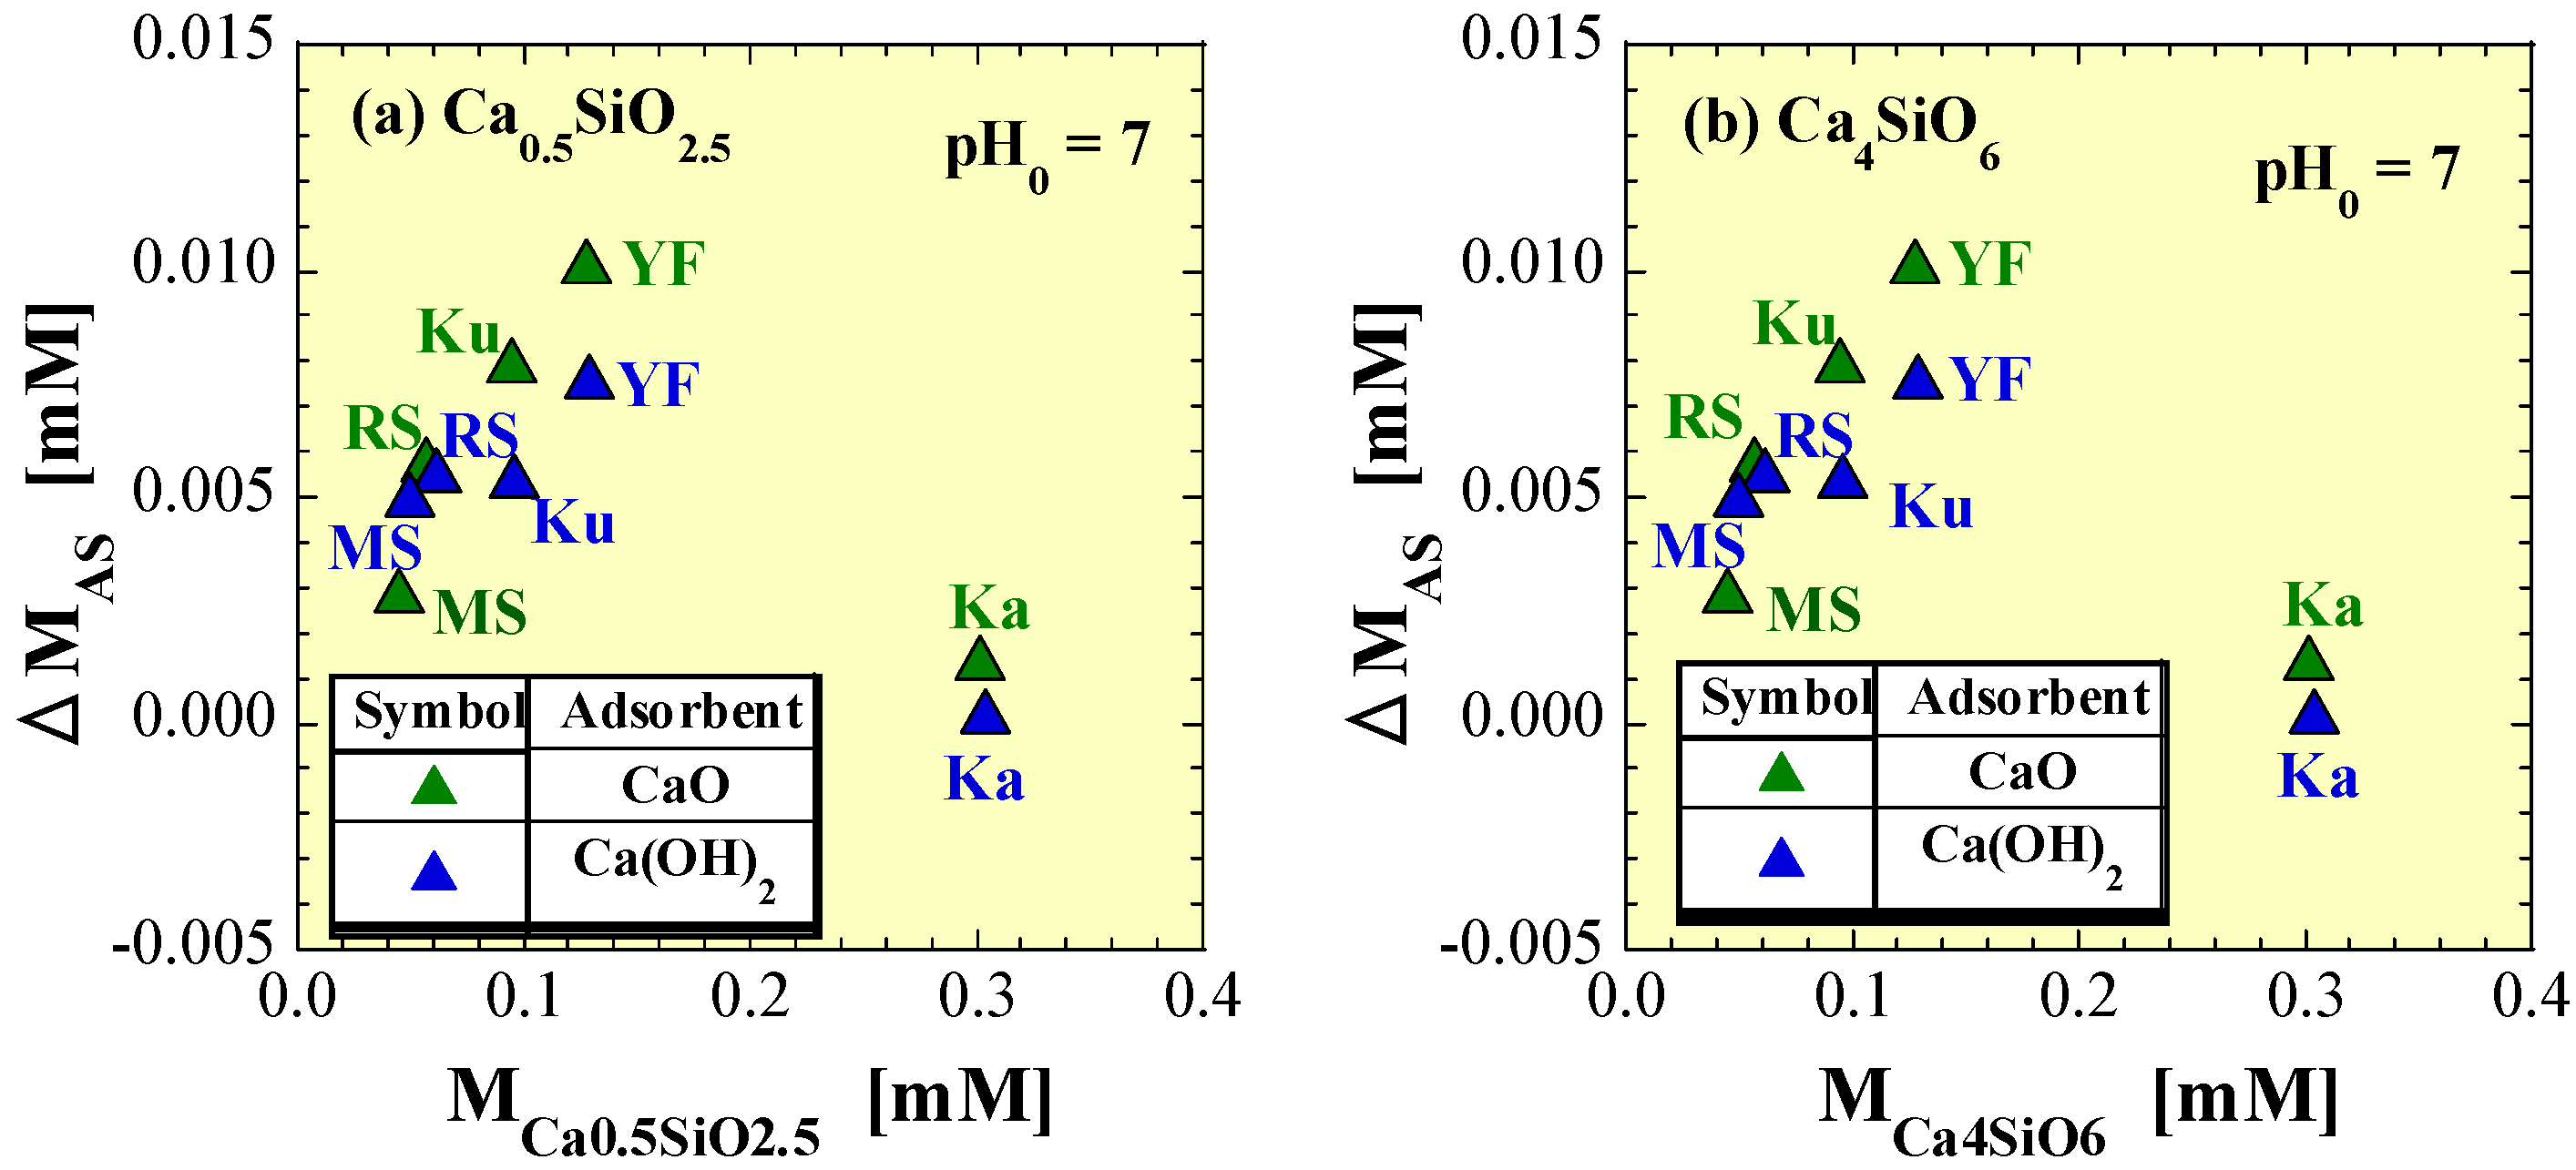
The plots of ΔMAS against the production amount of silicate estimated based on these assumptions are shown in Figure 10 and Figure 11. Figure 10 is a plot of ΔMAS against the estimated production amounts of (a) Mg0.5SiO2.5 and (b) Mg4SiO6 for the coexistence of the spent Mg-based adsorbents and soil. Figure 11 is a plot of ΔMAS against the estimated production amounts of (a) Ca0.5SiO2.5 and (b) Ca4SiO6 for the coexistence of the spent Ca-based adsorbents and soil. However, Figure 11a,b are exactly the same data plots, because MCa0.5SiO2.5 = MCa4SiO6 = ΔMSi was derived from the analysis based on the above assumptions.
In Figure 10a,b, no correlation can be observed between the produced amount of magnesium silicate species and ΔMAS. However, because the amount of As leached from the spent Mg-based adsorbents was essentially low, even if the incorporation of As into the magnesium silicate species had occurred, it is possible that no clear trend could be observed.
Comparing the values of ΔMAS in soils of the same type with different estimated production amounts of calcium silicate species can afford the amount of As adsorbed on the soil and the ratio of As incorporated into calcium silicate. However, in this study, such an analysis could not be conducted, because data for same soil types with significantly different estimated production amounts of calcium silicate species could not be obtained. However, in Figure 11, focusing on the data plots in which the type of adsorbent is the same, a positive correlation appears between the produced amount of calcium silicate species and ΔMAS, except in the data plots of Ka. This result was attributed to the extremely low amount of As and the Ca ions leached from the spent adsorbents being directly adsorbed on Ka. The Ca ions were directly adsorbed before silicic acid ions were leached from Ka, forming calcium silicate species in situ. Additionally, CaO tends to have a slightly higher ΔMAS than Ca(OH)2, which is attributed to the actual produced amount of calcium silicate species, which could be lower for Ca(OH)2 than for CaO. In other words, the proportion of silicic acid adsorbed on the spent adsorbent is inferred to be higher for Ca(OH)2 than for CaO.
4.5. Recommendations for Waste Disposal Considering Effects of Soil on Spent Adsorbents
As described in Section 4.4, in coexistence with soil, the effects of silicic acid species leached from the soil are thought to be quite significant. For Ca-based adsorbents in particular, the incorporation of As into the generated calcium silicate species is thought to prevent environmental pollution due to As leaching. However, the As adsorption capacity of the soil itself is assumed to contribute the most to the decline in EAS, suggesting that the soil acts as a second adsorbent. If the soil itself has a high As adsorption capacity, most of the As leached from the spent absorbents absorbs onto the soil that is in contact with the spent absorbents, which prevents the spread of As contamination over a wide area. Conversely, if the soil itself has a low As adsorption capacity, leached As does not readily adsorb onto the soil, and As contamination spreads over a wide area. Applying the abovementioned rationale to the soils tested in this study, Ku and YF are considered to exhibit the former behavior, and Ka, RS, and MS are considered to exhibit the latter. Thus, Ku and YF prevent the spread of As contamination, although the soil itself in contact with the spent sorbent is contaminated with As. Conversely, Ka, RS, and MS are less susceptible to contamination with As, but As contamination may spread over a wide area via soil pore water.
Furthermore, it may be possible to investigate the As adsorption capacity of individual soils and to use soils with a high As adsorption capacity as a natural adsorbent to prevent the spread of As contamination. However, the soil used as an As adsorption barrier must be risk-managed as As-contaminated soil, and trade-offs and risks must be considered to establish sustainable As treatment processes. Based on the premise that used adsorbents are appropriately processed and managed, examining the characteristics of the nearby soil when planning the location of a waste disposal site is very important to ensure sustainable safety, considering all steps from As purification using adsorbents to the disposal of spent adsorbents containing As.
Finally, among all the soils tested in this study, the spent adsorbents containing As(III) had lower environmental stability than those containing As(V) reported in a previous study [39]. This result indicates that oxidizing As(III) to As(V) before adsorbing As onto adsorbents is advisable. Furthermore, MgO is strongly recommended as an adsorbent for As, because it exhibits high environmental stability for all soils.
5. Conclusions
Focusing on As(III), which is more toxic than As(V), leaching tests were conducted in this study involving four types of spent adsorbents containing As(III), five types of soil, and two types of ion-exchange water with different pH values. A slight difference was observed in EAS due to solvent pH, whereas EAS varied greatly depending on both type of adsorbent and type of soil. Focusing on the soil type, EAS followed the order of MgO << Mg(OH)2 ≈ Ca(OH)2 ≈ CaO in Ku, MgO < Ca(OH)2 ≤ Mg(OH)2, CaO in YF, MgO < Mg(OH)2 << Ca(OH)2 < CaO in NS and Ka, and MgO << Ca(OH)2 < Mg(OH)2 < CaO in RS and MS. Focusing on the spent adsorbent type, EAS followed the order of YF < Ku ≤ MS < Ka < RS < NS for MgO, YF < Ka < Ku ≤ NS ≤ RS ≤ MS for Mg(OH)2, YF < Ku < RS < MS < Ka < NS for CaO, and YF < RS ≤ Ku ≤ MS < Ka < NS for Ca(OH)2. For both the spent Mg-based and Ca-based adsorbents, the EAS values were clearly higher for the spent adsorbents containing As(III) than for those containing As(V) reported in a previous study [39]. Therefore, the risk of As leaching in soil was evaluated as being higher for the spent adsorbents containing As(III) than for those containing As(V). Although the ease of leaching As from the adsorbent differed depending on the combination of soil type and As valence, the spent MgO adsorbent had the lowest EAS in all the combinations. Finally, regarding environmentally friendly and sustainable As-removal treatment, disposal, and management, we recommend the following: (i) selection of MgO as an adsorbent and (ii) oxidation treatment of As(III) to As(V) before the step of adsorbing As onto adsorbents.
The amount of As leached from the used adsorbent is expected to vary depending on the ratio of the spent adsorbent to both soil and liquid. Therefore, as a near future challenge, it will be important to conduct leaching tests with these mixing ratios as experimental parameters. Additionally, to estimate the long-term stability of spent adsorbents, it will be necessary to investigate how the valence and state (mineralogy) of As incorporated into spent adsorbents change in soil.
Author Contributions
Conceptualization, H.S.; methodology, H.S., T.S. and J.H.; formal analysis, H.S. and K.M.; investigation, H.S. and K.M.; resources, H.S., K.M. and J.H.; data curation, H.S. and K.M.; writing—original draft preparation, H.S. and K.M.; writing—review and editing, H.S., K.M., T.S. and J.H.; supervision, J.H.; project administration, H.S.; funding acquisition, J.H., T.S. and H.S. All authors have read and agreed to the published version of the manuscript.
Funding
This research received no external funding.
Institutional Review Board Statement
Not applicable.
Informed Consent Statement
Not applicable.
Data Availability Statement
Data supporting the findings of this study are available from the corresponding authors upon reasonable request.
Acknowledgments
We are deeply grateful for Terumi Oguma for her assistance with the experiments.
Conflicts of Interest
The authors declare no conflicts of interest.
References
- The World Health Organization (WHO). Guidelines for Drinking-Water Quality, 4th ed.; WHO: Tarxien, Malta, 2011; Arsenic; pp. 315–318. ISBN 978-92-4-154815-1. Available online: https://apps.who.int/iris/bitstream/handle/10665/44584/9789241548151_eng.pdf (accessed on 21 February 2024).
- van Geen, A.; Zheng, Y.; Cheng, Z.; Aziz, Z.; Horneman, A.; Dhar, R.K.; Mailloux, B.; Stute, M.; Weinman, B.; Goodbred, S.; et al. A transect of groundwater and sediment properties in Araihazar, Bangladesh: Further evidence of decoupling between As and Fe mobilization. Chem. Geol. 2006, 228, 85–96. [Google Scholar] [CrossRef]
- Harvey, C.F.; Ashfaque, K.N.; Yu, W.; Badruzzaman, A.B.M.; Ali, M.A.; Oates, P.M.; Michael, H.A.; Neumann, R.B.; Beckie, R.; Islam, S.; et al. Groundwater dynamics and arsenic contamination in Bangladesh. Chem. Geol. 2006, 228, 112–136. [Google Scholar] [CrossRef]
- Senanayake, N.; Mukherji, A. Irrigating with arsenic contaminated groundwater in West Bengal and Bangladesh: A review of interventions for mitigating adverse health and crop outcomes. Agric. Water Manag. 2014, 135, 90–99. [Google Scholar] [CrossRef]
- Khan, K.M.; Parvez, F.; Zoeller, R.T.; Hocevar, B.A.; Kamendulis, L.M.; Rohlman, D.; Eunus, M.; Graziano, J. Thyroid hormones and neurobehavioral functions among adolescents chronically exposed to groundwater with geogenic arsenic in Bangladesh. Sci. Total Environ. 2019, 678, 278–287. [Google Scholar] [CrossRef] [PubMed]
- Huq, M.E.; Fahad, S.; Shao, Z.; Sarven, M.S.; Khan, I.A.; Alam, M.; Saeed, M.; Ullah, H.; Adnan, M.; Saud, S.; et al. Arsenic in a groundwater environment in Bangladesh. Occurrence and mobilization. J. Environ. Manag. 2020, 262, 110318. [Google Scholar] [CrossRef] [PubMed]
- Shahid, M.; Niazi, N.K.; Dumat, C.; Naidu, R.; Khalid, S.; Rahman, M.M.; Bibi, I. A meta-analysis of the distribution, sources and health risks of arsenic-contaminated groundwater in Pakistan. Environ. Pollut. 2018, 242, 307–319. [Google Scholar] [CrossRef] [PubMed]
- Malik, A.; Parvaiz, A.; Mushtaq, N.; Hussain, I.; Javed, T.; Rehman, H.U.; Farooqi, A. Characterization and role of derived dissolved organic matter on arsenic mobilization in alluvial aquifers of Punjab, Pakistan. Chemosphere 2020, 251, 126374. [Google Scholar] [CrossRef]
- Hamidian, A.H.; Razeghi, N.; Zhang, Y.; Yang, M. Spatial distribution of arsenic in groundwater of Iran, a review. J. Geochem. Explor. 2019, 201, 88–98. [Google Scholar] [CrossRef]
- Chakraborti, D.; Das, B.; Rahman, M.M.; Nayak, B.; Pal, A.; Sengupta, M.K.; Ahamed, S.; Hossain, M.A.; Chowdhury, U.K.; Biswas, B.K.; et al. Arsenic in groundwater of the Kolkata Municipal Corporation (KMC), India: Critical review and modes of mitigation. Chemosphere 2017, 180, 437–447. [Google Scholar] [CrossRef]
- Bhowmick, S.; Pramanik, S.; Singh, P.; Mondal, P.; Chatterjee, D.; Nriagu, J. Arsenic in groundwater of West Bengal, India: A review of human health risks and assessment of possible intervention options. Sci. Total Environ. 2018, 612, 148–169. [Google Scholar] [CrossRef]
- Bindal, S.; Singh, C.K. Predicting groundwater arsenic contamination: Regions at risk in highest populated state of India. Water Res. 2019, 159, 65–76. [Google Scholar] [CrossRef] [PubMed]
- Chandrajith, R.; Diyabalanage, S.; Dissanayake, C.B. Geogenic fluoride and arsenic in groundwater of Sri Lanka and its implications to community health. Groundw. Sustain. Dev. 2020, 10, 100359. [Google Scholar] [CrossRef]
- Hoang, T.H.; Bang, S.; Kim, K.W.; Nguyen, M.H.; Dang, D.M. Arsenic in groundwater and sediment in the Mekong River Delta, Vietnam. Environ. Poll. 2010, 158, 2648–2658. [Google Scholar] [CrossRef] [PubMed]
- Stopelli, E.; Duyen, V.T.; Mai, T.T.; Trang, P.T.K.; Viet, P.H.; Lightfoot, A.; Kipfer, R.; Schneider, M.; Eiche, E.; Kontny, A.; et al. Spatial and temporal evolution of groundwater arsenic contamination in the Red River Delta, Vietnam: Interplay of mobilisation and retardation processes. Sci. Total Environ. 2020, 717, 137143. [Google Scholar] [CrossRef] [PubMed]
- Richards, L.A.; Magnone, D.; Sültenfuß, J.; Chambers, L.; Bryant, C.; Boyce, A.J.; van Dongen, B.E.; Ballentine, C.J.; Sovann, C.; Uhlemann, S.; et al. Dual in-aquifer and near surface processes drive arsenic mobilization in Cambodian groundwaters. Sci. Total Environ. 2019, 659, 699–714. [Google Scholar] [CrossRef] [PubMed]
- Wen, D.; Zhang, F.; Zhang, E.; Wang, C.; Han, S.; Zheng, Y. Arsenic, fluoride and iodine in groundwater of China. J. Geochem. Explor. 2013, 135, 1–21. [Google Scholar] [CrossRef]
- Guo, H.; Wen, D.; Liu, Z.; Jia, Y.; Guo, Q. A review of high arsenic groundwater in Mainland and Taiwan, China: Distribution, characteristics and geochemical processes. Appl. Geochem. 2014, 41, 196–217. [Google Scholar] [CrossRef]
- Zhang, L.; Qin, X.; Tang, J.; Liu, W.; Yang, H. Review of arsenic geochemical characteristics and its significance on arsenic pollution studies in karst groundwater, South-West China. Appl. Geochem. 2017, 77, 80–88. [Google Scholar] [CrossRef]
- Mariño, E.E.; Ávila, G.T.; Bhattacharya, P.; Schulz, C.J. The occurrence of arsenic and other trace elements in groundwaters of the southwestern Chaco-Pampean plain, Argentina. J. S. Am. Earth Sci. 2020, 100, 102547. [Google Scholar] [CrossRef]
- Aullón Alcaine, A.; Schulz, C.; Bundschuh, J.; Jacks, G.; Thunvik, R.; Gustafsson, J.P.; Mörth, C.M.; Sracek, O.; Ahmada, A.; Bhattacharya, P. Hydrogeochemical controls on the mobility of arsenic, fluoride and other geogenic co-contaminants in the shallow aquifers of northeastern La Pampa Province in Argentina. Sci. Total Environ. 2020, 715, 136671. [Google Scholar] [CrossRef]
- Machado, I.; Falchi, L.; Bühl, V.; Mañay, N. Arsenic levels in groundwater and its correlation with relevant inorganic parameters in Uruguay: A medical geology perspective. Sci. Total Environ. 2020, 721, 137787. [Google Scholar] [CrossRef] [PubMed]
- Navarro, O.; González, J.; Júnez-Ferreira, H.E.; Bautista, C.-F.; Cardona, A. Correlation of arsenic and fluoride in the groundwater for human consumption in a semiarid region of Mexico. Procedia Eng. 2017, 186, 333–340. [Google Scholar] [CrossRef]
- Gómez-Hernández, A.; Rodríguez, R.; Lara Del Río, A.; Ruiz-Huerta, E.A.; Armienta, M.A.; Dávila-Harris, P.; Sen-Gupta, B.; Delgado-Rodríguez, O.; Del Angel Ríos, A.; Martínez-Villegas, N. Alluvial and gypsum karst geological transition favors spreading arsenic contamination in Matehuala, Mexico. Sci. Total Environ. 2020, 707, 135340. [Google Scholar] [CrossRef] [PubMed]
- Bretzler, A.; Lalanne, F.; Nikiema, J.; Podgorski, J.; Pfenninger, N.; Berg, M.; Schirmer, M. Groundwater arsenic contamination in Burkina Faso, West Africa: Predicting and verifying regions at risk. Sci. Total Environ. 2017, 584–585, 958–970. [Google Scholar] [CrossRef]
- Abiye, T.A.; Bhattacharya, P. Arsenic concentration in groundwater: Archetypal study from South Africa. Groundw. Sustain. Dev. 2019, 9, 100246. [Google Scholar] [CrossRef]
- Jadhav, S.V.; Bringas, E.; Yadav, G.D.; Rathod, V.K.; Ortiz, I.; Marathe, K.V. Arsenic and fluoride contaminated groundwaters: A review of current technologies for contaminants removal. J. Environ. Manag. 2015, 162, 306–325. [Google Scholar] [CrossRef] [PubMed]
- Sarkar, A.; Paul, B. The global menace of arsenic and its conventional remediation-A critical review. Chemosphere 2016, 158, 37–49. [Google Scholar] [CrossRef]
- Ghosh, S.; Debsarkar, A.; Dutta, A. Technology alter-natives for decontamination of arsenic-rich groundwater—A critical review. Environ. Technol. Innov. 2019, 13, 277–303. [Google Scholar] [CrossRef]
- Kumar, R.; Patel, M.; Singh, P.; Bundschuh, J.; Pittman, C.U., Jr.; Trakal, L.; Mohan, D. Emerging technologies for arsenic removal from drinking water in rural and peri-urban areas: Methods, experience from, and options for Latin America. Sci. Total Environ. 2019, 694, 133427. [Google Scholar] [CrossRef] [PubMed]
- Park, Y.Y.; Tran, T.; Lee, Y.H.; Nam, Y.I., II; Senanayake, G.; Kim, M.J. Selective removal of arsenic(V) from a molybdate plant liquor by precipitation of magnesium arsenate. Hydrometallurgy 2010, 104, 290–297. [Google Scholar] [CrossRef]
- Tresintsi, S.; Simeonidis, K.; Katsikini, M.; Paloura, E.C.; Bantsis, G.; Mitrakas, M. A novel approach for arsenic adsorbents regeneration using MgO. J. Hazard. Mater. 2014, 265, 217–225. [Google Scholar] [CrossRef]
- Yu, X.Y.; Luo, T.; Jia, Y.; Zhang, Y.X.; Liu, J.H.; Huang, X.J. Porous hierarchically micro-/nanostructured MgO: Morphology control and their excellent performance in As(III) and As(V) removal. J. Phys. Chem. C 2011, 115, 22242–22250. [Google Scholar] [CrossRef]
- Opiso, E.M.; Sato, T.; Morimoto, K.; Asai, A.; Anraku, S.; Numako, C.; Yoneda, T. Incorporation of arsenic during the formation of Mg-bearing minerals at alkaline condition. Miner. Eng. 2010, 23, 230–237. [Google Scholar] [CrossRef]
- Camacho, J.; Wee, H.Y.; Kramer, T.A.; Autenrieth, R. Arsenic stabilization on water treatment residuals by calcium addition. J. Hazard. Mater. 2009, 165, 599–603. [Google Scholar] [CrossRef]
- Montes-Hernandez, G.; Concha-Lozano, N.; Renard, F.; Quirico, E. Removal of oxyanions from synthetic wastewater via carbonation process of calcium hydroxide: Applied and fundamental aspects. J. Hazard. Mater. 2009, 166, 788–795. [Google Scholar] [CrossRef]
- Olyaie, E.; Banejad, H.; Afkhami, A.; Rahmani, A.; Khodaveisi, J. Development of a cost-effective technique to remove the arsenic contamination from aqueous solutions by calcium peroxide nanoparticles. Sep. Purif. Technol. 2012, 95, 10–15. [Google Scholar] [CrossRef]
- Hu, C.-Y.; Lo, S.-L.; Kuan, W.-H. High concentration of arsenate removal by electrocoagulation with calcium. Sep. Purif. Technol. 2014, 126, 7–14. [Google Scholar] [CrossRef]
- Sugita, H.; Oguma, T.; Zhang, M.; Hara, J.; Takahashi, S. Environmental stability of spent magnesium-based and calcium-based arsenic adsorbents-Effects of soils. J. Jpn. Soc. Civ. Eng. Ser. G Environ. Res. 2016, 72, 437–448. [Google Scholar] [CrossRef]
- Sugita, H.; Oguma, T.; Hara, J.; Zhang, M.; Kawabe, Y. Effects of silicic acid on leaching behavior of arsenic from spent calcium-based adsorbents with arsenite. Sustainability 2021, 13, 12937. [Google Scholar] [CrossRef]
- Sugita, H.; Oguma, T.; Hara, J.; Zhang, M.; Kawabe, Y. Effects of silicic acid on leaching behavior of arsenic from spent magnesium-based adsorbents containing arsenite. Sustainability 2022, 14, 4236. [Google Scholar] [CrossRef]
- The Chemical Society of Japan (CSJ). Kagaku Binran (Handbook of Chemistry), Pure Chemistry II, 4th ed.; Maruzen: Tokyo, Japan, 1993; p. 317. [Google Scholar]
Figure 1.
pH values of leachate versus soil: NS, no soil; Ku, Kuroboku soil; YF, yellow-brown forest soil; Ka, Kanuma soil; RS, river sand; MS, mountain sand.
Figure 1.
pH values of leachate versus soil: NS, no soil; Ku, Kuroboku soil; YF, yellow-brown forest soil; Ka, Kanuma soil; RS, river sand; MS, mountain sand.

Figure 2.
As concentration in leachate versus soil: NS, no soil; Ku, Kuroboku soil; YF, yellow-brown forest soil; Ka, Kanuma soil; RS, river sand; MS, mountain sand.
Figure 2.
As concentration in leachate versus soil: NS, no soil; Ku, Kuroboku soil; YF, yellow-brown forest soil; Ka, Kanuma soil; RS, river sand; MS, mountain sand.

Figure 3.
Mg concentration in leachate versus soil: NS, no soil; Ku, Kuroboku soil; YF, yellow-brown forest soil; Ka, Kanuma soil; RS, river sand; MS, mountain sand.
Figure 3.
Mg concentration in leachate versus soil: NS, no soil; Ku, Kuroboku soil; YF, yellow-brown forest soil; Ka, Kanuma soil; RS, river sand; MS, mountain sand.

Figure 4.
Ca concentration in leachate versus soil: NS, no soil; Ku, Kuroboku soil; YF, yellow-brown forest soil; Ka, Kanuma soil; RS, river sand; MS, mountain sand.
Figure 4.
Ca concentration in leachate versus soil: NS, no soil; Ku, Kuroboku soil; YF, yellow-brown forest soil; Ka, Kanuma soil; RS, river sand; MS, mountain sand.

Figure 5.
Si concentration in leachate versus soil: NS, no soil; Ku, Kuroboku soil; YF, yellow-brown forest soil; Ka, Kanuma soil; RS, river sand; MS, mountain sand.
Figure 5.
Si concentration in leachate versus soil: NS, no soil; Ku, Kuroboku soil; YF, yellow-brown forest soil; Ka, Kanuma soil; RS, river sand; MS, mountain sand.

Figure 6.
As leaching ratio versus soil: NS, no soil; Ku, Kuroboku soil; YF, yellow-brown forest soil; Ka, Kanuma soil; RS, river sand; MS, mountain sand.
Figure 6.
As leaching ratio versus soil: NS, no soil; Ku, Kuroboku soil; YF, yellow-brown forest soil; Ka, Kanuma soil; RS, river sand; MS, mountain sand.

Figure 7.
Mg and Ca leaching ratios versus soil: (a) spent Mg-based adsorbents; (b) spent Ca-based adsorbents. NS, no soil; Ku, Kuroboku soil; YF, yellow-brown forest soil; Ka, Kanuma soil; RS, river sand; MS, mountain sand.
Figure 7.
Mg and Ca leaching ratios versus soil: (a) spent Mg-based adsorbents; (b) spent Ca-based adsorbents. NS, no soil; Ku, Kuroboku soil; YF, yellow-brown forest soil; Ka, Kanuma soil; RS, river sand; MS, mountain sand.

Figure 8.
As leaching ratios versus hypothetical initial Si concentration: (a) spent Mg-based adsorbents; (b) spent Ca-based adsorbents. NS, no soil; Ku, Kuroboku soil; YF, yellow-brown forest soil; Ka, Kanuma soil; RS, river sand; MS, mountain sand.
Figure 8.
As leaching ratios versus hypothetical initial Si concentration: (a) spent Mg-based adsorbents; (b) spent Ca-based adsorbents. NS, no soil; Ku, Kuroboku soil; YF, yellow-brown forest soil; Ka, Kanuma soil; RS, river sand; MS, mountain sand.
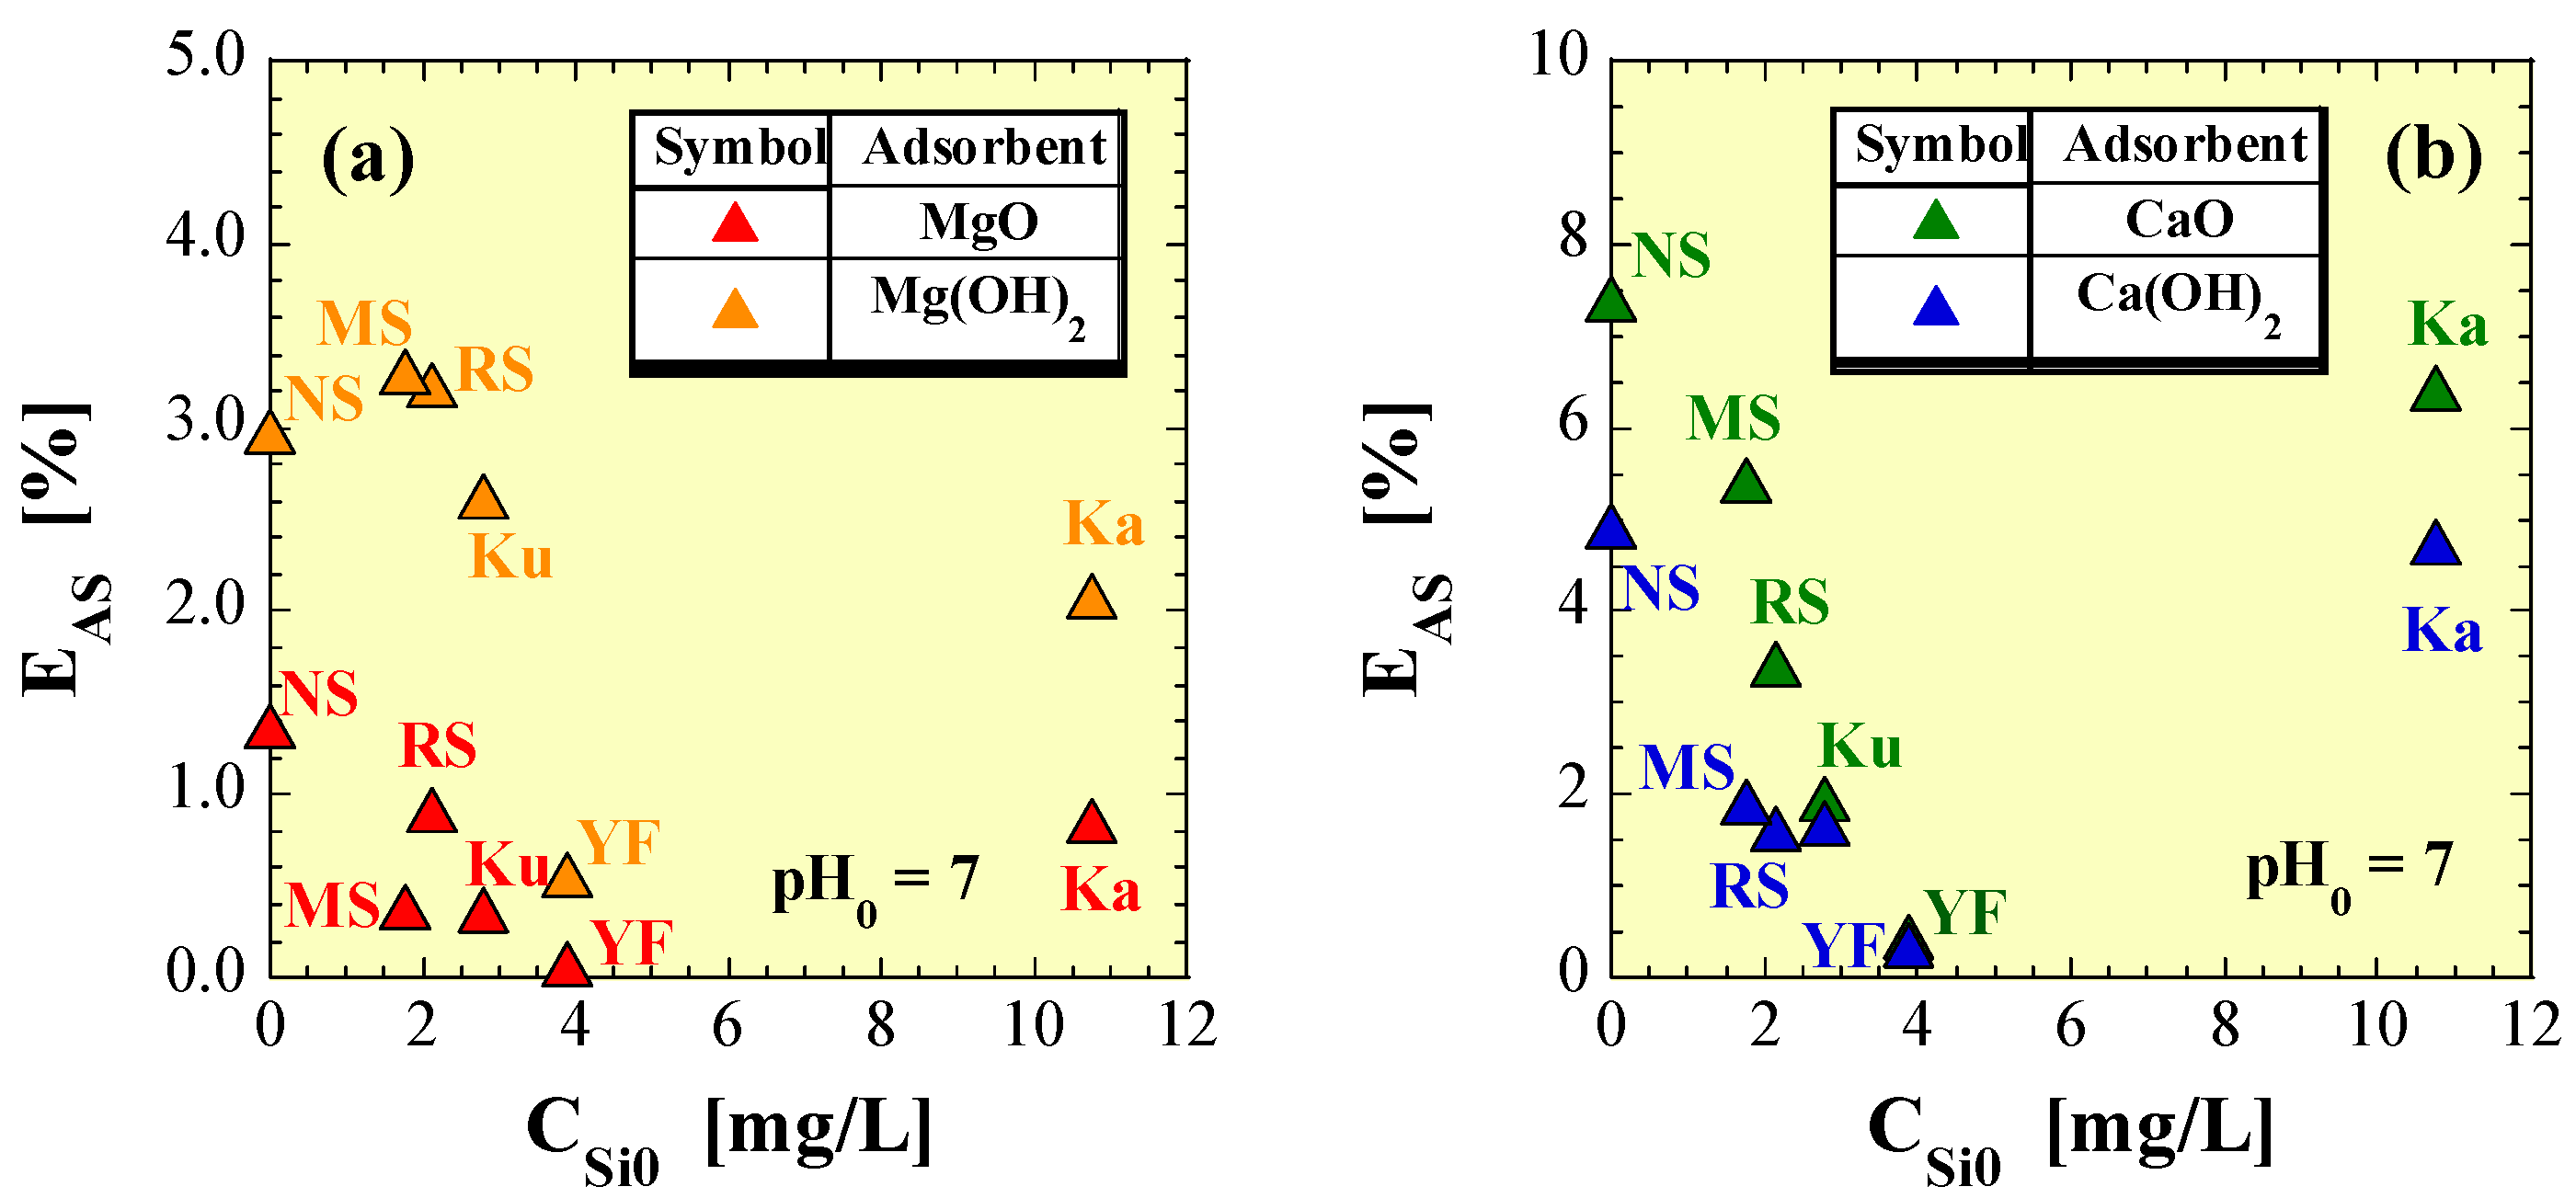
Figure 9.
Plots of (a) ΔMMg for the spent Mg-based adsorbents and (b) ΔMCa for the spent Ca-based adsorbents against ΔMSi. Ku, Kuroboku soil; YF, yellow-brown forest soil; Ka, Kanuma soil; RS, river sand; MS, mountain sand.
Figure 9.
Plots of (a) ΔMMg for the spent Mg-based adsorbents and (b) ΔMCa for the spent Ca-based adsorbents against ΔMSi. Ku, Kuroboku soil; YF, yellow-brown forest soil; Ka, Kanuma soil; RS, river sand; MS, mountain sand.

Figure 10.
Plots of ΔMAS against estimated production amounts of (a) Mg0.5SiO2.5 and (b) Mg4SiO6 for the coexistence of the spent Mg-based adsorbents and soil: Ka, Kanuma soil; RS, river sand; MS, mountain sand.
Figure 10.
Plots of ΔMAS against estimated production amounts of (a) Mg0.5SiO2.5 and (b) Mg4SiO6 for the coexistence of the spent Mg-based adsorbents and soil: Ka, Kanuma soil; RS, river sand; MS, mountain sand.

Figure 11.
Plots of ΔMAS against estimated production amounts of (a) Ca0.5SiO2.5 and (b) Ca4SiO6 for the coexistence of the spent Ca-based adsorbents and soil: Ku, Kuroboku soil; YF, yellow-brown forest soil; Ka, Kanuma soil; RS, river sand; MS, mountain sand.
Figure 11.
Plots of ΔMAS against estimated production amounts of (a) Ca0.5SiO2.5 and (b) Ca4SiO6 for the coexistence of the spent Ca-based adsorbents and soil: Ku, Kuroboku soil; YF, yellow-brown forest soil; Ka, Kanuma soil; RS, river sand; MS, mountain sand.

Table 1.
Purity (nominal), median particle size, BET surface area, and Mg and Ca contents of the four adsorbents used in this study.
Table 1.
Purity (nominal), median particle size, BET surface area, and Mg and Ca contents of the four adsorbents used in this study.
| Adsorbent | P (%) | Dp50 (μm) | SBET (m2/g) | αMg (%) | αCa (%) |
|---|---|---|---|---|---|
| MgO | 98.0 | 1.54 | 4.3 | 59.1 | - |
| Mg(OH)2 | 99.9 | 4.13 | 22.0 | 40.6 | - |
| CaO | 99.6 | 19.6 | 2.7 | - | 71.2 |
| Ca(OH)2 | 98.9 | 41.7 | 14.3 | - | 53.5 |
P: nominal purity, Dp50: median particle diameter, SBET: BET surface area, αMg: Mg content, and αCa: Ca content; data were taken from Sugita et al. (2016) [39].
Table 2.
Data relating to the production of spent Mg-based and Ca-based adsorbents.
| No. | As(Valence) | Adsorbent | WAD/V (g/L) | pH0 | CAS0 (mg/L) | CAS (mg/L) | CMg (mg/L) | CCa (mg/L) | RAS (%) | βMg (%) | βCa (%) | QAS (mg/g) |
|---|---|---|---|---|---|---|---|---|---|---|---|---|
| (1) 1 | As(III) | MgO | 5.004 | 6.99 | 21.79 | 0.149 | 6.23 | - | 99.3 | 0.21 | - | 4.32 |
| (2) 1 | As(III) | Mg(OH)2 | 5.007 | 7.10 | 21.85 | 1.013 | 7.80 | - | 95.4 | 0.38 | - | 4.16 |
| (3) 2 | As(III) | CaO | 5.009 | 7.09 | 22.35 | 1.437 | - | 837 | 93.6 | - | 23.5 | 5.42 |
| (4) 2 | As(III) | Ca(OH)2 | 5.009 | 7.09 | 22.73 | 1.378 | - | 858 | 93.9 | - | 32.0 | 6.23 |
Table 3.
Dissolved forms of As leached from Mg- and Ca-based adsorbents containing As(III).
| Soil | Blank | MgO | Mg(OH)2 | CaO | Ca(OH)2 |
|---|---|---|---|---|---|
| NS | H3AsO3 | H2AsO3− | H2AsO3− | HAsO32−, H2AsO3− | HAsO32−, H2AsO3− |
| Ku | H3AsO3 | H3AsO3 | H3AsO3 | H3AsO3 | H3AsO3 |
| YF | H3AsO3 | H3AsO3 | H3AsO3 | H3AsO3, H2AsO3− | H3AsO3, H2AsO3− |
| Ka | H3AsO3 | H2AsO3−, H3AsO3 | H3AsO3 | H2AsO3−, H3AsO3 | H2AsO3−, H3AsO3 |
| RS | H3AsO3 | H2AsO3− | H2AsO3− | HAsO32−, H2AsO3− | HAsO32−, H2AsO3− |
| MS | H3AsO3 | H2AsO3− | H2AsO3− | HAsO32−, H2AsO3− | HAsO32−, H2AsO3− |
NS, no soil; Ku, Kuroboku soil; YF, yellow-brown forest soil; Ka, Kanuma soil; RS, river sand; MS, mountain sand.
Table 4.
Values of ΔMMg/ΔMSi for spent Mg-based adsorbents at pH0 = 7.
| As | Adsorbent | Ku | YF | Ka | RS | MS |
|---|---|---|---|---|---|---|
| As(III) | MgO | - | - | 0.09 | 59.1 | - |
| As(III) | Mg(OH)2 | - | - | 22.0 | 2.05 | 1.58 |
Ku, Kuroboku soil; YF, yellow-brown forest soil; Ka, Kanuma soil; RS, river sand; MS, mountain sand.
Table 5.
Values of ΔMCa/ΔMSi for spent Ca-based adsorbents at pH0 = 7.
| As | Adsorbent | Ku | YF | Ka | RS | MS |
|---|---|---|---|---|---|---|
| As(III) | CaO | 203 | 152 | 67.1 | 77.6 | 59.2 |
| As(III) | Ca(OH)2 | 190 | 144 | 66.6 | 75.3 | 48.7 |
Ku, Kuroboku soil; YF, yellow-brown forest soil; Ka, Kanuma soil; RS, river sand; MS, mountain sand.
Disclaimer/Publisher’s Note: The statements, opinions and data contained in all publications are solely those of the individual author(s) and contributor(s) and not of MDPI and/or the editor(s). MDPI and/or the editor(s) disclaim responsibility for any injury to people or property resulting from any ideas, methods, instructions or products referred to in the content. |
© 2024 by the authors. Licensee MDPI, Basel, Switzerland. This article is an open access article distributed under the terms and conditions of the Creative Commons Attribution (CC BY) license (https://creativecommons.org/licenses/by/4.0/).
Share and Cite
MDPI and ACS Style
Sugita, H.; Morimoto, K.; Saito, T.; Hara, J. Effects of Soils on Environmental Stability of Spent Mg-Based and Ca-Based Adsorbents Containing Arsenite. Sustainability 2024, 16, 4008. https://doi.org/10.3390/su16104008
AMA Style
Sugita H, Morimoto K, Saito T, Hara J. Effects of Soils on Environmental Stability of Spent Mg-Based and Ca-Based Adsorbents Containing Arsenite. Sustainability. 2024; 16(10):4008. https://doi.org/10.3390/su16104008
Chicago/Turabian StyleSugita, Hajime, Kazuya Morimoto, Takeshi Saito, and Junko Hara. 2024. "Effects of Soils on Environmental Stability of Spent Mg-Based and Ca-Based Adsorbents Containing Arsenite" Sustainability 16, no. 10: 4008. https://doi.org/10.3390/su16104008
Note that from the first issue of 2016, this journal uses article numbers instead of page numbers. See further details here.