
Unveiling Transportation Socio-Economic Adaptability Using a Node–Place Model: A Case from Zhejiang Province, China

1
School of Management and Economics, Beijing Institute of Technology, Beijing 100081, China
2
Institute of Comprehensive Transportation, National Development and Reform Commission, Beijing 100038, China
3
Key Laboratory of Highway Engineering of Ministry of Education, Changsha University of Science & Technology, Changsha 410114, China
4
School of Civil Engineering, Guangzhou University, Guangzhou 510006, China
*
Author to whom correspondence should be addressed.
Sustainability 2024, 16(10), 4009; https://doi.org/10.3390/su16104009
Submission received: 1 March 2024
/
Revised: 26 April 2024
/
Accepted: 6 May 2024
/
Published: 10 May 2024
(This article belongs to the Special Issue Urban Economic Development and Planning: Sustainable Development)
Abstract
:Effective investment in transportation infrastructure ensures sustainable urban development and high-quality economic development. Understanding transportation and socioeconomic relationships is crucial for developing investment strategies. Existing research focuses on analyzing the contribution of transportation to the economy or the contribution of economic development to transportation, neglecting the identification of transportation infrastructure weaknesses to initiate targeted investment and construction. In this study, we propose an assessment framework based on the node–place model to identify the shortcomings in transportation infrastructure. The framework encompasses the adaptability of the current transportation infrastructure and the stage of economic development, evaluating whether the current transportation infrastructure is ahead of or lagging behind the level of economic development. We conduct a case study on three kinds of transportation infrastructure, including railways, highways, and civil aviation, in Zhejiang Province, China. The results show that Zhejiang Province’s transportation infrastructure generally meets economic development requirements, and most cities have relatively advanced transportation systems. However, significant gaps in transportation facilities in certain areas still need to be targeted and supplemented. These findings help to explore the theoretical relationship between transportation and socioeconomics, providing a basis for economic investment decisions on transportation infrastructure.
1. Introduction
Transportation is a fundamental, pioneering, and strategic industry in the national economy and an essential support for sustainable development, and it plays a substantial supporting and leading role in economic development [1,2,3]. Over the next decade, expanding transportation networks and accelerating the decarbonization process will create huge potential for developing the global transportation infrastructure sector and long-term positive investment. Adequate investment in transportation infrastructure is an essential guarantee for sustainable urban development and high-quality economic development, as well as a bridge to achieve synergistic development in different regions. In other words, policymakers need to accurately understand the adaptability between transportation infrastructure and socioeconomic development and identify the weaknesses of transportation infrastructure, which is vital for grasping the intensity of investment in transportation infrastructure to improve inter-regional connectivity, increase development opportunities, and promote regional sustainable development [4,5,6].
The research on the relationship between transportation infrastructure and economic growth provides empirical evidence for investing in transportation infrastructure to stimulate economic development. Those studies demonstrated that economic and transportation infrastructure development are mutually influential and inextricably linked [7]. On the one hand, continued economic development drives continuous changes in the spatial structure of the regional economy, which in turn will increase the growth in travel demand and stimulate the construction of transportation infrastructure to meet specific levels of socioeconomic activity [8]. It has been found that economic growth provides opportunities for people to travel long distances in the short term. Thus, there is more demand for transportation services, i.e., economic growth drives the demand for air transportation infrastructure [9]. Meanwhile, it also provides financial guarantees and technical support for transportation construction. For example, in 2019, China’s GDP exceeded 99 trillion yuan and completed transportation infrastructure investment of 3.25 trillion yuan, an increase of 6.1% and 3.4%, respectively, over the previous year [10]. On the other hand, the importance of transportation to economic growth has been fully evidenced in the course of historical development, and investment in transportation infrastructure has proven to be crucial for economic recovery and sustainable development [4,5,6,7,8,9,10,11,12,13,14,15,16,17,18,19,20,21,22]. Transportation infrastructure has a large investment scale, a long construction cycle, a wide functional coverage, and other characteristics that can not only directly create demand and promote economic growth but also have a long-term impact on the economy and social development indirectly [23,24,25]. For example, when economic agglomeration is low, the effect of transportation infrastructure on productivity change is not significant, but it becomes apparent as agglomeration increases [23].
The above studies either emphasize the economic contribution of transportation or highlight the contribution of economic development to transportation, but they cannot answer where the weaknesses of transportation infrastructure are in the context of current social and economic development. Consequently, they cannot provide a basis for optimizing economic investment decisions in transportation infrastructure. Some research argues that transportation and social development are closely connected, and transportation must be compatible with social development and have a certain degree of advancement to create favorable preconditions for social progress and sustainable economic development. Assessing transportation socioeconomic adaptability seems appropriate to answer this question as it emphasizes the relative relationship of the two elements or systems. As a matter of fact, the socioeconomic adaptability problem of transportation has been a long-standing one. Still, in recent years, with the rapid development of highways, high-speed railways, urban railways, airlines, and other advanced and efficient transportation modes, these transportation facilities have become necessary foundations and guarantee the conditions to support regional socioeconomic upgrading and development. At the same time, the socioeconomic adaptability problem of the transportation system has become more prominent [26,27,28,29].
Here, this study attempts to unveil transportation socioeconomic adaptability to answer the weaknesses of transportation infrastructure in contemporary social and economic development and to provide effective investment decisions in transportation infrastructure toward sustainable urban development and high-quality economic development. To achieve this goal, data on transportation infrastructure and economic development within the Zhejiang Province, China, were collected as a case to analyze transportation socioeconomic adaptability and develop policy recommendations for investment in transportation infrastructure. The findings were supposed to contribute to and broaden the theory of exploring relations between transportation socioeconomics. In practice, it assists policymakers, urban planners, and investigators in reallocating resources for urban development and maximizing the potential contribution of transport infrastructure to socioeconomic development, thus contributing to coordinated development between transportation and social–economic systems.
The remainder of this paper is organized as follows. Section 2 describes the data and related processing procedures of the collected datasets. Section 3 summarizes the basic features of the study area and presents the adaptability of transportation and social economics Section 4 discusses the policy implications through a case study, followed by a conclusion about the findings, limitations, and possible extension of our work in Section 5.
2. Data and Methodology
2.1. Research Areas
Zhejiang Province is located in the south wing of the Yangtze River Delta on the southeast coast of China, between 118°01′~123°10′ east longitude, with a total area of 105,500 square kilometers. As of the end of 2022, the resident population of Zhejiang Province was 65.77 million, and its GDP was 7771.5 billion yuan, making it the only province in China where the incomes of residents in all municipalities exceed the national average. Zhejiang Province has two sub-provincial cities, Hangzhou and Ningbo; nine prefecture-level cities of Wenzhou, Jiaxing, Huzhou, Shaoxing, Jinhua, Quzhou, Zhoushan, Taizhou, and Lishui; 37 municipal districts, 20 county-level cities, and 33 counties (one of which is an autonomous county), whose spatial distributions are shown in Figure 1.
2.2. Data and Resources
This study quantitatively analyzes the interaction between transportation infrastructure and economic development by establishing a method for evaluating the adaptability of transportation infrastructure oriented to the actual service effect. The primary data used include the GDP, resident population, and transportation infrastructures including freeways, railways, and civil aviation airports, as well as the operation status of transportation infrastructures according to the V/C (volume-to-capacity ratios for certain types of transportation facilities). The administrative boundary vector data of the province were obtained from the Zhejiang Scientific Research Institute of Transport. The GDP and resident population data were collected from the Zhejiang Statistical Yearbook 2021, released by the Statistics Bureau of Zhejiang Province. The freeway and railroad routes were downloaded from OpenStreetMap, and the airport locations were obtained from the Application Programming Interface of Amap (https://restapi.amap.com/v3/place/text?parameters (accessed on 11 October 2022)). The freeway cross-section traffic data were obtained from the National Arterial Highway Traffic Volume Manual 2019, published by the Transport Planning and Research Institute. The railway-line operating data were provided by the Institute of Comprehensive Transportation of the National Development and Reform Commission. The civil aviation airport passenger throughput data were obtained from the National Civil Transportation Airport Production Statistics Bulletin in 2021.
By the end of 2021, Zhejiang Province had a resident population of 64.68 million and a regional GDP of 6.46 trillion yuan. Hangzhou City ranks first in the province in terms of resident population and regional output value, with 11.97 million people and 1.61 trillion yuan, respectively; Zhoushan City has the lowest resident population and regional GDP, with 1.16 million people and 0.15 trillion yuan, respectively (Figure 2a,b). There are 24 railway lines in Zhejiang Province, with a total business mileage of 3160 km. Among them, there are five high-speed passenger lines, namely, Hukun High-speed Railway, Hangchang High-speed Railway, Hangzhou-Shenzhen Line, Hangzhou-Ningbo Line, and Jinwen Line; and seven passenger and freight lines, namely, Hukun Line, North Ring Line, Beilun Line, Jinqian Line, Jinwen Freight Line, Qujiu Line, and Xiaoyong Line. The province has more than 100 railway stations (Figure 2c). The highway mileage in Zhejiang Province is 123,900 km, and the expressway mileage is 5200 km. The freeway includes 16 national freeways, such as Shenhai Expressway (G15) and Changshen Expressway (G25), and 20 provincial freeways, such as Wenzhou Round City Expressway (S10) and Shanghai–Hangzhou–Ningbo Expressway (S2) (Figure 2d). Zhejiang Province has a total of seven civil aviation transportation airports in operation. The annual passenger throughput in 2019 was 70.1506 million, of which data according for 26.59 million were sent; the cargo and mail throughput was 899,900 tons (Figure 2d).
2.3. Methodology
In this section, we have chosen an appropriate evaluation method to analyze the transportation infrastructure and socioeconomic adaptability, and improved the selected model based on research objectives. The indicators reflecting transportation infrastructure and economic development were selected, and the calculation method was then derived to complete the adaptability analysis of transportation infrastructure and economic development.
2.3.1. The NP Model and the Modification
Delphi method, grayscale correlation, hierarchical analysis, principal-component analysis, and data-envelopment analysis are commonly used to assess the adaptability of different elements. In particular, the node–place (NP) model (Figure 3) is one of the most-used methods to evaluate the adaptability between transportation and related or expected elements [30]. The essence of the traditional node–place model is to divide the plane space into five areas based on the node and place scores [31,32,33,34,35]. The node scores refer to the level of overall development of transportation facilities, and the place scores represent the degree of land development [36]. The category of “balanced” is located almost in the center of the graph, where the node score is moderate and close to the place score. The transportation and land use of the stations of this type are correlated to each other and develop in a balanced manner. The node score of the “dependency” type at the left-bottom of the chart is similar to that of the place score; however, the low values indicate undeveloped transport and land use. In comparison, the “stress” type, with high node and place scores, shows that transport and land use are highly developed and even have intense competition for space. The “unbalanced node” and “unbalanced place” types represent significant differences in the node and place scores. The node score of the “unbalanced node” is higher than the place score, and the regional land use intensity is low, whereas the transportation system is developed well. Conversely, the node score of the “unbalanced place” is lower than the place score, and the regional land use is compact and intensive, whereas the transportation system is underdeveloped.
The NP model integrates two dimensions of features into the same plane and evaluates the adaptability of the features through their relative positions, which is consistent with this study’s objective of assessing transportation and socioeconomic adaptability. However, the NP model proposed by Bertolini initially used an empirical, fuzzy approach to represent the adaptability of a research framework that could not achieve quantitative assessment. Therefore, based on the framework of the NP model, this study proposes evaluation indexes for transportation socioeconomic adaptability to realize the quantitative analysis and provide a basis for transportation infrastructure investment.
According to the NP model, the closer the two-dimensional adaptability of transportation infrastructure indicators and economic development indicators are to the diagonal line represented by y = x, the more coherent the scale of transportation infrastructure is with the social economy. Therefore, we use the distance from a point to a straight line in plane geometry to analyze transportation infrastructure and socioeconomic adaptability. As presented in Figure 4 by points A and C, the distance from point A to the diagonal line represented by y = x (i.e., d1) is much larger than the distance from point C to the diagonal line represented by y = x (i.e., d1), indicating that the transportation infrastructure indicators and economic development indicators are more adaptable in point C than in point A. Therefore, the distance from the two-dimensional coordinate point of a specific type of transportation infrastructure and economic indicators to the diagonal line represented by y = x, in a given region, is utilized to quantify the adaptability (A) of the transportation infrastructure and the socioeconomic characteristics. It is calculated as Equation (1).
where n is the value of the transportation infrastructure indicator, p is the value of the socioeconomic indicator, is the distance from the point to the diagonal line represented by y = x, is used to ensure the absolute value of the adaptability is located in the (0–1) interval. The closer the absolute value of the adaptability A is to 0, the stronger the applicability of the transportation infrastructure and social economy. If A is greater than 0, it indicates that the degree of development of transportation infrastructure is more potent than that of the social economy. Conversely, if A is less than 0, the transportation infrastructure is insufficient or lagging behind.
2.3.2. Transportation Infrastructure Indicators
In order to analyze transportation socioeconomic adaptability according to Equation (1), derived from the NP model, transportation infrastructure indicators must first be identified. As shown in Figure 5, the transportation infrastructure indicator is derived from the accessibility and V/C of railways, freeways, and civil aviation facilities in county-level administrative areas. The accessibility and V/C of county-level areas will be weighted based on the population and regional GDP to determine the accessibility and V/C for the three modes of travel in prefectural cities. Additionally, they are further adjusted based on the travel structure to calculate the comprehensive accessibility (CA) and comprehensive V/C (C-V/C) of the transportation infrastructure in these cities. Finally, prefecture-level cities’ integrated transportation infrastructure development index (ITIDI) is determined through a 1:1 weighting of the CA and C-V/C of the transportation infrastructure.
Accessibility reflects the availability and convenience of transportation infrastructure. We therefore calculated it as the weighted sum of the distances from the resident population of a prefecture-level city to the nearest railway station, freeway, and civil aviation airport. For example, the definition of accessibility for railways is illustrated in Figure 6.
It is assumed that in a county-level region i with an area of Si, a railway (represented by a solid yellow line) passes through region i. The shortest distance from the center of the region i to the railway station is di, and the maximum value of the shortest distance is dmax. The inverse of the standardized shortest distance is taken as the accessibility, i.e., it is assumed that the larger the shortest distance is, the lower the accessibility of the railway facilities in the area. Similarly, if no direct railways are passing through the region, the nearest railway (represented by a yellow dashed line) must exist, and the distance from the regional travel center to the station on that railway must be d’. As d’ tends to infinity, the accessibility tends to 0, indicating that the convenience of rail transportation in the region is very low. Likewise, it implies that the convenience of reaching the region by rail is also very low. The same principle applies to the accessibility of rectangular areas, with variations only in the standardized correction coefficients for distance, which do not impact the relative magnitude of the accessibility value. Considering the possibility that the shortest distance is zero, the accessibility (a) is calculated as follows:
where Si denotes the area of a county-level region i and di refers to the shortest distance from the center of the region i to the railway station. The accessibility of a prefecture-level city is a weighted sum of its county-level regional accessibility, as shown in the following equation:
where ri is the ratio of the population/GDP of a county-level city i to the population/GDP of its prefecture-level city. The accessibility a being closer to 1 indicates higher accessibility, and closer to 0 indicates lower accessibility.
The V/C is obtained by calculating and weighing the ratio of actual traffic flow to the capacity of a specific transport facility, reflecting the capacity utilization of various types of transportation infrastructure. After addressing the issues of availability and accessibility, capacity utilization becomes another critical factor in determining the adaptability of transportation infrastructure. The capacity utilization rate or load degree is an indicator of economy and efficiency, and neither too high nor too low is reasonable; too high indicates that it has become unadaptable, while too low indicates that it is excessively ahead of its time.
2.3.3. Socioeconomic Indicators
There is a high correlation between a city’s economic development level and its transportation development, although this relationship varies according to the industrial structure. To better reflect the interaction between transportation infrastructure conditions and local economic development and considering that GDP per capita is the most direct characterization of a city’s economic development level, this study proposes to use GDP per capita to further analyze the interaction between transportation infrastructure and economic development.
3. Results
3.1. Transportation Infrastructures in Zhejiang, China
3.1.1. Railway
Calculation of the distribution of accessibility and V/C values of railways in county-level cities is shown in Figure 7, where the county with the most excellent accessibility is Tiantai County, Taizhou City (0.98), and the county with the lowest accessibility is Shengsi County, Zhoushan City (0.05). Also, overall, the V/C of the area along the Hukun Expressway is generally higher than that of other areas.
The population-weighted value of the accessibility of railways in Zhejiang Province is 0.62, with the largest prefecture-level city being Quzhou (0.74) and the lowest prefecture-level city being Zhoushan (0.22). The cities where the accessibility of railways is higher than the province’s population-weighted value include Taizhou City, Ningbo City, Huzhou City, Lishui City, Shaoxing City, and Quzhou City; the GDP-weighted value of the accessibility of railways in Zhejiang Province is 0.61, with the largest prefecture-level city being Quzhou (0.75) and the lowest prefecture-level city being Zhoushan (0.21). Cities with higher accessibility than the province’s GDP-weighted value include Ningbo City, Huzhou City, Lishui City, Shaoxing City, and Quzhou City. The population-weighted value of railway V/C in Zhejiang Province is 0.59. The highest prefecture-level city is Quzhou City at 0.79, while the lowest is Zhoushan City at 0.39. Cities with a railway V/C higher than the province’s population-weighted value include Shaoxing, Jinhua, Hangzhou, Huzhou, Jiaxing, and Quzhou. The GDP-weighted V/C value of railways in Zhejiang Province is 0.60. The largest prefecture-level city for railway V/C is Quzhou at 0.80, while the lowest is Zhoushan at 0.38. Cities whose railway V/C is higher than the province’s GDP-weighted value include Shaoxing, Jinhua, Hangzhou, Huzhou, Jiaxing, and Quzhou.
3.1.2. Freeways
Calculating the distribution of freeway accessibility and V/C in county-level cities is shown in Figure 8. The county-level city with the most considerable accessibility is Zhenhai District, Ningbo City (1.00), and the county-level city with the lowest accessibility is Shengsi County, Zhoushan City (0.08).
The population-weighted value of freeway accessibility in Zhejiang Province is 0.78, with the largest prefecture-level city being Huzhou City (0.92) and the lowest prefecture-level city being Zhoushan City (0.45), and the cities with freeway accessibility higher than the province’s population-weighted value include Shaoxing City, Quzhou City, Ningbo City, Jiaxing City, and Huzhou City; the GDP-weighted value of freeway accessibility in Zhejiang Province is 0.77, with the largest prefecture-level city being Huzhou City (0.92) and the lowest prefecture-level city being Zhoushan City (0.44). 0.92), and the lowest prefecture-level city is Zhoushan City (0.44). Cities with freeway accessibility higher than the province’s output-weighted value include Lishui City, Shaoxing City, Quzhou City, Ningbo City, Jiaxing City, and Huzhou City. The population-weighted value of freeway V/C in Zhejiang Province is 0.45, and the largest prefecture-level city is Wenzhou (0.53). The lowest prefecture-level city is Quzhou (0.15), and the cities with freeway V/C higher than the whole province’s population-weighted value include Ningbo, Lishui, Hangzhou, and Wenzhou; the GDP-weighted value of freeway V/C in Zhejiang Province is 0.44, the largest prefecture-level city is Hangzhou (0.55), and the lowest prefecture-level city is Quzhou (0.15), and the cities with freeway V/C higher than the whole province’s GDP-weighted value include Ningbo, Lishui, Hangzhou, and Wenzhou.
3.1.3. Civil Aviation Airports
Calculation of the distribution of accessibility and V/C of civil aviation facilities in county-level cities is shown in Figure 9. The county-level city with the most significant accessibility is Qujiang District of Quzhou City (0.85), and the county-level city with the lowest accessibility is Shengsi County of Zhoushan City (0.06). The V/C of civil aviation facilities in Taizhou Luqiao Airport and the cities around Yiwu Airport show higher values.
The population-weighted value of civil aviation facility accessibility in Zhejiang Province is 0.32, with the largest prefecture-level city being Quzhou City (0.47). The lowest prefecture-level city is Huzhou City (0.20), and the cities whose civil aviation airport accessibility is higher than the province’s population-weighted value include Ningbo City, Taizhou City, Jinhua City, and Quzhou City; the GDP-weighted value of civil aviation airport accessibility in Zhejiang Province is 0.32, with the largest prefecture-level city being Quzhou City (0.47); the lowest prefecture-level city is Huzhou City (0.20). Cities with civil aviation airport accessibility higher than the province’s GDP-weighted value include Ningbo City, Taizhou City, Jinhua City, and Quzhou City. The population-weighted value of the V/C of civil aviation facilities in Zhejiang Province is 1.17, with the largest prefecture-level city being Jinhua (1.46) and the lowest prefecture-level city being Zhoushan (0.76). The cities with a civil aviation facility V/C that is higher than the province’s population-weighted value include Jiaxing City, Huzhou City, Hangzhou City, Shaoxing City, Taizhou City, and Jinhua City; the GDP-weighted value of V/C of civil aviation facilities in Zhejiang Province is 1.17, with the largest prefecture-level cities being Jinhua City (1.44) and Zhoushan City (0.76). The cities whose loads on civil aviation facilities are higher than the GDP-weighted value of the province include Huzhou City, Jiaxing City, Hangzhou City, Shaoxing City, Taizhou City, and Jinhua City.
3.2. Transportation Socioeconomic Adaptability
The prefecture-level cities’ CA and V/C were obtained following the diagram in Figure 5 and are presented in Table 1. According to the conclusion of the NP model shown in Figure 10, Figure 11 presents the adaptability of transportation socioeconomics in each city. Among them, the CA is the highest in Huzhou City, at 0.88, and the lowest in Lishui City, at 0.22; the comprehensive V/C of transportation infrastructure is the highest in Hangzhou City, at 0.61, and the weakest in Quzhou City, at 0.20; the comprehensive development index of transportation infrastructure is the highest in Quzhou City, at 0.81, and the lowest in Zhoushan City, at 0.50.
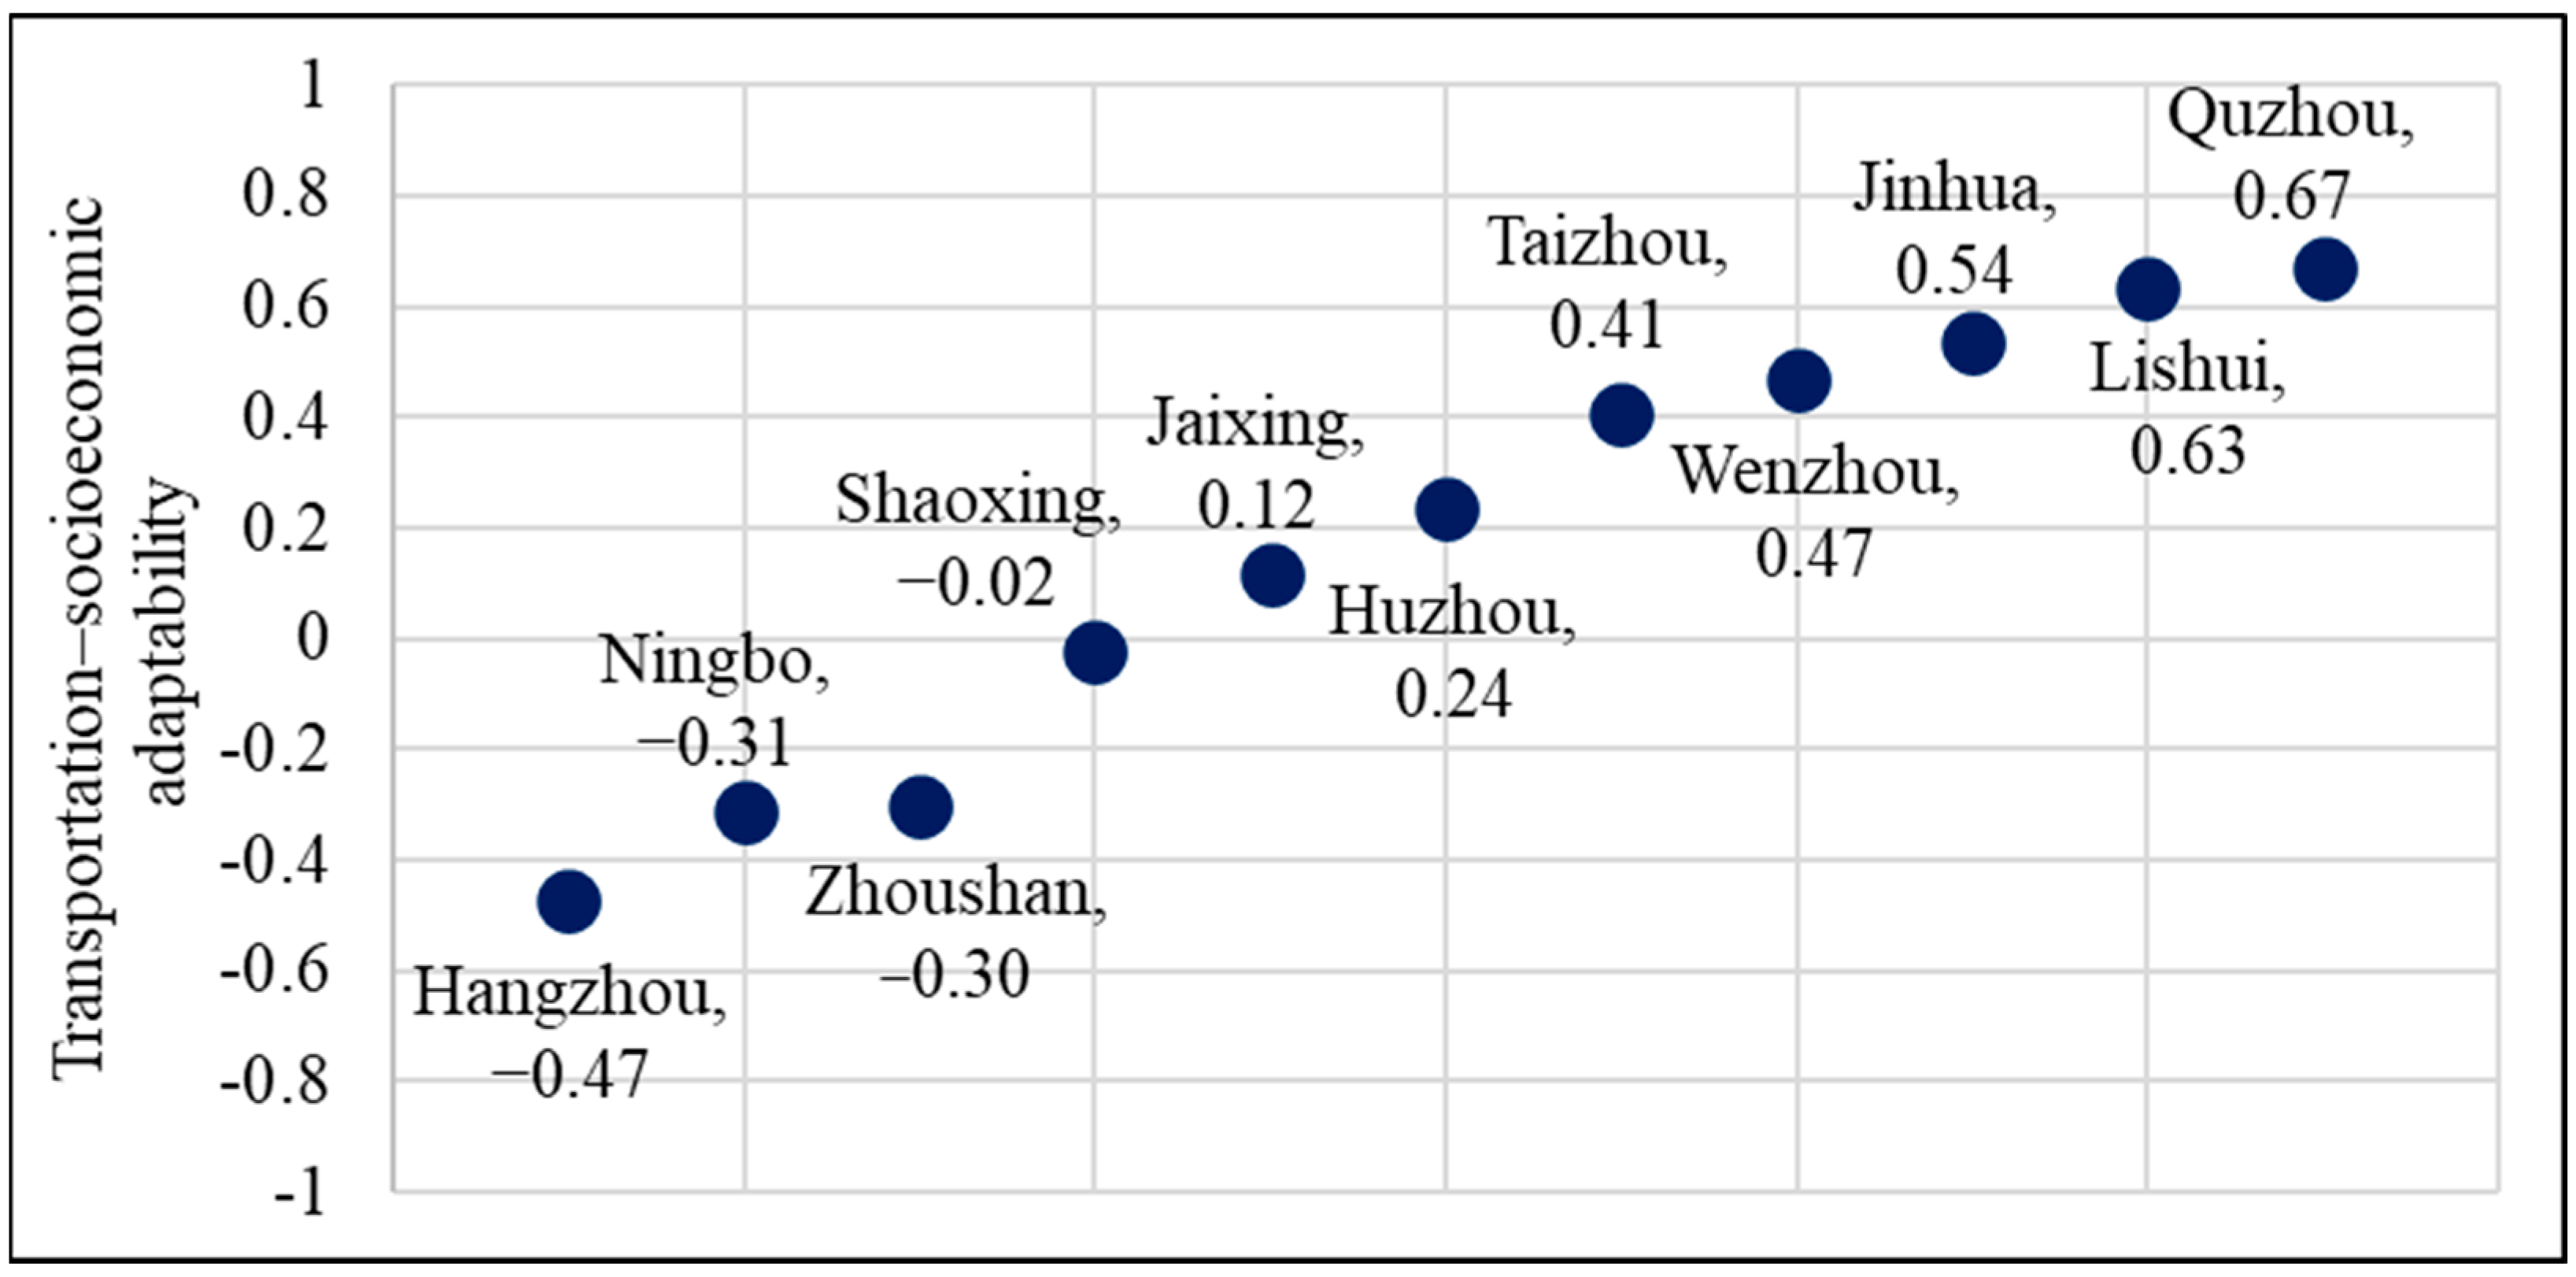
In the context of overall adaptation to the needs of economic development, the relative relationship between the level of transportation infrastructure development and the level of economic development in different prefecture-level cities varies somewhat, and the role of transportation infrastructure in economic development is also different. As shown in Figure 10, the prefectural-level cities in Zhejiang Province did not accord with the general law that transportation infrastructure develops following economic development, indicating that the transportation infrastructure in Zhejiang Province, in general, no longer corresponds to the stage of economic development, forming an apparent bottleneck constraint. Figure 11 shows that the adaptability of Hangzhou, Ningbo, and Zhoushan is negative, indicating that the level of development of transportation infrastructure lags behind the level of economic development, and its efficiency will be better supported if the quality of development can be further improved; the adaptability indexes of Shaoxing are close to zero, indicating that the level of transportation infrastructure development is comparable to the level of economic development, and it is believed that the transportation infrastructure can better support the economic development; Jinhua, Lishui, Quzhou, and other cities’ adaptability indexes are positive, indicating that the level of development of their transportation infrastructure is ahead of the level of economic development. They need to emphasize the leading role of transportation in economic development.
4. Discussion
Overall, in Zhejiang Province, the transportation infrastructure has adapted to economic development requirements. As shown in Figure 11, the majority of the cities’ transportation socioeconomic adaptability indexes are between −0.5 and 0.5, indicating that the stage of transportation infrastructure development is basically the same as the stage of economic growth. In addition, most of the cities have a relatively advanced transportation infrastructure (e.g., Quzhou, Jinhua) with the ability to lead future economic development; in addition to implementing targeted complementary infrastructure short boards, it is increasingly important to enhance the quality of transportation infrastructure from an efficiency point of view, and to continue to enhance the comprehensive development of the transportation system’s effectiveness.
As presented in Figure 10, Quzhou City has a better-integrated transportation infrastructure indicator mainly because its population and industries are closer to railways, freeways, and civil aviation airport facilities and have higher accessibility. In terms of facility loading degree, although the utilization rate of the surrounding railways is already relatively high, the railway passenger and the cargo share in its transport structure are only 12.58% and 2.30%, respectively. At the same time, by comparison, Quzhou City can lead other prefecture-level cities in terms of adaptability indicators, as its level of economic development only ranks 10th in the province. The rapid growth of Quzhou’s transportation infrastructure in recent years is mainly due to its geographical advantage as a “thoroughfare of four provinces and the head of five roads”. Since the “13th Five-Year Plan”, the construction of CNY 65 billion worth of significant transportation projects has been completed in Quzhou City, representing the best growth rate in transportation investment in the province. It has gradually created a “four-in-one” transportation infrastructure system based on the airport, high-speed rail station, ring road, and six-shot-highway network system, better adapted to its function as a regional comprehensive transportation hub city.
Lishui City performed surprisingly well. Lishui City is ranked 9th in the province in terms of economic development level, making it a relatively backward city. Still, because its railways, freeways, and civil aviation airports generally do not have a high load, the overall transportation infrastructure development is ahead of the socioeconomic development level. In recent years, Quzhou City’s transportation infrastructure has been able to develop relatively fast, mainly thanks to the large-scale investment of RMB 47.037 billion during the 13th Five-Year Plan period, which has strongly promoted the construction of many major transportation infrastructure projects, such as the Jinliwen Railway, the Lishui Airport, the Qu-Ning Railway, and the Jintai Railway.
As the capital city of Zhejiang Province, Hangzhou’s resident population and GDP at the end of 2020 were 11.97 million people and CNY 1610.6 billion, respectively, the highest in the province. Hangzhou is the second-largest city in Zhejiang Province in terms of area. Therefore, the population coverage of the transportation infrastructure by all modes is relatively low, with the population coverage of railways being less than 70% and the population coverage of airports being less than 85%. In addition, as an international comprehensive transportation hub, Hangzhou’s transportation infrastructure is based in Zhejiang, radiates across the country, and connects to the world. The transportation infrastructure continually operates at a high capacity, with Hangzhou Xiaoshan International Airport, an international aviation hub, operating in an overloaded state. The lower accessibility of rail and civil aviation transportation infrastructure has pros and cons. The positive aspects lie in the fact that it does not increase the pressure on the current infrastructure, which is already overloaded, and at the same time, it facilitates the transfer of travel demand to rail and civil aviation facilities through neighboring cities and promotes regional population mobility. Regarding the negative aspects, lower accessibility reduces the quality of the travel experience, inconveniences the uncovered areas of the city, and constrains the economic development of peripheral regions.
Ningbo is the economic center of the southern wing of the Yangtze River Delta, an industrial and commercial city in East China, and one of the financial centers of Zhejiang Province. At the end of 2020, the resident population of Ningbo was 9.42 million people, the third-highest in the province; the Gross Regional Product (GRP) was CNY 1241 billion, the second-highest in the province; and the level of economic development was ranked second in the province. There is still room for improvement in the coverage of Ningbo’s transportation infrastructure, with the airport’s population-coverage rate being less than 83%. In addition, similar to Hangzhou, Ningbo is an international comprehensive transportation hub. The operating load of other external transportation infrastructures besides railways is relatively high, especially since Ningbo Lishe International Airport is already operating in a saturated state.
As the smallest prefecture-level city in Zhejiang Province in terms of land area, Zhoushan City’s resident population and GDP at the end of 2020 were 1.16 million people and RMB 151.2 billion, respectively. Zhoushan City, because of its geographical location with the sea on all sides, is currently the only prefecture-level city in the province without railways. External links rely mainly on the Yongzhou high-speed single channel, and land access is not yet fully interconnected with Shanghai and other major cities in the Yangtze River Delta. Because of this, the city-to-railway and city-to-freeway distances in the province are also the largest, and all kinds of facilities for the population coverage are low. The level of sufficient railway and freeway support for economic development is significantly lower than that of other prefecture-level cities. In fact, the transportation infrastructure that supports Zhoushan City’s economic development is maritime transportation. The gross marine product accounts for more than 65% of its GDP, and the cargo throughput of the port area has reached 571 million tons, far exceeding that of other modes of transport.
Railway, freeway, and civil aviation transportation infrastructure in Zhejiang Province has basically adapted to the current economic and social development needs, from the point of view of spatial development of land resources and regional economic development; however, in parts of the region, regarding the coverage of the facilities, there are still prominent short boards, with transportation infrastructure having not yet adapted to the transformation of the regional pattern of economic development, and a need for targeted supplementation of infrastructure shortcomings. First, the short board of facility network coverage includes Dongyang City, Jingning County, Taishun County railway infrastructure, Wuyi County, Suichang County, and Qingyuan County freeway infrastructure. The second is the short board of facility network capacity, such as the Hukun high-speed railway, Hangzhou Metropolitan Area Ring freeway, the Ningbo–Taizhou–Wenzhou freeway Linhai City section, Hangzhou, Ningbo, Taizhou, Yiwu Airport, etc. Currently, the load degree is high, which can be improved by planning and constructing alternative routes, as well as reconstructing and expanding of existing facilities.
5. Conclusions
Based on an improved NP model, this paper proposes a research framework for the adaptability of transportation–social-economy development. Taking Zhejiang Province as an example, a quantitative assessment of the adaptability of transportation infrastructure and economic development is conducted, addressing the weaknesses of transportation infrastructure within the context of current social and economic development and providing a basis for optimizing economic investment decisions regarding transportation infrastructure. The research reveals that the transportation infrastructure in Zhejiang Province generally meets the requirements of economic development, with most cities having relatively advanced transportation infrastructure. Alongside targeted supplementation of infrastructure shortcomings, it is crucial to improve quality from an efficiency perspective and continually enhance the efficiency of the integrated transportation system. For instance, due to its proximity to railway, freeway, and aviation facilities, Quzhou city exhibits high accessibility, and its transportation development indicators are relatively advanced compared to social and economic development levels. Conversely, Hangzhou, with a larger area, has relatively lower coverage of transportation infrastructure, particularly railway and airport coverage, indicating a slight lag in transportation infrastructure compared to social and economic development. Finally, the paper provides development policy recommendations, including addressing infrastructure gaps, enhancing overall efficiency, promoting green and low-carbon development, and embracing intelligent transformation. Overall, this study serves as a basis for economic investment decisions in transportation infrastructure in Zhejiang Province and contributes to exploring the theoretical relationship between transportation and the economy.
This study assesses the adaptability between transportation infrastructure (railways, freeways, and civil aviation) and socio-economy, using the city as the spatial unit for analysis. However, transportation infrastructure also includes intra-city transportation infrastructure, such as urban roads and urban rail transit lines, which are not included in this study. In addition, this study merely uses GDP to indicate the level of economic development and analyze its coordination with transportation infrastructure. At the same time, different industrial structures have various relationships with transportation infrastructure, and different industrial structure characteristics have differentiated requirements for transportation infrastructure facilities. Therefore, the subsequent research can further analyze the adaptability of transportation infrastructure and economic development within the city by combining the data on urban public transportation. On the other hand, since the relationship between transportation infrastructure and economic development is dynamic, the subsequent data can be continually accumulated to complete the roll-up assessment of the relationship and, from the time dimension, analyze the reasons why transportation infrastructure and economic development are coordinated or uncoordinated at a particular historical stage, which is conducive to finding the political, economic, and cultural characteristics that promote the synergistic development of the two. In addition, since different industrial structures have different requirements for transportation infrastructure facilities, subsequent research needs to anchor itself in a specific economic structure to analyze the coordinated characteristics of the two and to realize the coordinated structural development of transportation infrastructure and the economy.
Author Contributions
Conceptualization, S.L. and J.S.; methodology, S.L. and J.S.; validation, J.S. and S.W.; formal analysis, J.S. and S.W.; resources, S.W.; writing—original draft preparation, J.S. and S.L.; writing—review and editing, S.W. and C.Z.; funding acquisition, S.L. All authors have read and agreed to the published version of the manuscript.
Funding
The project was supported by Open Fund of the Key Laboratory of Highway Engineering of Ministry of Education (Changsha University of Science & Technology), grant number kfj230303.
Institutional Review Board Statement
Not applicable.
Informed Consent Statement
Not applicable.
Data Availability Statement
Data will be made available on request.
Conflicts of Interest
The authors declare no conflicts of interest.
References
- Zhu, Z.; Zhang, X.; Xue, M.; Song, Y. Eco-Efficiency and Its Evolutionary Change under Regulatory Constraints: A Case Study of Chinese Transportation Industry. Sustainability 2023, 15, 7381. [Google Scholar] [CrossRef]
- Wang, Y.; Zhou, Y.; Zhu, L.; Zhang, F.; Zhang, Y. Influencing Factors and Decoupling Elasticity of China’s Transportation Carbon Emissions. Energies 2018, 11, 1157. [Google Scholar] [CrossRef]
- Tong, Q.; Zhang, L.; Liu, J. Transportation Infrastructure and Common Prosperity from the Perspective of Chinese-Style Modernization: Enabling Effects and Advancement Paths. Sustainability 2024, 16, 1677. [Google Scholar] [CrossRef]
- Zhao, B.; Wang, N.; Wang, Y. The Role of Different Transportation Modes in China’s National Economy: An Input–Output Analysis. Transp. Policy 2022, 127, 92–102. [Google Scholar] [CrossRef]
- Glaeser, E.L.; Ponzetto, G.A.M. The Political Economy of Transportation Investment. Econ. Transp. 2018, 13, 4–26. [Google Scholar] [CrossRef]
- Chanieabate, M.; He, H.; Guo, C.; Abrahamgeremew, B.; Huang, Y. Examining the Relationship between Transportation Infrastructure, Urbanization Level and Rural-Urban Income Gap in China. Sustainability 2023, 15, 8410. [Google Scholar] [CrossRef]
- Jiang, X.; He, X.; Zhang, L.; Qin, H.; Shao, F. Multimodal Transportation Infrastructure Investment and Regional Economic Development: A Structural Equation Modeling Empirical Analysis in China from 1986 to 2011. Transp. Policy 2017, 54, 43–52. [Google Scholar] [CrossRef]
- Mwale, M.; Luke, R.; Pisa, N. Factors That Affect Travel Behaviour in Developing Cities: A Methodological Review. Transp. Res. Interdiscip. Perspect. 2022, 16, 100683. [Google Scholar] [CrossRef]
- Ali, R.; Bakhsh, K.; Yasin, M.A. Causal Nexus between Air Transportation and Economic Growth in BRICS Countries. J. Air Transp. Manag. 2023, 107, 102335. [Google Scholar] [CrossRef]
- National Bureau of Statistics of China. Statistical Bulletin on National Economic and Social Development of the People’s Republic of China in 2019; National Bureau of Statistics of China: Beijing, China, 2020. [Google Scholar]
- Zhao, B.; Wu, H.; Wang, N. Changing Characteristics of the Industrial Correlation and Economic Contribution of Air Transport in China: An Input–Output Analysis. J. Air Transp. Manag. 2022, 104, 102275. [Google Scholar] [CrossRef]
- Baldwin, R.E.; Martin, P. Agglomeration and Regional Growth. In Handbook of Regional and Urban Economics; North-Holland: Amsterdam, The Netherlands, 2004; Volume 4, pp. 2671–2711. ISBN 9780444509673. [Google Scholar]
- Holtz-Eakin, D.; Schwartz, A.E. Spatial Productivity Spillovers from Public Infrastructure: Evidence from State Highways. Int. Tax Public Financ. 1995, 2, 459–468. [Google Scholar] [CrossRef]
- Gallen, T.S.; Winston, C. Transportation Capital and Its Effects on the U.S. Economy: A General Equilibrium Approach. J. Macroecon. 2021, 69, 103334. [Google Scholar] [CrossRef]
- Kasu, B.B.; Chi, G. Transportation Infrastructures and Socioeconomic Statuses: A Spatial Regression Analysis at the County Level in the Continental United States, 1970–2010. Spat. Demogr. 2019, 7, 27–56. [Google Scholar] [CrossRef] [PubMed]
- Pradhan, R.P.; Arvin, M.B.; Nair, M. Urbanization, Transportation Infrastructure, ICT, and Economic Growth: A Temporal Causal Analysis. Cities 2021, 115, 103213. [Google Scholar] [CrossRef]
- Agbelie, B.R.D.K. An Empirical Analysis of Three Econometric Frameworks for Evaluating Economic Impacts of Transportation Infrastructure Expenditures across Countries. Transp. Policy 2014, 35, 304–310. [Google Scholar] [CrossRef]
- He, D.; Yin, Q.; Zheng, M.; Gao, P. Transport and Regional Economic Integration: Evidence from the Chang-Zhu-Tan Region in China. Transp. Policy 2019, 79, 193–203. [Google Scholar] [CrossRef]
- Ding, C. Transport Development, Regional Concentration and Economic Growth. Urban Stud. 2013, 50, 312–328. [Google Scholar] [CrossRef]
- Zhang, Y.; Cheng, L. The Role of Transport Infrastructure in Economic Growth: Empirical Evidence in the UK. Transp. Policy 2023, 133, 223–233. [Google Scholar] [CrossRef]
- Saidi, S.; Hammami, S. Modeling the Causal Linkages between Transport, Economic Growth and Environmental Degradation for 75 Countries. Transp. Res. Part D Transp. Environ. 2017, 53, 415–427. [Google Scholar] [CrossRef]
- Shen, S.; Li, H.; Li, M. Transportation Infrastructure and Digital Economy—Evidence from Chinese Cities. Sustainability 2023, 15, 16024. [Google Scholar] [CrossRef]
- Tan, R.; Pan, L.; Xu, M.; He, X. Transportation Infrastructure, Economic Agglomeration and Non-Linearities of Green Total Factor Productivity Growth in China: Evidence from Partially Linear Functional Coefficient Model. Transp. Policy 2022, 129, 1–13. [Google Scholar] [CrossRef]
- Wang, F.; Liu, Z.; Xue, P.; Dang, A. High-Speed Railway Development and Its Impact on Urban Economy and Population: A Case Study of Nine Provinces along the Yellow River, China. Sustain. Cities Soc. 2022, 87, 104172. [Google Scholar] [CrossRef]
- Xu, M.I.N.G.; Feng, Y.U.A.N. How Transportation Infrastructure Affects Firm Productivity? Evidence from China. China Econ. Q. Int. 2022, 2, 55–69. [Google Scholar] [CrossRef]
- Ma, J.; Zhao, Y. Study on the Adaptability of the Level of Urban Transportation Infrastructure and Economic Development. Appl. Mech. Mater. 2013, 361–363, 1950–1953. [Google Scholar] [CrossRef]
- Li, Q.; Zhan, B.; Zhang, Q.B. The Analysis of Feasibility between Waterway Transportation and Economy of Hubei Province Based on DEA Model. Adv. Mater. Res. 2013, 694–697, 3333–3335. [Google Scholar] [CrossRef]
- He, H.; Luo, W. The Adaptability Research of Regional Airports and County Economy Based on PCA—Taking Sichuan as an Example. In Proceedings of the CICTP 2021, Reston, VA, USA, 14 December 2021; American Society of Civil Engineers: Reston, VA, USA; pp. 1934–1942. [Google Scholar]
- He, H.; Han, Z.; He, X.; Wang, S. The Analysis of Socioeconomic Adaptability of China’ s Civil Aviation Development. IOP Conf. Ser. Earth Environ. Sci. 2020, 587, 012111. [Google Scholar] [CrossRef]
- Bertolini, L. Spatial Development Patterns and Public Transport: The Application of an Analytical Model in the Netherlands. Plan. Pract. Res. 1999, 14, 199–210. [Google Scholar] [CrossRef]
- Vale, D.S. Transit-Oriented Development, Integration of Land Use and Transport, and Pedestrian Accessibility: Combining Node-Place Model with Pedestrian Shed Ratio to Evaluate and Classify Station Areas in Lisbon. J. Transp. Geogr. 2015, 45, 70–80. [Google Scholar] [CrossRef]
- Monajem, S.; Ekram Nosratian, F. The Evaluation of the Spatial Integration of Station Areas via the Node Place Model; an Application to Subway Station Areas in Tehran. Transp. Res. Part D Transp. Environ. 2015, 40, 14–27. [Google Scholar] [CrossRef]
- Olaru, D.; Moncrieff, S.; McCarney, G.; Sun, Y.; Reed, T.; Pattison, C.; Smith, B.; Biermann, S. Place vs. Node Transit: Planning Policies Revisited. Sustainability 2019, 11, 477. [Google Scholar] [CrossRef]
- Reusser, D.E.; Loukopoulos, P.; Stauffacher, M.; Scholz, R.W. Classifying Railway Stations for Sustainable Transitions—Balancing Node and Place Functions. J. Transp. Geogr. 2008, 16, 191–202. [Google Scholar] [CrossRef]
- Zemp, S.; Stauffacher, M.; Lang, D.J.; Scholz, R.W. Classifying Railway Stations for Strategic Transport and Land Use Planning: Context Matters! J. Transp. Geogr. 2011, 19, 670–679. [Google Scholar] [CrossRef]
- Liu, S.; Rong, J.; Zhou, C.; Bian, Y. Probability -Based Typology for Description of Built Environments around Urban Rail Stations. Build. Environ. 2021, 205, 108193. [Google Scholar] [CrossRef]
Figure 1.
Research area.

Figure 2.
Transportation and socioeconomic data in Zhejiang. (a) Population distribution. (b) Regional GPD distribution. (c) Railway transit facilities. (d) Freeway and civil aviation airports.
Figure 2.
Transportation and socioeconomic data in Zhejiang. (a) Population distribution. (b) Regional GPD distribution. (c) Railway transit facilities. (d) Freeway and civil aviation airports.


Figure 3.
Node–place model [30].
Figure 3.
Node–place model [30].

Figure 4.
Theoretical model of transportation socioeconomic adaptability.
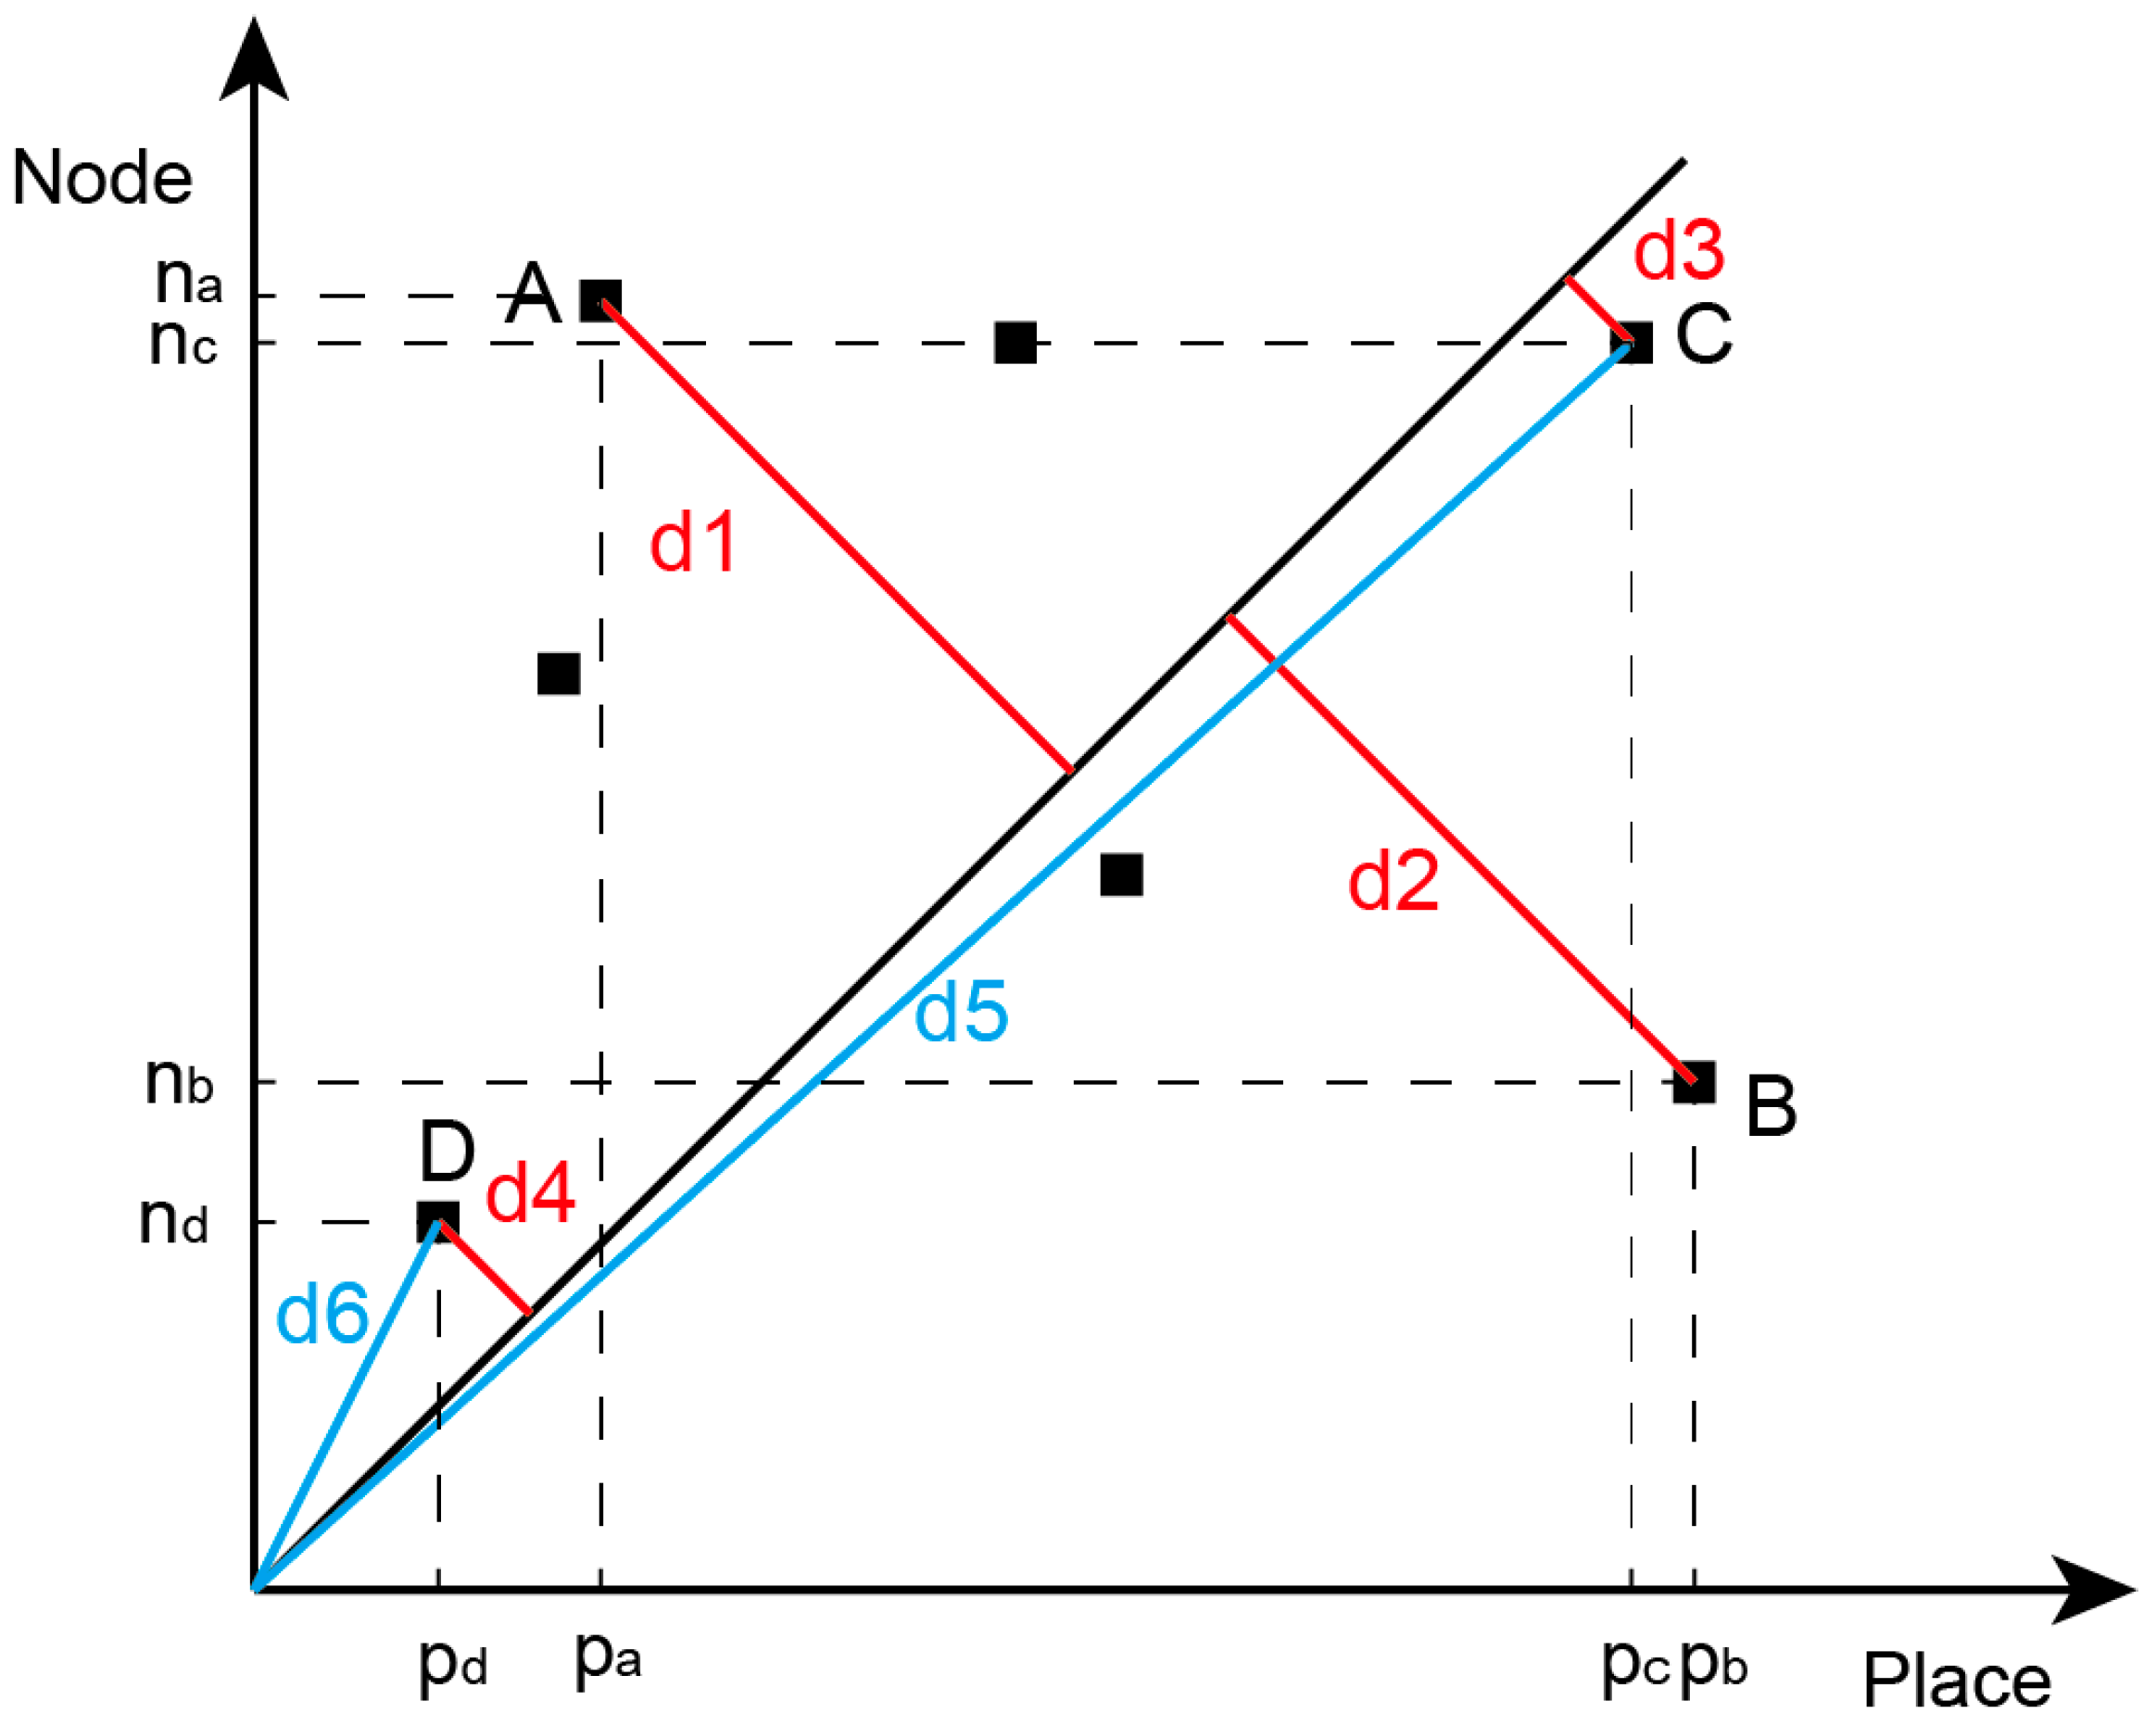
Figure 5.
Transportation infrastructure indicator.

Figure 6.
Definition of accessibility.

Figure 7.
Accessibility and V/C of railway. (a) Accessibility of railway. (b) V/C of railway.

Figure 8.
Accessibility and V/C of freeways. (a) Accessibility freeways. (b) V/C of freeways.

Figure 9.
Accessibility and V/C of civil aviation facilities. (a) Accessibility of civil aviation facility. (b) V/C of civil aviation facility.
Figure 9.
Accessibility and V/C of civil aviation facilities. (a) Accessibility of civil aviation facility. (b) V/C of civil aviation facility.
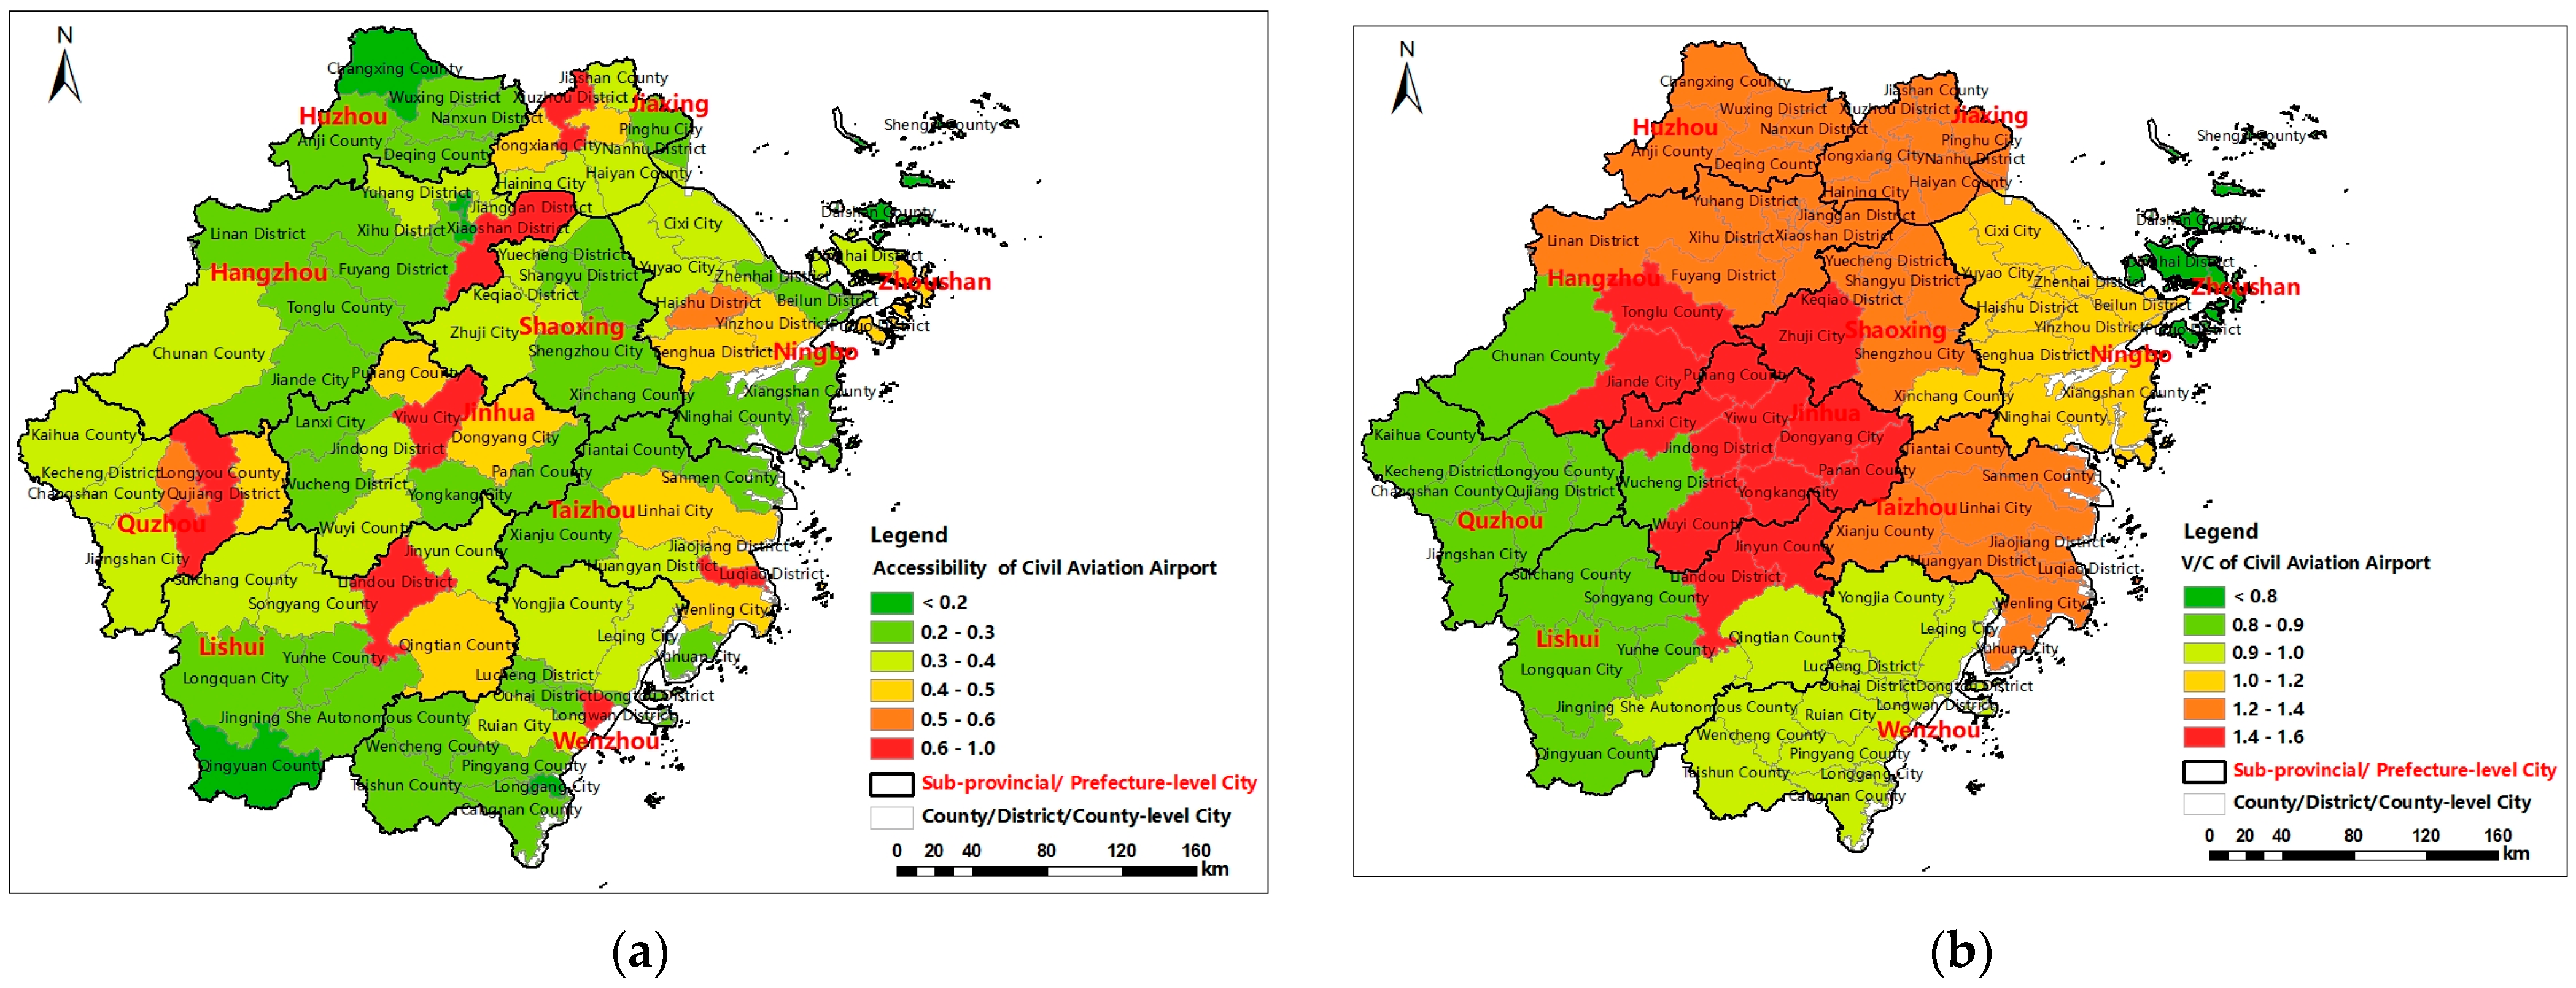
Figure 10.
The NP model of transportation and socioeconomics.
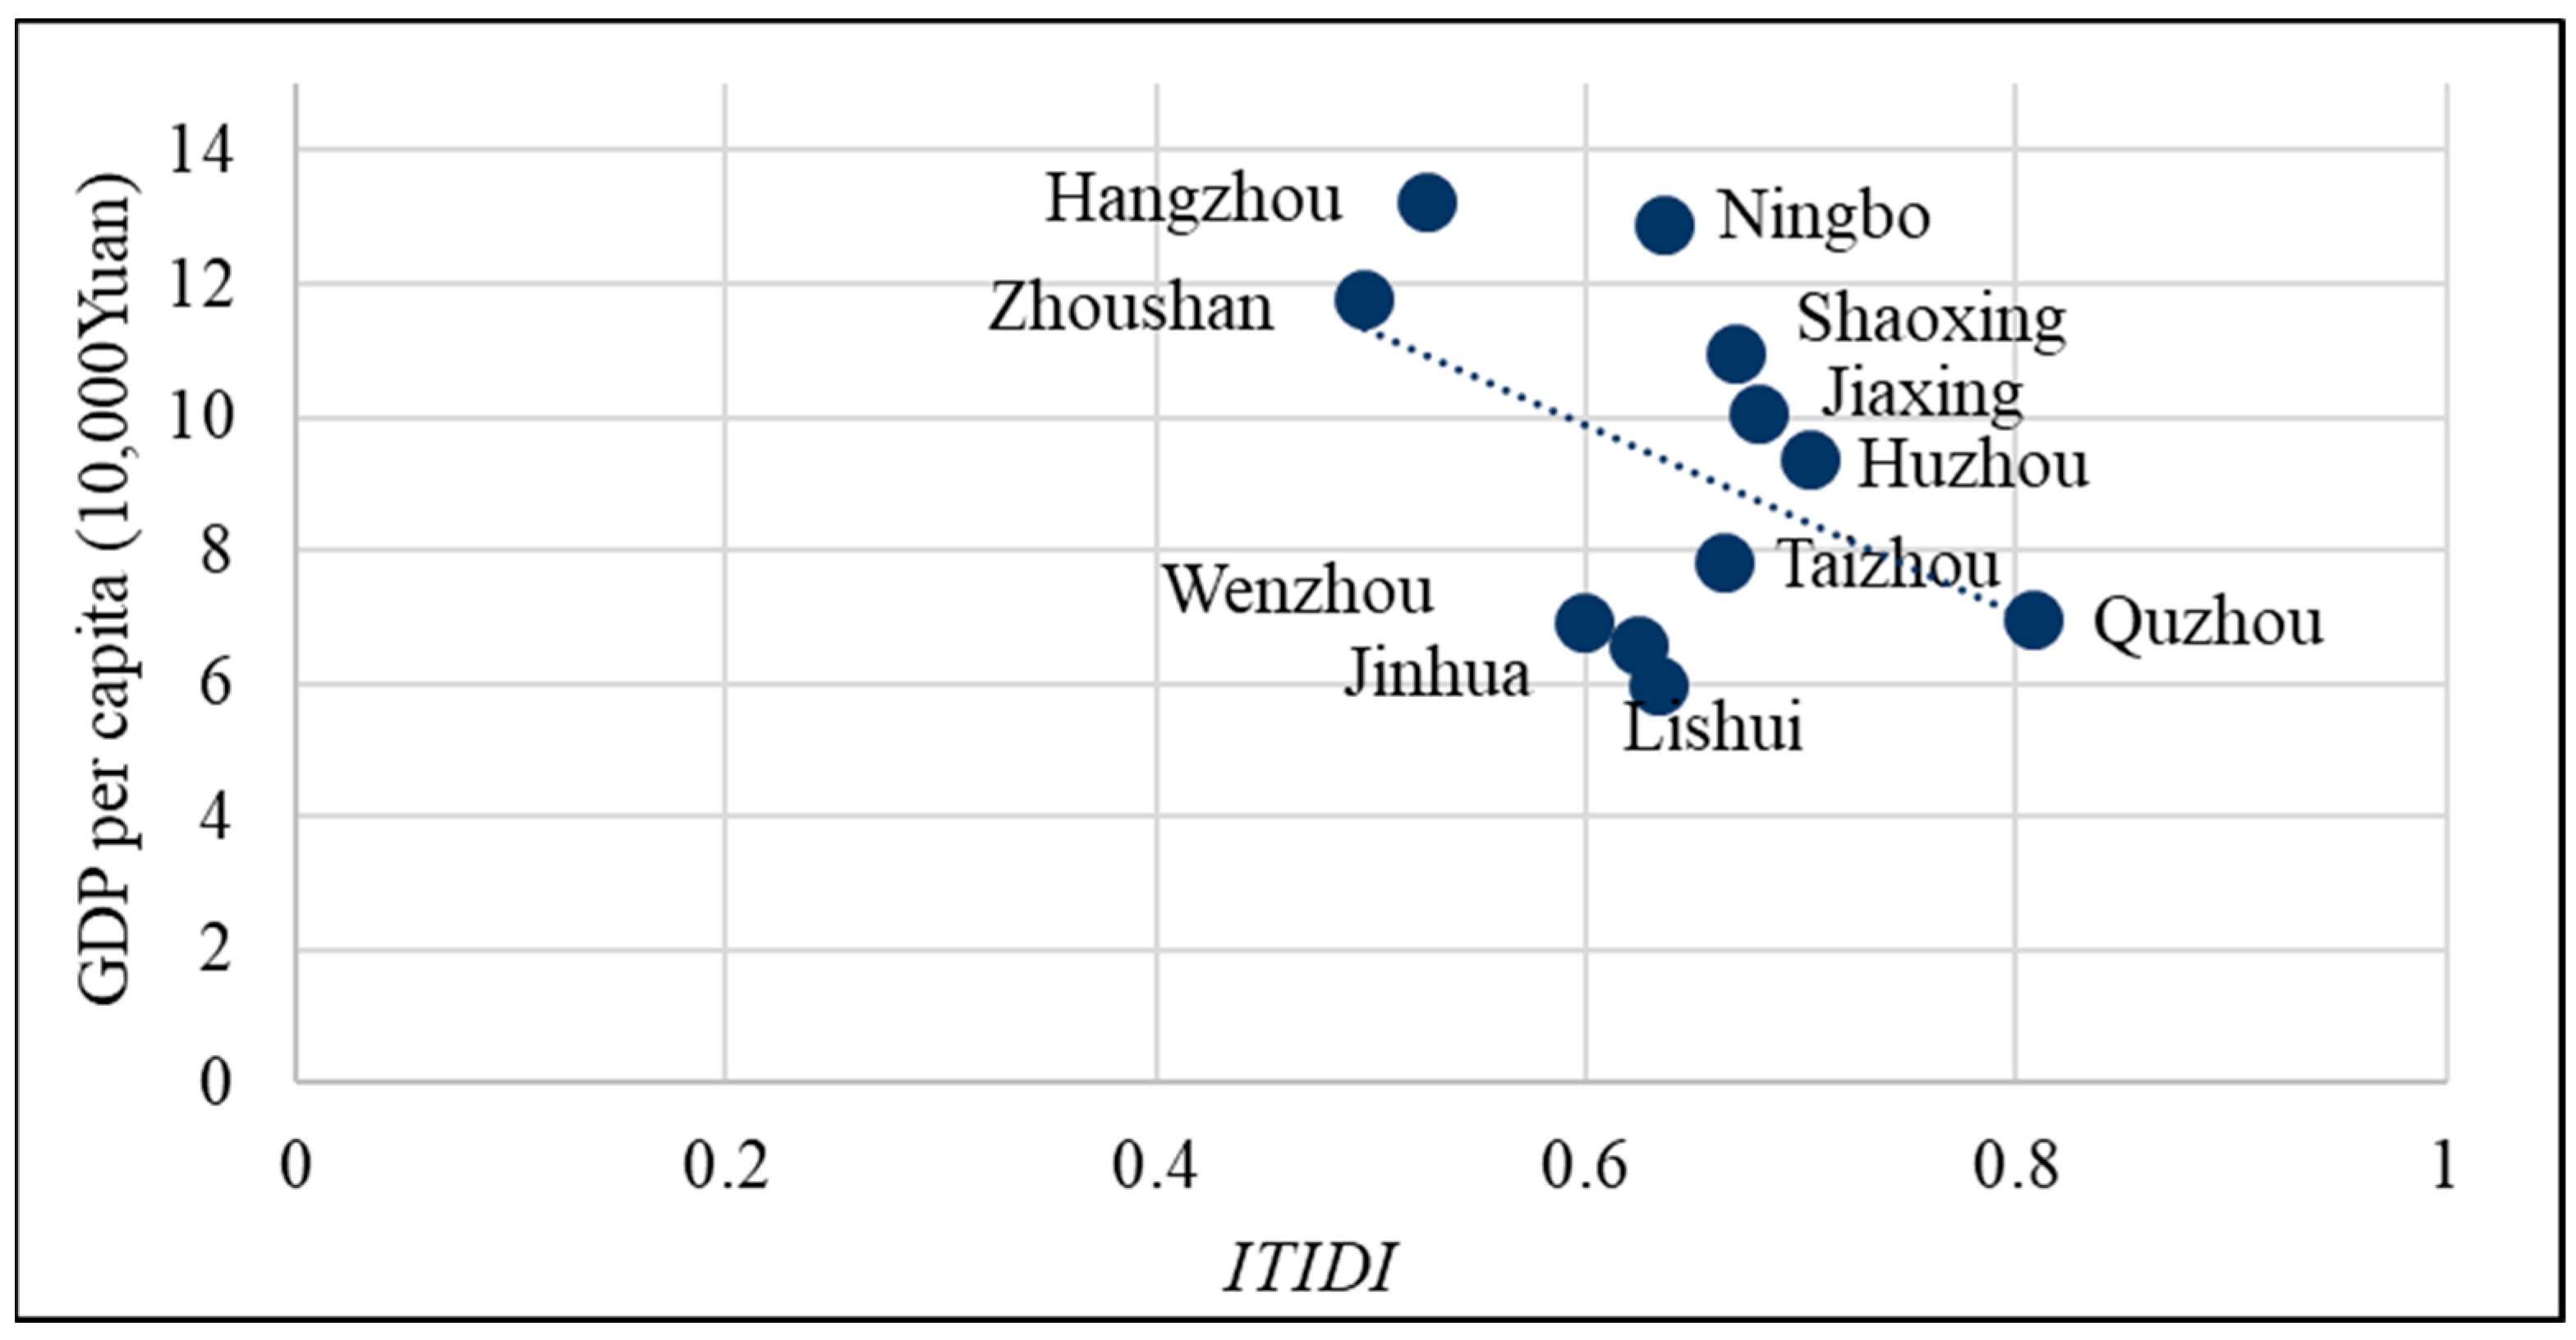
Figure 11.
Transportation–socioeconomic adaptability.

Table 1.
Transportation infrastructure indicators.
| City | Accessibility | Capacity Utilization | ITIDI | ||||||
|---|---|---|---|---|---|---|---|---|---|
| Railway | Freeway | Civil Aviation | CA | Railway | Freeway | Civil Aviation | C-V/C | ||
| Hangzhou | 0.59 | 0.71 | 0.30 | 0.66 | 0.72 | 0.53 | 1.23 | 0.61 | 0.53 |
| Huzhou | 0.66 | 0.92 | 0.20 | 0.88 | 0.75 | 0.41 | 1.22 | 0.47 | 0.70 |
| Jiaxing | 0.60 | 0.85 | 0.22 | 0.81 | 0.75 | 0.38 | 1.22 | 0.45 | 0.68 |
| Jinhua | 0.59 | 0.70 | 0.42 | 0.69 | 0.69 | 0.40 | 1.45 | 0.44 | 0.62 |
| Lishui | 0.68 | 0.76 | 0.22 | 0.75 | 0.38 | 0.50 | 1.12 | 0.48 | 0.63 |
| Ningbo | 0.65 | 0.85 | 0.36 | 0.76 | 0.50 | 0.44 | 1.03 | 0.49 | 0.64 |
| Quzhou | 0.75 | 0.83 | 0.47 | 0.82 | 0.80 | 0.15 | 0.81 | 0.20 | 0.81 |
| Shaoxing | 0.73 | 0.82 | 0.31 | 0.80 | 0.64 | 0.42 | 1.28 | 0.46 | 0.67 |
| Taizhou | 0.61 | 0.76 | 0.41 | 0.75 | 0.43 | 0.42 | 1.38 | 0.42 | 0.66 |
| Wenzhou | 0.56 | 0.74 | 0.30 | 0.73 | 0.41 | 0.53 | 0.95 | 0.53 | 0.60 |
| Zhoushan | 0.21 | 0.44 | 0.31 | 0.41 | 0.43 | 0.41 | 0.76 | 0.42 | 0.50 |
Disclaimer/Publisher’s Note: The statements, opinions and data contained in all publications are solely those of the individual author(s) and contributor(s) and not of MDPI and/or the editor(s). MDPI and/or the editor(s) disclaim responsibility for any injury to people or property resulting from any ideas, methods, instructions or products referred to in the content. |
© 2024 by the authors. Licensee MDPI, Basel, Switzerland. This article is an open access article distributed under the terms and conditions of the Creative Commons Attribution (CC BY) license (https://creativecommons.org/licenses/by/4.0/).
Share and Cite
MDPI and ACS Style
Shi, J.; Wang, S.; Liu, S.; Zhou, C. Unveiling Transportation Socio-Economic Adaptability Using a Node–Place Model: A Case from Zhejiang Province, China. Sustainability 2024, 16, 4009. https://doi.org/10.3390/su16104009
AMA Style
Shi J, Wang S, Liu S, Zhou C. Unveiling Transportation Socio-Economic Adaptability Using a Node–Place Model: A Case from Zhejiang Province, China. Sustainability. 2024; 16(10):4009. https://doi.org/10.3390/su16104009
Chicago/Turabian StyleShi, Jianwei, Shuwei Wang, Siyang Liu, and Chenjing Zhou. 2024. "Unveiling Transportation Socio-Economic Adaptability Using a Node–Place Model: A Case from Zhejiang Province, China" Sustainability 16, no. 10: 4009. https://doi.org/10.3390/su16104009
Note that from the first issue of 2016, this journal uses article numbers instead of page numbers. See further details here.