
Response of Soil Moisture to Four Rainfall Regimes and Tillage Measures under Natural Rainfall in Red Soil Region, Southern China
1
College of Water Conservancy and Hydropower Engineering, Hohai University, Nanjing 210024, China
2
Jiangxi Provincial Key Laboratory of Soil Erosion and Prevention, Jiangxi Academy of Water Science and Engineering, Nanchang 330029, China
3
Jiangxi Provincial Technology Innovation Center for Ecological Water Engineering in Poyang Lake Basin, Nanchang 330029, China
4
College of Agricultural Engineering, Hohai University, Nanjing 210024, China
*
Author to whom correspondence should be addressed.
Water 2024, 16(10), 1331; https://doi.org/10.3390/w16101331
Submission received: 31 March 2024
/
Revised: 1 May 2024
/
Accepted: 3 May 2024
/
Published: 7 May 2024
Abstract
:Investigating the effects of natural rainfall on the soil moisture for sloping farmland is extremely important for comprehending a variety of hydrological processes. Rainfall regimes can elicit different responses to soil moisture at the depth of soil layers, and the responses may differ depending on the landscape position of the sloping farmland. This paper utilized the surface runoff natural rainfall and soil moisture measured on sloping farmland with conventional tillage and contour tillage in the red soil area of China to investigate the influence of natural rainfall events on soil moisture content and to evaluate if the response results were consistent across the four rainfall regimes. Natural rainfall events were classified into different four regimes in line with rainfall duration, rainfall amount, and the maximum 30 min rainfall intensity (I30) by the k-means clustering method, including advanced, intermediate, uniform and delayed regimes. The result showed that the advanced regime was the predominant one in the study area, which represented 45.9% of the total rainfall events. The rainfall regimes influenced the surface runoff coefficient and runoff depth on sloping farmland for conventional and contour tillage, with the uniform regime generating the highest runoff coefficient (5.20% and 5.82%) and runoff depth (2.00% and 2.05%), respectively. For the conventional tillage, soil moisture at a depth of 0–20 cm increased appreciably when the rainfall amount was larger than 20 mm and larger than 30 mm for the advanced regime. For the contour tillage, soil moisture in 20–40 cm layer increased for the advanced regime when the rainfall amount was larger than 15 mm and 30 mm, while the values were modified with rainfall duration and the antecedent dry day (ADD). A longer rainfall duration had a more obvious effect on soil moisture increasing in deep soil. At a depth of 20 cm, the ADD showed an appreciably positive correlation with the increment in soil moisture, which means that a brief ADD produces a compounding effect for a natural rainfall event. The present results underline the complexity of the effect of the rainfall events on soil moisture under two tillage measures for different rainfall regimes and suggest that the advanced regime significantly affects the distinction of soil moisture and the contour tillage can effectively reduce soil water loss and enhance water storage on the sloping farmland with red soil, presenting a theoretical basis for local soil and water conservation research and sloping farmland conservation tillage management.
1. Introduction
Water quantity held in an unsaturated soil zone is generally known as soil moisture [1,2], which is essential to eco-hydrological processes, with a strong effect on ecosystem development, plant growth, runoff response and precipitation distribution between evapotranspiration and deep infiltration [3,4,5,6,7]. As a link between the edaphic zone and the atmosphere, soil moisture has important interactions with the climate system and has a significant influence on the evapotranspiration and soil erosion of sloping tillage, so an understanding of soil moisture dynamics is essential to comprehending changes in hydrothermal conditions and horizontal fluxes of moisture (e.g., runoff for tillage) [4,8,9,10].
Soil moisture usually presents complex spatial and temporal variations due to the influence of several factors, such as climate, soil heterogeneity, tillage management practices and rainfall regime [7,11,12,13,14]. In Southern China, where the red soil area is widely distributed and rainfall is usually intense, concentrated and unevenly distributed over the seasons, it is estimated that the existing cultivated land area is 40.26 km2, where sloping tillage is a vastly important arable land source [15,16]. Xin et al. [17] explore the characteristics of the spatial and temporal distribution of the soil moisture of small slopes with red soil, and it was shown that soil moisture was closely connected to rainfall and rainfall frequency in terms of temporal characteristics. The significant variation in environmental elements across diverse scales led to the temporal and spatial changes in soil moisture [18,19]. Consequently, given the combined impacts of these variables, it is imperative to carry out further research on the influence of soil moisture and to understand the response of soil moisture on natural rainfall, which is a crucial part in the hydrologic cycle process.
Numerous methods have been employed for analyzing soil moisture, including sampling and oven-drying methods, time domain reflectometry [20], capacitance measurements [21], neutron probes [22] and ground-penetrating radar [23]. Ground-penetrating radar (GPR) and time domain reflectometry (TDR) have been useful in measuring small-scale processes or for simulations [24,25,26,27,28]. For a more comprehensive knowledge and accurate model predictions, the soil moisture findings from simulated or isolated rainfall events are crucial, while natural rainfall and field surveys provide data that are closer to reality over a long period of time. Seasonally distinct rainfall regimes in different climates and the dissimilarities of the hydrological response of vertical soil layers in diverse soils result in significant differences in their soil moisture, such as the red soil region [29,30,31], purple soil region [26,32], Loess plateau area [33,34] and montane grey soil [35]. In conclusion, long-term field observations of water storage in different soil layers of sloping tillage have been comparatively rare in the region of red soil; thus further data are essential for soil moisture and natural rainfall, as well as water management.
On a small cultivation scale, the spatial and temporal alterations in soil moisture heavily rely on rainfall characteristics and regimes for sloping tillage is a paramount water source for crop production [14,36]. Modifying rainfall regimes will influence soil moisture variations, which could have an impact on terrestrial ecosystems by influencing crop growth [4,37]. The depth of response to rainfall increases with increasing rainfall, and the soil moisture content response to single rainfall events decreases with the soil depth increasing. By and large, low rainfall can effectually replenish surface soil moisture, while a higher rainfall increases soil moisture and permits water infiltration into deep soil and also has a significant impact on soil water storage [4,38,39,40]. Nevertheless, understanding the reaction of soil moisture to rainfall events entails not just observing a direct change in state but it is a dynamic process, which is influenced by rainfall, rainfall duration, rainfall intensity, the antecedent dry day, and the antecedent cumulative rainfall [41,42,43]. Some studies have considered different rainfall regimes and found that the rainfall process with moderate rainfall intensity, long duration and heavy rainfall entails a full replenishing process for soil moisture, and the soil moisture content is stable for a long time, while a short-term rainstorm has a small compensation effect on soil water deficit [4,44]. All in all, recent research has focused on how rainfall intensity affects soil moisture [45,46,47], but few research has been studied on the reaction of the soil moisture of different layers to the characteristics of the rainfall process.
A single-field natural rainfall is an extremely dynamic and complicated process. Rainfall is not uniformly distributed throughout space and time, which means that the same location may have different rainfall intensities and rainfall distributions at different times [48,49]. In previous field studies, the recorded rainfall events were merely categorized into several regimes based solely on rainfall intensity, duration intensity and duration [50,51]. Furthermore, because of a paucity of long-term information on rainfall processes, it is challenging to extend findings from earlier studies using simulated rainfall to natural rainfall settings, so the rainfall regimes are often designed to be uniform regimes. However, in an artificial rainfall experiment, compared with the constant change in instantaneous rainfall intensity during rainfall, the runoff coefficient and peak discharge increased significantly [52]. Studying natural rainfall is required to investigate the connection between rainfall regimes and soil moisture.
To develop the original Huff curve, Huff [53] employed the 12-year data of 49 rain gauges, and Huff curves are dimensionless cumulative hyetographs associated with a predetermined probability of occurrence. According to the Huff curve, the rainfall calendar is divided into four time periods, and the rainfall type is referred to as the rainfall type according to one of the four time periods of the rainfall calendar in which the peak rainfall intensity occurs [53]. Azli and Rao [54] showed that there is little variation in the Huff curve across Malaysia and that the majority of the rainfall is concentrated in the second quarter during one rainfall process. Aquino et al. [55] found that an advanced pattern dominated among these three regimes (advanced, delayed and intermediate) in Brazil. The distribution of different rainfall regimes varies in different regions. In fact, there may remain one or two common rainfall regimes for some areas. In the south of Africa, for example, about 84% of the highest intensity of rainfall occurs in first half of the rainfall duration [56]. In China, prevalent rainfall regimes are advanced, which account for 43% of all rainfall events [57]. To acquire greater knowledge of the hydrological processes caused by natural rainfall, investigating the influence of different rainfall regimes on soil moisture is necessary.
Comprehending the temporal–spatial changeability of the soil moisture is crucial for both scientific and practical application, as well as for improved water management [58,59,60]. However, it is important to consider the responses of soil moisture to different rainfall regimes with the sloping tillage in Southern China. For the present study, two tillage managements were used in the runoff plot of red soil: conventional tillage and contour tillage. Moreover, 148 rainfall occurrences from in situ field observations were chosen, and the rainfall was categorized into four regimes using the Huff curve. This following were the main objectives of this study: (a) to investigate whether rainfall regimes influence the surface runoff and soil moisture of sloping tillage under natural rainfall conditions, (b) to explore the responses of the temporal and vertical distribution of the soil moisture to four rainfall regimes, and (c) to explore the role of contour tillage regarding the effect of soil moisture during different rainfall regimes.
2. Materials and Methods
2.1. Study Site
This study on the observation experiment of the sampling field’s outer diameter flow plot was arranged in the Jiangxi Ecological Park of Soil and Water Conservation (29°16′ N–29°17′ N, 115°42′ E–115°43′ E) in the Yangou watershed, a portion of the Poyang Lake watershed in Jiangxi province, China (Figure 1). There is subtropical monsoon environment with a mean annual rainfall of 1469 mm, and the average temperature of 16.7 °C dominates this field. According to the weather station in De’an, the local multi-year average annual evaporation is 1162.5 mm and the four months with the highest continuous evaporation (601.0 mm) are June to September, which accounts for more than half of the annual evaporation. The rainy season is between April and September, when over 70% of the yearly rainfall falls and between 1700 and 2100 h of sunlight are experienced on average. The region experiences frost-free days from 245 to 260 days. The red clay soil that was primarily created by the weathering of the Quaternary sediment is the main type of soil in the watershed. A subtropical evergreen broadleaved forest makes up the zonal vegetation. The soil in the research region was about 100 cm deep, with a composition of roughly sand (15.32%), silt (68.28%) and clay (16.40%) [30,61]. The soil depth of the Ah layer and Bs layer were 25–30 cm and 30–60 cm. Due to the high erosion intensity, the Ah layer is characterized by a loose structure and high precipitation, and the Ah layer had been completely removed in numerous areas due to soil erosion. The study area is a shallow hilly terrain, with a slope of 5° to 25° and a height of 30 m to 90 m a.s.l., in which sloping farmland is very common and has been mostly planted with peanut and rape because the growth of these crops is more suitable for the local climate and soil conditions.
2.2. Plot and Experimental Design
At the study watershed, four in situ runoff plots were built in 2018, each with a slope of 12 degrees, width of 1 m, and horizontal length of 2 m (Figure 2). In order to avoid the hydrological disturbances from adjacent plots and other surrounding land, cement walls were constructed around each plot. Each of the plots was cultivated along the slope and was randomly arranged. The peanut variety was pure autumn variety 1016 and we placed 3 peanuts in each hole, which were planted with a spacing of 15 cm × 30 cm in the runoff plots. The basic fertilizer—50 kg/mu of organic calcium magnesium phosphate manure and 25 kg/mu of compound manure—was administered at the time of sowing (N:P:K is 15:15:15); the topdressing was 5 kg mu−1 urea and 2.5 kg mu−1 chlorine potassium. There were two treatments for the four runoff plots, conventional and contour tillage, and two duplicates were set for each treatment. For the contour tillage, there were three ridges that measured 70 cm in width and 30 cm in height across the contour line, and there was a horizontal furrow between each ridge that was 30 cm in width and depth. The experiment adopted a peanut–rapeseed rotation, and the land was plowed according to local planting habits. Rape was planted at the beginning of October, and peanuts were planted at the beginning of May. Peanut and rape harvests took place in April and September of each year, respectively. The cultivated practices and cropping system were used in accordance with the characteristic agricultural managements in red soil regions. In this study, the plots were sprayed with herbicides to remove weeds every two months, which allowed for testing the generation of runoff and soil loss with these management practices.
A runoff collection trench and two runoff storage containers were put at the bottom of the plots to collect runoff and sediment from red soil under different tillage management (Figure 2). A runoff collection system was designed for each plot in order to collect all the runoff. Two runoff collection containers with a volume of 2 m3 were set up, and we also placed a water level ruler in each container in order to note the amount of runoff after rainfall. Also, two runoff collection containers were connected to the ditch through plastic pipes.
2.3. Measurement of Soil Moisture
For the present study, a TDR200 time domain reflectance observation system (Campbell, Santa Clara, CA, USA) was used to measure soil moisture. The time domain reflection (TDR) method calculates the volumetric soil water content by measuring a single-valued polynomial connection between soil moisture and the soil dielectric constant. And, to monitor soil moisture in the runoff plots, fixed-point observations were made in two soil layers at 0–20 and 20–40 cm of the sloping plot. Two test points were selected for each plot, and moisture sensor probes (CS630) were buried at the depth of 20 and 40 cm from the slope surface at each test point. Both test points were located at the midline of the runoff plot, one at 0.5 m from the top of the slope and the other at 0.5 m on the bottom of the slope. The instrument collected data every 20 min and downloaded soil moisture content data from the data collector every 15 days. The observation period was from May 2019–November 2020, which included two peanut seasons and one rape season.
2.4. In Situ Observation
The sediment generated and the surface runoff of runoff plots were gathered and transported to the corresponding runoff storage container. The amount of runoff was determined by multiplying the water level by the bottom area of the storage container, and runoff depth was computed by dividing the runoff with the area of the runoff plot. Following the completion of each measurement of the amount of rainfall, the sediment particles in the ditch and the bottom of the container were flushed by the clear liquid that was left in the runoff-collecting container, and then a plastic pipe was used to move the cleaned sediment particles to the runoff-collecting container. In order to evaluate the concentration of sediment, runoff samples that were mixed with sediment were collected in plastic bottles within each runoff-collecting container and brought to a laboratory where they were dried to the same weight in an oven at 105 °C. During each rainfall, the sediment concentration and runoff volume were multiplied to determine the quantity of the soil. All runoff-collecting containers were thoroughly rinsed clean with clean water when each runoff sampling was finished, and they were then used to gather samples for the subsequent rainfall occurrence. Evaporation data were extrapolated from the average monthly evapotranspiration at the study site, and evaporation during the sub-rainfall period was obtained by multiplying the rainfall duration and the evaporation rate. On account of the lag in soil moisture response to rainfall, when there were more than six hours between rainfall episodes, and an erosive rainfall event was regarded as independent. Precipitation in the study area was obtained 50 m away from the runoff plots using an automated weather station. It recorded important aspects of rainfall, such as rainfall duration, rainfall intensity, I30 and daily rainfall amount.
The samples of soil in different layers from the runoff plots were collected with a cutting knife when the peanuts and rape were harvested to determine soil porosity and soil bulk density. Table 1 shows the difference between the soil porosity of conventional and contour tillage, illustrating that the conservation tillage measures have a positive effect on improving soil structure. It can be observed that contour tillage increased the total porosity, capillary porosity and non-capillary porosity of 0–20 cm layers of soil relative to conventional tillage.
2.5. Determination of Rainfall Regimes and Rainfall Duration Curves
The time course rainfall regime of precipitation refers to distribution of the rainfall over time during rainfall, reflecting a process of rainfall occurring, developing and ending. Knowledge of the time distribution for rainfall has paramount significance in studying soil erosion, soil moisture distribution and the variation in various types of rainfall [53]. Dividing the data by the quartile in which the most of the rainfall occurred, and relating the percentage of rainfall to the percentage of the total rainfall time, from this, the rainfall events were classified to four regimes (advanced, delayed, intermediate and uniform regimes) based on the highest concentration of rainfall. By establishing a relationship between the percentage of storm rainfall and the percentage of total rainfall time, as well as classifying the data based on the quartile of highest rainfall, four regimes were identified based on the time period when the rainfall was most concentrated: advanced, delayed, intermediate, and uniform regimes.
The data derived from the automatic weather station were used to develop time distribution relationships regarding rainfall, then these relationships were presented in a probabilistic form to deliver quantitative data about inter-rainfall variability. According to the theory of the Huff curve combined with the characteristics of the intra-rainfall temporal regime over China, erosive rainfall events were divided into four patterns using the following steps:
(1) The cumulative rainfall amount and duration and total rainfall amount and duration for each rainfall were obtained.
(2) We divided the cumulative duration of rainfall with the total rainfall duration as the abscissa and then divided the cumulative amount of rainfall with total amount of rainfall as the ordinate to obtain dimensions of the rainfall process and the cumulative rainfall curve.
(3) Three equal-time periods were created from the dimensionless duration, and for ease of application, we defined a classification point that was not originally an integer as 0.4 and 0.6 and then calculated the cumulative amount of rainfall of each period.
(4) We divided all rainfall events into four different regimes according to the location of maximum rainfall accumulation: (a) rainfall with a rainfall concentration at 0~0.4 of rainfall duration was defined as the advance regime, (b) rainfall with a rainfall concentration at 0.4~0.6 of rainfall duration was defined as the intermediate regime, (c) rainfall with a rainfall concentration at 0.6~1 of rainfall duration was defined as the delayed regime and (d) rainfall that was evenly distributed throughout the duration of rainfall with no noticeable peaks was defined as the intermediate regime (Figure 3). Notably, the slope of the advanced type of rainfall changed from steep to moderate at about 0.4 cumulative rainfall duration, and the slope of the delayed type of rainfall changed from slow to steep at about 0.6 cumulative rainfall duration, while the type intermediate rainfall had the steepest slope between these two points. However, the cumulative rainfall of the uniform type of rainfall showed a linear feature with the cumulative rainfall duration (Figure 3), which indicated that the rainfall intensity of the uniform type of rainfall was basically unchanged during the rainfall duration.
2.6. Statistical Analysis
In this study, the runoff coefficient of sloping farmland was evaluated using the runoff data with the in situ observations. The runoff coefficient (ROC) was determined by Equation (1):
We used three statistical techniques, the variation coefficient (CV), the standard deviation (SD) and the relative variation (δij) between different soil moisture measurements, which reflected the active degree of soil water movement in each soil layer [60,62]. The larger the standard deviation and variation coefficient for soil moisture, the more frequent the alternation between soil moisture and atmospheric water in this layer. The temporal standard deviation for soil moisture can be provided by Equation (2):
where is the content of soil moisture (cm3 cm−3) with position in time , and is the amount of the sample points, being the temporal mean of soil moisture content in all positions in time , and it can be expressed by Equation (3):
Then, the CV of the soil moisture can be obtained by Equation (4):
The differences in rainfall characteristics and soil moisture were quantified according to the analysis of variance (ANOVA). The means were separated at a 5% probability level using Duncan’s tests. Pearson correlation analysis was employed to analyze the relationship between the soil moisture content and rainfall characteristics. On the basis of normal distribution tests and data conversions, the standard deviation and mean value were calculated. Statistical analyses of all data were carried out with the Windows-based SPSS software version 20.0, and Origin 9.0 software was used to complete the drawing of all graphics.
Figure 4 shows the basic research ideas, methods and result analysis of this research.
3. Results
3.1. Rainfall Regimes
The 148 rainfall events during 2019 to 2020 were separated into four groups by the k-means clustering method according to the rainfall amount and duration. The rainfall event characteristics for each rainfall regime are presented in Table 2. Accordingly, the advanced rainfall regime accounted for 45.9% of all rainfall events, which meant that it was the dominant rainfall regime in the study area. The intermediate regime accounted for 21.6%, while the occurrences of the delayed and uniform patterns were all the lowest among the four rainfall regimes (16.2%). Among the four rainfall regimes, the intermediate rainfall had the longest duration (900 min) and the greatest depth (22.19 mm), and it also had the highest intensity (13.00 mm h−1). The characteristics of the advanced regime rainfall were a short duration, moderate intensity and moderate depth. The rainfall events of the delayed regime that had moderate depth, moderate intensity and the shortest duration (740 min). The uniform pattern had a high duration but the lowest depth (13.33 mm) and intensity (3.54 mm). From what has been discussed above, it may reasonably be found that the intermediate rainfall events had high intensity and depth and a long duration.
Figure 5 displays the percentage distribution of the rainfall regimes of different duration and intensity groups. According to the findings of the simple statistical analysis, there were 41, 36, 34, 50 rainfall events in each duration group and 68, 38, 20, 34 rainfall events in each intensity group, which were up to 4, 4~8, 8~16 and more than 16 h (mm h −1), respectively. For each duration group, the percentages of the advanced regime were the highest and decreased with increasing durations, while the proportion of the other three rainfall regimes in each duration group was basically the same and did not exceed 30%. However, in the longer duration group, the proportion of the intermediate regime was smaller and the proportion of the delayed regime tended to increase with increasing durations (Figure 5).
3.2. Runoff Depth and Coefficient with Different Tillage Measures and Four Rainfall Regimes
The runoff depth of the two tillage managements are depicted in Figure 6. The runoff depth increased with the rainfall amount, and conventional tillage showed a higher runoff depth than contour tillage. The runoff depth was larger than 7.5 mm when the rainfall amount was over 35 mm for the conventional tillage. For the contour tillage, the runoff depth was basically around 5 mm or even smaller when the rainfall amount was larger than 20 mm and was around 2.5 mm when the rainfall amount was smaller than 20 mm (Figure 6). The water loss for sloping farmland with conservation tillage management (contour tillage) were lower compared to the conventional tillage. It appears from the results that contour tillage was useful in controlling the runoff of sloping farmland.
As discussed previously, rainfall with different rainfall durations, intensities and depths created different influences on the surface runoff of the sloping farmland. Figure 7 illustrates the surface runoff features for the tillage managements with diverse rainfall regimes. From Figure 7, it is shown that the uniform rainfall had the highest runoff coefficient amount on contour tillage (5.21%) and conventional tillage (5.82%), while the lowest runoff coefficient for contour tillage (4.18%) and conventional tillage (4.51%) occurred with the advanced rainfall. The runoff depth on contour tillage decreased with the order of uniform > advanced > intermediate > delayed rainfall, and conventional tillage decreased with the order of advanced > uniform > intermediate > delayed rainfall.
3.3. Processes of the Soil Moisture Varied for Four Rainfall Regimes
Table 3 provides an overview of the fluctuation in soil moisture at various depths for the observation period for the conventional tillage and contour tillage. During this period, the mean daily rainfall during was 242.4 mm (CV = 22%), and the precipitation was mainly concentrated in June to August when the rainfall had a larger rainfall amount (ranging from 149.60 to 393.40 mm) and highest I30 (ranging from 7.34 to 28.20 mm h−1). In contrast, the rainfall in October to December had the smallest I30 (ranging from 1.30 to 1.87 mm h−1) and a smaller rainfall amount (ranging from 11.6 to 30.6 mm). For the conventional tillage, the mean (±SD) soil moisture values during the observation period were 22.73 ± 6.13% at 20 cm and 28.14 ± 5.41% at 40 cm, and the smallest value of soil moisture was mainly concentrated in September, October and November 2019 (ranging from 16.09% to 17.65% at 20 cm and from 21.71% to 22.46% at 40 cm). For the contour tillage, the mean (±SD) soil moisture values during the observation period were 27.59 ± 5.32% at 20 cm and 32.19 ± 4.82% at 40 cm, and the mean value of the soil moisture ranged from 16.09% to 17.65% at 20 cm and from 21.71% to 22.46% at 40 cm in September to November 2019. It is observed from Table 3 that soil moisture at a deeper soil layer (40 cm) was relatively more stable than it was at the 20 cm soil layer during the investigation period, with the CV of the soil moisture being 19.226% (conventional tillage) and 15.460% (contour tillage) at 40 cm, which was evidently smaller than that of the 20 cm layer (CV was 26.957% in the conventional tillage and was 19.905% in the contour tillage).
Soil moisture changes in sloping farmland varied during different rainfalls, and the change curves of the soil moisture for altered soil content showed different trends. In order to minimize seasonal differences in the soil moisture response to rainfall and the influence of slope crop cover and root systems on the analysis of the results, the rainfall events selected mainly occurred in March–April 2020. In addition, it can be found that the runoff and evaporation of different sized rainfall events as a proportion of the total rainfall varied between the four rainfall regimes (Figure 8). The runoff of the advanced rainfall was significantly lower than that of the other rainfall regimes, which was basically under 5 mm. For the uniform rainfall, a larger portion of rainfall is lost as runoff, especially in the conventional tillage during medium rainfall, which accounts for 52% of the total rainfall. Evaporation during rainfall accounts for a relatively small portion of rainfall (less than 10%) and thus has little effect on rainfall replenishing soil moisture.
Table 4 and Table 5 and Figure 9 show that soil moisture of dissimilar farmland managements responded differently to the different rainfall regimes at the different depths (20 cm and 40 cm) during the monitored period. In order to better explore how soil moisture content responded to natural rainfall situations at the experimental site and considering the influence of rainfall magnitude to the soil moisture transport, soil moisture changes in sloping farmland under the high, medium and low precipitation are discussed in Figure 9. By and large, compared to the soil layer of 20 cm, and the 40 cm layer displayed high values for soil moisture throughout the experimental period for the two different tillage managements. In the case of the low rainfall (4.3 mm–6.5 mm), there was no obvious pattern in the modification of the soil moisture in each layer, and the response to the rainfall process curve was not clear (Figure 9A). Comparing Figure 9A–C, it was obvious that the soil moisture content response to different rainfall regimes was more significant with the increase in rainfall precipitation, and it can also be seen that the biggest variations in the value of soil moisture content occurred at the 20 cm soil layer. It is worth noting that for the different tillage managements, the soil moisture of conventional tillage showed more significant changes during the rainfall process.
For the different rainfall regimes with the highest precipitation, the soil moisture change curve showed different trends (Figure 9C). For the advanced rainfall, the 20 cm and 40 cm layers of conventional tillage displayed big fluctuations in soil moisture throughout the rainfall, with a significant increase in the early period of rainfall, while the two soil layers of the contour tillage presented little temporal variations in soil moisture. The result (Figure 9) also showed that the soil moisture of the conventional tillage increased during periods of concentrated precipitation for the intermediate and delayed rainfall. For the uniform rainfall, it not only had the most little variations in soil moisture after each rainfall event nut also presented lower fluctuations in soil moisture during rainfall.
Table 4 and Table 5 display the changes in soil moisture of sloping farmland before and after the different regimes of rainfall under the two tillage managements. It is apparent that soil moisture for the sloping farmland regarding both tillage managements did not change after the rainfall with light rainfall, which meant that it is a more efficient reasonable analysis idea to not consider the effect of rainfall intensity on the value of soil moisture before and after the rainfall. Considering the rainfall with medium precipitation, compared with the value of soil moisture before the rainfall at the layer of 20 cm, the value of soil moisture during the rain in conventional tillage under the advanced regime and the intermediate regime increased by 23.80% and 11.54%, respectively, while the soil moisture content after the rain with the delayed regime and the uniform regime increased by 20.11% and 11.56%, respectively (Table 4). When the precipitation was high, the soil moisture at the 40 cm layer increased slightly after rainfall regarding the advanced regime and the intermediate regime compared to the value before rainfall, which indicated that heavy rainfall was beginning to have an effect on soil moisture at deep layers. These results demonstrated that the influence of rainfall on changing the soil moisture content exhibited hysteresis and the degree of hysteresis was significantly different under the four rainfall regimes, in which the lag of the increase in the soil moisture content was more obvious under the delayed and uniform rainfall (Table 4). Comparing Table 4 and Table 5, it can be found that the soil moisture of sloping farmland with contour tillage displayed a higher value and smaller fluctuation at the 40 cm soil layer during all rainfall events. For the contour tillage after rainfall with medium precipitation, the value added of the soil moisture content at the 20 cm layer decreased in following order: advanced rainfall (31.66%) > delayed rainfall (11.45%) > uniform rainfall (4.55%) > intermediate rainfall (3.75%). However, the soil moisture content at the 40 cm layer exhibited a small increase under the four different regimes. It can be observed from Table 4 that for the contour tillage after rainfall with high precipitation, the value added of the soil moisture at the 20 cm layer decreased in following order: advanced rainfall (18.19%) > intermediate rainfall (11.68%) > delayed rainfall (7.25%) > uniform rainfall (2.68%). The soil moisture in the contour tillage did not undergo a significant increase even under heavy rainfall. In general, among the four different rainfall regimes, the advanced rainfall and intermediate rainfall caused a more pronounced increase in the soil moisture at the 20 cm layer that occurred in the two different types of sloping farmland.
3.4. Response of the Increment in Soil Moisture for Different Rainfall Regimes
Figure 10 presents the soil moisture’s increment for the two tillage managements and the rainfall factors (amount, duration and I30) of the four rainfall regimes. It shows that at the 20 cm layer, soil moisture increased when the rainfall amount was larger than 20 mm for both the conventional and contour tillage under advanced, intermediate and delayed rainfall, while the values changed in reaction to variations in the antecedent dry day (ADD). For the uniform regime, the increment in the soil moisture was notably smaller than for the other rainfall regimes, especially for the contour tillage. For the advanced rainfall, soil moisture content at the 20 cm depth layer of the conventional tillage increased appreciably (by more than 5%) when the rainfall was higher than 20 mm (Figure 10). For the delayed rainfall, soil moisture at the 20 cm layer in the conventional tillage increased considerably following the two successive rainfall events of a large rainfall amount of short dry interval. At the 40 cm layer of the conventional tillage, soil moisture increased when the rainfall amount was larger than 35 mm or when the rainfall duration lasted longer than 700 min or when the two successive rainfall events had a short dry interval which lasted no more than one day. In the contour tillage, the increment in the soil moisture at the 40 cm depth layer was less than 3%, while the soil moisture value at the 20 cm layer under advanced and intermediate rainfall only increased notably once the rainfall amount was larger than 40 mm or increased when the rainfall duration lasted longer than 700 mm under delayed rainfall.
Table 6 shows the Pearson correlation coefficient between rainfall eigenvalues and the increment in the soil moisture content for different rainfall regimes. Comparing two different soil layers, the increment in soil moisture at the 20 cm depth showed a considerable correlation with the parameters of rainfall listed in Table 6, while there was no notable link at the 40 cm layer. For the advanced rainfall, the increment in soil moisture had an appreciably positive association with the rainfall amount at the 20 cm layer for all tillage methods (r was 0.568 under the conventional tillage and 0.590 under the contour tillage, p < 0.01), and I30 also had significantly a positive correlation between the soil moisture contents at the 20 cm layer for all tillage methods (p < 0.05). For the uniform rainfall, the increment in soil moisture had a strong positive correlation between the rainfall duration at the 20 cm layer for all tillage methods (r was 0.850 under the conventional tillage and 0.854 under the contour tillage, p < 0.01). In the contour tillage, the increment in soil moisture was significantly correlated with the ADD only for the contour tillage under the advanced and delayed rainfalls (r was 0.482 under the advanced rainfall and −0.666 under the delayed rainfall, p < 0.05). Moreover, the rainfall amount had a noticeably positive correlation with the increment in soil moisture in the 40 cm layer for the contour tillage under the advanced and intermediate rainfalls.
4. Discussion
Normally, soil moisture feeds the atmospheric cycle through evapotranspiration from the land surface and has a significant impact on the formation, conversion, consumption and circulation of water resources [4,63]. Many elements have an impact on soil moisture characteristics, including climate, terrain, precipitation and the soil structure, and have strong regional differences. The soil moisture of red soil sloping farmland in Southern China is mainly derived from natural rainfall, which dominates through variations in the rainfall amount, intensity and rainfall regimes [64,65,66]. The characteristics of the rainfall events, including the duration, number and peak intensity, are directly related to “minimum inter-event time” (MIT). Therefore, the quantity of the rainfall events determined from the rain gauge data may change depending on the MIT criterion for individual rainfall events [67]. MIT is a threshold for the duration of rain-free periods during the rainfall period and is utilized to characterize rainfall events, and approaches to identifying MIT for single rainfall events include constant time methods, empirical modeling methods, and statistical methods [68,69]. MIT values can range widely, e.g., from 15 min to 24 h, which commonly occur due to the difference in the available dataset’s resolution. Wischmeier [70] and Huff [53] used six hours to divide the previous and successive rainfall events for analyzing rainfall characteristics and their impact on hydrology. Tu et al. [69] found that four hours is the most suitable time for MIT criterion to divide rainfall events for soil erosion experiments. At present, the commonly used MIT values in China are 2 h [71] and 6 h [72], which are the empirical values with subjective selection, of which the 6 h value is frequently utilized in hydrology and soil erosion-related research [57]. For the present study, the correlations of the soil moisture and rainfall amount for the four rainfall regimes were investigated, and therefore, six MIT values was used.
The temporal changes in soil moisture have a strong influence on soil moisture replenishment (precipitation). The distribution of rainfall is characterized by seasonality, which results in the seasonality of the monthly soil moisture content [60,73,74]. The seasonality of the fluctuations in soil moisture content observed in the two layers (0–20 cm and 20–40 cm) demonstrated that the moisture variation was more close to the soil surface, especially for the conventional tillage (Table 3). This result clarifies how rainfall characteristics, evapotranspiration and tillage managements affect this variable, and these are strongly associated with larger variations across the different seasons at layers near the surface. On the contrary, soil moisture fluctuated gently and seasonally in the deeper layer (20–40 cm). Note that for the sloping farmland with contour tillage, the soil moisture value in all layers was significantly higher than that with the conventional tillage, demonstrating a greater water retention capacity. For the conventional tillage, with furrow planting to prevent crops from being washed away on steeper slopes, a dense layer was created near the surface of the red soil due to farming activities, giving rise to the pooling of rainfall, which increased the runoff amount [75]. As a result, a significant amount of soil water was lost during and after rainfall due to the crop and soil structure in conventional tillage being affected by runoff (Figure 6; Table 3). Regarding the contour tillage, it changed the microtopography of the slope surface and divided the slope surface into a number of small ditches for water storage due to its special way of laying out in the direction of ridges. This conservation tillage measure prevented the pooling of rainfall by intercepting it in blocks and reduced the intensity of the scouring of the slope by raindrops and runoff, which increased the infiltration time of slope soil and contributed to the increase in soil moisture in the soil layer [76]. In addition, the 0–20 cm layer’s soil porosity of the contour tillage was significantly greater than that of the conventional tillage (Table 1). The water in the capillary pores could be held in the soil for long time, and the non-capillary pores could accommodate precipitation faster and infiltrate in time to contain water, which could reflect the strength of the soil’s ability to infiltrate and retain water. Therefore, the contour tillage improved soil structure and enhanced soil permeability and infiltration by increasing soil porosity in the surface layer of sloping farmland. Consequently, for the sloping farmland with conventional tillage, the average soil moisture values were low and had more variations at the shallower soil layer.
Soil moisture at different depths with the two tillage methods displays a complicated response process and also is affected by rainfall characteristics [44,77], rainfall regimes [78], and the antecedent dry day [4,79]. Rainfall during the growing period may appreciably influence water infiltration and shallow-soil water replenishment [80,81]. Regarding the conventional tillage, it is difficult for low rainfall to directly replenish soil moisture, while high rainfall (>30 mm) has an effect on soil moisture accumulation in the shallow layer (Figure 9; Table 4). The previous research have found that a low rainfall events will only result in soil infiltration in surface soil layer that infiltration depth under the low rainfall amount does not exceed 20 cm [64,82]. The main reason for this may be that soil moisture evapotranspiration is greater in the red soil area of south China, where rain and heat transpire in the same season, and most of the moisture in low rainfall events is quickly returned to the atmospheric cycle through plant transpiration and soil evaporation. In addition, it was found that under the contour tillage, a smaller rainfall amount (>15 mm) could increase the depth of soil water infiltration and the soil water storage in the 40 cm layer (Table 5). These findings indicated that soil moisture under the contour tillage displayed a stronger reaction to low rainfall events, specifically at a deeper depth. This is due to the fact that the contour tillage reduces slope runoff losses and increases the rainfall infiltration time by altering microtopography, and it enhances soil permeability and infiltration by increasing the soil porosity of sloping farmland. Comparable conclusions were also presented by Dembele et al. [76], who mentioned that the use of a contour ridge is an comprehensive approach that improves water balance and increases soil moisture by 20–30%. Overall, the soil water content dynamics of red soil slope farmland is consistent with rainfall changes, and a higher rainfall amount significantly increased soil moisture and the water infiltration depth.
It is necessary to point out that even if soil infiltration occurs during heavier rainfall conditions, rainfall could not be effective in replenishing soil moisture due to the high resistance to infiltration, and the water moves under a limited kinetic energy in red soils [74,83,84], which means that a single rainfall characteristic is not sufficient to capture the influence of natural rainfall events on changes in the soil moisture content. The reaction metrics of the soil moisture to rainfall of the same amount but with different rainfall regimes was used in this study (Figure 9; Table 5 and Table 6). For example, the majority of soil moisture increases was caused by the advanced regime. This result was attributed to the fact that the advanced regime accounted for the largest percentage of rainfall regimes for the red soil area of South China, with a larger average I30, and the rainfall loss caused by runoff and evaporation under the advanced rainfall was significantly less than that of the other rainfall regimes (Figure 8). By contrast, the uniform regime supplied the least effective soil moisture increment because of the smallest number of rainfall and the smallest average rainfall amount and I30 (Table 2), and also, part of the rainfall was lost as slope runoff without replenishing soil moisture, which was also observed by Wang et al. [57]. Moreover, the uniform regime had constant intensity and a lengthy duration, which could potentially result in rainfall not having sufficient kinetic energy to form infiltration channels in the soil layer, resulting in a lower infiltration rate of soil and more runoff (Figure 7) compared to the other regimes. Analogous conclusions were also proposed by Liu et al. [30], who indicated that rainfall regimes with the lowest intensity and longest duration lead to the highest runoff coefficient of the surface on slopes in the red soil region.
In the present study, the surface runoff coefficient and runoff depth for delayed regime were higher than those for the other regimes (Figure 7).Nevertheless, Dunkerley [52] presented a different result, that the delayed regime produced the largest runoff amount and ratio compared to the other rainfall regimes. This disparity is especially significant when considering the various land use types and how they affect the favored flows and water flow pathways [83,85]. Furthermore, the delayed regime generated soil infiltration in the soil layer at the 20–40 cm depth, especially for the rainfall with a long duration, which induced the efficient response of soil moisture’s increment at the 20–40 cm depth (Table 5 and Table 6; Figure 10). A possible reason for this result is that the peak rainfall intensity of the delayed regime occurs in the later stages of the rainfall process, where infiltration channels are formed in the early rainfall stages, increasing the depth of infiltration, and a longer rainfall duration can provide enough time for deep soil infiltration. It is worth noting that the ADD affects the influence of the rainfall events on soil moisture. There are significant connections between the time of the ADD and soil moisture’s increment in the 0–20 cm layer for the advanced and delayed regimes (Figure 10). These results showed that different soil moisture response measures for distinct rainfall regimes showed varying sensitivity to rainfall parameters. High rainfall with a small ADD can have a stacking impression, which means that accumulative rainfall can significantly increase the soil moisture, even in deeper soil layers [30]. Generally, interactions between rainfall event differences due to the rainfall regime and the soil hydrodynamics may lead to the complications and irregularities in the rainfall regime’s effects. Consequently, future studies could be centered with the response of tillage management or soil type to rainfall in order to improve the knowledge of the association between rainfall regimes and soil moisture dynamics.
5. Conclusions
The intention of this study was to explore the mechanisms of the soil moisture response processes to the rainfall on sloping farmland in the red soil area of South China with experimental analysis under various tillage measures and rainfall regimes. There were four rainfall regimes that were categorized by the k-means clustering method from 148 rainfall events, according to I30, rainfall amount and duration. For each rainfall regime, including the advanced, intermediate, uniform and delayed regime, an analysis correlating soil moisture with rainfall characteristics was conducted to explore the effect of rainfall regimes on soil moisture. The advanced regime was the most prevalent rainfall regime for the research area and also had the largest proportion of high-intensity rainfall events (more than 16 mm h−1). The intermediate regime had the highest rainfall intensity, duration and amount and low runoff depth. By contract, the uniform regime had a low rainfall amount and intensity but the highest runoff depth and coefficient.
The relationship between the soil moisture and the rainfall features for the two tillage measures was influenced by the rainfall regime. For the conventional tillage, soil moisture at a depth of 0–20 cm increased significantly during the middle or late hours of a single rainfall event for the advanced regime when the rainfall amount was larger than 20 mm, while this variation occurred at the end of or after a single rainfall event for the advanced regime when the rainfall amount was higher than 30 mm. For the contour tillage, soil moisture at the 20 and 40 cm layers was increased for the advanced regime when the rainfall amount was higher than 15 mm and 30 mm, while these values changed with rainfall duration and the ADD. Generally, the rainfall amount, duration and ADD obviously impacted on the alternative increments in soil moisture and showed different correlations under the four rainfall regimes. For the advanced and delayed regime, the long duration rainfall (>700 min) led to a notable increase in soil moisture and it appreciably had a positive link between the ADD and the increment in soil moisture at the 20 cm layer caused by low rainfall events (<15 mm) with a short ADD, suggesting that a short ADD produced a cumulative effect for rainfall. By comparison, the soil moisture content of the sloping farmland with the contour tillage was substantially higher than that of the conventional tillage, and the contour tillage provided a better water storage capacity by intercepting runoff and increasing the rainfall infiltration time.
The findings of the present study emphasize the intricacy of the soil moisture response to rainfall with different rainfall classification methods and the importance of contour tillage as a kind of conservation tillage for soil water storage, and we present a reference for the mechanistic research of soil moisture responses to rainfall and conservation tillage research in sloping farmland in the red soil region in South China. However, the results of studying a single region are not necessarily generalizable due to the characteristics of natural rainfall in different regions being complex and variable, and one type of conservation tillage research is incomplete. Consequently, future research could gather more data of the rainfall events from other areas and consider different conservation tillage measures.
Author Contributions
Conceptualization, Z.L. and X.C.; methodology, Z.L. and C.W.; software, Z.L.; validation, Z.L., X.C. and Z.Z.; investigation, Z.L.; resources, X.C.; data curation, Z.L.; writing—original draft preparation, Z.L.; writing—review and editing, X.C., C.W. and Z.Z.; supervision, Z.Z.; project administration, X.C. and Z.Z.; funding acquisition, X.C. and Z.Z. All authors have read and agreed to the published version of the manuscript.
Funding
This research was supported by the Technology Innovation Guidance Project of Jiangxi Province (20212AEI91011 and 2023KSG01002) and the Water Conservancy Department Science and Technology Project of Jiangxi Province (202224ZDKT12 and 202425YBKT08).
Data Availability Statement
Data are contained within the article.
Acknowledgments
The authors acknowledge the invaluable support for the field and laboratory work by the Jiangxi Ecological Park of Soil and Water Conservation.
Conflicts of Interest
The authors declare no conflicts of interest.
References
- Hillel, D. Environmental Soil Physics; Elsevier: Amsterdam, The Netherlands, 1998. [Google Scholar]
- Rolston, D.E. Introduction to Environmental Soil Physics. J. Soil Sci. 2005, 170, 1051–1052. [Google Scholar]
- Chaney, N.W.; Roundy, J.K.; Herrera-Estrada, J.E.; Wood, E.F. High-resolution modeling of the spatial heterogeneity of soil moisture: Applications in network design. Water Resour. Res. 2015, 51, 619–638. [Google Scholar] [CrossRef]
- He, Z.; Zhao, W.; Liu, H.; Chang, X. The response of soil moisture to rainfall event size in subalpine grassland and meadows in a semi-arid mountain range: A case study in northwestern China’s Qilian Mountains. J. Hydrol. 2012, 420–421, 183–190. [Google Scholar] [CrossRef]
- Heathman, G.C.; Larose, M.; Cosh, M.H.; Bindlish, R. Surface and profile soil moisture spatio-temporal analysis during an excessive rainfall period in the Southern Great Plains, USA. CATENA 2009, 78, 159–169. [Google Scholar] [CrossRef]
- Daly, E.; Porporato, A. A review of soil moisture dynamics: From rainfall infiltration to ecosystem response. Environ. Eng. Sci. 2005, 22, 9–24. [Google Scholar] [CrossRef]
- Xu, G.; Huang, M.; Li, P.; Li, Z.; Wang, Y. Effects of land use on spatial and temporal distribution of soil moisture within profiles. Environ. Earth Sci. 2021, 80, 128. [Google Scholar] [CrossRef]
- Oki, T.; Kanae, S.; Musiake, K. Global Hydrological Cycle and World Water Resources. J. Membr. Musiake 2003, 28, 206–214. [Google Scholar] [CrossRef] [PubMed]
- Seneviratne, S.I.; Corti, T.; Davin, E.L.; Hirschi, M.; Jaeger, E.B.; Lehner, I.; Orlowsky, B.; Teuling, A.J. Investigating soil moisture–climate interactions in a changing climate: A review. J. Earth Sci. Rev. 2010, 99, 125–161. [Google Scholar] [CrossRef]
- Grayson, R.B.; Western, A.W. Towards areal estimation of soil water content from point measurements: Time and space stability of mean response. J. Hydrol. 1998, 207, 68–82. [Google Scholar] [CrossRef]
- Jia, X.; Shao, M.; Zhu, Y.; Luo, Y. Soil moisture decline due to afforestation across the Loess Plateau, China. J. Hydrol. 2017, 546, 113–122. [Google Scholar] [CrossRef]
- Ren, Z.P.; Li, Z.B.; Liu, X.L.; Li, P.; Cheng, S.D.; Xu, G.C. Comparing watershed afforestation and natural revegetation impacts on soil moisture in the semiarid Loess Plateau of China. Sci. Rep. 2018, 8, 2972. [Google Scholar] [CrossRef] [PubMed]
- Zucco, G.; Brocca, L.; Moramarco, T.; Morbidelli, R. Influence of land use on soil moisture spatial-temporal variability and monitoring. J. Hydrol. 2014, 516, 193–199. [Google Scholar] [CrossRef]
- Vereecken, H.; Kamai, T.; Harter, T.; Kasteel, R.; Hopmans, J.; Vanderborght, J. Explaining soil moisture variability as a function of mean soil moisture: A stochastic unsaturated flow perspective. Geophys. Res. Lett. 2007, 34, 315–324. [Google Scholar] [CrossRef]
- Han, Z.; Liu, G. The Preliminarily Study on the Ecological Environment Effects of Land-use Change in Red Earth Hilly Area in Southeast China. J. Prog. Geogr. 2010, 23, 5. [Google Scholar] [CrossRef]
- Chen, X.; Liang, Z.; Zhang, Z.; Zhang, L. Effects of Soil and Water Conservation Measures on Runoff and Sediment Yield in Red Soil Slope Farmland under Natural Rainfall. Sustainability 2020, 12, 3417. [Google Scholar] [CrossRef]
- Jin, X.; Niu, Z.; Wang, C.; Xie, S.; Li, S. Spatial-temporal Characteristics of Soil Moisture on Small Red Soil Slope. J. Irrig. Drain. Eng. 2016, 35, 28–34+39. [Google Scholar] [CrossRef]
- Pradhan, N.R. Estimating growing-season root zone soil moisture from vegetation index-based evapotranspiration fraction and soil properties in the Northwest Mountain region, USA. Hydrol. Sci. J. 2019, 64, 771–788. [Google Scholar] [CrossRef]
- Zhao, Z.; Tang, G.; Wang, J.; Liu, Y.; Gao, Y. Soil Moisture Distribution and Time Stability of Aerially Sown Shrubland in the Northeastern Margin of Tengger Desert (China). Water 2023, 15, 3562. [Google Scholar] [CrossRef]
- Topp, G.C.; Davis, J.L.; Annan, A.P. Electromagnetic determination of soil water content: Measurements in coaxial transmission lines. J. Water Resour. Res. 1980, 16, 574–582. [Google Scholar] [CrossRef]
- Paltineanu, I.C.; Starr, J.L. Real-time soil water dynamics using multisensor capacitance probes: Laboratory calibration. Soil Sci. Soc. Am. J. 1997, 61, 1576–1585. [Google Scholar] [CrossRef]
- Schmugge, T.J.; Jackson, T.J.; Mckim, H.L. Survey of Methods for Soil Moisture Determination. J. Water Resour. Res. 1980, 16, 961–979. [Google Scholar] [CrossRef]
- Chanzy, A.; Tarussov, A.; Judge, A.; Bonn, F. Soil water content determination using a digital ground-penetrating radar. Soil Sci. Soc. Am. J. 1996, 60, 1318–1326. [Google Scholar] [CrossRef]
- Allred, B.; Freeland, R.; Grote, K.; McCoy, E.; Martinez, L.; Gamble, D. Ground-Penetrating Radar Water Content Mapping of Golf Course Green Sand Layers. J. Environ. Eng. Geophys. 2016, 21, 215–229. [Google Scholar] [CrossRef]
- Canet-Martí, A.; Morales-Santos, A.; Nolz, R.; Langergraber, G.; Stumpp, C. Quantification of water fluxes and soil water balance in agricultural fields under different tillage and irrigation systems using water stable isotopes. Soil Tillage Res. 2023, 231, 105732. [Google Scholar] [CrossRef]
- Fu, Z.; Li, Z.; Cai, C.; Zhao, Y.; Shi, Z.; Xu, Q.; Wang, X. Linking soil thickness and plot-scale hydrological processes on the sloping lands in the Three Gorges Area of China: A hydropedological approach. Hydrol. Process. 2011, 26, 2248–2263. [Google Scholar] [CrossRef]
- Cui, F.; Ni, J.Y.; Du, Y.F.; Zhao, Y.X.; Zhou, Y.Q. Soil water content estimation using ground penetrating radar data via group intelligence optimization algorithms: An application in the Northern Shaanxi Coal Mining Area. Energy Explor. Exploit. 2021, 39, 318–335. [Google Scholar] [CrossRef]
- Jia, J.; Zhang, P.; Yang, X.; Zhen, Q.; Zhang, X.; Aitkenhead, M. Comparison of the accuracy of two soil moisture sensors and calibration models for different soil types on the loess plateau. Soil Use Manag. 2020, 37, 584–594. [Google Scholar] [CrossRef]
- Zou, Z.; Tao, Y.; Gao, Y.; Liu, Z.; Li, W.; Tian, Z.; Lin, L.; He, Y.; Chen, J.J.G. Soil moisture dynamics near a gully head in relation to the trigger of collapse in granite red soil slope in southern China. Geomorphology 2023, 420, 108493. [Google Scholar] [CrossRef]
- Liu, Y.-J.; Yang, J.; Hu, J.-M.; Tang, C.-J.; Zheng, H.-J. Characteristics of the surface–subsurface flow generation and sediment yield to the rainfall regime and land-cover by long-term in-situ observation in the red soil region, Southern China. J. Hydrol. 2016, 539, 457–467. [Google Scholar] [CrossRef]
- Yan, P.; Lin, K.; Wang, Y.; Zheng, Y.; Gao, X.; Tu, X.; Bai, C. Spatial interpolation of red bed soil moisture in Nanxiong basin, South China. J. Contam. Hydrol. 2021, 242, 103860. [Google Scholar] [CrossRef]
- Yuan, R.; Salam, M.; Miao, X.; Yang, Y.; Li, H.; Wei, Y. Potential disintegration and transport of biochar in the soil-water environment: A case study towards purple soil. Environ. Res. 2023, 222, 115383. [Google Scholar] [CrossRef] [PubMed]
- Yu, B.; Liu, G.; Liu, Q.; Wang, X.; Feng, J.; Huang, C. Soil moisture variations at different topographic domains and land use types in the semi-arid Loess Plateau, China. CATENA 2018, 165, 125–132. [Google Scholar] [CrossRef]
- Yang, Q.; Fan, J.; Luo, Z. Response of soil moisture and vegetation growth to precipitation under different land uses in the Northern Loess Plateau, China. CATENA 2024, 236, 107728. [Google Scholar] [CrossRef]
- Wei, X.; Zhou, Q.; Cai, M.; Wang, Y. Effects of Vegetation Restoration on Regional Soil Moisture Content in the Humid Karst Areas—A Case Study of Southwest China. Water 2021, 13, 321. [Google Scholar] [CrossRef]
- Huisman, J.A.; Sperl, C.; Bouten, W.; Verstraten, J.M. Soil water content measurements at different scales: Accuracy of time domain reflectometry and ground-penetrating radar. J. Hydrol. 2001, 245, 48–58. [Google Scholar] [CrossRef]
- Lindroth, A.; Grelle, A.; Moren, A.S. Long-term measurements of boreal forest carbon balance reveal large temperature sensitivity. Glob. Chang. Biol. 1998, 4, 443–450. [Google Scholar] [CrossRef]
- Heisler-White, J.L.; Knapp, A.K.; Kelly, E.F. Increasing precipitation event size increases aboveground net primary productivity in a semi-arid grassland. Oecologia 2008, 158, 129–140. [Google Scholar] [CrossRef]
- Wang, X.P.; Cui, Y.; Pan, Y.X.; Li, X.R.; Yu, Z.; Young, M.H. Effects of rainfall characteristics on infiltration and redistribution patterns in revegetation-stabilized desert ecosystems. J. Hydrol. 2008, 358, 134–143. [Google Scholar] [CrossRef]
- Yu, X.N.; Huang, Y.M.; Li, E.G.; Li, X.Y.; Guo, W.H. Effects of rainfall and vegetation to soil water input and output processes in the Mu Us Sandy Land, northwest China. CATENA 2018, 161, 96–103. [Google Scholar] [CrossRef]
- Reynolds, J.F.; Kemp, P.R.; Ogle, K.; Fernández, R.J. Modifying the ‘pulse-reserve’ paradigm for deserts of North America: Precipitation pulses, soil water, and plant responses. Oecologia 2004, 141, 194–210. [Google Scholar] [CrossRef]
- Tian, J.; Zhang, B.; He, C.; Han, Z.; Bogena, H.R.; Huisman, J.A. Dynamic response patterns of profile soil moisture wetting events under different land covers in the Mountainous area of the Heihe River Watershed, Northwest China. Agric. For. Meteorol. 2019, 271, 225–239. [Google Scholar] [CrossRef]
- Singh, N.K.; Emanuel, R.E.; McGlynn, B.L.; Miniat, C.F. Soil Moisture Responses to Rainfall: Implications for Runoff Generation. Water Resour. Res. 2021, 57, e2020WR028827. [Google Scholar] [CrossRef]
- Yaseef, N.R.; Yakir, D.; Rotenberg, E.; Schiller, G.; Cohen, S. Ecohydrology of a semi-arid forest: Partitioning among water balance components and its implications for predicted precipitation changes. Ecohydrology 2010, 3, 143–154. [Google Scholar] [CrossRef]
- Aixia, R.; Zhao, W.; Anwar, S.; Lin, W.; Ding, P.; Hao, R.; Wang, P.; Zhong, R.; Tong, J.; Gao, Z.; et al. Effects of tillage and seasonal variation of rainfall on soil water content and root growth distribution of winter wheat under rainfed conditions of the Loess Plateau, China. Agric. Water Manag. 2022, 268, 107533. [Google Scholar] [CrossRef]
- Mei, X.; Ma, L. Effect of afforestation on soil water dynamics and water uptake under different rainfall types on the Loess hillslope. CATENA 2022, 213, 106216. [Google Scholar] [CrossRef]
- Jia, J.; Yu, X.; Li, Y. Response of forestland soil water content to heavy rainfall on Beijing Mountain, northern China. J. For. Res. 2016, 3, 77–86. [Google Scholar] [CrossRef]
- Marshall, R.J. A spatial-temporal model of storm rainfall. J. Hydrol. 1983, 62, 53–62. [Google Scholar] [CrossRef]
- Mohamadi, M.A.; Kavian, A. Effects of rainfall patterns on runoff and soil erosion in field plots. Int. Soil Water Conserv. Res. 2015, 3, 273–281. [Google Scholar] [CrossRef]
- Wei, W.; Chen, L.; Fu, B.; Huang, Z.; Wu, D.; Gui, L. The effect of land uses and rainfall regimes on runoff and soil erosion in the semi-arid loess hilly area, China. J. Hydrol. 2007, 335, 247–258. [Google Scholar] [CrossRef]
- Zhu, Q.; Nie, X.; Zhou, X.; Liao, K.; Li, H. Soil moisture response to rainfall at different topographic positions along a mixed land-use hillslope. CATENA 2014, 119, 61–70. [Google Scholar] [CrossRef]
- Dunkerley, D. Effects of rainfall intensity fluctuations on infiltration and runoff: Rainfall simulation on dryland soils, Fowlers Gap, Australia. Hydrol. Process. 2011, 26, 2211–2224. [Google Scholar] [CrossRef]
- Huff, F.A. Time Distribution Rainall in Heavy Storm. Water Resour. Res. 1967, 3, 1007–1019. [Google Scholar] [CrossRef]
- Azli, M.; Rao, A.R. Development of Huff curves for Peninsular Malaysia. J. Hydrol. 2010, 388, 77–84. [Google Scholar] [CrossRef]
- Aquino, R.F.; Silva, M.L.N.; de Freitas, D.A.F.; Curi, N.; Avanzi, J.C. Soil Losses from Typic Cambisols and Red Latosol as Related To Three Erosive Rainfall Patterns. Rev. Bras. Ciência Solo 2013, 37, 213–220. [Google Scholar] [CrossRef]
- Nel, W. Intra-Storm Attributes of Extreme Storm Events in the Drakensberg, South Africa. Phys. Geogr. 2007, 28, 158–169. [Google Scholar] [CrossRef]
- Wang, W.; Yin, S.; Xie, Y.; Liu, B.; Liu, Y. Effects of four storm patterns on soil loss from five soils under natural rainfall. CATENA 2016, 141, 56–65. [Google Scholar] [CrossRef]
- Brocca, L.; Tullo, T.; Melone, F.; Moramarco, T.; Morbidelli, R. Catchment scale soil moisture spatial–temporal variability. J. Hydrol. 2012, 422–423, 63–75. [Google Scholar] [CrossRef]
- Neves, H.H.; Mata, M.G.; Guerra, J.G.; Carvalho, D.F.; Wendroth, O.O.; Ceddia, M.B. Spatial and temporal patterns of soil water content in an agroecological production system. Sci. Agric. 2017, 74, 383–392. [Google Scholar] [CrossRef]
- de Queiroz, M.G.; da Silva, T.G.; Zolnier, S.; Jardim, A.M.; de Souza, C.A.; Júnior, G.D.; de Morais, J.E.; de Souza, L.S. Spatial and temporal dynamics of soil moisture for surfaces with a change in land use in the semi-arid region of Brazil. CATENA 2020, 188, 104457. [Google Scholar] [CrossRef]
- Duan, J.; Liu, Y.-J.; Yang, J.; Tang, C.-J.; Shi, Z.-H. Role of groundcover management in controlling soil erosion under extreme rainfall in citrus orchards of southern China. J. Hydrol. 2020, 582, 124290. [Google Scholar] [CrossRef]
- Rötzer, K.; Montzka, C.; Vereecken, H. Spatio-temporal variability of global soil moisture products. J. Hydrol. 2015, 522, 187–202. [Google Scholar] [CrossRef]
- Yang, L.; Chen, L.; Wei, W.; Yu, Y.; Zhang, H. Comparison of deep soil moisture in two re-vegetation watersheds in semi-arid regions. J. Hydrol. 2014, 513, 314–321. [Google Scholar] [CrossRef]
- He, Z.; Jia, G.; Liu, Z.; Zhang, Z.; Yu, X.; Xiao, P. Field studies on the influence of rainfall intensity, vegetation cover and slope length on soil moisture infiltration on typical watersheds of the Loess Plateau, China. Hydrol. Process. 2020, 34, 4904–4919. [Google Scholar] [CrossRef]
- Cheng, R.R.; Chen, Q.W.; Zhang, J.G.; Shi, W.Y.; Li, G.; Du, S. Soil moisture variations in response to precipitation in different vegetation types: A multi-year study in the loess hilly region in China. Ecohydrology 2020, 13, e2196. [Google Scholar] [CrossRef]
- Harper, C.W.; Blair, J.M.; Fay, P.A.; Knapp, A.K.; Carlisle, J.D. Increased rainfall variability and reduced rainfall amount decreases soil CO2flux in a grassland ecosystem. Glob. Chang. Biol. 2005, 11, 322–334. [Google Scholar] [CrossRef]
- Dunkerley, D. Identifying individual rain events from pluviograph records: A review with analysis of data from an Australian dryland site. Hydrol. Process. 2008, 22, 5024–5036. [Google Scholar] [CrossRef]
- Wang, W.; Wang, W.; Yin, S.; Xie, Y.; Nearing, M.A.; Yin, S.; Xie, Y.; Nearing, M.A. Minimum Inter-Event Times for Rainfall in the Eastern Monsoon Region of China. Trans. ASABE 2019, 62, 9–18. [Google Scholar] [CrossRef]
- Tu, A.; Zeng, J.; Liu, Z.; Zheng, H.; Xie, S. Effect of minimum inter-event time for rainfall event separation on rainfall properties and rainfall erosivity in a humid area of southern China. Geoderma 2023, 431, 116332. [Google Scholar] [CrossRef]
- Wischmeier, W.H. A Rainfall Erosion Index for a Universal Soil-Loss Equation. Soil Sci. Soc. Am. J. 1959, 23, 246–249. [Google Scholar] [CrossRef]
- Li, J.; Yu, R.; Sun, W. Duration and seasonality of hourly extreme rainfall in the central eastern China. Acta Meteorol. Sin. 2014, 27, 799–807. [Google Scholar] [CrossRef]
- Yin, S.; Xie, Y.; Liu, B.; Nearing, M.A. Rainfall erosivity estimation based on rainfall data collected over a range of temporal resolutions. Hydrol. Earth Syst. Sci. 2015, 19, 4113–4126. [Google Scholar] [CrossRef]
- Torell, L.A.; McDaniel, K.C.; Koren, V. Estimating Grass Yield on Blue Grama Range From Seasonal Rainfall and Soil Moisture Measurements. Rangel. Ecol. Manag. 2011, 64, 56–66. [Google Scholar] [CrossRef]
- Huang, X.; Shi, Z.H.; Zhu, H.D.; Zhang, H.Y.; Ai, L.; Yin, W. Soil moisture dynamics within soil profiles and associated environmental controls. CATENA 2016, 136, 189–196. [Google Scholar] [CrossRef]
- Devita, P.; Dipaolo, E.; Fecondo, G.; Difonzo, N.; Pisante, M. No-tillage and conventional tillage effects on durum wheat yield, grain quality and soil moisture content in southern Italy. Soil Tillage Res. 2007, 92, 69–78. [Google Scholar] [CrossRef]
- Dembele, C.O.; Traore, K.; Karembe, M.; Zemadim, B.; Cisse, F.; Samake, O. Contour Ridge Tillage for Improved Crops and Fodder Trees Production in the Villages of Kani and Noumpinesso, Southern- Mali. J. Agric. Stud. 2022, 9, 550. [Google Scholar] [CrossRef]
- Wang, Y.; Sun, H.; Zhao, Y. Characterizing spatial-temporal patterns and abrupt changes in deep soil moisture across an intensively managed watershed. Geoderma 2019, 341, 181–194. [Google Scholar] [CrossRef]
- Sun, L.; Yang, L.; Chen, L.; Li, S.; Zhao, F.; Sun, S. Tracing the soil water response to autumn rainfall in different land uses at multi-day timescale in a subtropical zone. CATENA 2019, 180, 355–364. [Google Scholar] [CrossRef]
- Ojha, R.; Morbidelli, R.; Saltalippi, C.; Flammini, A.; Govindaraju, R.S. Scaling of surface soil moisture over heterogeneous fields subjected to a single rainfall event. J. Hydrol. 2014, 516, 21–36. [Google Scholar] [CrossRef]
- Wiekenkamp, I.; Huisman, J.A.; Bogena, H.R.; Lin, H.S.; Vereecken, H. Spatial and temporal occurrence of preferential flow in a forested headwater catchment. J. Hydrol. 2016, 534, 139–149. [Google Scholar] [CrossRef]
- Zhang, J.; Duan, L.; Liu, T.; Chen, Z.; Wang, Y.; Li, M.; Zhou, Y. Experimental analysis of soil moisture response to rainfall in a typical grassland hillslope under different vegetation treatments. Environ. Res. 2022, 213, 113608. [Google Scholar] [CrossRef]
- Dai, L.; Fu, R.; Guo, X.; Du, Y.; Zhang, F.; Cao, G. Soil Moisture Variations in Response to Precipitation Across Different Vegetation Types on the Northeastern Qinghai-Tibet Plateau. Front. Plant Sci. 2022, 13, 854152. [Google Scholar] [CrossRef]
- Xu, Z.; Hu, P.; Man, X.; Duan, L.; Cai, T. Responsive characteristics of soil water regimes to rainfall events in a boreal larch forest in China: Dynamic processes and decoupling effects. Geoderma 2024, 441, 116741. [Google Scholar] [CrossRef]
- Wei, L.; Yang, M.; Li, Z.; Shao, J.; Li, L.; Chen, P.; Li, S.; Zhao, R. Experimental Investigation of Relationship between Infiltration Rate and Soil Moisture under Rainfall Conditions. Water 2022, 14, 1347. [Google Scholar] [CrossRef]
- Price, K.; Jackson, C.R.; Parker, A.J. Variation of surficial soil hydraulic properties across land uses in the southern Blue Ridge Mountains, North Carolina, USA. J. Hydrol. 2010, 383, 256–268. [Google Scholar] [CrossRef]
Figure 1.
The study region is situated in Southern China at the heart of the red soil zone. Poyang Lake is 15 km west of the study site. The research area is depicted on three maps: (a) a map of Jiangxi Province, China; (b) a map of Jiangxi Province; and (c) a map of the study area situated on the other side of the water system.

Figure 2.
Photos of the runoff plots: (A) conventional tillage and (B) contour tillage, and (C) runoff plot schematic diagram and (D) the surface runoff collection system.
Figure 2.
Photos of the runoff plots: (A) conventional tillage and (B) contour tillage, and (C) runoff plot schematic diagram and (D) the surface runoff collection system.

Figure 3.
The cumulative dimensionless curves of rainfall and fitted lines for rainfall regimes with (a) the advanced, (b) intermediate, (c) delayed and (d) uniform regimes. The thin line is the cumulative dimensionless curve of the rainfall and the thick lines are the fitted lines for rainfall regimes.

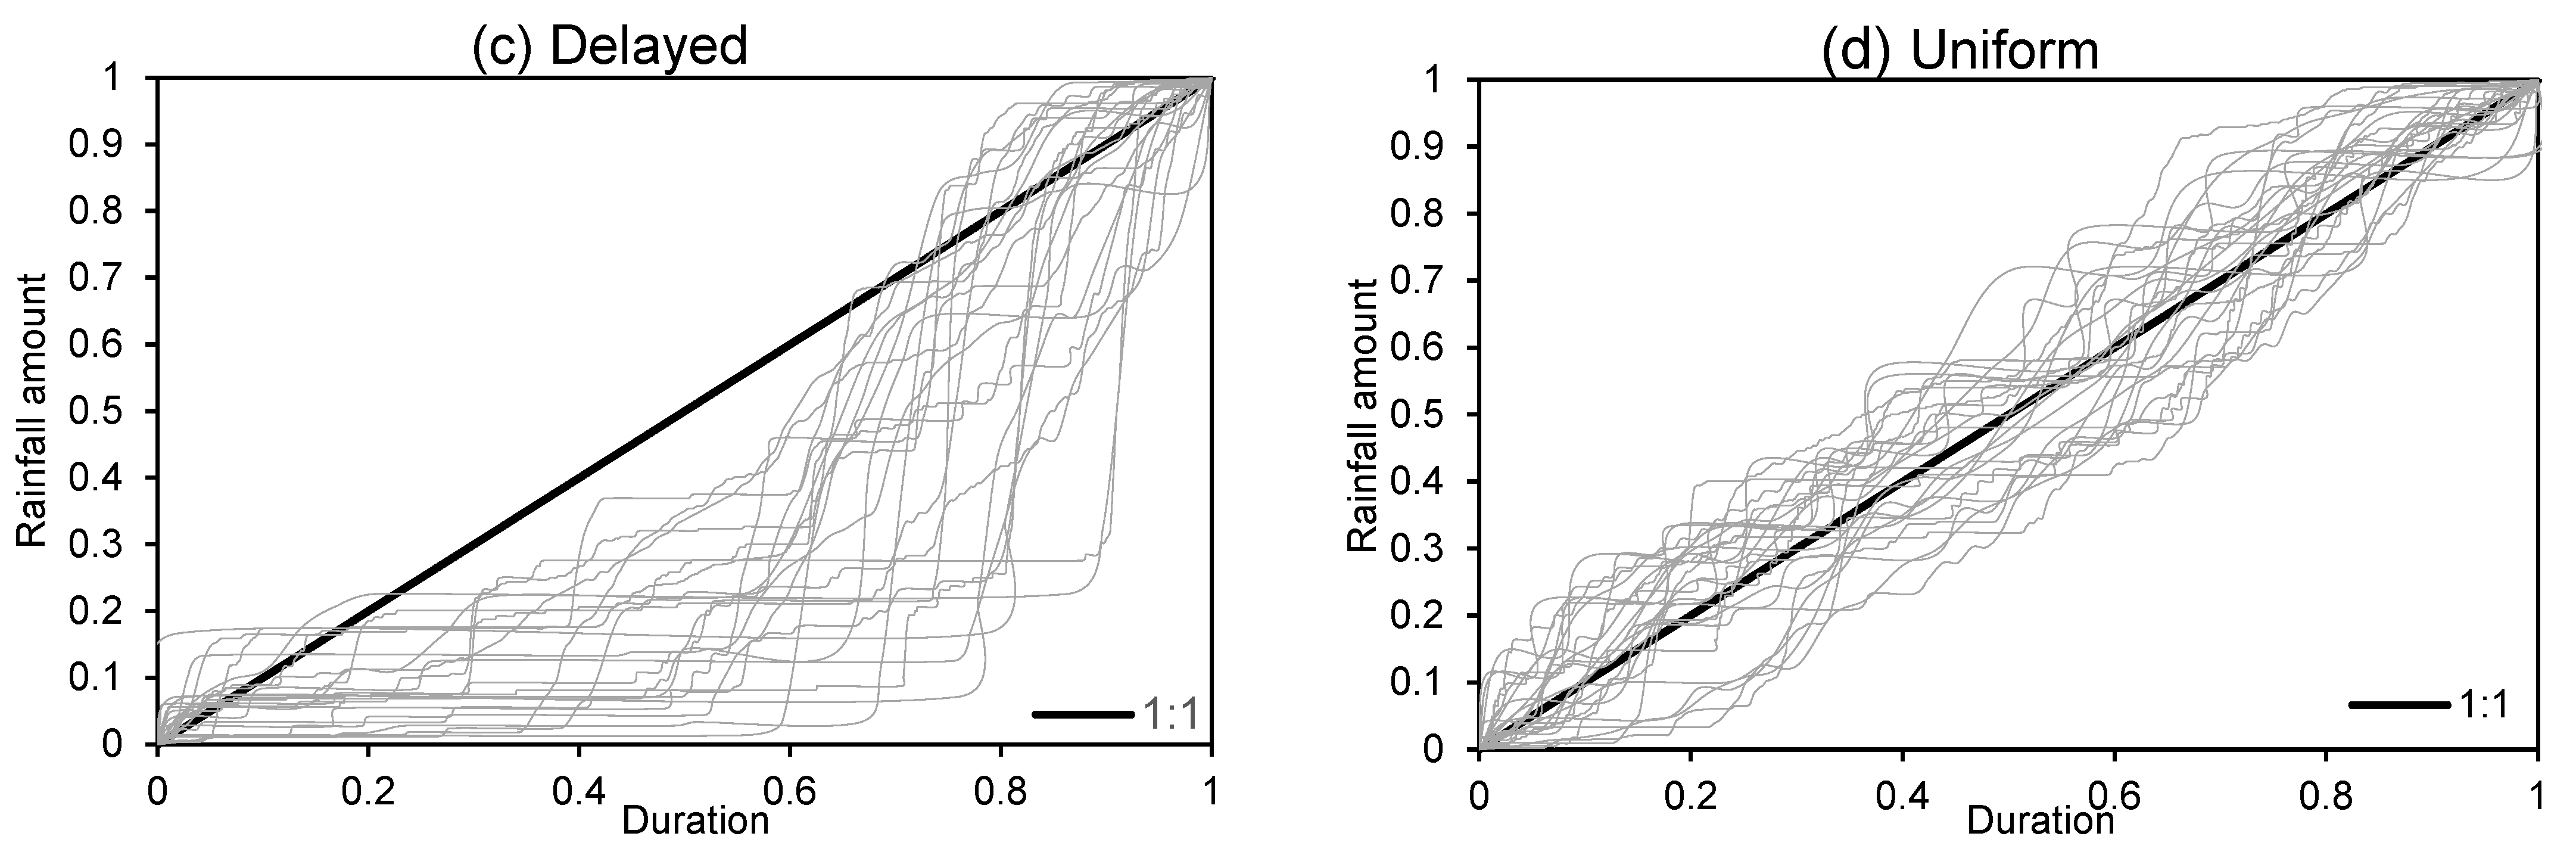
Figure 4.
A flow chart of the study.

Figure 5.
Proportion distributions of rainfall regimes for various duration and I30 groups: (A) is duration group, up to 4, 4–8, 8–16 and more than 16 h, (B) is I30 group, up to 4, 4–8, 8–16 and more than 16 mm h−1. Rainfall regimes include advanced, intermediate, delayed and uniform.
Figure 5.
Proportion distributions of rainfall regimes for various duration and I30 groups: (A) is duration group, up to 4, 4–8, 8–16 and more than 16 h, (B) is I30 group, up to 4, 4–8, 8–16 and more than 16 mm h−1. Rainfall regimes include advanced, intermediate, delayed and uniform.

Figure 6.
The runoff depth of surface for two tillage measures.
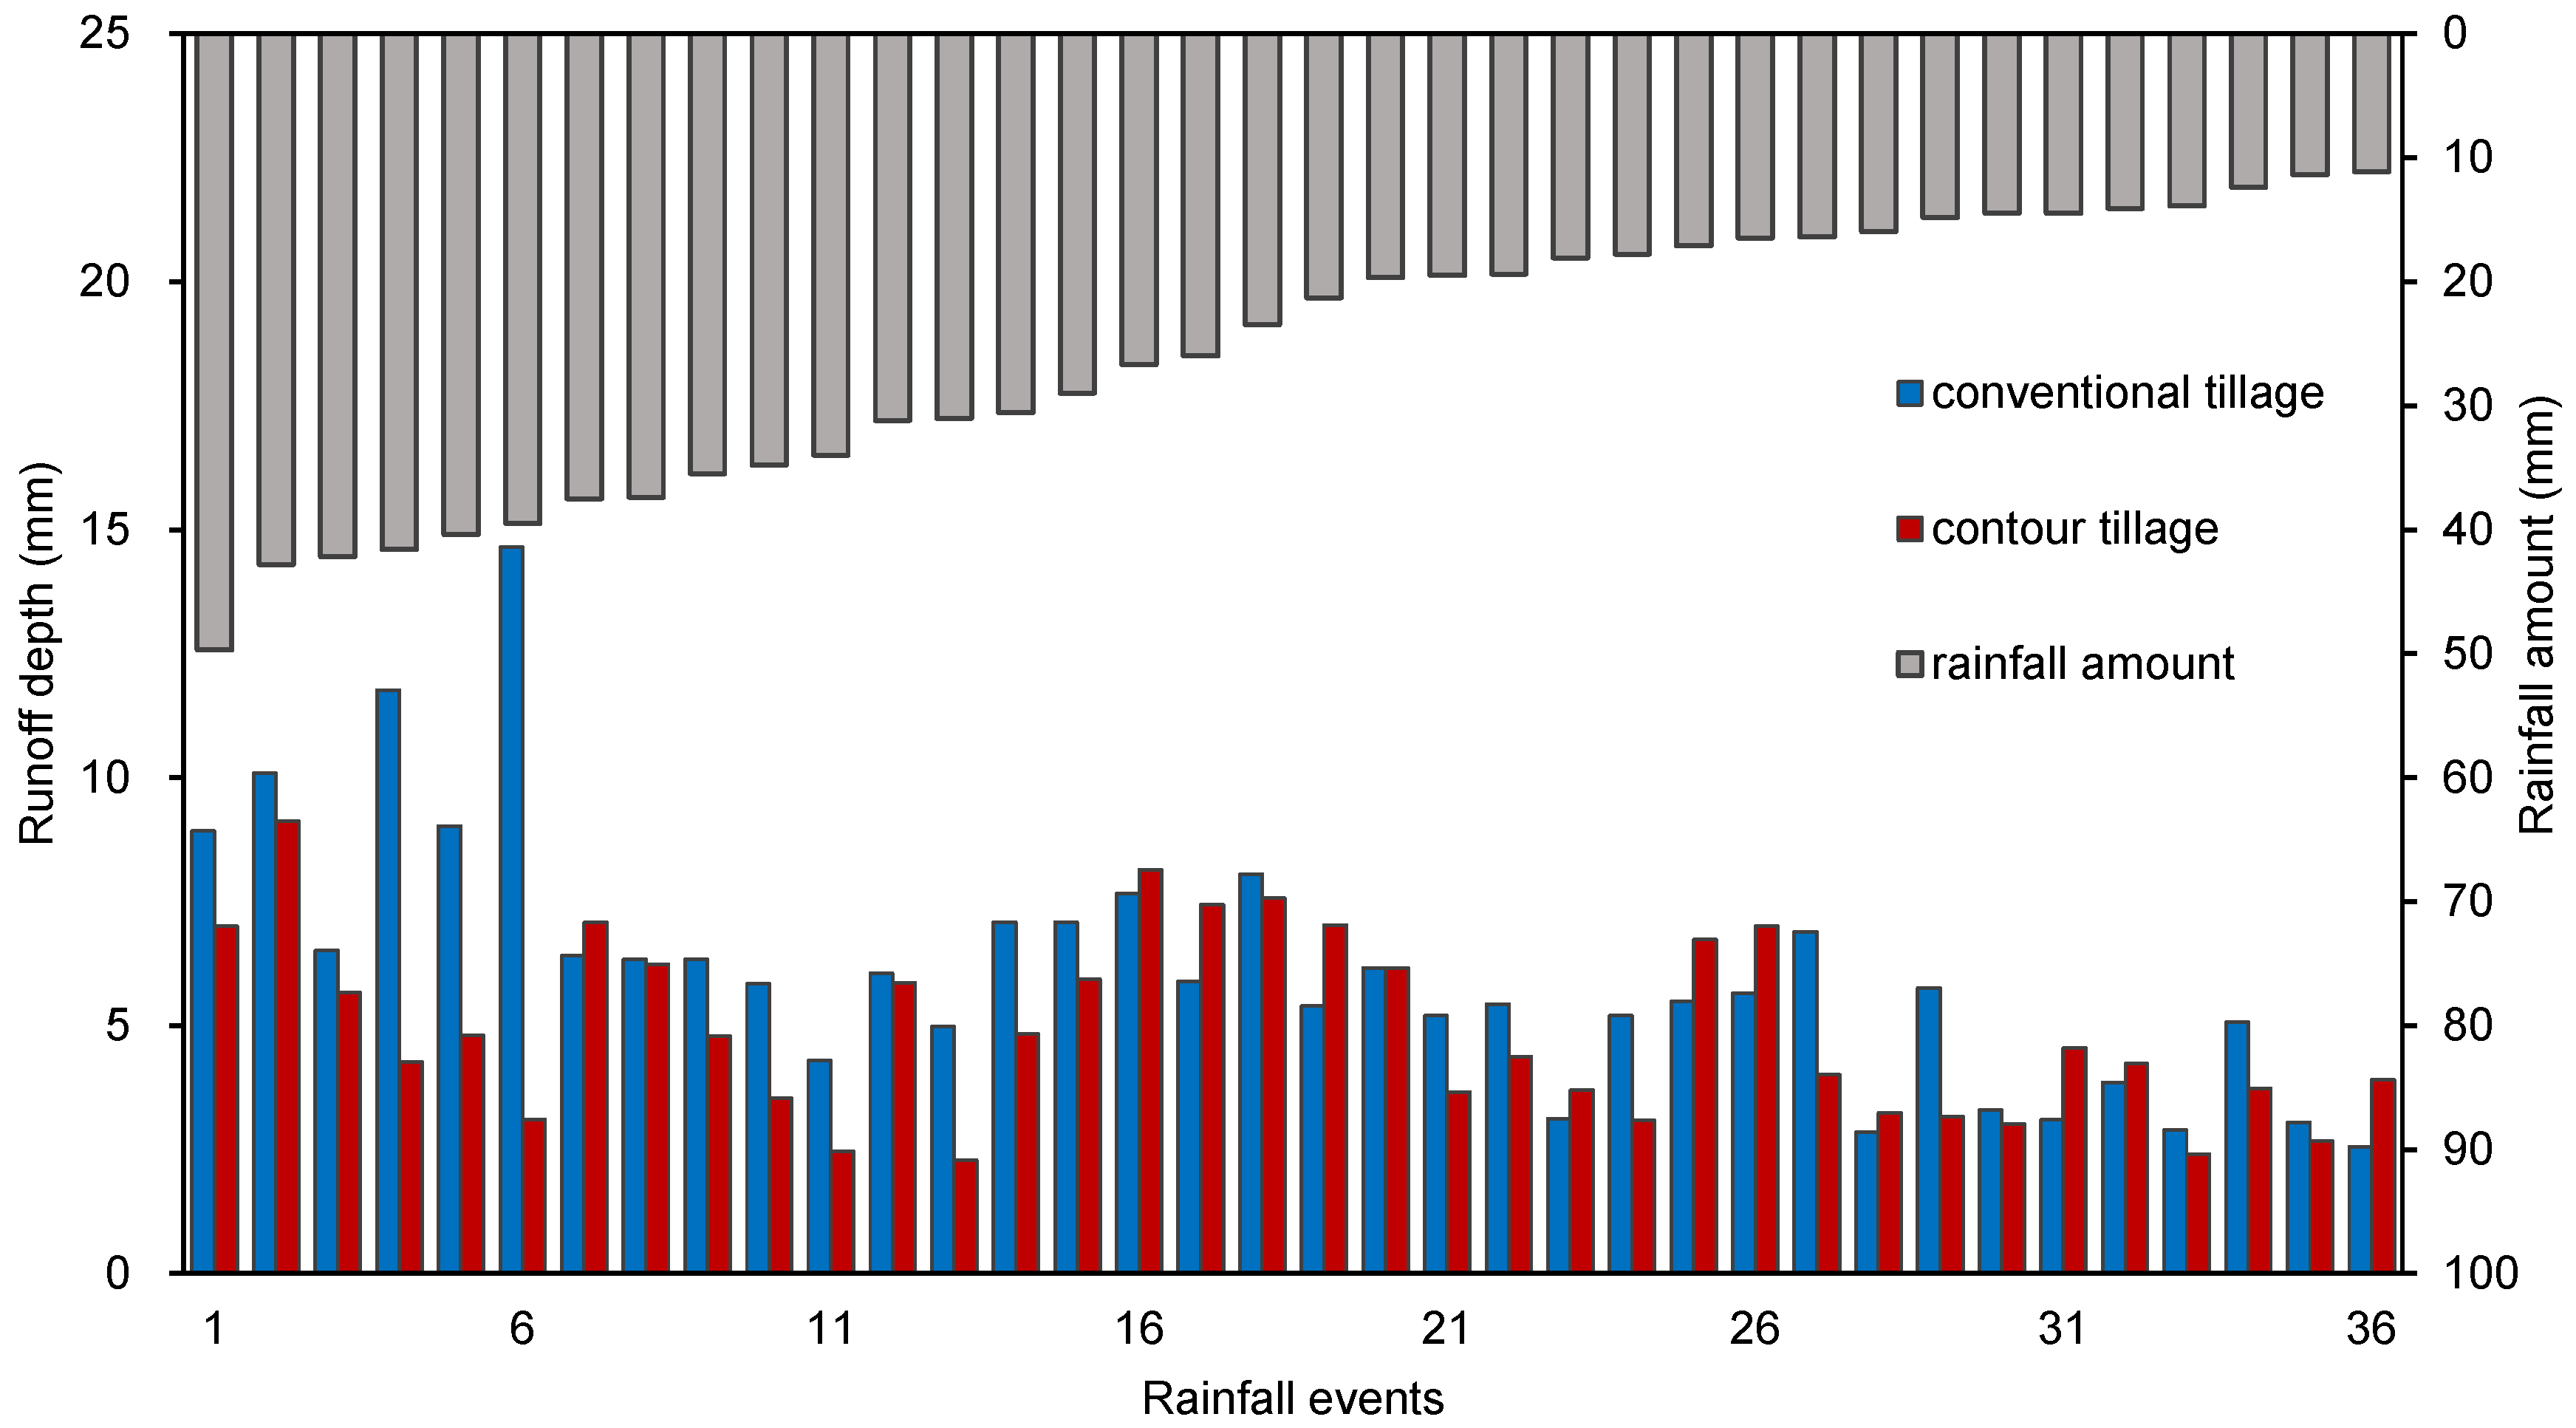
Figure 7.
The average surface runoff coefficient and runoff depth for four rainfall regimes.

Figure 8.
Evaporation and runoff depth of four rainfall regimes in low rainfall (rainfall amount: 4.3 to 6.5 mm), medium rainfall (rainfall amount: 13.9 to 16.9 mm), higher rainfall (rainfall amount: 27.4 to 31 mm) for two tillage measures. The analyzed rainfall occurring in March–April 2020. Tillage measures include conventional tillage and contour tillage.
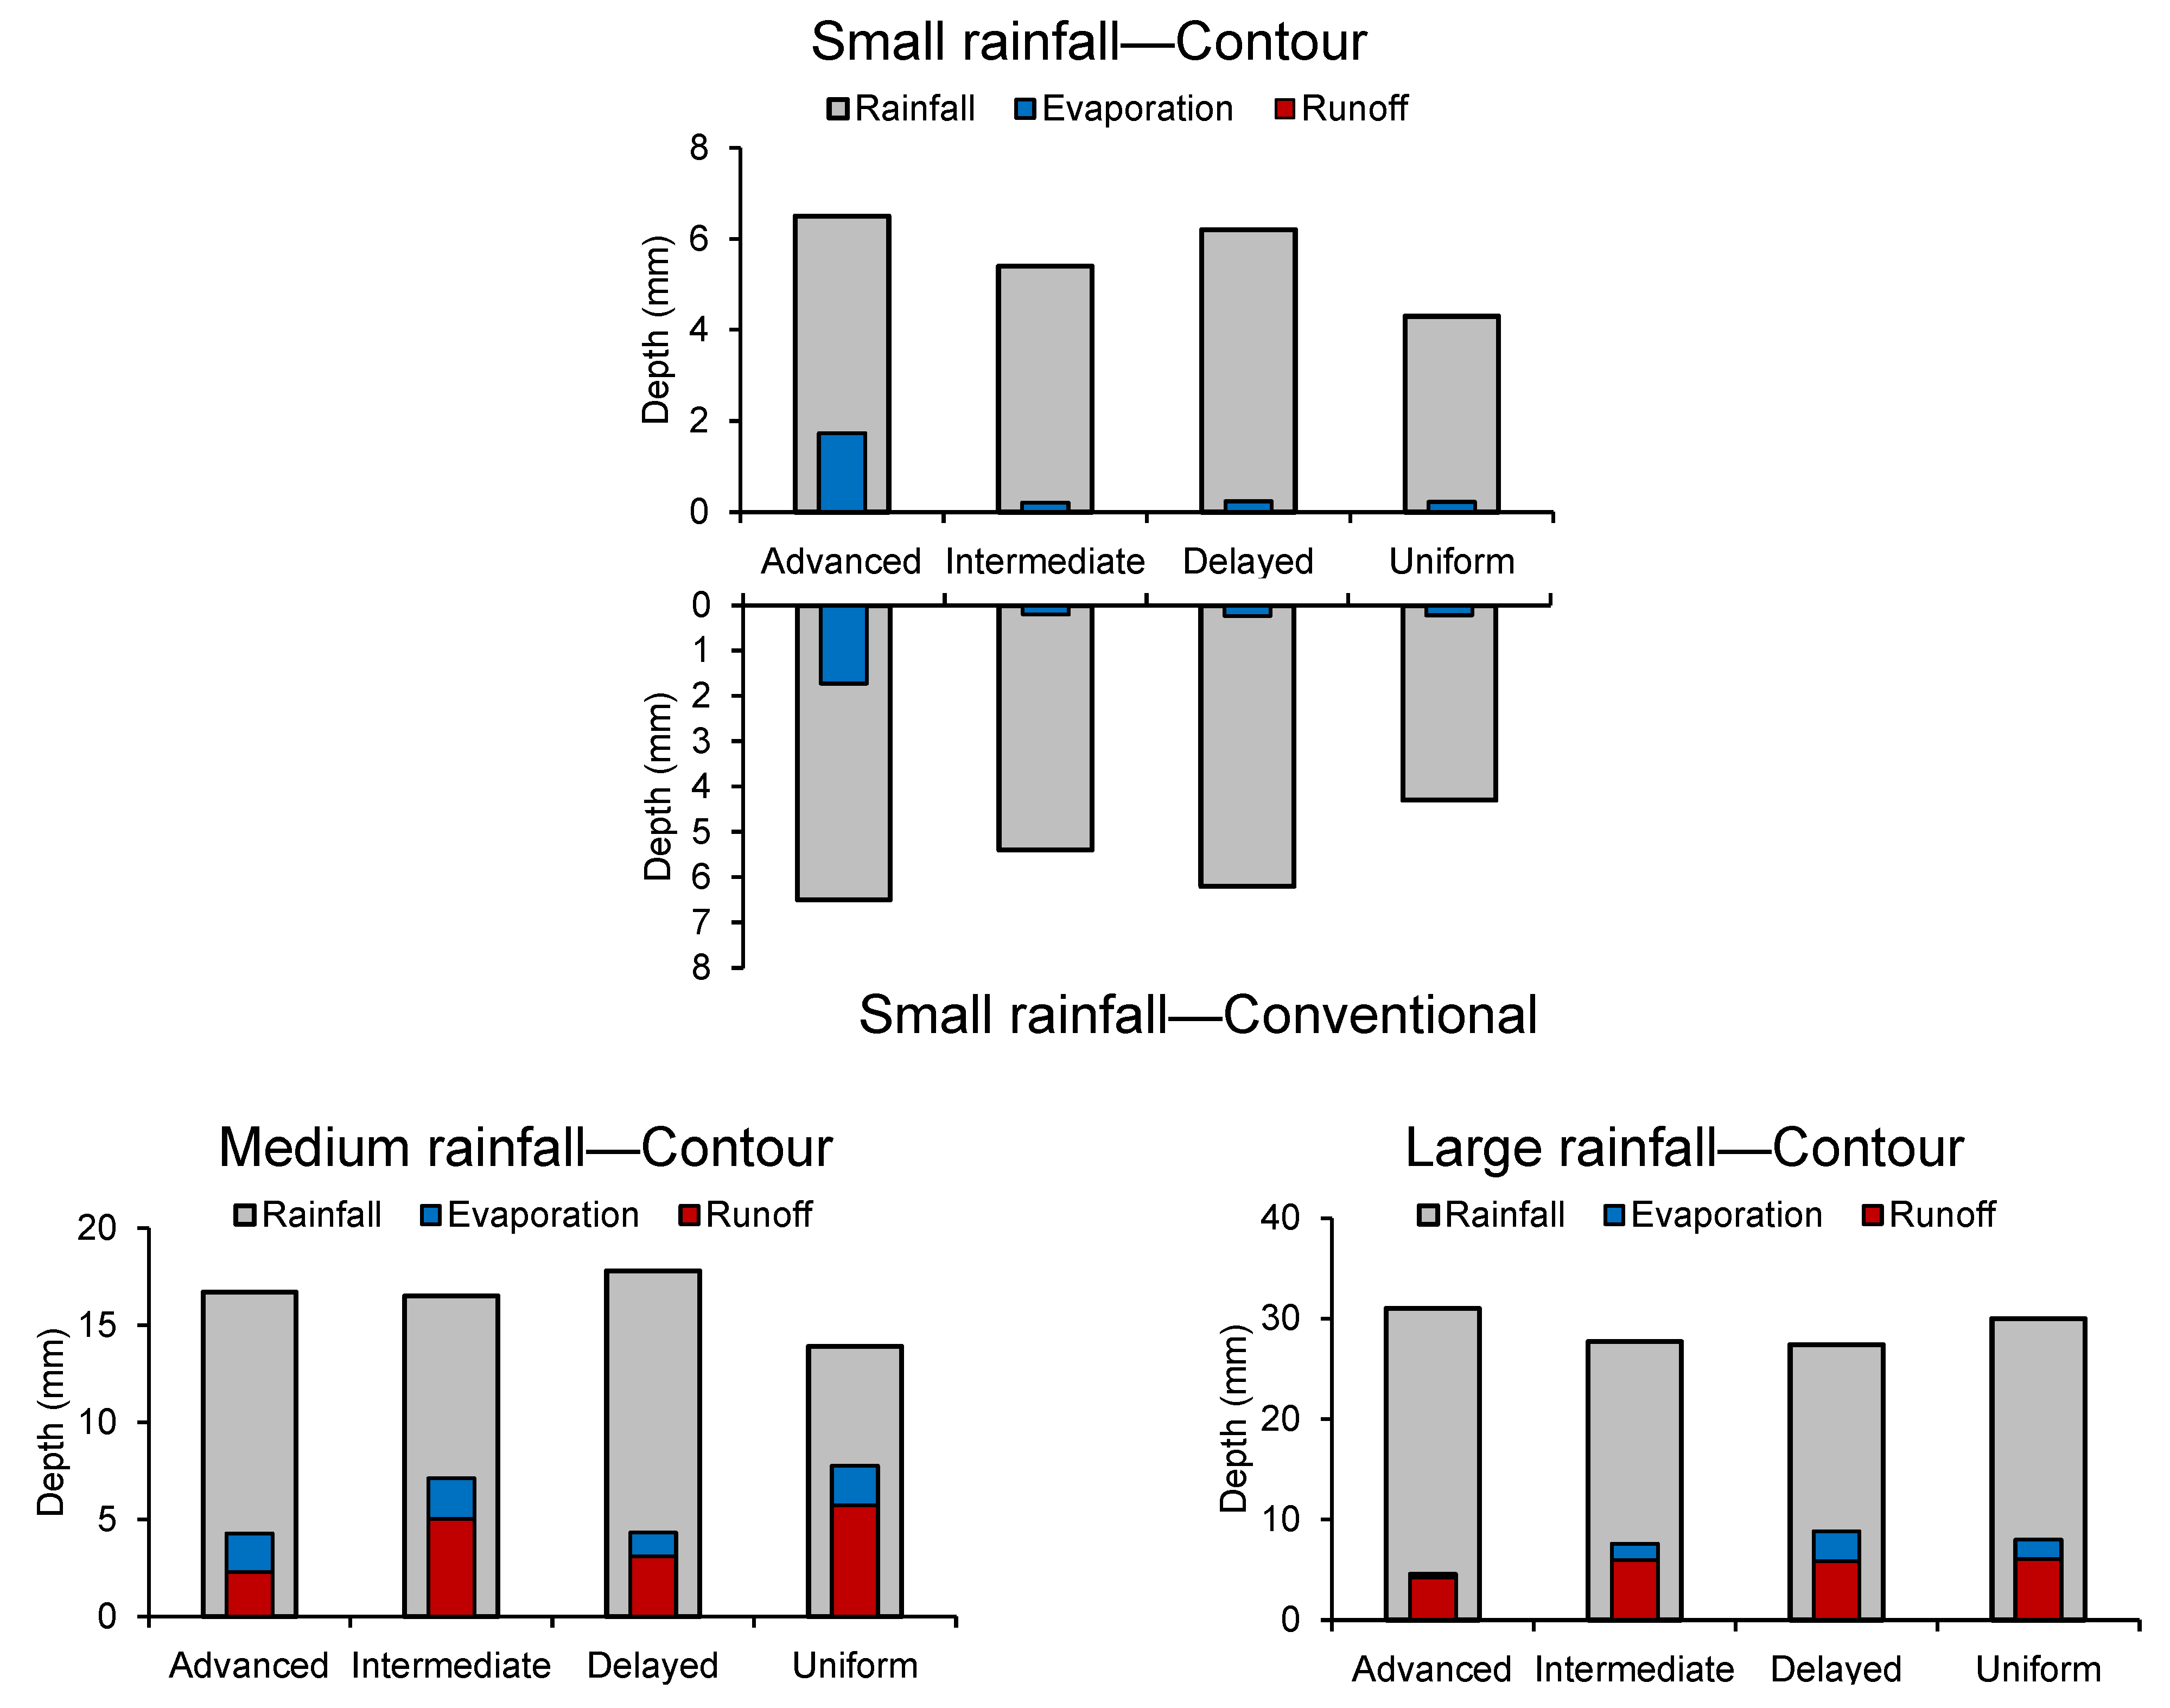

Figure 9.
Variation in the soil moisture content during single rainfall event of two tillage measures for four rainfall regimes in low rainfall (A), medium rainfall (B), high rainfall (C): (A) is low rainfall, rainfall amount ranges from 4.3 to 6.5 mm, (B) is medium rainfall, rainfall amount ranges from 13.9 to 16.9 mm, (C) is high rainfall, rainfall amount ranges from 27.4 to 31 mm. The analyzed rainfall occurring in March–April 2020. Tillage measures include conventional tillage and contour tillage. Rainfall regimes include advanced, intermediate, delayed and uniform.


Figure 10.
Rainfall amount, rainfall duration and the maximum 30 min rainfall intensity (I30) of four rainfall regimes. The antecedent dry day and the increment in soil moisture of two tillage measures for four rainfall regimes. Two tillage measures include conventional tillage and contour tillage. Rainfall regimes include (A) advanced, (B) intermediate, (C) delayed and (D) uniform.


Table 1.
Soil porosity in the runoff plot for two tillage measures.
| Tillage Measures | Soil Bulk Density | Total Porosity | Capillary Porosity | Non-Capillary Porosity | |
|---|---|---|---|---|---|
| Conventional | 0–20 cm | 50.80 ± 3.45 | 1.28 ± 0.07 | 37.97 ± 1.86 | 12.83 ± 1.96 |
| 20–40 cm | 45.08 ± 3.43 | 1.44 ± 0.07 | 35.83 ± 2.21 | 9.25 ± 1.23 | |
| Contour | 0–20 cm | 52.81 ± 4.70 | 1.22 ± 0.10 | 38.11 ± 1.58 | 14.70 ± 2.30 |
| 20–40 cm | 44.61 ± 3.12 | 1.44 ± 0.06 | 36.38 ± 1.99 | 8.22 ± 2.47 | |
Table 2.
The statistical characteristics of four rainfall regimes.
| Rainfall Regimes | Parameter | Frequency | Mean | Std. Dev | Median | Min | Max |
|---|---|---|---|---|---|---|---|
| Advanced | Rainfall amount (mm) | 68 | 16.82 | 23.27 | 7.95 | 0.60 | 109.10 |
| Rainfall duration (min) | 784.72 | 957.09 | 482.00 | 30.00 | 7065.00 | ||
| I30 (mm h−1) | 9.72 | 14.05 | 4.10 | 0.60 | 74.00 | ||
| Intermediate | Rainfall amount (mm) | 32 | 22.19 | 17.89 | 16.45 | 0.90 | 70.30 |
| Rainfall duration (min) | 900.00 | 720.58 | 750.00 | 45.00 | 2630.00 | ||
| I30 (mm h−1) | 13.00 | 11.49 | 7.80 | 1.20 | 44.60 | ||
| Delayed | Rainfall amount (mm) | 24 | 15.17 | 17.18 | 12.80 | 0.60 | 84.50 |
| Rainfall duration (min) | 740.00 | 574.08 | 680.00 | 110.00 | 2235.00 | ||
| I30 (mm h−1) | 9.88 | 9.59 | 7.10 | 0.80 | 38.60 | ||
| Uniform | Rainfall amount (mm) | 24 | 13.33 | 28.10 | 3.70 | 0.30 | 117.10 |
| Rainfall duration (min) | 874.24 | 1435.81 | 350.00 | 30.00 | 6310.00 | ||
| I30 (mm h−1) | 3.54 | 5.34 | 1.40 | 0.20 | 21.20 |
Table 3.
Monthly average soil moisture during the study period across two tillage measures.
| Month/ Year | Rainfall (mm) | Total Duration (min) | I30 (mm h−1) | Conventional Tillage | Contour Tillage | ||
|---|---|---|---|---|---|---|---|
| 20 cm (%) | 40 cm (%) | 20 cm (%) | 40 cm (%) | ||||
| 05/2019 | 90.40 | 6255.00 | 7.72 | 35.94 ± 0.95 a | 37.19 ± 0.79 a | 35.45 ± 0.97 a | 37.70 ± 0.66 a |
| 06/2019 | 151.10 | 7480.00 | 7.34 | 35.67 ± 1.54 a | 37.33 ± 0.78 a | 35.39 ± 1.36 a | 37.79 ± 0.83 a |
| 07/2019 | 278.10 | 4455.00 | 16.83 | 30.74 ± 4.54 b | 36.12 ± 2.55 b | 32.79 ± 3.25 b | 36.98 ± 1.95 b |
| 08/2019 | 48.90 | 240.00 | 28.20 | 20.56 ± 2.27 i | 25.76 ± 1.69 i | 23.93 ± 1.90 i | 28.16 ± 1.46 g |
| 09/2019 | 7.90 | 1020.00 | 4.00 | 16.92 ± 0.48 j | 22.08 ± 0.34 j | 20.26 ± 0.60 k | 25.09 ± 0.38 j |
| 10/2019 | 11.60 | 1910.00 | 1.80 | 16.09 ± 0.44 l | 21.71 ± 0.40 k | 19.13 ± 0.60 l | 24.31 ± 0.49 j |
| 11/2019 | 27.20 | 3190.00 | 1.30 | 17.65 ± 1.66 l | 22.46 ± 0.84 k | 19.57 ± 0.79 l | 24.70 ± 0.66 j |
| 12/2019 | 30.60 | 4875.00 | 1.87 | 19.31 ± 0.93 j | 23.56 ± 1.23 j | 21.69 ± 1.52 j | 25.51 ± 0.29 i |
| 01/2020 | 198.30 | 12,205.00 | 4.63 | 24.57 ± 4.16 d | 32.41 ± 5.84 f | 30.85 ± 4.48 d | 33.27 ± 4.95 d |
| 02/2020 | 101.70 | 6320.00 | 2.20 | 24.56 ± 2.82 c | 33.39 ± 4.23 c | 32.14 ± 1.94 c | 36.39 ± 1.23 c |
| 03/2020 | 182.90 | 7180.00 | 6.11 | 23.84 ± 3.31 c | 29.04 ± 4.91 d | 31.84 ± 2.79 c | 35.72 ± 2.02 e |
| 04/2020 | 89.30 | 3605.00 | 8.83 | 21.98 ± 3.20 e | 28.55 ± 4.65 e | 29.42 ± 3.98 e | 33.76 ± 2.53 ef |
| 05/2020 | 180.00 | 5160.00 | 9.29 | 18.72 ± 2.52 g | 28.19 ± 1.83 g | 27.31 ± 1.03 g | 32.56 ± 0.56 f |
| 06/2020 | 238.40 | 7630.00 | 8.70 | 18.82 ± 2.13 f | 22.12 ± 5.54 d | 28.33 ± 2.66 f | 35.64 ± 1.58 j |
| 07/2020 | 393.40 | 9144.00 | 18.91 | 21.37 ± 3.18 e | 24.63 ± 5.36 d | 28.96 ± 3.73 e | 35.60 ± 2.11 h |
| 08/2020 | 149.60 | 3282.00 | 22.07 | 17.00 ± 4.86 h | 25.68 ± 4.09 h | 24.49 ± 3.90 h | 31.88 ± 2.66 g |
| Mean (%) | 22.73 ± 6.13 | 28.14 ± 5.41 | 27.59 ± 5.32 | 32.19 ± 4.82 | |||
| CV (%) | 26.957 | 19.226 | 19.905 | 15.460 | |||
Note(s): data are mean ± standard deviation in the table. Different letters designate the significant variances at p < 0.05 among different months.
Table 4.
The value of the soil moisture of three stages (before, in and after the rain) of conventional tillage for four rainfall regimes in different rainfall amount.
Table 4.
The value of the soil moisture of three stages (before, in and after the rain) of conventional tillage for four rainfall regimes in different rainfall amount.
| Rainfall Amount (mm) | Rainfall Regime | Before the Rain 1 | In the Rain 1 | After the Rain 1 | |||
|---|---|---|---|---|---|---|---|
| 20 cm (%) | 40 cm (%) | 20 cm (%) | 40 cm (%) | 20 cm (%) | 40 cm (%) | ||
| 6.5 | Advanced | 21.86 ± 2.98 | 25.49 ± 5.48 | 21.90 ± 2.44 | 23.33 ± 4.70 | 22.68 ± 1.83 | 26.64 ± 4.31 |
| 5.4 | Intermediate | 34.68 ± 0.24 | 36.66 ± 0.26 | 34.84 ± 0.18 | 36.85 ± 0.14 | 34.87 ± 0.19 | 36.87 ± 0.18 |
| 6.2 | Delayed | 25.09 ± 0.39 | 27.43 ± 0.26 | 24.46 ± 0.20 | 27.48 ± 0.12 | 24.36 ± 0.54 | 27.38 ± 0.32 |
| 4.3 | Uniform | 37.82 ± 0.78 | 38.42 ± 0.56 | 38.11 ± 0.22 | 38.37 ± 0.13 | 38.55 ± 0.28 | 38.62 ± 0.17 |
| 16.7 | Advanced | 20.59 ± 3.40 | 25.18 ± 3.01 | 25.49 ± 2.68 | 25.52 ± 3.82 | 22.32 ± 7.58 | 19.66 ± 8.39 |
| 16.5 | Intermediate | 25.13 ± 1.21 | 31.17 ± 4.18 | 28.03 ± 1.75 | 32.64 ± 4.14 | 26.71 ± 1.06 | 28.34 ± 5.27 |
| 17.8 | Delayed | 22.78 ± 1.72 | 26.23 ± 4.39 | 22.00 ± 0.38 | 26.80 ± 2.62 | 27.36 ± 1.49 | 31.79 ± 3.82 |
| 13.9 | Uniform | 20.24 ± 1.15 | 30.72 ± 5.00 | 20.47 ± 0.46 | 34.02 ± 0.17 | 22.58 ± 1.06 | 29.04 ± 4.79 |
| 31.0 | Advanced | 18.46 ± 1.41 | 28.25 ± 3.09 | 29.06 ± 4.57 | 28.20 ± 4.22 | 27.62 ± 1.68 | 30.85 ± 4.47 |
| 27.7 | Intermediate | 23.44 ± 0.64 | 34.42 ± 2.91 | 29.06 ± 1.7 | 36.7 ± 1.68 | 27.96 ± 1.33 | 36.02 ± 2.41 |
| 27.4 | Delayed | 25.18 ± 1.12 | 33.40 ± 3.29 | 25.78 ± 1.90 | 33.15 ± 2.63 | 27.78 ± 0.80 | 31.26 ± 4.40 |
| 30.0 | Uniform | 25.88 ± 1.14 | 27.20 ± 4.38 | 27.56 ± 2.37 | 24.95 ± 4.63 | 26.13 ± 0.43 | 26.16 ± 4.09 |
Note(s): data are ‘mean ± standard deviation’ in the table. 1 Soil moisture content ‘before the rain’ is the soil moisture content one hour before the rainfall, ‘in the rain’ is mean value of the soil moisture for the entire duration of single rainfall event, ‘after the rain’ is mean value of soil moisture one hour after the rainfall.
Table 5.
The value of the soil moisture of three stages (before, in and after the rain) of contour tillage for four rainfall regimes in different rainfall amounts.
Table 5.
The value of the soil moisture of three stages (before, in and after the rain) of contour tillage for four rainfall regimes in different rainfall amounts.
| Rainfall Amount (mm) | Rainfall Regime | Before the Rain 1 | In the Rain 1 | After the Rain 1 | |||
|---|---|---|---|---|---|---|---|
| 20 cm (%) | 40 cm (%) | 20 cm (%) | 40 cm (%) | 20 cm (%) | 40 cm (%) | ||
| 6.5 | Advanced | 30.36 ± 2.44 | 33.99 ± 1.87 | 30.06 ± 2.47 | 33.95 ± 1.42 | 30.24 ± 2.44 | 33.73 ± 3.09 |
| 5.4 | Intermediate | 34.29 ± 0.24 | 37.13 ± 0.22 | 34.32 ± 0.08 | 37.26 ± 0.10 | 34.41 ± 0.16 | 37.22 ± 0.13 |
| 6.2 | Delayed | 27.43 ± 0.38 | 28.36 ± 0.20 | 26.72 ± 0.18 | 28.49 ± 0.15 | 26.40 ± 0.41 | 28.35 ± 0.26 |
| 4.3 | Uniform | 37.41 ± 0.57 | 38.87 ± 0.58 | 37.67 ± 0.22 | 38.94 ± 0.17 | 38.01 ± 0.23 | 39.19 ± 0.25 |
| 16.7 | Advanced | 27.13 ± 0.79 | 30.99 ± 0.34 | 28.96 ± 1.48 | 31.51 ± 0.27 | 35.72 ± 0.91 | 35.95 ± 0.85 |
| 16.5 | Intermediate | 33.08 ± 0.45 | 36.92 ± 0.39 | 34.55 ± 1.23 | 37.60 ± 0.68 | 34.32 ± 0.41 | 37.87 ± 0.25 |
| 17.8 | Delayed | 30.68 ± 0.82 | 33.79 ± 1.89 | 31.15 ± 0.27 | 34.73 ± 0.12 | 34.19 ± 0.38 | 36.11 ± 0.21 |
| 13.9 | Uniform | 29.01 ± 0.19 | 34.46 ± 0.25 | 29.51 ± 0.59 | 34.61 ± 0.24 | 30.33 ± 0.21 | 34.49 ± 0.19 |
| 31.0 | Advanced | 27.11 ± 2.10 | 32.51 ± 1.30 | 29.55 ± 1.90 | 33.25 ± 0.83 | 32.04 ± 1.48 | 34.13 ± 0.56 |
| 27.7 | Intermediate | 30.81 ± 0.27 | 35.68 ± 0.26 | 34.28 ± 1.35 | 36.62 ± 0.63 | 34.41 ± 0.56 | 37.56 ± 0.19 |
| 27.4 | Delayed | 32.68 ± 0.23 | 36.79 ± 0.25 | 33.02 ± 0.98 | 36.74 ± 0.14 | 35.05 ± 0.28 | 38.28 ± 0.28 |
| 30.0 | Uniform | 33.99 ± 0.17 | 37.67 ± 0.11 | 35.16 ± 0.99 | 38.02 ± 0.56 | 34.90 ± 0.25 | 38.29 ± 0.20 |
Note(s): data are ‘mean ± standard deviation’ in the table. 1 Soil moisture content ‘before the rain’ is the soil moisture content one hour before the rainfall, ‘in the rain’ is mean value of the soil moisture for the entire duration of single rainfall event, ‘after the rain’ is mean value of soil moisture one hour after the rainfall.
Table 6.
Statistical analysis for the increment in the soil moisture with ADD, I30, rainfall amount and duration.
Table 6.
Statistical analysis for the increment in the soil moisture with ADD, I30, rainfall amount and duration.
| Rainfall Regime | Parameter | Conventional Tillage | Contour Tillage | ||
|---|---|---|---|---|---|
| 20 cm | 40 cm | 20 cm | 40 cm | ||
| Advanced | ADD (days) | 0.367 | 0.039 | 0.482 * | −0.043 |
| I30 (mm h−1) | 0.581 * | 0.101 | 0.536 * | −0.036 | |
| Rainfall amount (mm) | 0.568 ** | 0.121 | 0.590 ** | 0.420 * | |
| Rainfall duration (min) | −0.050 | 0.043 | −0.111 | 0.292 | |
| Intermediate | ADD (days) | −0.288 | −0.424 | −0.118 | −0.079 |
| I30 (mm h−1) | 0.435 | 0.022 | 0.525 | 0.419 | |
| Rainfall amount (mm) | 0.657 * | 0.352 | 0.741 ** | 0.736 ** | |
| Rainfall duration (min) | 0.436 | 0.401 | 0.448 | 0.511 | |
| Delayed | ADD (days) | −0.551 | −0.217 | −0.666 * | −0.213 |
| I30 (mm h−1) | −0.020 | 0.375 | 0.190 | 0.250 | |
| Rainfall amount (mm) | 0.628 | 0.300 | 0.430 | 0.202 | |
| Rainfall duration (min) | 0.625 | 0.194 | 0.430 | 0.192 | |
| Uniform | ADD (days) | 0.355 | 0.418 | 0.307 | 0.110 |
| I30 (mm h−1) | 0.367 | −0.351 | 0.558 | 0.419 | |
| Rainfall amount (mm) | 0.628 | −0.119 | 0.765 * | 0.597 | |
| Rainfall duration (min) | 0.850 ** | 0.063 | 0.854 ** | 0.567 | |
Note(s): asterisks present the significance levels of the correlation (* for p < 0.05, ** for p < 0.01, respectively) based on LSD (the least significant difference) method.
Disclaimer/Publisher’s Note: The statements, opinions and data contained in all publications are solely those of the individual author(s) and contributor(s) and not of MDPI and/or the editor(s). MDPI and/or the editor(s) disclaim responsibility for any injury to people or property resulting from any ideas, methods, instructions or products referred to in the content. |
© 2024 by the authors. Licensee MDPI, Basel, Switzerland. This article is an open access article distributed under the terms and conditions of the Creative Commons Attribution (CC BY) license (https://creativecommons.org/licenses/by/4.0/).
Share and Cite
MDPI and ACS Style
Liang, Z.; Chen, X.; Wang, C.; Zhang, Z. Response of Soil Moisture to Four Rainfall Regimes and Tillage Measures under Natural Rainfall in Red Soil Region, Southern China. Water 2024, 16, 1331. https://doi.org/10.3390/w16101331
AMA Style
Liang Z, Chen X, Wang C, Zhang Z. Response of Soil Moisture to Four Rainfall Regimes and Tillage Measures under Natural Rainfall in Red Soil Region, Southern China. Water. 2024; 16(10):1331. https://doi.org/10.3390/w16101331
Chicago/Turabian StyleLiang, Ziwei, Xiaoan Chen, Ce Wang, and Zhanyu Zhang. 2024. "Response of Soil Moisture to Four Rainfall Regimes and Tillage Measures under Natural Rainfall in Red Soil Region, Southern China" Water 16, no. 10: 1331. https://doi.org/10.3390/w16101331
Note that from the first issue of 2016, this journal uses article numbers instead of page numbers. See further details here.