Article

Effects of Different Reclamation Years and Modes on Soil Moisture Transport Pathways and Permeability Characteristics in an Open-Pit Mining Area in Guangxi

1
Collaborative Innovation Center for Water Pollution Controland Water Safety in Karst Area, Guilin University of Technology, Guilin 541006, China
2
Guangxi Key Laboratory of Theory and Technology for Environmental Pollution Control, Guilin University of Technology, Guilin 541006, China
3
College of Environmental Science and Engineering, Guilin University of Technology, Guilin 541006, China
4
Agricultural Resource and Environment Research Institute, Guangxi Academy of Agricultural Sciences, Nanning 530007, China
*
Authors to whom correspondence should be addressed.
Water 2024, 16(9), 1307; https://doi.org/10.3390/w16091307
Submission received: 30 March 2024 / Revised: 30 April 2024 / Accepted: 2 May 2024 / Published: 4 May 2024

Abstract

:
The microstructural characteristics of reclaimed soil in Guangxi’s bauxite mining area play a pivotal role in determining soil reclamation quality, yet they remain poorly understood. To explore the impact of varying reclamation years and modes on pore structure characteristics in this region, we selected four reclamation regions: grassland reclamation with 2 years (RG2a), grassland reclamation with 10 years (RG10a), bare ground reclamation with 2 years (RW2a) and bare ground reclamation with 10 years (RW10a). Utilizing X-ray CT technology, we scanned soil columns within a 30 cm depth to analyze pore distributions using Avizo 2020 software combined with ImageJ 1.53c and its plugins. The findings revealed a significant increase in the number of 2D and 3D macropores by 1.09% and 88.89% in RG10a compared to RG2a, as well as 39.01% and 13.33% in RG10a compared to RW10a, respectively. Furthermore, RG10a was observed to be more effective in enhancing the rounding rate of macropores and mesopores, as well as average branch length and density. Additionally, RG10a demonstrated a greater capacity to increase porosity and connectivity while reducing curvature and specific surface area among the three-dimensional parameters. The 3D reconstruction illustrated that RG modes exhibited a more abundant distribution of macropores compared to RW modes and 10a modes showed a higher presence of macropores than 2a modes, which displayed a tilted laminar pattern. Soil moisture movement simulations conducted through Avizo 2020 under various modes indicated that RG modes presented a more extensive capacity for vertical flow, while 10a modes displayed more abundant flow lines and a higher infiltration rate (K) compared to 2a modes. In conclusion, prolonged reclamation years favoring grassland reclamation modes could enhance water and nutrient transport pathways toward traditional agricultural soil.

1. Introduction

Bauxite reserves in Guangxi, China constitute 20.2% of China’s total reserves and represent one of the major bauxite output sites in the country [1]. Guangxi’s complex geological environment, widespread karst areas, uneven precipitation distribution and seasonal droughts have led to continuous soil quality degradation in the region [2,3]. Furthermore, the growing demand for bauxite resources and increased mechanization in mining have caused large-scale machinery to compact and damage topsoil and vegetation, intensifying soil water loss and degradation [4]. Soil structure, which includes the arrangement of solids and pores at different scales such as soil pore structure and aggregates, is a key factor affecting soil fertility and quality [5,6,7]. Specifically, a favorable soil pore structure plays a vital role in providing adequate water and gas for roots and soil organisms [7,8]. Therefore, studying the soil pore structure characteristics in open-pit bauxite mining areas in Guangxi is crucial for devising targeted reclamation strategies to boost soil fertility, enhance plant growth and promote sustainable ecosystem development.
When mining activities are conducted in designated areas, the utilization of large-scale machinery can lead to soil compaction damage within these mining zones [9,10]. This compacted soil typically exhibits reduced macroporosity, resulting in increased mechanical impedance that hampers plant root growth and impacts vegetation recovery [10,11,12]. Hence, a comprehensive study and analysis of macroporosity characteristics in mine reclamation efforts become imperative. Research by Cai et al. [13] has demonstrated an enhancement in soil pore structure characteristics with the progression of reclamation years. Wang et al. [14] noted that compaction tends to diminish parameters associated with soil pore structure; however, soil reclamation efforts can effectively enhance the overall soil pore structure. Typically, the saturated hydraulic conductivity of reclaimed mine soils is lower than that of adjacent forest soils and undergoes significant changes following deep soil disturbance [15]. Implementing reclamation measures such as deep soil loosening and green manure planting during the process can notably enhance the physical properties of the reclaimed soil, specifically the parameters associated with the surface layer’s soil macroporous structure. [16,17]. In their study, Xia et al. [18] unveiled the correlation between soil macropores and hydraulic conductivity, emphasizing that water transport and storage are contingent upon the distribution of pore sizes and geometric shapes [19]. Ju et al. [20] revealed the interconnectedness of soil water movement with soil structure, particularly its pore size distribution, highlighting the pivotal role of soil pore structure in infiltration mechanisms. Additionally, Talukder et al. [21] studied the connection between soil hydraulic properties and porosity, revealing that extended no-tillage practices promote the creation of stable macropores and a consistent, vertically oriented effective porosity system, enhancing soil water transport.
With the ongoing advancement of X-ray CT scanning technology, its widespread application in examining soil pore structure within compacted and reclaimed soils in mining areas is becoming increasingly prevalent due to its non-invasive and convenient nature [4,17,22]. This technology has proven to be an effective means of visualizing and quantifying soil structure. Additionally, 3D modeling software programs like ImageJ and Avizo are used to measure soil pore geometric features (e.g., pore number, volume, shape, rounding rate and size distribution) and spatial distribution (e.g., connectivity and curvature) [7,23,24,25,26], resulting in a detailed three-dimensional reconstruction. Building upon the three-dimensional reconstruction model, the impact of macropores on soil moisture, including saturated hydraulic conductivity, moisture characteristic curve and simulated absolute permeability test, has been explored [27,28]. In Guangxi, existing research on mine reclamation soil primarily concentrates on reclaimed soil nutrients and remediation modes [29,30], with a noticeable dearth of studies focusing on quantifying the pore structure of mine reclamation soil using CT technology. Contrasted with general agricultural land in Guangxi, reclaimed soils in open-pit mining areas tend to endure significant mechanical compaction, resulting in substantial structural damage and altered soil pore conditions [4]. Despite this, the characterization of soil pore structure under different reclamation years and modes in Guangxi remains opaque.
Therefore, the primary objectives of this study were as follows: (1) Quantitatively analyze the pore structure parameters of soil in the open-pit mining area in Guangxi using CT scanning technology. (2) Reconstruct the three-dimensional pore distribution of the reclaimed soil and simulate soil moisture movement using a three-dimensional visualization model to elucidate the alteration mechanism of the reclamation of the open-pit mining area on the soil structure. (3) Analyze the effect of soil reclamation on the development of soil macropore characteristics, to provide practical recommendations for follow-up reclamation efforts. The findings of this study are valuable for assessing the effects of different reclamation years and modes on soil pore structure. Additionally, they hold scientific significance in promoting sustainable improvements in the quality of the reclaimed soil in bauxite mining areas in Guangxi.

2. Materials and Methods

2.1. Overview of the Experimental Area

The experimental area is situated in Gohua Town, Pingguo City and Baise City, Guangxi Zhuang Autonomous Region, China (23°44′ N; 107°45′ E), on the western side of Pingguo City along the banks of the Right River. The climate is characterized as subtropical monsoon, with an average annual sunshine duration of 1682 h, evapotranspiration of 1572.6 mm and an average annual air temperature of 25.5 °C. The average annual rainfall measures 1298 mm, with an average annual relative humidity of 66%. The overview diagram of the study area is depicted in Figure 1. Four stable sub-areas were chosen in the experimental site representing varying reclamation years and modes: RG2a (2 years grassland reclamation), RG10a (10 years grassland reclamation), RW2a (2 years bare land reclamation) and RW10a (10 years bare land reclamation). Three replicates were established for each treatment, labeled as RG2a-1, RG2a-2, RG2a-3, RG10a-1, RG10a-2, RG10a-3, RW2a-1, RW2a-2, RW2a-3 and RW10a-1, RW10a-2, RW10a-3, respectively.

2.2. Sample Collection and Determination of Soil Physical and Chemical Properties

Considering the reclamation techniques in the test area, three random sampling points were selected for each treatment. Approximately 2 kg of loose soil and 200 cm3 of in situ soil samples (collected using a ring knife at 0–30 cm depth) were obtained. A 10 cm diameter, 50 cm long PVC pipe was used to extract in situ soil columns. After extraction, foam filler was added to the top and covered with plastic wrap to prevent water evaporation. The upper and lower ends of the columns were carefully transported back to the lab with anti-shock measures for CT scanning to detect soil porosity, minimizing impact on the in situ soil samples during transportation. The samples were handled with care to minimize impact. Soil particle size was analyzed using a Malvern laser particle sizer [31]. Soil bulk density was determined post-drying at 105 °C [32]. Soil organic matter was assessed via the potassium dichromate colorimetric method [33]. Saturated hydraulic conductivity was measured using the double-ring knife method [34].

2.3. CT Image Scanning and Image Binarization

(1) CT Image Scanning: The CT scanning equipment used was the GE Discovery CT 750HD model, operating at a scanning tube voltage of 120 kV and a scanning tube current of 300 mA. The scanning voxel size was 0.2529 mm × 0.2529 mm × 1.5 mm, resulting in a total of 2400 images with an image matrix of 512 × 512. The output format for the scanned images was DICOM (Digital Imaging and Communications in Medicine).
(2) CT Image Binarization: To begin with, the brightness and contrast of the image were improved through the equalization of the grayscale histogram. Subsequently, a 3D Gaussian blur filter was applied to reduce noise in the grayscale image. The core part of the soil column, measuring 46 × 46 × 300 (mm) was selected for study, taking into consideration the influence of the boundary of the soil column. Next, the image was binarized using the image-adjust plug-in of ImageJ 1.53c to produce a binary image containing only pores and soil [35]. The segmentation threshold for the pore and background was adjusted by comparing the binarized pore with the original pore image, aiming to maximize the conformity of the pore with the actual image [36,37,38]. Finally, the binarized image was expanded and eroded to eliminate pores with a volume less than 0.001 mm3 to reduce noise and eliminate fine connections between pores. This step provided the basis for subsequent pore characteristic extraction. The resulting binarized pore image, with a diameter of >400 μm (CT scanning resolution) [35], is illustrated in Figure 2 (where the blue color represents the pores). This image served as the foundation for generating the basic images for 3D visualization.

2.4. Quantification of Soil Pore Characteristics

(1) 2D Characteristic extraction of Soil Pores: The scanned image was analyzed comprehensively to identify the edges and a single soil pore image with a size of 46 mm × 46 mm was selected for further analysis. The analyze particles plug-in in ImageJ software was utilized to extract two-dimensional morphology parameters such as the number of pores, area, perimeter, maximum diameter, etc., in conjunction with the Region of Interest (ROI). These parameters were used to calculate the rounding rate (R) and other two-dimensional indices of the pores.
The pore rounding rate (R) measures how closely a pore’s cross-section resembles a circle. It ranges from 0 to 1, with a value closer to 1 indicating a more circular and regular pore morphology [39]. The expression for the pore rounding rate is as follows:
R = 4 π A P L R 2
where R is the pore rounding rate; AP is the actual area of the pore; LR is the actual perimeter of the pore.
(2) Soil Pore 3D Characteristic and 3D Visualization Extraction: Using the relevant plug-in in ImageJ, the pore space within the region of interest (ROI) was reconstructed in three dimensions. Various characteristics such as the skeleton, number of pores, pore volume, inner wall surface area, pore branches and intersections were extracted [40]. The metrics used to calculate the three-dimensional properties that characterize the pores include porosity, specific surface area, curvature, connectivity and branch length density. These parameters provide valuable insights into the structural characteristics of the soil pore network and play a crucial role in understanding fluid flow and solute transport within the soil matrix.
Specific surface area of pores: The specific surface area of pores reflects the capacity of the inner pore wall to impede the movement of water and solutes per unit volume. This characteristic can be quantitatively assessed by determining the relationship between the inner surface area and volume [41]. The specific surface area (S) is expressed as
S = W P V P
where S is the specific surface area of the pore; WP is the surface area of the inner wall of the pore; and VP is the pore volume.
Pore curvature: Pore curvature is defined as the ratio of the actual length between two points along the central axis of the pore to the shortest length between the two points. This metric is utilized to characterize the spatial morphology of the pore structure [42]. The expression for pore curvature is
T = P a P b
where T is the pore curvature; Pa is the actual length between two points of the pore center axis; and Pb is the shortest length between two points of the pore center axis.
Pore connectivity is a measure that quantifies the structure of pore networks and indicates the extent of pore influence in soil space. It is primarily assessed quantitatively by examining the relationship between the number of intersecting points (J) and the number of endpoints (E) of the pore skeleton [43]. This relationship can be expressed as
C = J J + E
where J is the number of intersection points; and E is the number of endpoints (non-edge endpoints).
The pore branching length density (LD) refers to the length of pore branching within a specific volume of space. A higher branching length density indicates a greater number of branches in the pore per unit volume [44]. The expression for pore branching length density can be given as
L D = L i V
where Li is the pore branch length (mm) and V is the unit volume (mm).

2.5. Two-Dimensional Pore Size Grading and Three-Dimensional Pore Size Grading

In the present study, the categorization of soil pores can generally be classified into three types based on the size grading followed by most scholars: macropores—pores with a diameter greater than 5 mm; mesopores—pores with a diameter ranging from 1 mm to 5 mm; and micropores—pores with a diameter of less than 1 mm. While there may be variations in the naming conventions and thresholds used by different researchers, this broad classification into macropores, mesopores and micropores provides a useful framework for understanding the distribution and characteristics of soil pore sizes [45,46].
In the current study, in alignment with existing research findings [46], the volume size of pores was calculated using the 3D Object Counter plug-in within ImageJ. This algorithm determines the volume of a sphere by comparing it to an appropriate reference volume [47]. The pores were classified into three categories and six classes based on their volume size: micropores (<1 mm3), mesopores (1–8 mm3, 8–27 mm3, 27–64 mm3, 64–125 mm3), and macropores (>125 mm3). This classification system allows for a detailed analysis of soil pore sizes and distributions, providing valuable insights into the pore structure characteristics within the study area.

2.6. Simulation and Analysis of Water Fluxes within Soil Pores

To assess the permeability of soil pores, we utilized the absolute permeability module in Avizo2020 software to conduct simulations. Initially, we employed image binarization in ImageJ 1.53c, followed by importing it into Avizo2020 for interactive thresholding and subsequent skeletonization to enable absolute permeability simulation. The fluid viscosity coefficient was established at 0.001 Poise, with inlet input pressure set at 1 MPa and outlet output pressure at 0.75 MPa for the permeability simulation. Subsequently, Darcy’s law was applied to calculate permeability and streamlines were generated. In the visualization, colors denote flow rate, with red indicating rapid flow and blue representing slower flow. The distribution of streamlines corresponds to the pore structure, where increased pore space results in reduced streamline density. The process is depicted in the flow chart in Figure 3.

2.7. Statistical Analysis

The average values of soil physical and chemical properties for 0–30 cm soil depth among different treatments resulted from the data of three soil depths were analyzed by one-way analysis of variance (ANOVA) among the different treatments (p < 0.05). The average values of three-dimensional pore parameters which were drawn from three repeated soil columns in a 0–30 cm soil layer among different treatments were analyzed using independent t-tests and pairwise analysis (p < 0.05). Visual images were generated using Origin2021, Avizo2020 and ImageJ 1.53c.

3. Results

3.1. Soil Physical and Chemical Properties

Soil physical and chemical properties of the four treatments in the whole soil layer are presented in Table 1. Soil organic matter and saturated hydraulic conductivity were higher in the RG2a and RG10a treatments than in the RW2a and RW10a treatments. The soil bulk density of RG2a treatment was less than the RG10a and RW2a treatments; furthermore, it was less in the RG10a treatment than in the RW10a treatment. Soil particle composition in the study area showed that silt had the highest percentage of content over time. There was a tendency for clay and silt content to increase while sand content decreased with the implementation of vegetative cover measures. This trend suggested that the soil particle composition is refined over time and with the implementation of vegetative cover measures.

3.2. Two-Dimensional Pore Size Distribution Patterns of Soil Pores under Different Reclamation Years and Reclamation Modes

The 2D pore size analysis in Figure 4 shows that mesopores measuring 1–5 mm accounted for the highest percentage among the four treatments, ranging from 51.52% to 58.49% of the total pores in the 2D image. Furthermore, it is observed that the number of pores decreases as the pore size increases across all treatments. Notably, the smallest proportion of pores was found in the all treatments of 2D macropores (>5 mm), comprising only 2.36% to 6.04% of the total number of 2D pores across the treatments.
In terms of different reclamation years, the number of 2D macropores (>5 mm) exhibited a decrease of 1.09% and 17.03% in the RG2a and RW2a treatments compared to the RG10a and RW10a treatments, respectively. This trend indicates that the development of macroporosity was notably enhanced with increasing reclamation years. Regarding different reclamation modes, the count of 2D macropores (>5 mm) saw a significant increase of 65.71% in the RG2a treatment compared to the RW2a treatment, while a 39.01% increase was observed in the RG10a treatment compared to the RW10a treatment. This suggests that the grassland reclamation approach favors the augmentation of macropore numbers. Overall, apart from the macropore aperture interval, the 2D pore counts across the remaining aperture intervals displayed consistent patterns: RG2a > RG10a, RW2a > RW10a, RG2a < RW2a and RG10a < RW10a, respectively. Significantly distinct differences were observed among the four treatments across all levels of the 2D aperture intervals.

3.3. Three-Dimensional Pore Distribution Patterns of Soil Pores under Different Reclamation Years and Reclamation Modes

According to the three-dimensional pore classification (refer to Figure 5), the three-dimensional mesopores number (1~125 mm3) in the four treatments constituted the largest proportion, accounting for 89.38% to 95.65% of the total three-dimensional pore number. Additionally, similar to the 2D pore distribution, the number of pores within this pore size interval decreased as the pore size increased. Notably, the count of three-dimensional macropores (>125 mm3) was the smallest across all four treatments, constituting only 0.30% to 1.07% of the total three-dimensional pore number.
When considering different reclamation years, the number of 3D macropores (>125 mm3) in the RG10a and RW10a treatments exhibited increases of 88.89% and 114.29%, respectively, compared to the RG2a and RW2a treatments. This trend implies a gradual enhancement in the number of macropores with advancing reclamation years. In terms of different reclamation modes, the count of macropores (>125 mm3) saw an increase of 28.58% and 13.33% in the RG2a and RG10a treatments compared to the RW2a and RW10a treatments, respectively. This suggests that the grassland reclamation mode is more conducive to improving the macroporosity number, although the efficacy of different reclamation modes in enhancing macroporosity is slightly lower compared to varying reclamation years. Notably, significant differences in pore size existed among the four treatments at all levels.

3.4. Characteristics of Soil Pore Rounding Rate under Different Reclamation Years and Reclamation Modes

The total pore rounding rates of the four treatments followed the sequence RG10a > RG2a > RW10a > RW2a across the entire depth of the studied soil layer. Additionally, the pore rounding rates of all four treatments exhibited a declining trend with increasing pore sizes. This suggests that micropores tend to be closer to a theoretical circular shape compared to macropores.
In terms of different reclamation years, the rounding rate of mesopores (1–5 mm) and macropores (>5 mm) in the RG2a and RW2a treatments decreased by 6.19% and 8.35%, as well as 3.76% and 9.51%, respectively, compared to the RG10a and RW10a treatments. This suggests that an increase in reclamation years contributes to enhancing the rounding rate of mesopores and macropores. Regarding different reclamation modes, the rounding rate of mesopores (1–5 mm) and macropores (>5 mm) in the RG2a and RG10a treatments increased by 2.12% and 2.61%, and 4.78% and 1.32%, respectively, compared to the RW2a and RW10a treatments. This indicates that the grassland reclamation approach aids in improving the rounding rate of mesopores and macropores.

3.5. Soil Pore Branching Characteristics under Different Reclamation Years and Reclamation Modes

According to the data presented in Figure 6, the RG10a treatment exhibited the highest values for branch length and branch length density across all pore size intervals, indicating that this treatment led to the formation of a more favorable soil pore network structure.
In terms of different reclamation years, the average branch length and branch length density in each pore size interval for the RG10a and RW10a treatments were 6.47% and 1.89% higher than those of the RG2a and RW2a treatments, respectively. When considering different reclamation modes, the average branch length and branch length density across aperture intervals increased by 3.66% and 8.32% for the RG2a and RG10a treatments compared to the RW2a and RW10a treatments, respectively. Overall, the soil pore network structure under the grassland reclamation modes showed gradual optimization with the progression of reclamation years.

3.6. Three-Dimensional Parameters of Soil Pore Space under Different Reclamation Years and Reclamation Modes

The data presented in Table 2 indicate that the mean soil porosity increased by 2.47% in the RG10a treatment compared to the RG2a treatment, while the mean specific surface area decreased significantly by 13.76% in comparison to RG2a (p < 0.05). This suggests that the RG10a treatment is characterized by a higher number of macropores and a larger volume, as depicted in Figure 7a. The presence of a greater number and volume of macropores also implies higher pore connectivity and lower pore curvature in the RG10a treatment. Furthermore, the data reveals that the mean pore curvature of the RG10a treatment was 0.85% lower than that of the RG2a treatment and the mean pore connectivity was significantly higher by 12.82% compared to RG2a (p < 0.05). Although the mean fractal dimension of the RG10a treatment increased by 1.02% compared to RG2a, the increase was not significant. This suggests that the reclaimed soil gradually tends to stabilize its pore structure after 10 years of evolution. Taken together with the additional data presented in Table 2, it becomes evident that the soil structure of the grassland reclamation modes undergoes gradual optimization and improvement with the progression of reclamation years.

3.7. Three-Dimensional Reconstruction of Soil Pore Space under Different Reclamation Years and Reclamation Modes

To accurately depict the three-dimensional characteristics of soil pores across various reclamation years and types of reclamation modes, a three-dimensional reconstruction diagram illustrating the spatial structure of soil column pores was generated using the rendering feature of AVIZO2020 software. Different colors within the diagram represent soil pores of varying sizes (refer to Figure 8). Within the top 0–30 cm of soil depth, the pores in the RG2a treatment exhibited an inclined laminar distribution, with many displaying a lamellar structure. Specifically, within the 0–20 cm layer, the RG10a treatment exhibited an abundance of yellow pores (>5 mm). Moving deeper into the 20–30 cm layer, the RG10a treatment displayed a denser distribution of pores, obscuring the clarity of elongated strip-shaped pores due to their coverage. Conversely, the RW2a treatment showcased a leftward-inclined laminar structure with more scattered pores and fewer yellow pores (>5 mm). The pore distribution in the RW10a treatment appeared more sporadic, with yellow pores (>5 mm) concentrated in the middle and bottom layers. Overall, all four treatments predominantly featured dark blue pores (<1 mm) in their pore distributions.
For varying reclamation years, the RG10a treatment exhibited a broader and more evenly spread distribution of yellow pores (>5 mm) compared to the RG2a treatment. This comparison highlighted the significant enhancement in pore structure achieved by the RG10a treatment in the context of soil reclamation. Similarly, the RW2a and RW10a treatments yielded comparable outcomes to the above grassland reclamation modes, suggesting that soil structure improves progressively with increasing reclamation years. Regarding different reclamation modes, the RG10a treatment showcased a more uniform and widespread distribution of yellow pores (>5 mm) in contrast to the RW10a treatment. Compared to the RW2a treatment, the RG2a treatment exhibited a relatively higher abundance and wider dispersion of yellow pores (>5 mm). Overall, it suggests that grassland reclamation modes will trend toward better soil structure as the reclamation years progress.

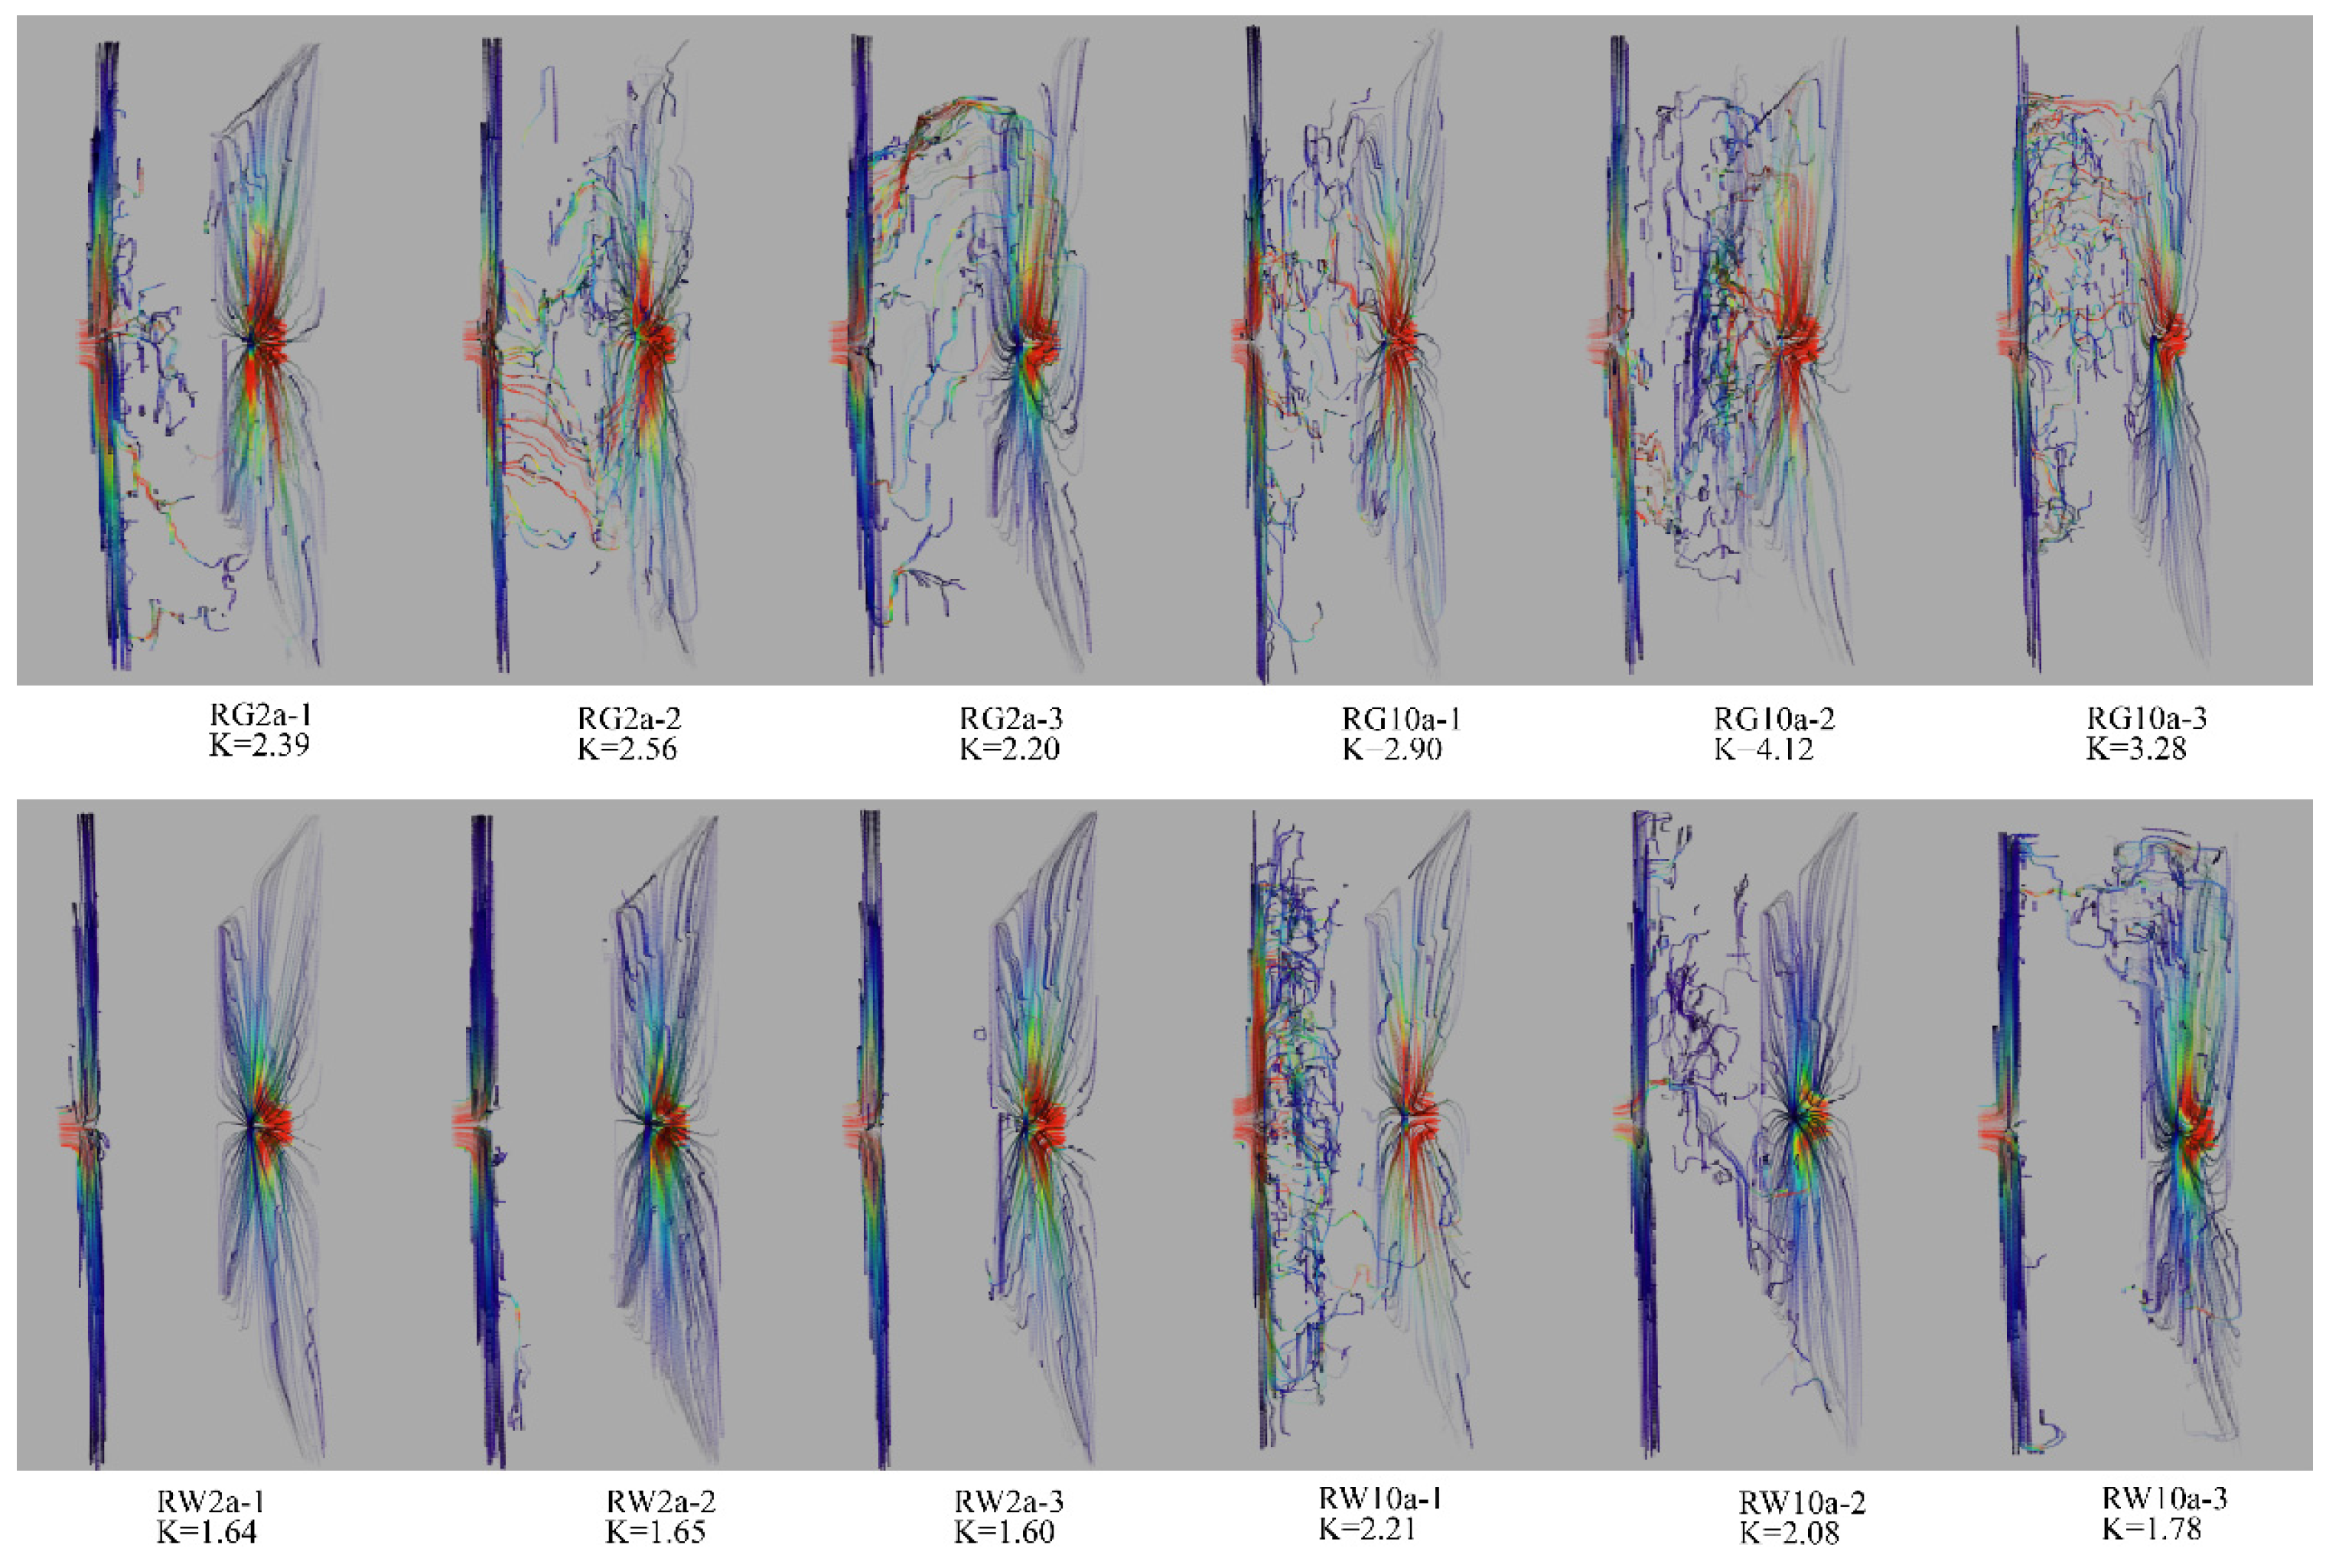
3.8. Simulation of Soil Pore Permeability under Different Reclamation Years and Reclamation Modes

The simulation results of soil pore infiltration rates under various treatments are illustrated in Figure 9.
The RG2a treatment and RG10a treatment had higher infiltration rates than the RW2a treatment and RW10a treatment
The RW2a treatment primarily exhibits lateral flow, whereas the RW10a treatment allows for vertical flow; however, the distribution of its flow lines is not uniform. In contrast, both the RG2a and RG10a treatments feature more flow lines capable of vertical flow, with the RG10a treatment displaying relatively more uniform and predominantly vertical flow lines. Across different reclamation years, the number of flow lines in the 10a treatment exceeded those in the 2a treatment. Regarding different reclamation modes, the RG treatments displayed more consistent flow lines and a higher occurrence of vertical flow compared to the RW treatments. These observations suggest that the grassland reclamation modes enhance the complexity of soil pore structure and fluid permeability as the reclamation years progress, particularly evident in the RG10a treatment.

3.9. Correlation Analysis of Soil Parameters for Different Reclamation Years and Reclamation Modes

Figure 10 presents the correlation analysis of the four treatments. It is noteworthy that the infiltration rate serves as a pivotal indicator for characterizing soil infiltration capacity. The infiltration rate exhibited a positive correlation with soil organic matter, clay content and soil pore connectivity (p < 0.1). Conversely, it displayed a negative correlation with sand content, pore-specific surface area and pore curvature (p < 0.1). Soil organic matter demonstrated a positive correlation with porosity, pore branch length, saturated hydraulic conductivity and clay content (p < 0.1). Conversely, it exhibited a negative correlation with sand content and pore specific surface area (p < 0.1). No significant difference was observed between pore fractal dimension and other parameters, suggesting that the soil pore structure gradually stabilized over time.

4. Discussion

In this study, significant differences were observed in the two-dimensional and three-dimensional pore distributions under varying reclamation modes and over different reclamation years. The increase or decrease in the number of macropores in reclaimed soils is influenced by factors such as vegetation type, reclamation years and reclamation modes [48]. Numerous studies have highlighted that reclamation years and modes are key determinants. As the reclamation years progress, the number of macropores in the reclaimed soil gradually increases [14,49]. Consistent with our findings, both the two-dimensional and three-dimensional macropores were notably higher in the RG10a treatment compared to the RG2a treatment. This suggests that soil pore conditions experienced significant improvement post-reclamation due to soil preparation, topsoil backfilling and vegetation establishment [50], enhancing soil water, air and solute transport processes [51]. Pore rounding rates play a crucial role in defining soil pore size, with more regular pores facilitating better water transport, retention and uptake by crops in the soil [39]. In our study, the mesopore and macropore rounding rates in the 10a reclamation treatment exceeded that of the 2a treatment across different reclamation years, indicating that the evolving soil pore structure promotes the development of efficient transport pathways. It has been demonstrated that as reclamation years increase, pore rounding rates approaching 1 indicate a shape closer to a theoretical circle [13], aligning well with the outcomes of our research.
The increase in the duration of reclamation years resulted in elevated porosity, connectivity, average branch length and branch length density. And the number of three-dimensional macropores within the soil pores of the 10a treatment while decreasing the specific surface area of its soil pores. The study highlighted the conclusion that that as reclamation years advanced, sufficient recovery time allowed for the formation of new pores and connected pathways, enhancing the volume, porosity, pore size and connectivity of the soil structure [52]. Research by related scholars indicated that the root system’s role could alter soil interface morphology, making the soil more loose and porous, thereby increasing soil permeability [29,53]. The presence of spotted fescue and its root system in grassland reclamation modes also enhanced soil permeability, leading to increased porosity and organic matter content in the reclaimed soil [49,54]. The role of vegetation in reclaimed soils is also crucial for soil pore characteristics, as soil organic matter gradually accumulates through plant decay processes [49]. The study concluded a linear relationship between soil porosity and organic matter, with soil porosity increasing alongside organic matter content (Figure 11). Consequently, the grassland reclamation modes exhibited higher porosity compared to bare land reclamation under the combined influence of these interactions. The RG2a and RW2a treatments displayed a smaller pore volume with more isolated pores, demonstrating a laminar structure inclined horizontally (Figure 8). The abundance of micropores and mesopores in the RG2a and RW2a treatments led to interconnections and a lamellar structure, resulting in lower connectivity compared to the RG10a and RW10a treatments. Following the evolution of the RG10a and RW10a treatments, the pore arrangement shifted away from the tilted laminar structure, with macropores becoming more prevalent, reducing isolated pores and enhancing pore connectivity in the RG10a and RW10a treatments. The increased branch length and branch length density in RG10a suggested the potential for establishing a more comprehensive root network distribution and greater infiltration capacity [55,56]. Previous studies have shown that prolonged application of soil improvement measures can enhance pore volume, particle size distribution and pore network models, thereby promoting root growth and improving soil structure [56,57,58], aligning with the current study’s results on improved soil structure over time.
Soil pore connectivity can be visually represented by flow line distributions and flow directions [59,60,61]. As mine reclamation soil structure was gradually restored, treatments with lower reclamation years and bare ground reclamation exhibited limited connectivity, lacking connected flow lines in RW2a, whereas RG treatments, particularly RG10a, displayed interconnected flow lines and higher infiltration rates. Liu et al. [59] demonstrated that soil aggregates amended with biochar showed increased connected flow lines during infiltration tests. Fluid flow is constrained to interconnected pores, emphasizing the importance of pore volume, size and distribution in determining permeability [62]. With advancing reclamation years, the connected pore space in grassland reclamation modes expanded, enhancing permeability, flow line numbers and connected flow lines. Consequently, the combined influence of time and vegetation factors endowed the RG10a treatment with superior pore connectivity and hydraulic conductivity compared to other treatments [63]. When rainwater seeped into the soil, its chemistry greatly affected soil structure. For example, rainwater pH influences soil acidity or alkalinity, impacting nutrient availability and microbial activity [64]. Exchange reactions occurred between rainwater minerals and soil or rock components, modifying pH by pH [65]. Acidic rainwater could dissolve minerals like limestone, causing soil erosion and altering composition. Conversely, mineral-rich rainwater might exchange ions with soil minerals, potentially affecting fertility and structure [66]. Overall, rainwater chemistry shaped soil structure through these exchanges, crucial for managing soil health and fertility in agriculture and the environment.
However, when compared to general medium- and high-yield agricultural land [67,68], the 3D pore reconstruction diagram in this study did not reveal long, vertical pores and the infiltration simulation did not demonstrate an abundance of connected flow lines in the central region. This suggests that the reclaimed soil in this particular mine area has not yet reached the productivity levels of medium- and high-yield agricultural land. Nevertheless, the three-dimensional structural data processed by RG10a and the subsequent reconfiguration diagram indicated progress towards achieving medium- and high-yield farmland standards, implying the potential for management and enhancement of the reclaimed soil in this region [49]. Under the combined influence of vegetation and time factors, the various parameters of the RG10a model outperformed other models. Consequently, the RG10a model proves more effective in enhancing the improvement, water retention and fertilizer transport capabilities of reclaimed soil in bauxite mine reclamation areas in Guangxi.
In summary, reclamation years and modes were the key factors affecting the pore and infiltration characteristics of mine reclamation soils. It could be evaluated from the soil organic matter, macropores, porosity, connectivity and infiltration rate to reflect the quality of reclaimed soils.

5. Conclusions

In this study, two-dimensional and three-dimensional data of soil pores were quantitatively analyzed using X-ray CT scanning technology. This, combined with the three-dimensional structural diagram of pores, enabled the quantification of the impact of reclamation on soil pores. The results demonstrated that as reclamation years increased, the number of soil macropores in the grassland reclamation modes subsequently rose, leading to improvements in soil pore volume and pore size distribution, as well as promoting the development of mesopore and macropore rounding rates. Additionally, the porosity, connectivity, branch length, branch length density and permeability of the soil pores within the grassland reclamation modes all experienced significant increases. These changes influenced the distribution of the three-dimensional pore structure, resulting in a tighter arrangement for the RG10a treatment, reduced irregularity in pore boundaries and the elimination of tilted laminar structures. This transformation symbolizes the gradual development of the soil in this mining area towards traditional agricultural land. Consequently, with the increase in reclamation years, the grassland reclamation modes prove increasingly effective in promoting the enhancement of soil structure and water and fertilizer transport channels, thereby effectively improving soil pore structure and contributing to overall soil quality improvement. Consequently, future studies focusing on the effects of strategic management relation to different reclamation years and modes on pore structures could benefit to promote water retention, elevate soil quality and alleviate pressure on water usage.

Author Contributions

Writing—review and editing, conceptualization, S.W.; project administration, data analysis and review, L.G. and T.H.; methodology and investigation, Y.Z., Z.G., Z.L., H.Z. (Haojie Zhou) and H.Z. (Hang Zhang); Writing review and supervision, H.Z. (Hongxia Zhang). All authors have read and agreed to the published version of the manuscript.

Funding

This work was funded by the National Natural Science Foundation of China (grant numbers 42267040 and 42067002), the Science and Technology Planning Project of Guangxi, China (grant number AA20302020-2).

Data Availability Statement

The data presented in this study are available on request from the corresponding author.

Acknowledgments

We are grateful to Guangxi Engineering Research Center for Comprehensive Treatment of Agricultural Non-point Source Pollution and Modern Industry College of Ecology and Environmental Protection, Guilin University of Technology.

Conflicts of Interest

The authors declare no conflicts of interest.

References

  1. Zhao, H.; Ling, K.; Du, S.; Wen, H. Provenance of the Nb-Rich Bauxite and Li-Rich Claystone at the Base of the Heshan Formation in Pingguo, Guangxi, SW China: Constrained by U–Pb Ages and Trace Element Contents of Detrital Zircon. Ore Geol. Rev. 2023, 161, 105633. [Google Scholar] [CrossRef]
  2. Yuan, D. Environmental geological problems of karst stone mountains in southwest China. World Sci. Technol. Res. Dev. 1997, 41–43. (In Chinese) [Google Scholar] [CrossRef]
  3. Li, C.; Zhang, C.; Yu, T.; Liu, X.; Xia, X.; Hou, Q.; Yang, Y.; Yang, Z.; Wang, L. Annual Net Input Fluxes of Cadmium in Paddy Soils in Karst and Non-Karst Areas of Guangxi, China. J. Geochem. Explor. 2022, 241, 107072. [Google Scholar] [CrossRef]
  4. Wang, J.; Qin, Q.; Guo, L.; Feng, Y. Multi-Fractal Characteristics of Three-Dimensional Distribution of Reconstructed Soil Pores at Opencast Coal-Mine Dump Based on High-Precision CT Scanning. Soil Tillage Res. 2018, 182, 144–152. [Google Scholar] [CrossRef]
  5. Rabot, E.; Wiesmeier, M.; Schlüter, S.; Vogel, H.-J. Soil Structure as an Indicator of Soil Functions: A Review. Geoderma 2018, 314, 122–137. [Google Scholar] [CrossRef]
  6. Regelink, I.C.; Stoof, C.R.; Rousseva, S.; Weng, L.; Lair, G.J.; Kram, P.; Nikolaidis, N.P.; Kercheva, M.; Banwart, S.; Comans, R.N.J. Linkages between Aggregate Formation, Porosity and Soil Chemical Properties. Geoderma 2015, 247–248, 24–37. [Google Scholar] [CrossRef]
  7. An, N.; Zhang, L.; Liu, Y.; Shen, S.; Li, N.; Wu, Z.; Yang, J.; Han, W.; Han, X. Biochar Application with Reduced Chemical Fertilizers Improves Soil Pore Structure and Rice Productivity. Chemosphere 2022, 298, 134304. [Google Scholar] [CrossRef] [PubMed]
  8. Sun, F.; Xiao, B.; Li, S.; Yu, X.; Kidron, G.J.; Heitman, J. Direct Evidence and Mechanism for Biocrusts-Induced Improvements in Pore Structure of Dryland Soil and the Hydrological Implications. J. Hydrol. 2023, 623, 129846. [Google Scholar] [CrossRef]
  9. Ng, C.W.W.; Peprah-Manu, D. Pore Structure Effects on the Water Retention Behaviour of a Compacted Silty Sand Soil Subjected to Drying-Wetting Cycles. Eng. Geol. 2023, 313, 106963. [Google Scholar] [CrossRef]
  10. Colombi, T.; Braun, S.; Keller, T.; Walter, A. Artificial Macropores Attract Crop Roots and Enhance Plant Productivity on Compacted Soils. Sci. Total Environ. 2017, 574, 1283–1293. [Google Scholar] [CrossRef]
  11. Dzaklo, C.K.; Rujikiatkamjorn, C.; Indraratna, B.; Kelly, R. Cyclic Behaviour of Compacted Black Soil-Coal Wash Matrix. Eng. Geol. 2021, 294, 106385. [Google Scholar] [CrossRef]
  12. Zhang, L.; Wang, J. Prediction of the Soil Saturated Hydraulic Conductivity in a Mining Area Based on CT Scanning Technology. J. Clean. Prod. 2023, 383, 135364. [Google Scholar] [CrossRef]
  13. Cai, T.; Huang, H.; Bai, Y.; Wang, X.; Liu, T.; Ma, S. Microstructural Characteristics of Soil Pores at Different 535 Reclamation Years Based on Micro-CT. Coal J. 2018, 43, 3196–3203. (In Chinese) [Google Scholar] [CrossRef]
  14. Wang, J.M.; Guo, L.L.; Bai, C.K.; Qin, Q.; Lv, C.J. CT-based analysis of the effects of years of reclamation of 538 surface coal mines on the effective pore number and porosity of soils. J. Agric. Eng. 2016, 32, 229–236. (In Chinese) [Google Scholar]
  15. Back, M.P.; Jefferson, A.J.; Ruhm, C.T.; Blackwood, C.B. Effects of Reclamation and Deep Ripping on Soil Bulk Density and Hydraulic Conductivity at Legacy Surface Mines in Northeast Ohio, USA. Geoderma 2024, 442, 116788. [Google Scholar] [CrossRef]
  16. Pulido-Moncada, M.; Katuwal, S.; Munkholm, L.J. Characterisation of Soil Pore Structure Anisotropy Caused by the Growth of Bio-Subsoilers—ScienceDirect. Geoderma 2022, 409, 115571. [Google Scholar] [CrossRef]
  17. Fang, H.; Liu, K.; Li, D.; Peng, X.; Zhang, W.; Zhou, H. Long-Term Effects of Inorganic Fertilizers and Organic Manures on the Structure of a Paddy Soil. Soil Tillage Res. 2021, 213, 105137. [Google Scholar] [CrossRef]
  18. Hu, X.; Li, X.Y.; Li, Z.C.; Gao, Z.; Wu, X.C.; Wang, P.; Lyu, Y.L.; Liu, L.Y. Linking 3-D Soil Macropores and Root Architecture to near Saturated Hydraulic Conductivity of Typical Meadow Soil Types in the Qinghai Lake Watershed, Northeastern Qinghai–Tibet Plateau—ScienceDirect. Catena 2020, 185, 104287. [Google Scholar] [CrossRef]
  19. Guo, Y.; Fan, R.; Zhang, X.; Zhang, Y.; Wu, D.; McLaughlin, N.; Zhang, S.; Chen, X.; Jia, S.; Liang, A. Tillage-Induced Effects on SOC through Changes in Aggregate Stability and Soil Pore Structure. Sci. Total Environ. 2020, 703, 134617. [Google Scholar] [CrossRef]
  20. Ju, X.; Gao, L.; She, D.; Jia, Y.; Pang, Z.; Wang, Y. Impacts of the Soil Pore Structure on Infiltration Characteristics at the Profile Scale in the Red Soil Region. Soil Tillage Res. 2024, 236, 105922. [Google Scholar] [CrossRef]
  21. Talukder, R.; Plaza-Bonilla, D.; Cantero-Martínez, C.; Wendroth, O.; Lampurlanés, J. Soil Hydraulic Properties and Pore Dynamics under Different Tillage and Irrigated Crop Sequences. Geoderma 2023, 430, 116293. [Google Scholar] [CrossRef]
  22. Phalempin, M.; Landl, M.; Wu, G.-M.; Schnepf, A.; Vetterlein, D.; Schlüter, S. Maize Root-Induced Biopores Do Not Influence Root Growth of Subsequently Grown Maize Plants in Well Aerated, Fertilized and Repacked Soil Columns. Soil Tillage Res. 2022, 221, 105398. [Google Scholar] [CrossRef]
  23. Schlüter, S.; Sammartino, S.; Koestel, J. Exploring the Relationship between Soil Structure and Soil Functions via Pore-Scale Imaging. Geoderma 2020, 370, 114370. [Google Scholar] [CrossRef]
  24. Zhao, Y.; Hu, X.; Li, X. Analysis of the Intra-Aggregate Pore Structures in Three Soil Types Using X-ray Computed Tomography. Catena 2020, 193, 104622. [Google Scholar] [CrossRef]
  25. Soto-Gómez, D.; Pérez-Rodríguez, P.; Vázquez-Juiz, L.; López-Periago, J.E.; Paradelo, M. Linking Pore Network Characteristics Extracted from CT Images to the Transport of Solute and Colloid Tracers in Soils under Different Tillage Managements. Soil Tillage Res. 2018, 177, 145–154. [Google Scholar] [CrossRef]
  26. de Oliveira, J.A.T.; Cássaro, F.A.M.; Pires, L.F. Estimating Soil Porosity and Pore Size Distribution Changes Due to Wetting-Drying Cycles by Morphometric Image Analysis. Soil Tillage Res. 2021, 205, 104814. [Google Scholar] [CrossRef]
  27. Budhathoki, S.; Lamba, J.; Srivastava, P.; Williams, C.; Arriaga, F.; Karthikeyan, K.G. Impact of Land Use and Tillage Practice on Soil Macropore Characteristics Inferred from X-ray Computed Tomography. Catena 2022, 210, 105886. [Google Scholar] [CrossRef]
  28. Zheng, Y.; Chen, N.; Yu, K.; Zhao, C. The Effects of Fine Roots and Arbuscular Mycorrhizal Fungi on Soil Macropores. Soil Tillage Res. 2023, 225, 105528. [Google Scholar] [CrossRef]
  29. Jiang, X.; Zhong, X.; Yu, G.; Zhang, X.; Liu, J. Different Effects of Taproot and Fibrous Root Crops on Pore Structure and Microbial Network in Reclaimed Soil. Sci. Total Environ. 2023, 901, 165996. [Google Scholar] [CrossRef]
  30. Xie, H.; Tang, Y.; Yu, M.; Geoff Wang, G. The Effects of Afforestation Tree Species Mixing on Soil Organic Carbon Stock, Nutrients Accumulation, and Understory Vegetation Diversity on Reclaimed Coastal Lands in Eastern China. Glob. Ecol. Conserv. 2021, 26, e01478. [Google Scholar] [CrossRef]
  31. Svensson, D.N.; Messing, I.; Barron, J. An Investigation in Laser Diffraction Soil Particle Size Distribution Analysis to Obtain Compatible Results with Sieve and Pipette Method. Soil Tillage Res. 2022, 223, 105450. [Google Scholar] [CrossRef]
  32. Pan, L.; Chen, Y.; Xu, Y.; Li, J.; Lu, H. A Model for Soil Moisture Content Prediction Based on the Change in Ultrasonic Velocity and Bulk Density of Tillage Soil under Alternating Drying and Wetting Conditions. Measurement 2022, 189, 110504. [Google Scholar] [CrossRef]
  33. Nelson, D.W. Total Carbon, Organic Carbon, and Organic Matter; American Society of Agronomy, Inc.: Madison, WI, USA; Soil Science Society of America, Inc.: Madison, WI, USA, 1996. [Google Scholar]
  34. Shwetha, P.; Varija, K. Soil Water Retention Curve from Saturated Hydraulic Conductivity for Sandy Loam and Loamy Sand Textured Soils. Aquat. Procedia 2015, 4, 1142–1149. [Google Scholar] [CrossRef]
  35. Nakajima, M. Advanced Digital Image Processing: Basic Theories and Application[III]: Introduction on 3 Dimensional Digital Image Processing. J. Inst. Electron. Inf. Commun. Eng. 1998, 18, 68. [Google Scholar]
  36. Fanfeng, Z.; Wei, F. Hole Filling Algorithm Based on Contours Information. In Proceedings of the International Conference on Information Science & Engineering, Hangzhou, China, 4–6 December 2010; pp. 3741–3743. [Google Scholar]
  37. Zhou, H.; Li, W.; Zhang, Z.; Peng, X. Study of multiscale soil structure using X-ray CT. J. Soil Sci. 2013, 50, 1226–1230. (In Chinese) [Google Scholar]
  38. Vogel, H.J. Morphological Determination of Pore Connectivity as a Function of Pore Size Using Serial Sections. Eur. J. Soil Sci. 2008, 48, 365–377. [Google Scholar] [CrossRef]
  39. Dal Ferro, N.; Charrier, P.; Morari, F. Dual-Scale Micro-CT Assessment of Soil Structure in a Long-Term Fertilization Experiment. Geoderma 2013, 204–205, 84–93. [Google Scholar] [CrossRef]
  40. Yu, W.-W.; He, F.; Xi, P. A Rapid 3D Seed-Filling Algorithm Based on Scan Slice. Comput. Graph. 2010, 34, 449–459. [Google Scholar] [CrossRef]
  41. Qi, Y.; Ju, Y.; Huang, C.; Zhu, H.; Bao, Y.; Wu, J.; Meng, S.; Chen, W. Influences of Organic Matter and Kaolinite on Pore Structures of Transitional Organic-Rich Mudstone with an Emphasis on S2 Controlling Specific Surface Area. Fuel 2019, 237, 860–873. [Google Scholar] [CrossRef]
  42. Wen, T.; Chen, X.; Luo, Y.; Shao, L.; Niu, G. Three-Dimensional Pore Structure Characteristics of Granite Residual Soil and Their Relationship with Hydraulic Properties under Different Particle Gradation by X-ray Computed Tomography. J. Hydrol. 2023, 618, 129230. [Google Scholar] [CrossRef]
  43. Jarvis, N.; Larsbo, M.; Koestel, J. Connectivity and Percolation of Structural Pore Networks in a Cultivated Silt Loam Soil Quantified by X-ray Tomography. Geoderma 2017, 287, 71–79. [Google Scholar] [CrossRef]
  44. Noyan, A.A.; Leontiev, A.P.; Yakovlev, M.V.; Roslyakov, I.V.; Tsirlina, G.A.; Napolskii, K.S. Electrochemical Growth of Nanowires in Anodic Alumina Templates: The Role of Pore Branching. Electrochim. Acta 2017, 226, 60–68. [Google Scholar] [CrossRef]
  45. Lamandé, M.; Labouriau, R.; Holmstrup, M.; Torp, S.B.; Greve, M.H.; Heckrath, G.; Iversen, B.V.; De Jonge, L.W.; Moldrup, P.; Jacobsen, O.H. Density of Macropores as Related to Soil and Earthworm Community Parameters in Cultivated Grasslands. Geoderma 2011, 162, 319–326. [Google Scholar] [CrossRef]
  46. Luxmoore, R.J. Micro-, Meso-, and Macroporosity of Soil. Soil Sci. Soc. Am. J. 1981, 45, 671. [Google Scholar] [CrossRef]
  47. Harvey, D.; Hubert, P. 3D Topology Optimization of Sandwich Structures with Anisotropic Shells. Compos. Struct. 2022, 285, 115237. [Google Scholar] [CrossRef]
  48. Asare, S.N.; Rudra, R.P.; Dickinson, W.T.; Fenster, A. SW—Soil and Water: Soil Macroporosity Distribution and Trends in a No-till Plot Using a Volume Computer Tomography Scanner. J. Agric. Eng. Res. 2001, 78, 437–447. [Google Scholar] [CrossRef]
  49. Wang, J.; Qin, Q.; Bai, Z. Characterizing the Effects of Opencast Coal-Mining and Land Reclamation on Soil Macropore Distribution Characteristics Using 3D CT Scanning. Catena 2018, 171, 212–221. [Google Scholar] [CrossRef]
  50. Zhen, Q.; Zheng, J.; Zhang, X. Changes of Solute Transport Characteristics in Soil Profile after Mining at an Opencast Coal Mine Site on the Loess Plateau, China. Sci. Total Environ. 2019, 665, 142–152. [Google Scholar] [CrossRef] [PubMed]
  51. Zhang, Y.; Zhao, W.; Fu, L. Soil Macropore Characteristics Following Conversion of Native Desert Soils to Irrigated Croplands in a Desert-Oasis Ecotone, Northwest China. Soil Tillage Res. 2017, 168, 176–186. [Google Scholar] [CrossRef]
  52. Liu, B.; Fan, H.; Jiang, Y.; Ma, R. Evaluation of Soil Macro-Aggregate Characteristics in Response to Soil Macropore Characteristics Investigated by X-ray Computed Tomography under Freeze-Thaw Effects. Soil Tillage Res. 2023, 225, 105559. [Google Scholar] [CrossRef]
  53. Souza, L.F.T.; Hirmas, D.R.; Sullivan, P.L.; Reuman, D.C.; Kirk, M.F.; Li, L.; Ajami, H.; Wen, H.; Sarto, M.V.M.; Loecke, T.D.; et al. Root Distributions, Precipitation, and Soil Structure Converge to Govern Soil Organic Carbon Depth Distributions. Geoderma 2023, 437, 116569. [Google Scholar] [CrossRef]
  54. Muhammad, N.; Per, M.; Schaap, M.G.; Markus, T.; Ramaprasad, K.; Hans-J?Rg, V.; Lis, W.D.J. Prediction of Biopore- and Matrix-Dominated Flow from X-ray CT-Derived Macropore Network Characteristics. Hydrol. Earth Syst. Ences Discuss. 2016, 20, 4017–4030. [Google Scholar] [CrossRef]
  55. Gharedaghloo, B.; Price, J.S.; Rezanezhad, F.; Quinton, W.L. Evaluating the Hydraulic and Transport Properties of Peat Soil Using Pore Network Modeling and X-ray Micro Computed Tomography. J. Hydrol. 2018, 561, 494–508. [Google Scholar] [CrossRef]
  56. Faloye, O.T.; Ajayi, E.A.; Rostek, J.; Schroeren, V.; Babalola, T.; Fashina, A.; Horn, R. Hydraulic and Pore Functions of Differently Textured Soils Modified by Biochar from Different Parts of the Mango Plant. Soil Tillage Res. 2024, 236, 105944. [Google Scholar] [CrossRef]
  57. Wang, J.; Guo, L.; Bai, Z.; Yang, L. Using Computed Tomography (CT) Images and Multi-Fractal Theory to Quantify the Pore Distribution of Reconstructed Soils during Ecological Restoration in Opencast Coal-Mine. Ecol. Eng. 2016, 92, 148–157. [Google Scholar] [CrossRef]
  58. Singh, N.; Kumar, S.; Udawatta, R.P.; Anderson, S.H.; de Jonge, L.W.; Katuwal, S. X-ray Micro-Computed Tomography Characterized Soil Pore Network as Influenced by Long-Term Application of Manure and Fertilizer. Geoderma 2021, 385, 114872. [Google Scholar] [CrossRef]
  59. Liu, Y.F.; Jeng, D.-S. Pore Scale Study of the Influence of Particle Geometry on Soil Permeability. Adv. Water Resour. 2019, 129, 232–249. [Google Scholar] [CrossRef]
  60. Liu, J.; Lu, S. Amendment of Different Biochars Changed Pore Characteristics and Permeability of Ultisol Macroaggregates Identified by X-ray Computed Tomography (CT). Geoderma 2023, 434, 116470. [Google Scholar] [CrossRef]
  61. Qian, Y.; Yang, X.; Zhang, Z.; Li, X.; Zheng, J.; Peng, X. Estimating the Permeability of Soils under Different Tillage Practices and Cropping Systems: Roles of the Three Percolating Pore Radii Derived from X-ray CT. Soil Tillage Res. 2024, 235, 105903. [Google Scholar] [CrossRef]
  62. Ferreira, T.R.; Archilha, N.L.; Cássaro, F.A.M.; Pires, L.F. How Can Pore Characteristics of Soil Aggregates from Contrasting Tillage Systems Affect Their Intrinsic Permeability and Hydraulic Conductivity? Soil Tillage Res. 2023, 230, 105704. [Google Scholar] [CrossRef]
  63. Yuan, W.; Fan, W. Quantitative Study on the Microstructure of Loess Soils at Micrometer Scale via X-ray Computed Tomography. Powder Technol. 2022, 408, 117712. [Google Scholar] [CrossRef]
  64. Snoussi, G.; Nasri, B.; Hamdi, E.; Fouché-Grobla, O. Reuse of Tunisian Excavated Material into Composite Soil for Rainwater Infiltration within Urban Green Infrastructure. Geoderma Reg. 2024, 36, e00748. [Google Scholar] [CrossRef]
  65. Papatheodorou, E.M.; Papapostolou, A.; Monokrousos, N.; Jones, D.-W.; Scullion, J.; Stamou, G.P. Crust Cover and Prior Soil Moisture Status Affect the Response of Soil Microbial Community and Function to Extreme Rain Events in an Arid Area. Eur. J. Soil Biol. 2020, 101, 103243. [Google Scholar] [CrossRef]
  66. Ben Hassena, A.; Zouari, M.; Labrousse, P.; Decou, R.; Soua, N.; Khabou, W.; Zouari, N. Effect of Arbuscular Myccorhizal Fungi on Soil Properties, Mineral Nutrition and Antioxidant Enzymes of Olive Plants under Treated Wastewater Irrigation. S. Afr. J. Bot. 2022, 148, 710–719. [Google Scholar] [CrossRef]
  67. Bottinelli, N.; Zhou, H.; Boivin, P.; Zhang, Z.B.; Jouquet, P.; Hartmann, C.; Peng, X. Macropores Generated during Shrinkage in Two Paddy Soils Using X-ray Micro-Computed Tomography. Geoderma 2016, 265, 78–86. [Google Scholar] [CrossRef]
  68. Xu, L.Y.; Wang, M.Y.; Shi, X.Z.; Yu, Q.B.; Shi, Y.J.; Xu, S.X.; Sun, W.X. Effect of Long-Term Organic Fertilization on the Soil Pore Characteristics of Greenhouse Vegetable Fields Converted from Rice-Wheat Rotation Fields. Sci. Total Environ. 2018, 631–632, 1243–1250. [Google Scholar] [CrossRef]
Figure 1. Illustrates the schematic diagram of the geographic location of the study region. The image on the left provides a broad overview of the study area’s location, while the image on the right offers a more detailed view.
Water 16 01307 g001
Figure 2. Single scan images of CT cross-sections with different treatments.
Water 16 01307 g002
Figure 3. Soil pore absolute permeability imaging image processing flow.
Water 16 01307 g003
Figure 4. Changing law of 2D pore size in different reclamation years and reclamation modes. Note: Different lowercase letters represent significant differences between the same pore sizes for different treatments (p < 0.05). (ad) are comparisons of different reclamation years and different modes, respectively.
Water 16 01307 g004
Figure 5. Changing the law of three-dimensional pore size in different reclamation years and reclamation modes. Note: Different lowercase letters represent significant differences between the same pore sizes for different treatments (p < 0.05). (ad) are comparisons of different reclamation years and different modes, respectively.
Water 16 01307 g005
Figure 6. Changing patterns of branch length and branch length under different reclamation years and reclamation modes. (ad) are comparisons of different reclamation years and different modes, respectively.
Water 16 01307 g006
Figure 7. Changing the law of pore rounding rate in different reclamation years and reclamation modes. Note: Different lowercase letters represent significant differences between the same pore sizes for different treatments (p < 0.05). (ad) are comparisons of different reclamation years and different modes, respectively.
Water 16 01307 g007
Figure 8. Three-dimensional diagram of soil column pore space under different reclamation years and reclamation modes. Note: Different pore colors represent different pore sizes. Dark blue: <1 mm, light blue: 1–2 mm, green: 2–3 mm, purple: 3–4 mm, red: 4–5 mm, yellow: >5 mm.
Water 16 01307 g008
Figure 9. Simulation flow diagram of pore connection group permeability. The unit of the permeability is μm2.
Water 16 01307 g009
Figure 10. Correlation analysis of soil pore parameters. Note: ***, ** and * represent 1%, 5% and 10% significance levels, respectively.
Water 16 01307 g010
Figure 11. Relationship between soil organic matter and soil porosity.
Water 16 01307 g011
Table 1. Soil bulk density (BD), soil organic matter (SOM), saturated hydraulic conductivity (Ks) and particle size distribution in the 0–30 cm soil layer for the four treatments.
TreatmentDepth
(cm)
BD
(g·cm−3)
SOM
(g·kg−1)
Ks
(mm·h−1)
Clay
(%)
Silt
(%)
Sand
(%)
RG2a0–101.169.21432.9214.3040.8343.07
10–201.0910.44213.1818.0947.8631.68
20–301.167.22313.2114.2952.4732.75
Average Value1.14 ± 0.04 c8.96 ± 1.62 ab319.77 ± 110.02 a15.56 ± 2.19 a47.05 ± 2.19 a35.83 ± 6.29 a
RG10a0–101.2318.57439.3720.58 46.2433.13
10–201.3111.31377.0021.03 51.7725.52
20–301.249.99727.1218.02 52.5728.16
Average Value1.26 ± 0.04 b13.29 ± 4.62 a514.50 ± 186.76 a19.88 ± 1.62 a50.19 ± 1.62 a28.94 ± 3.86 a
RW2a0–101.228.56409.8812.2142.7444.97
10–201.146.72291.809.7549.9940.22
20–301.244.42103.7119.5046.4833.80
Average Value1.20 ± 0.05 bc6.57 ± 2.07 b268.46 ± 154.41 a13.82 ± 5.07 a46.40 ± 5.07 a39.66 ± 5.61 a
RW10a0–101.469.06571.407.4049.4943.96
10–201.399.86161.9121.2250.9928.75
20–301.349.95195.6418.5048.4433.52
Average Value1.40 ± 0.06 a9.62 ± 0.49 ab309.65 ± 227.31 a15.71 ± 7.32 a49.64 ± 7.32 a35.41 ± 7.78 a
Note: a, b and c are significant differences among different treatments. The average value of each parameter is the average value in 0–30cm soil depth.
Table 2. Three-dimensional parameters of soil pore space under different reclamation years and reclamation modes.
TreatmentPorositySsaCurvatureConnectivityFD
RG2a-17.024.691.500.501.92
RG2a-23.623.591.480.391.96
RG2a-33.924.611.470.291.99
Average Value4.85 ± 1.884.30 ± 0.611.48 ± 0.020.39 ± 0.111.96 ± 0.04
RG10a-13.473.211.460.401.97
RG10a-27.583.901.500.571.99
RG10a-33.864.231.450.361.97
Average Value4.97 ± 2.273.78 ± 0.521.47 ± 0.030.44 ± 0.111.98 ± 0.01
RW2a-11.775.641.530.101.91
RW2a-29.104.281.500.631.97
RW2a-33.435.111.530.301.96
Average Value4.77 ± 3.845.01 ± 0.691.52 ± 0.020.34 ± 0.271.95 ± 0.03
RW10a-11.374.721.480.231.95
RW10a-25.613.551.520.501.94
RW10a-33.094.611.520.321.90
Average Value3.36 ± 2.134.29 ± 0.651.51 ± 0.020.35 ± 0.141.93 ± 0.03
Disclaimer/Publisher’s Note: The statements, opinions and data contained in all publications are solely those of the individual author(s) and contributor(s) and not of MDPI and/or the editor(s). MDPI and/or the editor(s) disclaim responsibility for any injury to people or property resulting from any ideas, methods, instructions or products referred to in the content.

