
Phase Transformation of Arsenic, Antimony and Lead in High-Grade Copper Matte Converting
1
Faculty of Metallurgical and Energy Engineering, Kunming University of Science and Technology, Kunming 650093, China
2
Yimen Copper Co., Ltd., Yuxi 651100, China
3
State Key Laboratory of Complex Nonferrous Metal Resources Clean Utilization, Kunming University of Science and Technology, Kunming 650093, China
*
Author to whom correspondence should be addressed.
Minerals 2024, 14(5), 499; https://doi.org/10.3390/min14050499
Submission received: 7 April 2024
/
Revised: 2 May 2024
/
Accepted: 7 May 2024
/
Published: 9 May 2024
(This article belongs to the Special Issue Advances in Pyrometallurgy of Minerals and Ores)
Abstract
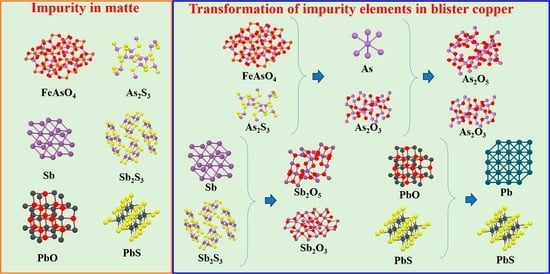
:The duration of the high-grade matte converting process is short, the amount of slag is small, and it is difficult for the original impurity removal operation in the low-grade matte converting process to meet the current production demand. Because the removal method for impurity elements during high-grade matte converting is unclear, the phase transformation of impurity elements during this process is investigated in this study. The results show that arsenic exists mainly in the form of FeAsO4 and As2O5, antimony in the form of Sb and Sb2O5, and lead in the form of PbS and PbO in high-grade matte. During the converting process, arsenic and antimony mainly exist in the melt in the form of oxides and gradually aggregate into large particles with increasing copper content in the melt. Lead exists in matte in the form of PbS until the end of the converting process, and PbS is not completely oxidized until the matte converted to blister copper phase. The phase transformation characteristics of copper, iron, sulfur and impurity elements in the process of high-grade matte converting were revealed. This study provides a theoretical reference for the formulation of an efficient impurity removal scheme for the converting process.
1. Introduction
P-S converters occupy a leading position in the matte converting industry, and are favored by many smelters because of their simple processing, mature technology and large production scale. Since its birth in 1905, this process has gradually been used around the world. The data show that 70% to 80% of the world’s converting process still uses a P-S converter, which is more convenient to operate, inexpensive, and shows its special advantages in dealing with self-produced matte and purchased scrap copper [1]. Therefore, P-S converting technology will continue to be used in the foreseeable future. At present, the P-S converting technology has been significantly improved in terms of the operation process, mechanical automation and environmental protection, but there are still some problems with this technology [2]. Due to the periodic intermittent operation of P-S converting, problems such as high heat loss, low sulfur recovery caused by large soot emissions and composition fluctuations, and SO2 low-altitude pollution caused by unsealed furnace bodies need to be improved and optimized [3,4].
With the progress of modern converting technology, the problems of mineral utilization, production efficiency, direct copper yield and low-altitude pollution have been solved to varying degrees in the matte smelting process [5,6,7,8,9]. To improve the efficiency of the copper pyrometallurgy process, the grade of the matte has also increased. It is difficult for the original low-grade matte converting technology to meet the requirement of removing impurities in the process of modern converting. This makes the impurities in the blister copper excessively high, seriously affecting subsequent pyrometallurgical refining and electrolytic refining [10].
In modern copper smelting, matte with a grade greater than 70% is generally called high-grade matte. The higher the grade of matte is, the lower the content of other elements such as iron and sulfur, and the reduction in the content of iron is accompanied by a reduction in the amount of slag in the converting process. The heat required for the converting process is provided by the oxidation exotherm of FeS, Cu2S and other sulfides. The improvement in the matte grade makes it difficult to meet the heat needs of the converting temperature in the oxidation reaction during the converting process, and additional coal injection is often needed to ensure the converting temperature [11,12]. With increasing maturity grade, less oxygen is needed, the time required for the entire converting process is reduced, the converting cycle is shortened, and the indicators that rely on the converting time in the original low-grade matte converting process, such as the copper content in slag and impurity removal, become difficult to determine [13,14].
The oxides of the impurity elements arsenic and antimony are difficult to react with quartz flux, and mainly rely on the volatilization of their monomers or low-valent oxides to remove them [15,16,17,18]. According to scholars, in the simulation of the distribution proportion of arsenic in the converting process, 77% of arsenic volatilizes into gas, but the factory production data are far from the difference, which is strongly related to the matte grade in the converting process [19,20]. The P-S converter selects quartz as the converting flux, which can enter a large amount of amorphous PbSiO3 produced by PbO slagging during the slagging period. However, it is difficult for quartz flux to remove the complex salt of lead, and the lead in the melt can form lead arsenic antimonate during the copper-making period and can form complex compounds with other oxides to remain in the blister copper. In the process of converter production, the removal rate of lead can reach approximately 87%, and the amount of lead converted into gas through volatilization is twice that removed from the slag [21,22]. When scholars studied the distribution of impurity elements in the converting process, it was found that the residual impurities in the blister copper products increased significantly with increasing matte grade because of the high copper content in the matte, the small blast volume of the matte, and the small amount of slag formed [23,24,25].
At present, research on impurity elements in the converting process has focused mainly on the direction and distribution of impurity elements, and the law of phase transformation of impurity elements remains to be studied. To master the method and principle of impurity removal in the P-S converting process, based on the detection results of matte impurity element content and phase characteristics, the distribution behavior of impurity elements in each phase was studied by analyzing the changes in impurity element content and phase characteristics in different stages of the converting process, and the phase transformation laws of arsenic, antimony and lead in the converting process were revealed. This study provides a theoretical reference for improving the removal efficiency of impurities in the P-S converting process.
2. Materials and Methods
2.1. Materials
The raw material used in this research was a high-grade matte produced by the bottom blow smelting furnace of a copper smelting plant. After the high-grade matte was broken, the sample was finely ground to less than 60 mesh using a vibrating mill. The chemical composition of the high-grade matte sample was analyzed by means of chemical composition analysis and inductively coupled plasma emission spectrometry (ICP-OES), and the results are listed in Table 1. The converting process used a ferrosilicon slag system. The content of SiO2 in quartz flux was more than 85%, the moisture content was less than 6%, the powder content was less than 5%, and the impurities were less than 3%. We added coal powder at the beginning of the converting to ensure the converting temperature. The proximate analysis of the coal powder is listed in Table 2.
The results of X-ray diffraction (XRD) analysis of the high-grade matte are shown in Figure 1. The main phases of high-grade matte are Cu2S and FeS, but compounds with low contents of As, Sb, Pb and other elements cannot be detected by XRD.
2.2. Research Methods
2.2.1. Experimental Methods
The operating system for high-grade matte converting is shown in Figure 2. In the process of high-grade matte converting, about 110 t matte was added to the converter in 3 batches during the feeding period. Before oxygen blowing, the first batch of 51 t included the 1, 2, and 3 packages of molten matte, and 8 t of the cold charge were added. During the whole converting process, 2 t coal powder were added three times through the tuyere to stabilize the converting temperature. After oxygen blowing for 35 min, the air flow was stopped, and the second batch 20 t of molten matte (package 4) and 6 t of the cold charge was added. The converter proceeds rotated to the converting position for oxygen blowing. The third batch is the fifth package 19 t of molten matte and 6 t of the cold charge. The feeding period lasted 100 min. Subsequently, the furnace continuous oxygen blowing and converting lasted 130 min until end. During the whole converting process, 1.7 t quartz flux was added into the furnace in 4 times. After the converting, the slag was released before the copper was released. 17 t converting slag and 75 t blister copper were produced.
A series of experiments were carried out in the process of converting high-grade matte. First, chemical phase analysis of the high-grade matte was performed. Then, the high-grade matte converting process was sampled according to the converting time. The sampling operation determined the sampling time point according to the oxygen converting time. Starting from the addition of molten matte into the converter, sampling was carried out every 30 min, and a total of 7 samples were obtained. The molten sample was obtained by inserting steel into the melt at the air inlet. The extracted sample was water-quenched to reduce the influence of the air composition on the sample.
2.2.2. Analytical Methods
The elemental content in the sample was detected by chemical analysis, and the phase in the raw material and each sample was analyzed by an X-ray diffractometer (Rigaku TTR III, Tokyo, Japan). The phase composition of the impurity elements in the matte was determined by chemical phase analysis. The migration and transformation of each element in the sample during the converting process were analyzed by scanning electron microscopy (CIQTEK SEM5000, Hefei, China) and an Energy Dispersive Spectrometer (EDS) (Oxford Xplore30, Shanghai, China).
3. Results and Discussion
3.1. Transformation of the Main Elements during Converting
The contents of Cu, Fe and S in samples 1–7 are listed in Table 3. Figure 3 shows changes in the Cu, Fe and S contents with the time during the converting process. After oxygenating for 95 min, all the molten matte was added to the converter melt, and the Cu content in the melt increased to 80.44%. The Cu content in the melt only increased 3.68% after continued to oxygenating for 60 min. When continuing oxygen blowing for 30 min, the Cu content in the melt rapidly increased to 97.38%. The Cu content increased from 97.38% to 98.86% in the last 30 min. Compared with the trend for copper, the S content decreased slowly in the slagging stage and rapidly decreased with an increasing Cu content after 160 min. When the Cu content reached more than 97.38%, the S content decreased below 0.02% until it reached 0%. After the first feeding, the Fe content was rapidly reduced by more than 50%, then the Fe content in the melt changed little within 120 min after converting, and the Fe content was again rapidly reduced to 0.3% in the last 30 min of converting.
Figure 4 shows the XRD pattern analysis of the sample taken according to the converting time in the production process of the P-S converter. The phase transformation with the converting time can be seen.
The temperature was maintained at around 1200 °C (±10 °C) during the converting process. Sample 1 was collected when air was blown. As shown in the figure, the diffraction peak of Cu2S in sample 1 was the strongest, and there was no phase of Cu2O or metallic copper, so the main component of the raw material used for converting was Cu2S. The phases of samples 2–5 in the melt were mainly the gradually decreasing Cu2S and increasing amounts of copper, which was due to reactions in the melt pool (Reaction (1)) and (Reaction (2)). The sampling time of sample 2 occurred before the fourth package was added, and the XRD pattern showed the presence of the Cu phase, indicating that copper formation reaction had occurred in the melt. It could be considered that there was no slagging stage period or copper formation period, with clear time boundaries in the process of high-grade matte conversion.
2/3Cu2S(l) + O2(g) = 2/3Cu2O(l) + 4/3SO2(g) ΔGθ = −699.29 + 0.1947T
Cu2S(l) + 2Cu2O(l) = 5Cu(l) + SO2(g) ΔGθ = 42.18 − 0.0542T
In the process of high-grade matte conversion, the iron was first oxidized to magnetic iron and floated to the surface of the melt, resulting in a rapid decrease in the content of Fe in the melt and Cu2S in the melt pool. After oxygenating for 100 min, the matte was added, and the Cu concentration in the melt reached 80.68%. After further converting, the melt was a mixture of Cu2S and Cu2O, and the proportion of Cu2S decreased with increasing converting time. After oxygenation for 60 min, a large amount of copper reacted, sulfur escaped as SO2, and the Cu grade in the melt began to increase rapidly. In the last 30 min, Cu2S was completely transformed into Cu, the grade reached more than 98.86%, the iron in the melt was greatly reduced, and the blister copper was stratified with the slag.
3.2. Transformation of Impurity Elements during Converting
3.2.1. The Form of Impurity Elements in the High-Grade Matte
Table 4 lists the chemical phase analysis results of the high-grade matte. Evidently, As is mainly in the form of As2S3 and FeAsO4. FeAsO4 is easily decomposed into Fe3O4 As2O3 andCO2 under converting conditions. There is also a small amount of As in the matte in the form of As2O3 and others. Sb mainly exists in the form of element Sb, Sb2O5 and Sb2O3 in the raw material, and a small part exists in the form of Sb2S3. Pb mainly exists in the form of PbS, PbO and element Pb in the raw materials, and a small part exists in the form of PbSiO3.
Figure 5a shows the microscopic morphology of sample 1 (high-grade matte) in the converting process at 2000× magnification, and Figure 5 shows the distribution of the elements around the impurity elements and the energy dispersive spectrometer analysis when the local area of the high-grade matte was amplified by 10,000× magnification. In the early stage of converting, the enrichment area of the impurity elements in the high-grade matte was relatively dispersed, the area was small, and the accumulation area of a few impurities was generally less than 3 μm. The analysis showed that most of the impurity elements in the high-grade matte were dispersed in the melt. The distribution of elements in the sample, combined with EDS analysis, showed that the main phase of the high-grade matte was Cu2S. In the copper-poor region, it is a substance or compound of impurity elements, including Fe, As, Sb and Pb. Table 4 lists that the content of FeAsO4 in matte was 0.086%. Due to the low content, the FeAsO4 phase may not be shown in Figure 5. In addition, the FeAsO4 may decompose into other phases. The impurities arsenic and antimony were enriched at the oxygen enrichment points, and their distribution in other areas was relatively dispersed, so the main phases of arsenic and antimony may be As2O3, Sb2O3, and small amounts of As2S3, Sb2S3, and Sb. The distribution of the impurities overlapped with that of sulfur, except for slight enrichment in the oxygen enrichment area. The main phases of lead are PbS and a small amount of PbO.
3.2.2. Impurity Element Content and Distribution in Melt
Table 5 and Figure 6 show the variation in the contents of the As, Sb and Pb as the converting process of high-grade matte conversion progressed. Before 100 min of converting, the content of arsenic in the melt slowly decreased with the converting time, and after 130 min of converting, the content of arsenic gradually increased until it reached the highest value before copper production. It was found that the arsenic phase FeAsO4 decompose and oxidized during the early stage of matte smelting, and some As2O3 volatilized into gas, while some As2O3 remained in the matte. As the sulfur in the melt was oxidized to SO2, the overall melt mass decreased, and the content of arsenic increased.
Before converting oxygen for 100 min, the content of Sb in the melt slowly decreased with increasing converting time. It can be seen from the continuous oxygen conversion that the antimony content in the melt gradually increased. However, after 160 min of oxygen conversion, the antimony content in the melt decreased with an increasing oxygen conversion time. In the last 30 min, the Sb content increased from 0.051% to 0.056%. The analysis showed that the elemental antimony in the matte was oxidized to Sb2O3 and volatilized to gas, which decreased the content of antimony in the melt with increasing converting time. As the sulfur in the melt was oxidized to SO2, the overall mass of the melt decreased, and the content of antimony increased. The oxygen potential of the melt increased with the continuous blowing of oxygen-enriched air during the conversion process. The increased oxygen potential led to antimony to be oxidized to Sb2O3 into the gas or into the slag as Sb2O5. In addition, a large amount of SO2 was produced during this period, which provides favorable volatilization conditions for Sb2O3. Before the end of the converting process, the Sb content increased slightly due to the change in melt quality.
Because the lead phase in high-grade matte mainly includes PbO and Pb, some lead volatilizes into the gas during the slagging period. The quartz flux added in the middle of the converting process reacts with PbO in the melt to form PbSiO3, which makes the lead content in the melt change little. When Cu2O is present at the end of the converting process, PbS is oxidized to form volatile PbO, which enters the gas with a large amount of escaped SO2. The lead content in the blister copper was 0.24%, which seriously affected the subsequent smelting.
Figure 7a shows the microscopic morphology of sample 4 (white matte) in the converting process at 4000× magnification, and Figure 7 shows the elemental distribution and energy dispersive spectrometer analysis of the impurities when the local area of the white matte was increased by 20,000× magnification. The main phase in the melt at the end of the slagging period of high-grade matte smelting was Cu2S. The impurity elements began to gradually accumulate in the form of oxides or compounds, and the elements Fe, As and Sb exhibited a relatively obvious aggregation phenomenon. There were impurity particles measuring approximately 5 μm, which were wrapped in the Cu2S phase. The distribution regions of the impurity elements As and Sb were consistent and overlapped with the oxygen-enriched regions, but the distribution of As was greatly affected by Si, while the element Sb was not. Therefore, arsenic may exist in the form of As2O3 or As2O5, and Sb may exist in the form of Sb2O3 or Sb2O5 or form complex compounds with other impurity elements. The distribution area of Pb in the white matte overlapped more with that of S and Cu and differed greatly from that of Si. It is speculated that Pb was not oxidized at the end of the slagging period and mainly existed in the Cu2S phase in the form of PbS. The impurity particles in the melt in the middle stage of converting were centered on SiO2, which was surrounded by oxides of Fe, As and Sb, while Pb was present in the Cu2S phase in the form of PbS.
Figure 8a shows the microscopic morphology of sample 6 (blister copper) in the converting process at 1000× magnification, and Figure 8 shows the distribution of elements around the impurity elements and energy dispersive spectrometer analysis when the local area of the blister copper was enlarged by 5000× magnification. The region denoted as point A is the Cu phase, point B is the matte phase, and point C is the impurity enrichment region. Before the end of the high-grade matte converting, the main phase of the product was element Cu, and the impurities As, Sb, and Pb and small amounts of Ni and Bi obviously aggregated. Most of the impurity particles were approximately 5 μm long, large particles with a radius of approximately 15 μm were also present, and impurity particles existed at the edge of the Cu2S phase. The analysis revealed that the impurities gradually increased in abundance in the matte, and with the gradual transformation of Cu2S to element Cu, the impurities gradually precipitated and increased in abundance. The distribution region of Pb overlapped with the distribution region of S and was not distributed in the Cu phase. It was presumed that Pb is not oxidized in matte at the end of copper converting and is not distributed in the Cu phase because PbS is oxidized after Cu2S, which may mainly exist in the form of PbS in matte and impurity particles. The distributions of the impurities As and Sb overlapped with the distribution of oxygen, and it is speculated that As and Sb may exist in the form of oxides in blister copper.
Table 6 lists the element contents of converting slag. According to the matte, converting slag quality, the quality of arsenic entering the slag phase was 1.85% of the total. The distribution ratio of lead in slag was 12.21%. Because the total amount of antimony in matte is low, antimony could not be detected in the slag.
3.2.3. Phase Transformation Mechanism of Impurity Elements
The phase transformation mechanism of the high-grade copper matte converting process into As is shown in Figure 9. According to the thermodynamic equation for Reaction (3), As in the form of FeAsO4 is decomposed into As2O3 during the process of converting. In addition, As in the form of element As and As2S3 can also be oxidized to As2O3 (Reactions (4) and (5)).
3FeAsO4(l) + 7/4C(s) = 3/2As2O3(g) + Fe3O4(l) + 7/4CO2(g) ΔGθ = 89.7 − 0.4945T
2/9As2S3(l) + O2(g) = 2/9As2O3(g) + 2/3SO2(g) ΔGθ = −2684.11 + 0.5542T
4/3As(l) + O2(g) = 2/3As2O3(g) ΔGθ = −1170.27 + 0.4461T
Comprehensive analysis showed that As2O3 can be partially volatilized to the gas phase, and some will remain in the melt. As2O3 in the melt is further oxidized to As2O5 (Reaction (6)) when the oxygen potential is high.
As2O3(g) + O2(g) = As2O5(l) ΔGθ = −230.52 + 0.268T
As2O5 is an acidic oxide that can combine with other basic oxides, such as CaO, to form a stable arsenate (Reaction (7)), which easily enters the slag phase.
As2O5(l) + 3CaO(l) = Ca3(AsO4)2(l) ΔGθ = −470.51 + 0.0054T
The phase transformation mechanism of the high-grade copper matte conversion process into Sb is shown in Figure 10. The antimony in the form of element Sb and Sb2S3 was oxidized to Sb2O3 (Reactions (8) and (9)) in the slagging period of converting, and Sb2O3 was volatile when heated.
![Minerals 14 00499 g010]()
Figure 10.
Migration and transformation of Sb during the process of conversion.

2/9Sb2S3(l) + O2(g) = 2/9Sb2O3(g) + 2/3SO2(g) ΔGθ = −2570.61 + 0.7201T
4/3Sb(l) + O2(g) = 2/3Sb2O3(g) ΔGθ = −1201.64 + 0.4352T
Some unvolatilized Sb2O3 can be oxidized to Sb2O5 (Reaction (10)) in regions with high oxygen potential.
Sb2O3(g) + O2(g) = Sb2O5(l) ΔGθ = −275.98 + 0.3154T
Sb2O5 is an acidic oxide that reacts with other basic oxides in the melt to form antimonate (Reaction (11)), which is stable, less dense, and easily enters the slag phase.
Sb2O5(l) + 3CaO(l) = Ca3(SbO4)2(l) ΔGθ = −277.27−0.1407T
The phase transformation mechanism of the high-grade copper matte for converting Pb is shown in Figure 11. Comprehensive analysis revealed that lead in the form of PbS is oxidized to PbO (Reaction (12)) at the end of copper production. Pb, PbS and PbO in the matte can be volatilized into gas under converting conditions.
2/3PbS(l)+ O2(g) = 2/3PbO(g) + 2/3SO2(g) ΔGθ = −824.01−0.1945T
Pb(l) + O2(g) = 2PbO(l) ΔGθ = −331.56 + 0.1407T
PbO reacts with PbS to form Pb (Reaction (14)); the density of Pb is greater than that of Cu; and PbS easily remains in the blister copper to form impurities.
2PbO(l) + PbS(l) = 3Pb(l) + SO2(g) ΔGθ = 207.83−0.4572T
During the whole converting process, the unvolatilized PbO reacts with SiO2 to form PbSiO3 (Reaction (15)), which is the reason why the use of ferrosilicon slag in the converting process more easily removes lead.
PbO(l) + SiO2(l) = PbSiO3(l) ΔGθ = −80.84 + 0.0852T
4. Conclusions
In this paper, the changes in element content and phase in the products at each stage of the blowing process were studied. Based on the experimental results, the slagging period and the copper-making period in the process of high-grade matte converting overlap in time. Arsenic in the form of FeAsO4 and As2S3 undergoes decomposed and oxidized reactions in the pre-converting stage. At the same stage, antimony in the form of Sb and Sb2S3 is oxidized to Sb2O3. In white matte, the elements As and Sb exist mainly in the form of oxides. Lead in the form of PbO leaves the melt by volatilization; in white matte it is in the form of PbS. As the converting proceeds, the impurities dispersed in the melt gradually congregate with the disappearance of the matte phase, forming particles in the blister copper phase. At the end of the converting process, the oxides of the elements As and Sb and the unoxidized PbS congregate to form complex compounds with other impurities in the blister copper. The content of Pb in the blister copper reaches 0.24 wt.%, which affects the subsequent smelting process.
Clarifying the transformation law of impurity elements in the process of converting is conducive to the targeted regulation of impurity elements, which is helpful for improving the quality of blister copper.
Author Contributions
Conceptualization, S.Z.; methodology, S.Z. and W.Q.; formal analysis, Y.W.; investigation, S.Z.; resources, B.L., Y.W. and Y.Y.; data curation, W.Q.; writing—original draft preparation, W.Q. and Y.Y.; writing—review and editing, S.Z.; visualization, W.Q.; supervision, Y.W.; project administration, W.Q.; funding acquisition, B.L. and Y.W. All authors have read and agreed to the published version of the manuscript.
Funding
This work was supported by Yunnan Fundamental Research Projects (Grant NO. 202401AT070339) and the Yunnan Province’s “Xingdian Talent Support Plan” for young talents (XDYC-QNRC-2022-0117).
Data Availability Statement
The data presented in this study are available on request from thecorresponding author. The data are not publicly available due to some information that couldcompromise the privacy of research participants.
Acknowledgments
Thanks for the great effort of the editors and reviewers.
Conflicts of Interest
Yingbao Yang is an employee of Yimen Copper Co., Ltd. The paper reflects the views of the scientists and not the company.
References
- Taskinen, P.; Akdogan, G.; Kojo, I.; Lahtinen, M.; Jokilaakso, A. Matte converting in copper smelting. Miner. Process. Extr. Metall. Trans. Inst. Min. Metall. 2019, 128, 58–73. [Google Scholar] [CrossRef]
- Liu, Z.; Xia, L. The practice of copper matte converting in China. Miner. Process. Extr. Metall. 2018, 128, 117–124. [Google Scholar] [CrossRef]
- Pérez, I.; Moreno-Ventas, I.; Ríos, G. Post-mortem study of magnesia-chromite refractory used in Peirce-Smith Converter for copper-making process, supported by thermochemical calculations. Ceram. Int. 2018, 44, 13476–13486. [Google Scholar] [CrossRef]
- Shishin, D.; Hidayat, T.; Decterov, S.; Jak, E. Thermodynamic modelling of liquid slag-matte-metal equilibria applied to the simulation of the Peirce-Smith converter. In Advances in Molten Slags, Fluxes, and Salts, Proceedings of the 10th International Conference on Molten Slags, Fluxes and Salts 2016; Springer International Publishing: Berlin/Heidelberg, Germany, 2016; pp. 1379–1388. [Google Scholar]
- Ahmed, H.; Ricardez-Sandoval, L.; Vilkko, M. Optimal Scheduling of the Peirce-Smith Converter in the Copper Smelting Process. Processes 2021, 9, 2004. [Google Scholar] [CrossRef]
- Filippou, D.; St-Germain, P.; Grammatikopoulos, T. Recovery of metal values from copper—Arsenic minerals and other related resources. Miner. Process. Extr. Metall. Rev. 2007, 28, 247–298. [Google Scholar] [CrossRef]
- Zhao, H.; Wang, J.; Liu, F.; Sohn, H.Y. Experimental Study on Bubble Distribution and Splashing in a Peirce-Smith Copper Converter. Metall. Mater. Trans. B 2021, 52, 440–450. [Google Scholar] [CrossRef]
- Kulczycka, J.; Lelek, Ł.; Lewandowska, A.; Wirth, H.; Bergesen, J.D. Environmental Impacts of Energy-Efficient Pyrometallurgical Copper Smelting Technologies: The Consequences of Technological Changes from 2010 to 2050. J. Ind. Ecol. 2016, 20, 304–316. [Google Scholar] [CrossRef]
- Yao, L.; Min, X.; Xu, H.; Ke, Y.; Wang, Y.; Lin, Z.; Liang, Y.; Liu, D.; Xu, Q.; He, Y. Physicochemical and environmental properties of arsenic sulfide sludge from copper and lead-zinc smelter. Trans. Nonferrous Met. Soc. China 2020, 30, 1943–1955. [Google Scholar] [CrossRef]
- Henao, H.; Moyano, A. Conversion of mattes with high grade of copper. In Proceedings of the 9th International Copper Conference, Kobe, Japan, 13–16 November 2016; pp. 901–908. [Google Scholar]
- Cardona, N.; MacKey, P.J.; Coursol, P.; Parada, R.; Parra, R.A. Optimizing Peirce-Smith converters using thermodynamic modeling and plant sampling. JOM 2012, 64, 546–550. [Google Scholar] [CrossRef]
- Wang, Z. Effect of Impurities Distribution on Matte Grade Change by Using Oxygen-riched Side Blowing Furnace. Non-Ferr. Min. Metall. 2018, 34, 2. [Google Scholar]
- Chen, C.; Zhang, J.; Bai, M.; Wei, S. Investigation on the Copper Content of Matte Smelting Slag in Peirce-Smith Converter. J. Univ. Sci. Technol. Beijing 2001, 8, 177–181. [Google Scholar]
- Wilkomirsky, I.; Parra, R.; Parada, F.; Balladares, E. Continuous Converting of Copper Matte to Blister Copper in a High-Intensity Molten-Layer Reactor. JOM 2014, 66, 1687–1693. [Google Scholar] [CrossRef]
- Wang, Q.; Guo, X.; Tian, Q.; Chen, M.; Zhao, B. Reaction Mechanism and Distribution Behavior of Arsenic in the Bottom Blown Copper Smelting Process. Metals 2017, 7, 302. [Google Scholar] [CrossRef]
- Sohn, H.S.; Fukunaka, Y.; Oishi, T.; Sohn, H.Y.; Asaki, Z. Kinetics of As, Sb, Bi and Pb volatilization from industrial copper matte during Ar + O2 bubbling. Metall. Mater. Trans. B Process Metall. Mater. Process. Sci. 2005, 35, 651–661. [Google Scholar] [CrossRef]
- Zhang, Z.; Yuan, L.; Huang, L.; Xu, Z. Trend and recovery of arsenic, antimony and bismuth in copper smelting. Nonferrous Met. Sci. Eng. 2019, 10, 13–19. [Google Scholar]
- Li, Q.; Li, B.; Yan, X.; Wang, Q.; Li, S.; Liu, H.; Liang, Y. A review of arsenic reaction behavior in copper smelting process and its disposal techniques. J. Cent. South Univ. 2023, 30, 2510–2541. [Google Scholar] [CrossRef]
- Guo, X.; Chen, Y.; Wang, Q.; Wang, S.; Tian, Q. Copper and arsenic substance flow analysis of pyrometallurgical process for copper production. Trans. Nonferrous Met. Soc. China 2022, 32, 364–376. [Google Scholar] [CrossRef]
- Wang, S. Arsenic Distribution Surveying in Copper Smelting Process of Jinlong Copper Co. Ltd. Nonferrous Met. Eng. 2016, 6, 3. [Google Scholar]
- Wang, E.; Shu, B.; Zhang, X.; Sheng, Q. Lead Occurrence State Change and Lead Removal Technical Discussion of High Lead Matte by P-S Converter in Blowing Process. Yunnan Metall. 2023, 52, 5. [Google Scholar]
- Hidayat, T.; Henao, H.M.; Hayes, P.C.; Jak, E. Phase equilibria studies of the Cu-Fe-O-Si system in equilibrium with air and with metallic copper. Metall. Mater. Trans. B Process Metall. Mater. Process. Sci. 2012, 43, 1034–1045. [Google Scholar] [CrossRef]
- Henao, H.; Kohnenkamp, E.; Rojas, L.; Moyano, A. Experimental Determination of the Effect of CaO and Al2O3 in Slag Systems Related to the Conversion Process of High Copper Matte Grade. Minerals 2019, 9, 716. [Google Scholar] [CrossRef]
- Wang, Y.; Tan, F.; Gao, L.; Zhou, X.; Shi, Z.; Li, N. Numerical simulation study on the effects of co-injection of pulverized coal and SPL (Spent Pot-Lining) into the blast furnace. Fuel 2023, 354, 129368. [Google Scholar] [CrossRef]
- Pérez, I.; Moreno-Ventas, I.; Ríos, G.; Bravo, T. Study of Industrial Copper Matte Converting Using Micrography and Thermochemical Calculations. Metall. Mater. Trans. B 2020, 51, 1432–1445. [Google Scholar] [CrossRef]
Figure 1.
XRD pattern of high-grade matte.

Figure 2.
Flow chart of the high-grade matte converting.

Figure 3.
Variation in the Cu, Fe and S contents during the converting process.

Figure 4.
XRD of time sampling during the converting process. (a) XRD of all samples. (b) XRD of sample 1. (c) XRD of sample 2. (d) XRD of sample 3. (e) XRD of sample 4. (f) XRD of sample 5.
Figure 4.
XRD of time sampling during the converting process. (a) XRD of all samples. (b) XRD of sample 1. (c) XRD of sample 2. (d) XRD of sample 3. (e) XRD of sample 4. (f) XRD of sample 5.

Figure 5.
SEM-EDS image of the impurity distribution in the high-grade matte. (a) the microscopic morphology of the high-grade matte at 2000× magnification. (b) the microscopic morphology of the high-grade matte at 10,000× magnification. (Spot A) the high-grade matte. (Spot B) Impurity enrichment region. (Spot C) Impurity enrichment region.

Figure 6.
Variation in the As, Sb and Pb content during the converting process.

Figure 7.
SEM-EDS image of the impurity distribution in the white matte. (a) The microscopic morphology of the white matte at 4000× magnification. (b) The microscopic morphology of the white matte at 20,000× magnification. (Spot A) the white matte. (Spot B) Impurity enrichment region. (Spot C) Impurity enrichment region.

Figure 8.
SEM-EDS image of the impurity distribution in the blister copper. (a) The microscopic morphology of the blister copper at 1000× magnification. (b) The microscopic morphology of the blister copper at 5000× magnification. (Spot A) the blister copper. (Spot B) the high-grade matte. (Spot C) impurity enrichment region.

Figure 9.
Migration and transformation of As during the process of conversion.

Figure 11.
Migration and transformation of Pb during the process of converting.


Table 1.
Chemical analysis of high-grade matte.
| Element | Cu | Fe | S | Pb | Zn | Ca | As | Si | Ni | Sb |
|---|---|---|---|---|---|---|---|---|---|---|
| Content (wt.%) | 72.22 | 3.72 | 18.38 | 1.38 | 0.39 | 0.28 | 0.25 | 0.2 | 0.18 | 0.07 |
Table 2.
Industrial analysis of carbon powder.
| Species | Mad | Aad | Vad | Fcad |
|---|---|---|---|---|
| Content (wt.%) | 0.48 | 15.53 | 8.68 | 75.31 |
Table 3.
Cu, Fe and S contents during the converting process.
| Element | Cu | S | Fe |
|---|---|---|---|
| Sample 1 | 72.22 | 18.38 | 3.72 |
| Sample 2 | 78.21 | 17.06 | 1.33 |
| Sample 3 | 80.44 | 16.16 | 1.20 |
| Sample 4 | 80.68 | 16.15 | 1.06 |
| Sample 5 | 84.12 | 13.13 | 1.10 |
| Sample 6 | 97.38 | 0.02 | 1.19 |
| Sample 7 | 98.86 | 0 | 0.30 |
Table 4.
Phase analysis of impurity elements in high-grade matte.
| Elements | Phase | Content/(wt.%) | Proportion |
|---|---|---|---|
| Arsenic | As2O3 | 0.003 | 1.28% |
| As2S3 | 0.160 | 64.00% | |
| FeAsO4 | 0.086 | 34.40% | |
| others | 0.001 | 0.40% | |
| Total | 0.250 | 100% | |
| Antimony | Sb2O3 | 0.008 | 11.11% |
| Sb | 0.044 | 61.11% | |
| Sb2S3 | 0.003 | 4.17% | |
| Sb2O5 | 0.017 | 23.61% | |
| Total | 0.072 | 100% | |
| Lead | Pb | 0.240 | 17.60% |
| PbS | 0.660 | 47.82% | |
| PbO | 0.370 | 26.85% | |
| PbSiO3 | 0.100 | 7.40% | |
| Total | 1.380 | 100% |
Table 5.
As, Sb and Pb contents during the conversion process.
| Element | As | Sb | Pb |
|---|---|---|---|
| Sample 1 | 0.250 | 0.072 | 1.380 |
| Sample 2 | 0.080 | 0.050 | 0.770 |
| Sample 3 | 0.050 | 0.020 | 0.400 |
| Sample 4 | 0.050 | 0.030 | 0.420 |
| Sample 5 | 0.100 | 0.070 | 0.440 |
| Sample 6 | 0.111 | 0.051 | 0.210 |
| Sample 7 | 0.113 | 0.056 | 0.240 |
Table 6.
Chemical analysis of converting slag.
| Element | Cu | Fe | S | Pb | Zn | As | SiO2 | Ni |
|---|---|---|---|---|---|---|---|---|
| Content (wt.%) | 16.16 | 38.22 | 0.21 | 1.09 | 1.06 | 0.03 | 18.65 | 0.11 |
Disclaimer/Publisher’s Note: The statements, opinions and data contained in all publications are solely those of the individual author(s) and contributor(s) and not of MDPI and/or the editor(s). MDPI and/or the editor(s) disclaim responsibility for any injury to people or property resulting from any ideas, methods, instructions or products referred to in the content. |
© 2024 by the authors. Licensee MDPI, Basel, Switzerland. This article is an open access article distributed under the terms and conditions of the Creative Commons Attribution (CC BY) license (https://creativecommons.org/licenses/by/4.0/).
Share and Cite
MDPI and ACS Style
Qu, W.; Yang, Y.; Zhou, S.; Wei, Y.; Li, B. Phase Transformation of Arsenic, Antimony and Lead in High-Grade Copper Matte Converting. Minerals 2024, 14, 499. https://doi.org/10.3390/min14050499
AMA Style
Qu W, Yang Y, Zhou S, Wei Y, Li B. Phase Transformation of Arsenic, Antimony and Lead in High-Grade Copper Matte Converting. Minerals. 2024; 14(5):499. https://doi.org/10.3390/min14050499
Chicago/Turabian StyleQu, Wenkai, Yingbao Yang, Shiwei Zhou, Yonggang Wei, and Bo Li. 2024. "Phase Transformation of Arsenic, Antimony and Lead in High-Grade Copper Matte Converting" Minerals 14, no. 5: 499. https://doi.org/10.3390/min14050499
Note that from the first issue of 2016, this journal uses article numbers instead of page numbers. See further details here.