
Ellipsoid Zone Integrity and Visual Function in Dry Age-Related Macular Degeneration
 ,
,  , , ,
, , ,
Abstract
:1. Introduction
2. Materials and Methods
3. Results
3.1. Clinical Characteristics
3.2. Function–Structure Association
3.3. Baseline EZ Integrity and Future Vision Loss
4. Discussion
Author Contributions
Funding
Institutional Review Board Statement
Informed Consent Statement
Data Availability Statement
Conflicts of Interest
References
- What Is Macular Degeneration?—American Academy of Ophthalmology. Available online: https://www.aao.org/eye-health/diseases/amd-macular-degeneration (accessed on 6 June 2022).
- Wong, W.L.; Su, X.; Li, X.; Cheung, C.M.G.; Klein, R.; Cheng, C.Y.; Wong, T.Y. Global prevalence of age-related macular degeneration and disease burden projection for 2020 and 2040: A systematic review and meta-analysis. Lancet Glob. Health 2014, 2, e106–e116. [Google Scholar] [CrossRef] [PubMed]
- Ferris, F.L.; Wilkinson, C.P.; Bird, A.; Chakravarthy, U.; Chew, E.; Csaky, K.; Sadda, S.R. Clinical Classification of Age-related Macular Degeneration. Ophthalmology 2013, 120, 844–851. [Google Scholar] [CrossRef] [PubMed]
- Fine, S.L.; Berger, J.W.; Maguire, M.G.; Ho, A.C. Age-Related Macular Degeneration. N. Engl. J. Med. 2000, 342, 483–492. [Google Scholar] [CrossRef] [PubMed]
- Holz, F.G.; Sadda, S.V.R.; Staurenghi, G.; Lindner, M.; Bird, A.C.; Blodi, B.A.; Bottoni, F.; Chakravarthy, U.; Chew, E.Y.; Csaky, K.; et al. Imaging Protocols in Clinical Studies in Advanced Age-Related Macular Degeneration: Recommendations from Classification of Atrophy Consensus Meetings. Ophthalmology 2017, 124, 464–478. [Google Scholar] [CrossRef]
- Fleckenstein, M.; Mitchell, P.; Freund, K.B.; Sadda, S.; Holz, F.G.; Brittain, C.; Henry, E.C.; Ferrara, D. The Progression of Geographic Atrophy Secondary to Age-Related Macular Degeneration. Ophthalmology 2018, 125, 369–390. [Google Scholar] [CrossRef] [PubMed]
- Wang, D.L.; Agee, J.; Mazzola, M.; Sacconi, R.; Querques, G.; Weinberg, A.D.; Smith, R.T. Outer Retinal Thickness and Fundus Autofluorescence in Geographic Atrophy. Ophthalmol. Retin. 2019, 3, 1035–1044. [Google Scholar] [CrossRef] [PubMed]
- Klein, R.; Klein, B.E.K.; Knudtson, M.D.; Meuer, S.M.; Swift, M.; Gangnon, R.E. Fifteen-Year Cumulative Incidence of Age-Related Macular Degeneration: The Beaver Dam Eye Study. Ophthalmology 2007, 114, 253–262. [Google Scholar] [CrossRef]
- Guymer, R.H.; Rosenfeld, P.J.; Curcio, C.A.; Holz, F.G.; Staurenghi, G.; Freund, K.B.; Schmitz-Valckenberg, S.; Sparrow, J.; Spaide, R.F.; Tufail, A.; et al. Incomplete Retinal Pigment Epithelial and Outer Retinal Atrophy in Age-Related Macular Degeneration: Classification of Atrophy Meeting Report 4. Ophthalmology 2020, 127, 394–409. [Google Scholar] [CrossRef] [PubMed]
- Sadda, S.R.; Guymer, R.; Holz, F.G.; Schmitz-Valckenberg, S.; Curcio, C.A.; Bird, A.C.; Blodi, B.A.; Bottoni, F.; Chakravarthy, U.; Chew, E.Y.; et al. Consensus Definition for Atrophy Associated with Age-Related Macular Degeneration on OCT: Classification of Atrophy Report 3. Ophthalmology 2018, 125, 537–548. [Google Scholar] [CrossRef]
- Liao, D.S.; Grossi, F.V.; El Mehdi, D.; Gerber, M.R.; Brown, D.M.; Heier, J.S.; Wykoff, C.C.; Singerman, L.J.; Abraham, P.; Grassmann, F.; et al. Complement C3 Inhibitor Pegcetacoplan for Geographic Atrophy Secondary to Age-Related Macular Degeneration: A Randomized Phase 2 Trial. Ophthalmology 2020, 127, 186–195. [Google Scholar] [CrossRef]
- Goldberg, R.; Heier, J.S.; Wykoff, C.C.; Staurenghi, G.; Singh, R.P.; Steinle, N.; Boyer, D.S.; Mones, J.; Holz, F.G.; Bliss, C.; et al. Efficacy of intravitreal pegcetacoplan in patients with geographic atrophy (GA): 12-month results from the phase 3 OAKS and DERBY studies. Investig. Ophthalmol. Vis. Sci. 2022, 63, 1500. [Google Scholar]
- Nittala, M.G.; Metlapally, R.; Ip, M.; Chakravarthy, U.; Holz, F.G.; Staurenghi, G.; Waheed, N.; Velaga, S.B.; Lindenberg, S.; Karamat, A.; et al. Association of Pegcetacoplan With Progression of Incomplete Retinal Pigment Epithelium and Outer Retinal Atrophy in Age-Related Macular Degeneration: A Post Hoc Analysis of the FILLY Randomized Clinical Trial. JAMA Ophthalmol. 2022, 140, 243–249. [Google Scholar] [CrossRef] [PubMed]
- FDA Approves SYFOVRETM (Pegcetacoplan Injection) as the First and Only Treatment for Geographic Atrophy (GA), a Leading Cause of Blindness—Apellis Pharmaceuticals, Inc. Available online: https://investors.apellis.com/news-releases/news-release-details/fda-approves-syfovretm-pegcetacoplan-injection-first-and-only (accessed on 26 March 2023).
- IVERIC Bio. Iveric Bio Receives U.S. FDA Approval for IZERVAY™ (Avacincaptad Pegol Intravitreal Solution), a New Treatment for Geographic Atrophy [Media Release]. Available online: https://www.astellas.com/en/news/28281 (accessed on 5 August 2023).
- IVERIC Bio. IZERVAY™ (Avacincaptad Pegol Intravitreal Solution): US Prescribing Information; IVERIC Bio.: Parsippany-Troy Hills, NJ, USA, 2023. [Google Scholar]
- Yang, J.; Xia, H.; Liu, Y.; Wang, X.; Yuan, H.; Hou, Q.; Ge, Y.; Ding, Y.; Wang, Y.; Wang, C.; et al. Ellipsoid Zone and External Limiting Membrane-Related Parameters on Spectral Domain-Optical Coherence Tomography and Their Relationships With Visual Prognosis After Successful Macular Hole Surgery. Front. Med. 2021, 8, 779602. [Google Scholar] [CrossRef] [PubMed]
- Sharef, N.; Kassem, R.; Hecht, I.; Bar, A.; Maharshak, I.; Burgansky-Eliash, Z.; Weinberger, Y.; Tuuminen, R.; Achiron, A. Interdigitation and Ellipsoid Zones Disruption Correlate with Visual Outcomes among Treatment-Naive Patients with Diabetic Macular Edema. Ophthalmic Res. 2021, 64, 476–482. [Google Scholar] [CrossRef] [PubMed]
- Kim, Y.M.; Kim, J.H.; Koh, H.J. Improvement of photoreceptor integrity and associated visual outcome in neovascular age-related macular degeneration. Am. J. Ophthalmol. 2012, 154, 164–173.e161. [Google Scholar] [CrossRef] [PubMed]
- Ehlers, J.P.; Zahid, R.; Kaiser, P.K.; Heier, J.S.; Brown, D.M.; Meng, X.; Reese, J.; Le, T.K.; Lunasco, L.; Hu, M.; et al. Longitudinal Assessment of Ellipsoid Zone Integrity, Subretinal Hyperreflective Material, and Subretinal Pigment Epithelium Disease in Neovascular Age-Related Macular Degeneration. Ophthalmol. Retin. 2021, 5, 1204–1213. [Google Scholar] [CrossRef] [PubMed]
- Sevgi, D.D.; Yee, P.S.; Srivastava, S.K.; Le, T.K.; Abraham, J.R.; Reese, J.; Ehlers, J.P. Longitudinal Ellipsoid Zone Dynamics after Macular Hole Repair in the Discover Study: Structure-Function Assessment. Retina 2021, 41, 915–920. [Google Scholar] [CrossRef] [PubMed]
- Ehlers, J.P.; Uchida, A.; Hu, M.; Figueiredo, N.; Kaiser, P.K.; Heier, J.S.; Brown, D.M.; Boyer, D.S.; Do, D.V.; Gibson, A.; et al. Higher-Order Assessment of OCT in Diabetic Macular Edema from the VISTA Study: Ellipsoid Zone Dynamics and the Retinal Fluid Index. Ophthalmol. Retin. 2019, 3, 1056–1066. [Google Scholar] [CrossRef] [PubMed]
- Tsai, M.J.; Cheng, C.K. Patterns of ellipsoid zone change associated with visual outcome for diabetic macular oedema. Clin. Exp. Optom. 2022, 105, 48–54. [Google Scholar] [CrossRef]
- Kessler, L.J.; Auffarth, G.U.; Bagautdinov, D.; Khoramnia, R. Ellipsoid Zone Integrity and Visual Acuity Changes during Diabetic Macular Edema Therapy: A Longitudinal Study. J. Diabetes Res. 2021, 2021, 8117650. [Google Scholar] [CrossRef]
- Chan, E.W.; Eldeeb, M.; Sun, V.; Thomas, D.; Omar, A.; Kapusta, M.A.; Galic, I.J.; Chen, J.C. Disorganization of Retinal Inner Layers and Ellipsoid Zone Disruption Predict Visual Outcomes in Central Retinal Vein Occlusion. Ophthalmol. Retin. 2019, 3, 83–92. [Google Scholar] [CrossRef] [PubMed]
- Abraham, J.R.; Boss, J.; Babiuch, A.S.; Singh, R.P.; Srivastava, S.; Reese, J.; Ehlers, J.P. Longitudinal Assessment of Ellipsoid Zone Mapping Parameters in Retinal Venous Occlusive Disease With Associated Macular Edema. J. Vitr. Dis. 2021, 5, 40–45. [Google Scholar] [CrossRef] [PubMed]
- Tao, L.W.; Wu, Z.; Guymer, R.H.; Luu, C.D. Ellipsoid zone on optical coherence tomography: A review. Clin. Exp. Ophthalmol. 2016, 44, 422–430. [Google Scholar] [CrossRef] [PubMed]
- Pappuru, R.R.; Ouyang, Y.; Nittala, M.G.; Hemmati, H.D.; Keane, P.A.; Walsh, A.C.; Sadda, S.R. Relationship between outer retinal thickness substructures and visual acuity in eyes with dry age-related macular degeneration. Investig. Ophthalmol. Vis. Sci. 2011, 52, 6743–6748. [Google Scholar] [CrossRef] [PubMed]
- Sarici, K.; Abraham, J.R.; Sevgi, D.D.; Lunasco, L.; Srivastava, S.K.; Whitney, J.; Cetin, H.; Hanumanthu, A.; Bell, J.M.; Reese, J.L.; et al. Risk Classification for Progression to Subfoveal Geographic Atrophy in Dry Age-Related Macular Degeneration Using Machine Learning–Enabled Outer Retinal Feature Extraction. Ophthalmic Surg. Lasers Imaging Retin. 2022, 53, 31–39. [Google Scholar] [CrossRef] [PubMed]
- Ehlers, J.P.; Clark, J.; Uchida, A.; Figueiredo, N.; Babiuch, A.; Talcott, K.E.; Lunasco, L.; Le, T.K.; Meng, X.; Hu, M.; et al. Longitudinal higher-order oct assessment of quantitative fluid dynamics and the total retinal fluid index in neovascular amd. Transl. Vis. Sci. Technol. 2021, 10, 29. [Google Scholar] [CrossRef] [PubMed]
- Hood, D.C.; Zhang, X.; Ramachandran, R.; Talamini, C.L.; Raza, A.; Greenberg, J.P.; Sherman, J.; Tsang, S.H.; Birch, D.G. The Inner Segment/Outer Segment Border Seen on Optical Coherence Tomography Is Less Intense in Patients with Diminished Cone Function. Investig. Opthalmol. Vis. Sci. 2011, 52, 9703. [Google Scholar] [CrossRef] [PubMed]
- Sundaram, V.; Wilde, C.; Aboshiha, J.; Cowing, J.; Han, C.; Langlo, C.S.; Chana, R.; Davidson, A.E.; Sergouniotis, P.I.; Bainbridge, J.W.; et al. Retinal Structure and Function in Achromatopsia. Ophthalmology 2014, 121, 234–245. [Google Scholar] [CrossRef] [PubMed]
- Ota, M.; Tsujikawa, A.; Murakami, T.; Yamaike, N.; Sakamoto, A.; Kotera, Y.; Miyamoto, K.; Kita, M.; Yoshimura, N. Foveal Photoreceptor Layer in Eyes with Persistent Cystoid Macular Edema Associated with Branch Retinal Vein Occlusion. Am. J. Ophthalmol. 2008, 145, 273–280.e271. [Google Scholar] [CrossRef]
- Aizawa, S.; Mitamura, Y.; Baba, T.; Hagiwara, A.; Ogata, K.; Yamamoto, S. Correlation between visual function and photoreceptor inner/outer segment junction in patients with retinitis pigmentosa. Eye 2009, 23, 304–308. [Google Scholar] [CrossRef]
- Mitamura, Y.; Aizawa, S.; Baba, T.; Hagiwara, A.; Yamamoto, S. Correlation between retinal sensitivity and photoreceptor inner/outer segment junction in patients with retinitis pigmentosa. Br. J. Ophthalmol. 2009, 93, 126–127. [Google Scholar] [CrossRef] [PubMed]
- Baba, T.; Yamamoto, S.; Arai, M.; Arai, E.; Sugawara, T.; Mitamura, Y.; Mizunoya, S. Correlation of visual recovery and presence of photoreceptor inner/outer segment junction in optical coherence images after successful macular hole repair. Retina 2008, 28, 453–458. [Google Scholar] [CrossRef] [PubMed]
- Spaide, R.F.; Koizumi, H.; Freund, K.B. Photoreceptor Outer Segment Abnormalities as a Cause of Blind Spot Enlargement in Acute Zonal Occult Outer Retinopathy–Complex Diseases. Am. J. Ophthalmol. 2008, 146, 111–120. [Google Scholar] [CrossRef] [PubMed]
- Wu, Z.; Ayton, L.N.; Guymer, R.H.; Luu, C.D. Second Reflective Band Intensity in Age-related Macular Degeneration. Ophthalmology 2013, 120, 1307–1308.e1301. [Google Scholar] [CrossRef]
- Pilotto, E.; Benetti, E.; Convento, E.; Guidolin, F.; Longhin, E.; Parrozzani, R.; Midena, E. Microperimetry, fundus autofluorescence, and retinal layer changes in progressing geographic atrophy. Can. J. Ophthalmol. 2013, 48, 386–393. [Google Scholar] [CrossRef] [PubMed]
- Litts, K.M.; Zhang, Y.; Freund, K.B.; Curcio, C.A. Optical coherence tomography and histology of age-related macular degeneration support mitochondria as reflectivity sources. Retina 2018, 38, 445–461. [Google Scholar] [CrossRef] [PubMed]
- Jaiswal, M.; Haelterman, N.A.; Sandoval, H.; Xiong, B.; Donti, T.; Kalsotra, A.; Yamamoto, S.; Cooper, T.A.; Graham, B.H.; Bellen, H.J. Impaired Mitochondrial Energy Production Causes Light-Induced Photoreceptor Degeneration Independent of Oxidative Stress. PLOS Biol. 2015, 13, e1002197. [Google Scholar] [CrossRef] [PubMed]
- Hoang, Q.V.; Linsenmeier, R.A.; Chung, C.K.; Curcio, C.A. Photoreceptor inner segments in monkey and human retina: Mitochondrial density, optics, and regional variation. Vis. Neurosci. 2002, 19, 395–407. [Google Scholar] [CrossRef] [PubMed]
- Ammar, M.J.; Hsu, J.; Chiang, A.; Ho, A.C.; Regillo, C.D. Age-related macular degeneration therapy: A review. Curr. Opin. Ophthalmol. 2020, 31, 215–221. [Google Scholar] [CrossRef]
- Stealth BioTherapeutics Announces Data from Phase 2 Study of Geographic Atrophy Candidate. Available online: https://www.ophthalmologytimes.com/view/stealth-biotherapeutics-announces-data-from-phase-2-study-of-geographic-atrophy-candidate (accessed on 11 June 2022).
- Abraham, J.R.; Jaffe, G.J.; Kaiser, P.K.; Chiu, S.J.; Loo, J.; Farsiu, S.; Bouckaert, L.; Karageozian, V.; Sarayba, M.; Srivastava, S.K.; et al. Impact of Baseline Quantitative OCT Features on Response to Risuteganib for the Treatment of Dry Age-Related Macular Degeneration. Ophthalmol. Retin. 2022, 6, 1019–1027. [Google Scholar] [CrossRef]
- Riedl, S.; Vogl, W.D.; Mai, J.; Reiter, G.S.; Lachinov, D.; Grechenig, C.; McKeown, A.; Scheibler, L.; Bogunović, H.; Schmidt-Erfurth, U. The Effect of Pegcetacoplan Treatment on Photoreceptor Maintenance in Geographic Atrophy Monitored by Artificial Intelligence-Based OCT Analysis. Ophthalmol. Retin. 2022, 6, 1009–1018. [Google Scholar] [CrossRef] [PubMed]


| All Eyes | Eyes with Foveal GA | Eyes with No GA | ||||||||
|---|---|---|---|---|---|---|---|---|---|---|
| Parameter | Region | BCVA ≥20/25 (n = 57) | BCVA ≤20/40 (n = 37) | p Value | BCVA ≥20/25 (n = 6) | BCVA ≤20/40 (n = 21) | p Value | BCVA ≥20/25 (n = 49) | BCVA ≤20/40 (n = 13) | p Value |
| Partial EZ attenuation (%) | Central subfield | 21.5 | 64.2 | *** | 47.1 | 75.6 | *** | 18.1 | 46.2 | *** |
| Central macular | 18.5 | 56.4 | *** | 47.2 | 70.5 | ** | 14.8 | 31.2 | * | |
| Panmacular | 5.4 | 15.7 | *** | 13.7 | 19.6 | ** | 4.0 | 6.2 | ns | |
| Total EZ attenuation (%) | Central subfield | 14.6 | 55.6 | *** | 30.5 | 67.0 | *** | 12.6 | 36.2 | ** |
| Central macular | 12.8 | 45.2 | *** | 33.7 | 58.3 | *** | 10.1 | 21.0 | ns | |
| Panmacular | 3.0 | 10.2 | *** | 8.3 | 12.6 | * | 2.2 | 3.6 | ns | |
| EZ-RPE thickness (µm) | Central subfield | 30.9 | 12.6 | *** | 20.6 | 8.5 | *** | 32.2 | 20.1 | *** |
| Central macular | 30.4 | 15.4 | *** | 19.8 | 10.6 | ** | 31.8 | 24.5 | ** | |
| EZ-RPE volume (mm3) | Panmacular | 1.238 | 1.084 | *** | 1.151 | 1.029 | ** | 1.250 | 1.213 | ns |
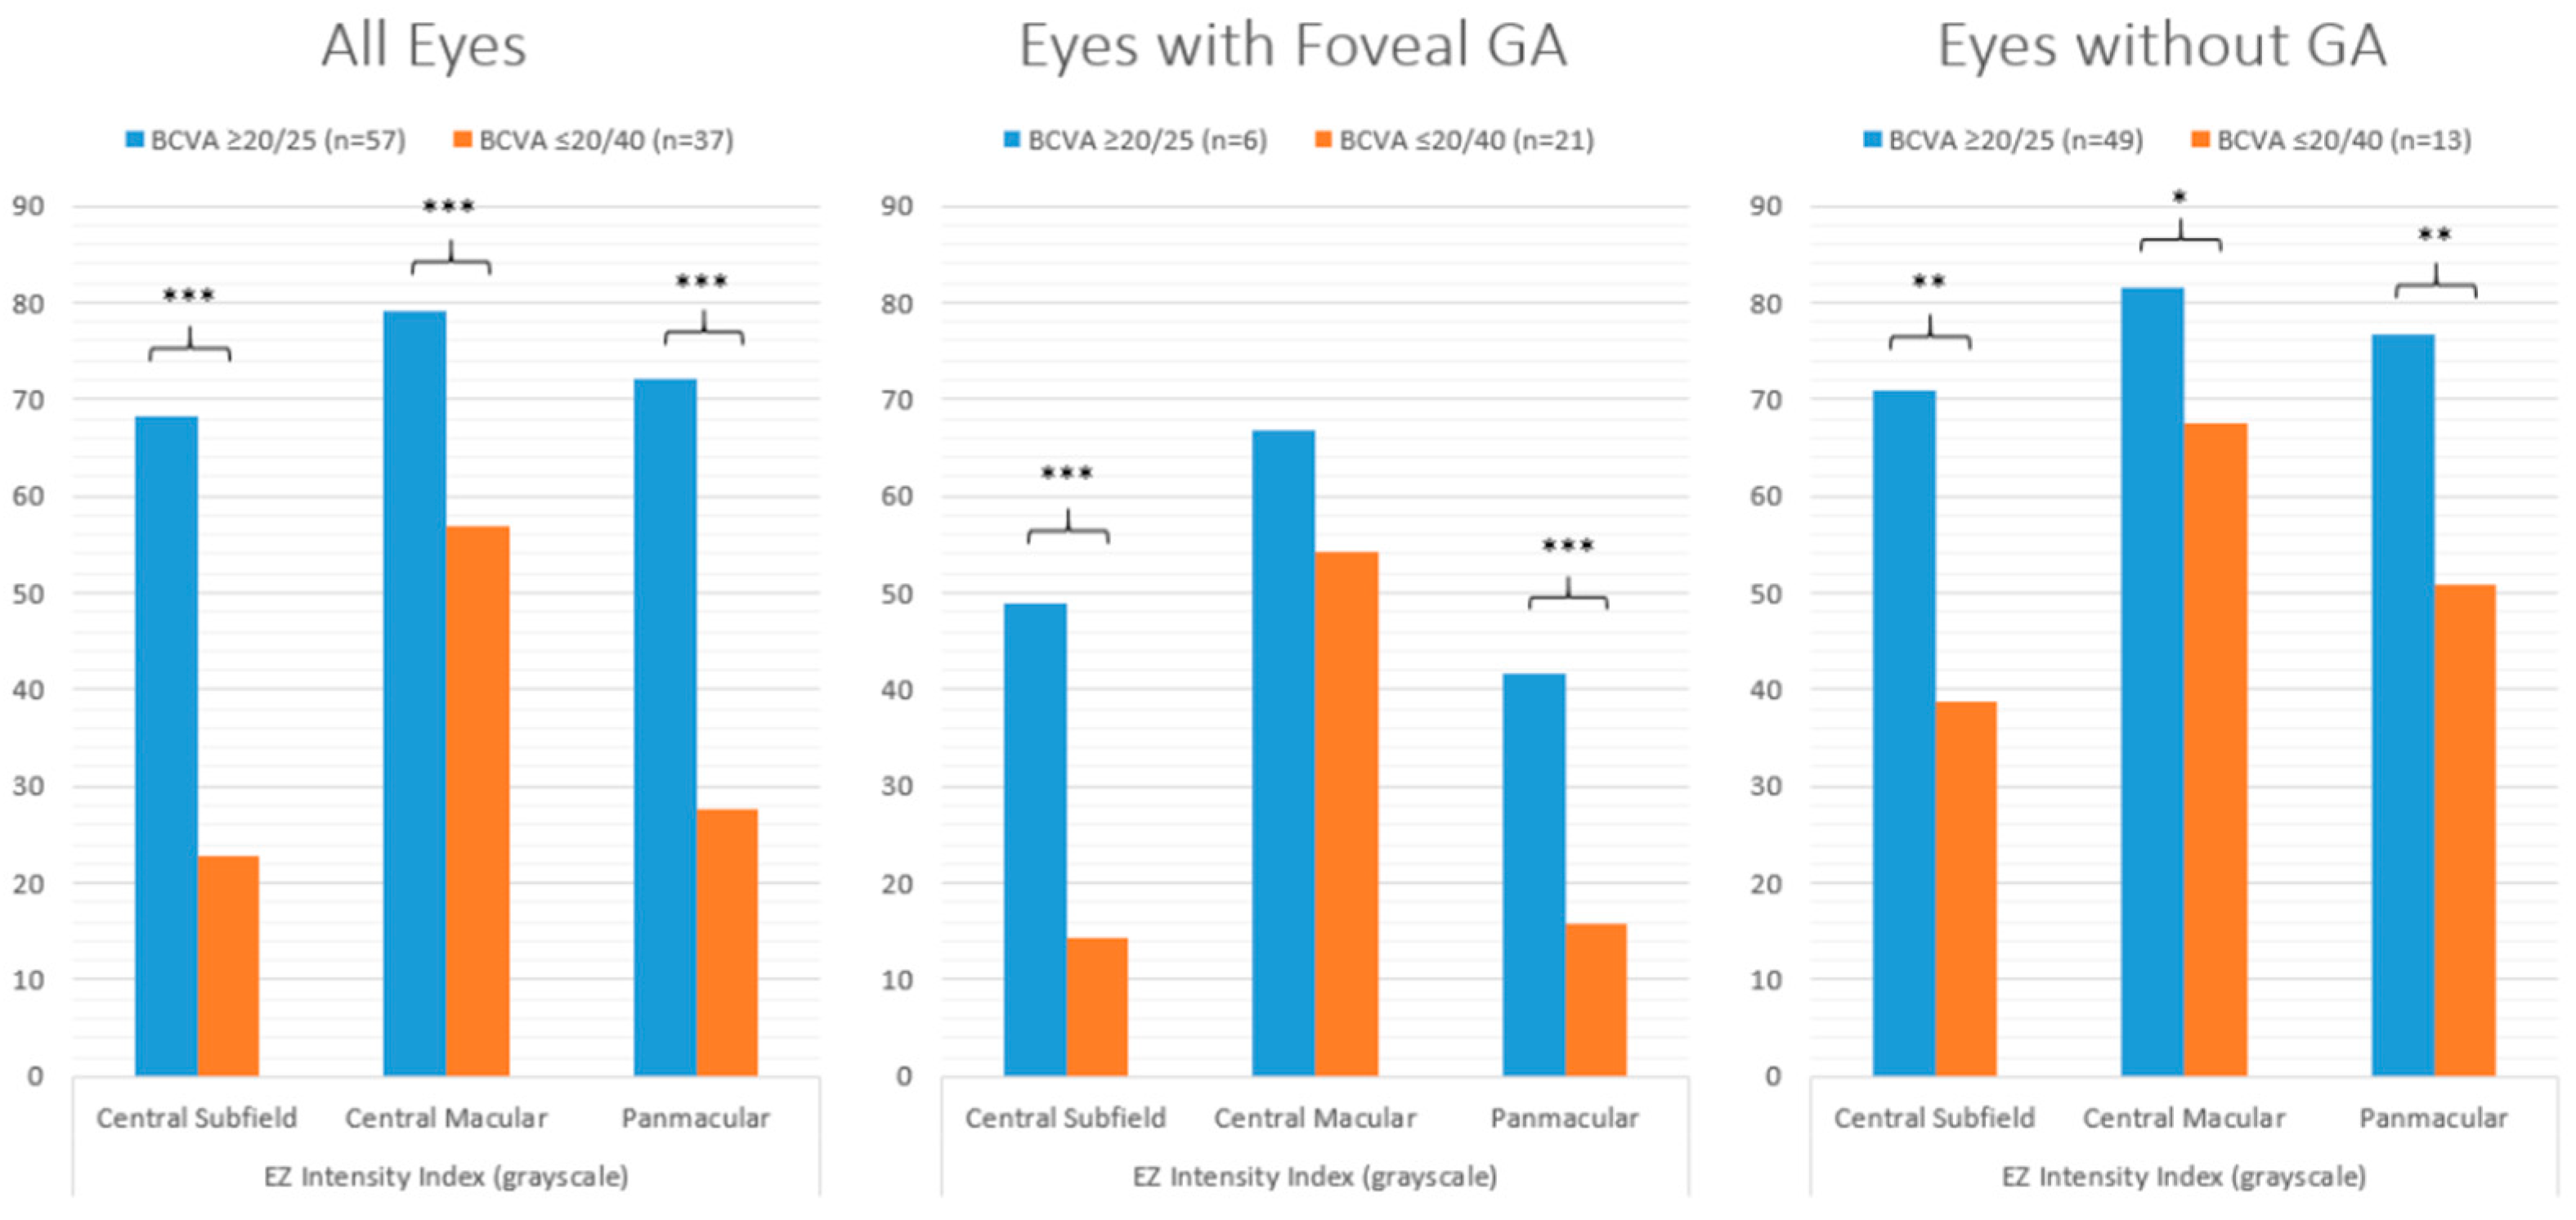
| EZ intensity index (grayscale) | Central subfield | 68.2 | 22.7 | *** | 48.9 | 14.4 | *** | 70.9 | 38.8 | ** |
| Central macular | 79.1 | 56.9 | *** | 66.9 | 54.3 | ns | 81.5 | 67.6 | * | |
| Panmacular | 72.2 | 27.7 | *** | 41.6 | 15.7 | *** | 76.6 | 50.8 | ** | |
| Parameter | Region | All Eyes | Eyes with Foveal GA | Eyes with No GA |
|---|---|---|---|---|
| Partial EZ attenuation (%) | Central subfield | −0.50 | −0.45 | −0.28 |
| Central macular | −0.53 | −0.49 | −0.21 | |
| Panmacular | −0.43 | −0.30 | −0.14 | |
| Total EZ attenuation (%) | Central subfield | −0.50 | −0.49 | −0.24 |
| Mid-subfield | −0.52 | −0.54 | −0.15 | |
| Panmacular | −0.46 | −0.34 | −0.12 | |
| EZ-RPE thickness (µm) | Central subfield | 0.53 | 0.46 | 0.30 |
| Central macular | 0.55 | 0.52 | 0.26 | |
| EZ-RPE volume (mm3) | Panmacular | 0.42 | 0.34 | 0.12 |
| EZ intensity index (grayscale) | Central subfield | 0.52 | 0.49 | 0.30 |
| Central macular | 0.47 | 0.37 | 0.27 | |
| Panmacular | 0.54 | 0.53 | 0.26 | |
 | ||||
| Year 0 Parameter | Region | ≥2-Line Group (n = 25) | ≤1-Line Group (n = 79) | p Value |
|---|---|---|---|---|
| Partial EZ attenuation (%) | Central subfield | 39.9 | 10.7 | ≤0.001 |
| Central macular | 31.6 | 7.8 | ≤0.001 | |
| Panmacular | 5.5 | 1.9 | ≤0.001 | |
| Total EZ attenuation (%) | Central subfield | 27.5 | 5.7 | ≤0.001 |
| Central macular | 20.9 | 4.0 | ≤0.001 | |
| Panmacular | 3.1 | 0.8 | ≤0.001 | |
| EZ-RPE thickness (µm) | Central subfield | 22.8 | 34.5 | ≤0.001 |
| Central macular | 25.2 | 34.0 | ≤0.001 | |
| EZ-RPE volume (mm3) | Panmacular | 1.228 | 1.294 | ≤0.01 |
| EZ intensity index (grayscale) | Central subfield | 55.5 | 81.8 | ≤0.001 |
| Central macular | 76.2 | 88.4 | ≤0.05 | |
| Panmacular | 61.8 | 88.0 | ≤0.001 |
| Year 0 Parameter | Region | Worsened (n = 16) | Stable/Improved (n = 50) | p Value |
|---|---|---|---|---|
| Partial EZ attenuation (%) | Central subfield | 33.6 | 5.6 | ≤0.001 |
| Central macular | 27.4 | 4.8 | ≤0.001 | |
| Panmacular | 5.1 | 1.5 | ≤0.001 | |
| Total EZ attenuation (%) | Central subfield | 20.7 | 2.3 | ≤0.001 |
| Central macular | 16.4 | 2.2 | ≤0.001 | |
| Panmacular | 2.6 | 0.6 | ≤0.001 | |
| EZ-RPE thickness (µm) | Central subfield | 26.1 | 36.5 | ≤0.001 |
| Central macular | 27.1 | 35.0 | ≤0.001 | |
| EZ-RPE volume (mm3) | Panmacular | 1.240 | 1.294 | ≤0.05 |
| EZ intensity index (grayscale) | Central subfield | 63.8 | 88.2 | ≤0.001 |
| Central macular | 76.7 | 91.5 | ≤0.05 | |
| Panmacular | 67.5 | 93.1 | ≤0.001 |
Disclaimer/Publisher’s Note: The statements, opinions and data contained in all publications are solely those of the individual author(s) and contributor(s) and not of MDPI and/or the editor(s). MDPI and/or the editor(s) disclaim responsibility for any injury to people or property resulting from any ideas, methods, instructions or products referred to in the content. |
© 2024 by the authors. Licensee MDPI, Basel, Switzerland. This article is an open access article distributed under the terms and conditions of the Creative Commons Attribution (CC BY) license (https://creativecommons.org/licenses/by/4.0/).
Share and Cite
Yordi, S.; Cakir, Y.; Kalra, G.; Cetin, H.; Hu, M.; Abraham, J.; Reese, J.; Srivastava, S.K.; Ehlers, J.P. Ellipsoid Zone Integrity and Visual Function in Dry Age-Related Macular Degeneration. J. Pers. Med. 2024, 14, 543. https://doi.org/10.3390/jpm14050543
Yordi S, Cakir Y, Kalra G, Cetin H, Hu M, Abraham J, Reese J, Srivastava SK, Ehlers JP. Ellipsoid Zone Integrity and Visual Function in Dry Age-Related Macular Degeneration. Journal of Personalized Medicine. 2024; 14(5):543. https://doi.org/10.3390/jpm14050543
Chicago/Turabian StyleYordi, Sari, Yavuz Cakir, Gagan Kalra, Hasan Cetin, Ming Hu, Joseph Abraham, Jamie Reese, Sunil K. Srivastava, and Justis P. Ehlers. 2024. "Ellipsoid Zone Integrity and Visual Function in Dry Age-Related Macular Degeneration" Journal of Personalized Medicine 14, no. 5: 543. https://doi.org/10.3390/jpm14050543